

Political scientists have long debated questions about where the discipline stands and where it should be going (e.g., Gunnell Reference Gunnell2015; Munck and Snyder Reference Munck and Snyder2007). Are we asking the right questions? Are we using appropriate theoretical frameworks and methods? Disagreement over answers to these questions occasionally sparks discipline-wide reform movements. For example, perceived methodological orthodoxy and elitism helped fuel the Perestroika movement in the early 2000s, which called for greater disciplinary pluralism (Monroe Reference Monroe2015). However, how we research and what we study are products not only of our normative commitments or preferences but also of structural forces that shape the discipline.
The academic market provides only 600–700 tenure-track positions annually,Footnote 1 yet U.S. institutions produced 989 new political science and public policy PhDs in 2024 alone, according to the Survey of Earned Doctorates. Metric-based evaluation—including publication counts, citations, and h-indices—now drives hiring, tenure, and funding decisions (Norris Reference Norris2021). Thus, individual survival within this system may potentially conflict with the commitment to methodological pluralism or intellectual diversity. How have competitive pressures reshaped scholarly production in political science? Does collaboration increase or does specialization narrow the scope of the discipline? Do top-tier journals diverge from the broader field? Do younger scholars adapt differently from how their predecessors did? Has the discipline maintained topical diversity despite competitive pressures?
This article aims to answer these questions. In so doing, we follow previous efforts to assess the state of the disciplinary landscape amid changing conditions (Clark and Golder Reference Clark and Golder2015; Fisher et al. Reference Fisher, Cobane, Vander Ven and Cullen1998; Goodin and Klingemann Reference Goodin and Klingemann1998; Sigelman Reference Sigelman2006; Wilson Reference Wilson2017). We analyze more than 140,000 articles from 174 journals classified as “political science” by Clarivate’s Social Sciences Index spanning two decades (2003–23), complemented by metadata on books and book chapters. This comprehensive dataset allows us to move beyond the handful of elite outlets that previous studies typically examined. We build on bibliometric methods (e.g., Zhu and Cheng Reference Zhu, Edmund and Cheng2024) and text-as-data innovations to classify this corpus by research topics, identify methodological approaches, and trace collaboration patterns and citation outcomes. We examine how structural pressures relate to scholarly production in terms of volume, collaboration patterns, topical diversity and novelty, and methodology choices.
We find that publication volume nearly tripled from 2003 to 2023, an expected response to mounting competitive pressures. In addition, collaboration became the dominant mode of knowledge production (Metz and Jäckle Reference Metz and Jäckle2017), with the majority of papers coauthored since 2021—an adaptive response mirroring trends across scientific disciplines (Wang and Barabási Reference Wang and Barabási2021). In addition, political scientists’ use of quantitative methods has been converging, particularly in top-tier journals where such articles now comprise more than 85% of publications, up from 70% in 2003.
Other findings challenge the conventional wisdom of what increased pressure should mean for political science. Yes, the discipline has expanded dramatically, but we find that this growth stems only partly from researchers becoming more productive: the average individual output increased only slightly from 1.18 to 1.28 papers annually. Instead, the expansion comes mainly from an influx of new contributors—more than three thousand annually—a majority of whom publish only once in the discipline’s mainstream journals. This churn in the flow, rather than sustained productivity gains in the stock of researchers, drives much of the disciplinary growth. Moreover, we do not find evidence that collaboration enhances productivity: teams and individuals produce similar output.
However, we also find evidence that, among survivors in the discipline—those who managed to publish consistently over a period of 10 years—younger cohorts do produce more articles, both in and outside the discipline. At the same time, these young authors produce fewer books and book chapters, suggesting that their increased article productivity comes at the expense of book-oriented publishing. Collectively, these patterns point to researchers adapting across multiple dimensions. These changes do not always translate into more productivity but rather help researchers survive in an increasingly competitive landscape.
Additionally, we examine how competitive pressures shape the substantive content of researchers’ work. We find that the field has retained broad topical diversity. These findings run counter to concerns about substantive homogenization (Gunnell Reference Gunnell2015; Luke and McGovern Reference Luke and McGovern2010). Yet, we also find a growing bifurcation: top-tier journals diverge from the broader discipline in both methodological and substantive orientation. They are significantly more quantitatively oriented and focused on a narrower set of topics, such as conflict and public opinion. In contrast, the rest of the field is more qualitative and devotes greater attention to topics such as social movements and critical theory that are underrepresented in prestige outlets.
In addition to this topical divergence, we uncover a deeper structural pattern: the most novel combinations of research topics—those that push the boundaries of the discipline—garner more citations, on average, over time relative to contemporaneous work published in the same outlet. Yet novel research is not more likely to appear in higher-ranked journals. This suggests that innovation is not absent but is not immediately appreciated. Although increased competition has produced more political science, it has not measurably translated into more intellectual risk-taking.
By examining these dynamics across publication patterns, collaboration networks, methodological choices, and innovation metrics, we provide a comprehensive empirical analysis of how the modern academic economy transforms disciplinary knowledge production in political science. The rest of the article proceeds as follows. The first section describes our dataset and assembly procedures. Next, we document trends in publication volume and outlet proliferation, followed by an analysis of authorship patterns and individual productivity. The next two sections explore topical choice, specialization, and methodological evolution. We conclude with reflections on the implications of our findings for the future of the discipline.
Data
We treated the set of articles published in political science journals—regardless of the author’s position, disciplinary background, and institution—as constituting the main body “of the discipline of political science.” For some analyses, we complemented this journal-based corpus with metadata on books, book chapters, and articles published in non-political science journals. Figure 1 shows our data collection process, which we briefly describe next.Footnote 2
Path from the Initial List of Journal Names to the Fully Enriched Dataset
Note. This article does not use data we retrieved from the acknowledgment sections, because those data are the basis of a companion paper (Danús et al., Reference Danús, Dinneen, Torreblanca, Grossman and González-Bailónforthcoming).

Our starting point was the list of 188 English-language, peer-reviewed journals that Clarivate classifies as political science and that have an SJR (impact factor) of at least 1.Footnote 3 An SJR less than 1 substantively means that papers in a journal have significantly less visibility and impact than the average paper in the discipline. Papers published in low-impact factor outlets are less connected in the disciplinary citation graph than the typical political science article. By including only higher-impact factor outlets, we focused our analysis on the core journals that drive scholarly discourse. Consequently, this approach ensured that the dataset remained manageable in size and centered on the field’s most influential work. We then searched each remaining journal by name in Scopus. We excluded three outlets that were not indexed, three that were not peer reviewed, one labeled as a book series by Scopus, and seven that were not published in English, giving us a sample of 174 political science journals. This sample is substantially larger than most prior bibliometric-based reviews of the discipline; for example, 3 journals in Fisher et al. (Reference Fisher, Cobane, Vander Ven and Cullen1998), 7 in Wæver (Reference Wæver1998), 8 in Wilson (Reference Wilson2017), 59 in Kristensen (Reference Kristensen2012), 96 in Metz and Jäckle (Reference Metz and Jäckle2017), and 100 in Carammia (Reference Carammia2022).Footnote 4 Our focus on English-language journals means that our findings might not fully reflect trends in knowledge produced in non-English political science outlets.
Identifying these 174 journals on Scopus allowed us to download the journals’ metadata, including journal metrics (e.g., yearly citations) and, most importantly, a complete index of papers published in each journal. We collected paper-level data on 129,751 articles published in our sample of 174 journals between 2003 and 2023. These data included information on each article’s authors, title, abstract, publication date, and DOI link. We then gathered the metadata for the 85,654 unique authors of these articles, including information on each one’s yearly number of publications (broken down by articles, books, and book chapters), annual citation count, and affiliation country. For these 85,654 authors, we also downloaded the metadata of an additional 807,288 papers they published in non-political science journals and in political science journals with an SJR score of less than 1, which we used in the supplementary analyses. We enriched Scopus’s metadata with measures of authors’ gender, which we predicted using the genderize.io package, and with summary measures of publication success, such as an h-index (Torreblanca et al. Reference Torreblanca, Dinneen and Grossman2026).Footnote 5 For a more comprehensive discussion of Scopus’s journal, paper, and author metadata, see appendix, section B.
To classify trends in the topics studied and methods used in political science, we downloaded the full text of 111,560 articles. Based on the first thousand words of each article, we classified paper topics using Structural Topic Modeling (STM). We classified the methods used by articles using a combination of supervised machine learning and ChatGPT. We provide additional information on these classification exercises in the Methods section.
Volume
We begin by analyzing how mounting pressure to publish manifests in the volume of published articles in political science. The “publish or perish” paradigm creates a clear theoretical expectation: as competitive pressures intensify, the discipline should produce more research. Thus, this analysis serves two purposes. First, it tests whether competitive pressure translates into the predicted increase in aggregate output. Second, it establishes baseline trends necessary for examining how these pressures shape other dimensions of knowledge production: collaboration patterns, methodological choices, and research focus and novelty. We used our journals, books, and article-level datasets to explore trends in volume and productivity in political science over the past 21 years.
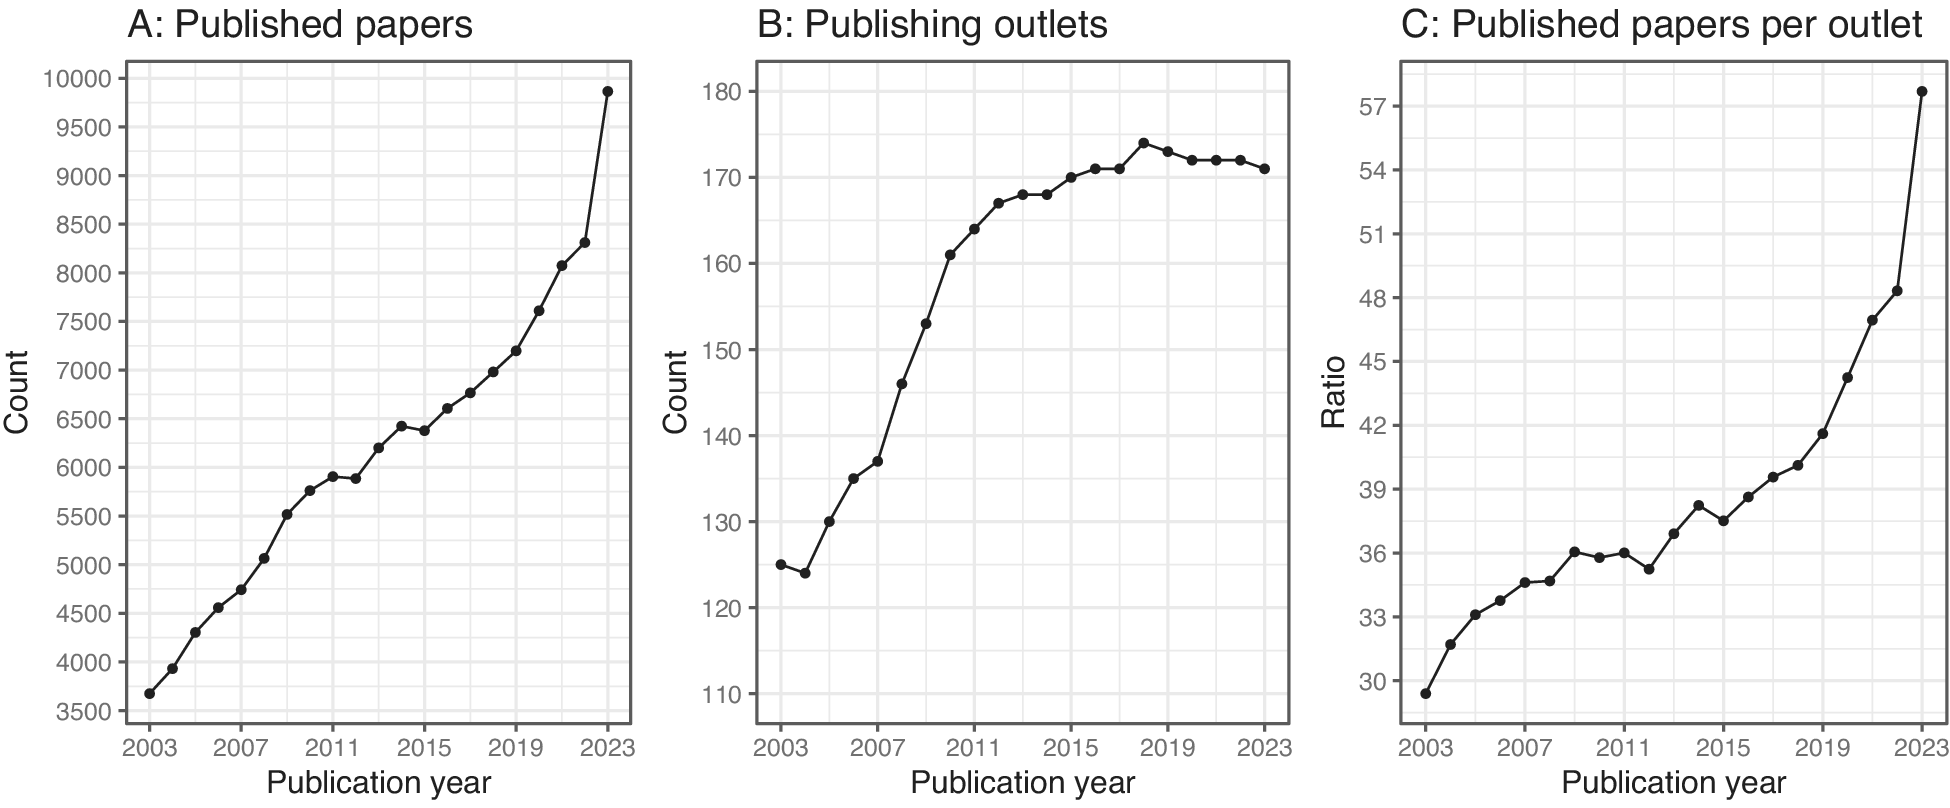
Mimicking trends observed in other academic disciplines (Wang and Barabási Reference Wang and Barabási2021, chap. 15), political science is a growing discipline, its output increasing from about 3,500 articles published in our sample of political science journals in 2003 to almost 10,000 in 2023 alone (figure 2, left panel). This dramatic growth results not only from a larger number of outlets—from 125 political science journals in 2003 to more than 170 in 2023 (middle panel)Footnote 6 but also from more papers per outlet: an increase from about 30 articles a year per journal in 2003 to 58 articles a year per journal in 2023 (right panel).Footnote 7
Trends in Political Science Output
Notes. The left panel shows the count of papers published in all identified political science outlets each year. The middle panel plots the count of political science outlets publishing each year. The right panel plots the ratio of published papers over publishing outlets.

Coauthorship
Growth in the number of publications should influence the size of research teams through two nonrivalrous mechanisms. First, as the volume of new knowledge grows exponentially, the time a scientist can dedicate to absorbing new knowledge (thematic and methodological innovations) remains finite. This time crunch should create incentives for researchers to specialize and thus a need to assemble larger teams to tackle questions that span multiple topics or methods. Second, the growing pressure to publish, fundraising imperatives, and the use of metrics assessments should incentivize team assembly as a strategy to increase output and share the costs of research production.
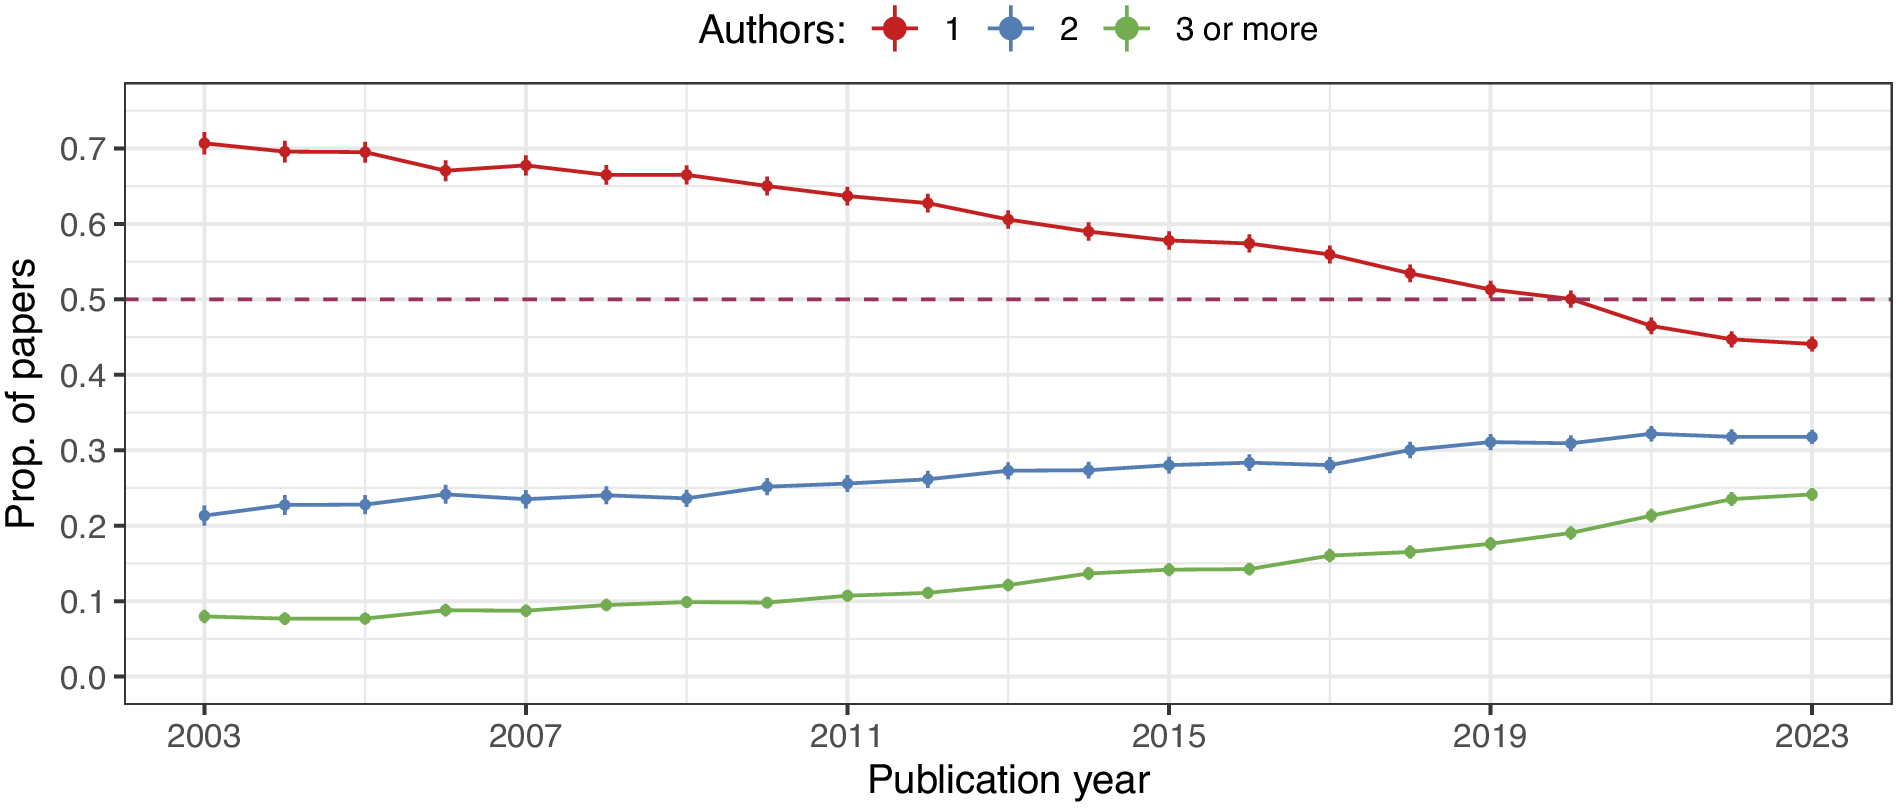
These expectations align with observed trends in the field of political science. Coauthored research represents an increasingly large share of the output produced by political science (Metz and Jäckle Reference Metz and Jäckle2017; Leifeld Reference Leifeld2018; Zhu and Cheng Reference Zhu, Edmund and Cheng2024), similar to trends documented in other social science disciplines (Henriksen Reference Henriksen2016). Figure 3 shows that the proportion of yearly published papers that were solo-authored (in red) has declined over time. In contrast, the proportion of coauthored articles—both the green line (two authors) and the blue line (three or more authors)—has increased consistently over the period. Since 2021, most of the articles published in political science outlets have been coauthored. Collaboration has not only become more frequent but teams are also growing larger. Figure 3 shows that the proportion of papers published by teams of three or more members is increasing at a higher rate than those written by two-person teams. Similarly, the right panel of figure 4 also shows the trend toward team size expansion: in 2003, the mean number of authors per paper published in political science journals (red line) was 1.3, which jumped to 2.0 in 2023.
Coauthorship Trends
Notes: Figure shows the proportion of yearly published papers in political science that had one author (red), two authors (blue), and three or more authors (green).

Author-Level Productivity
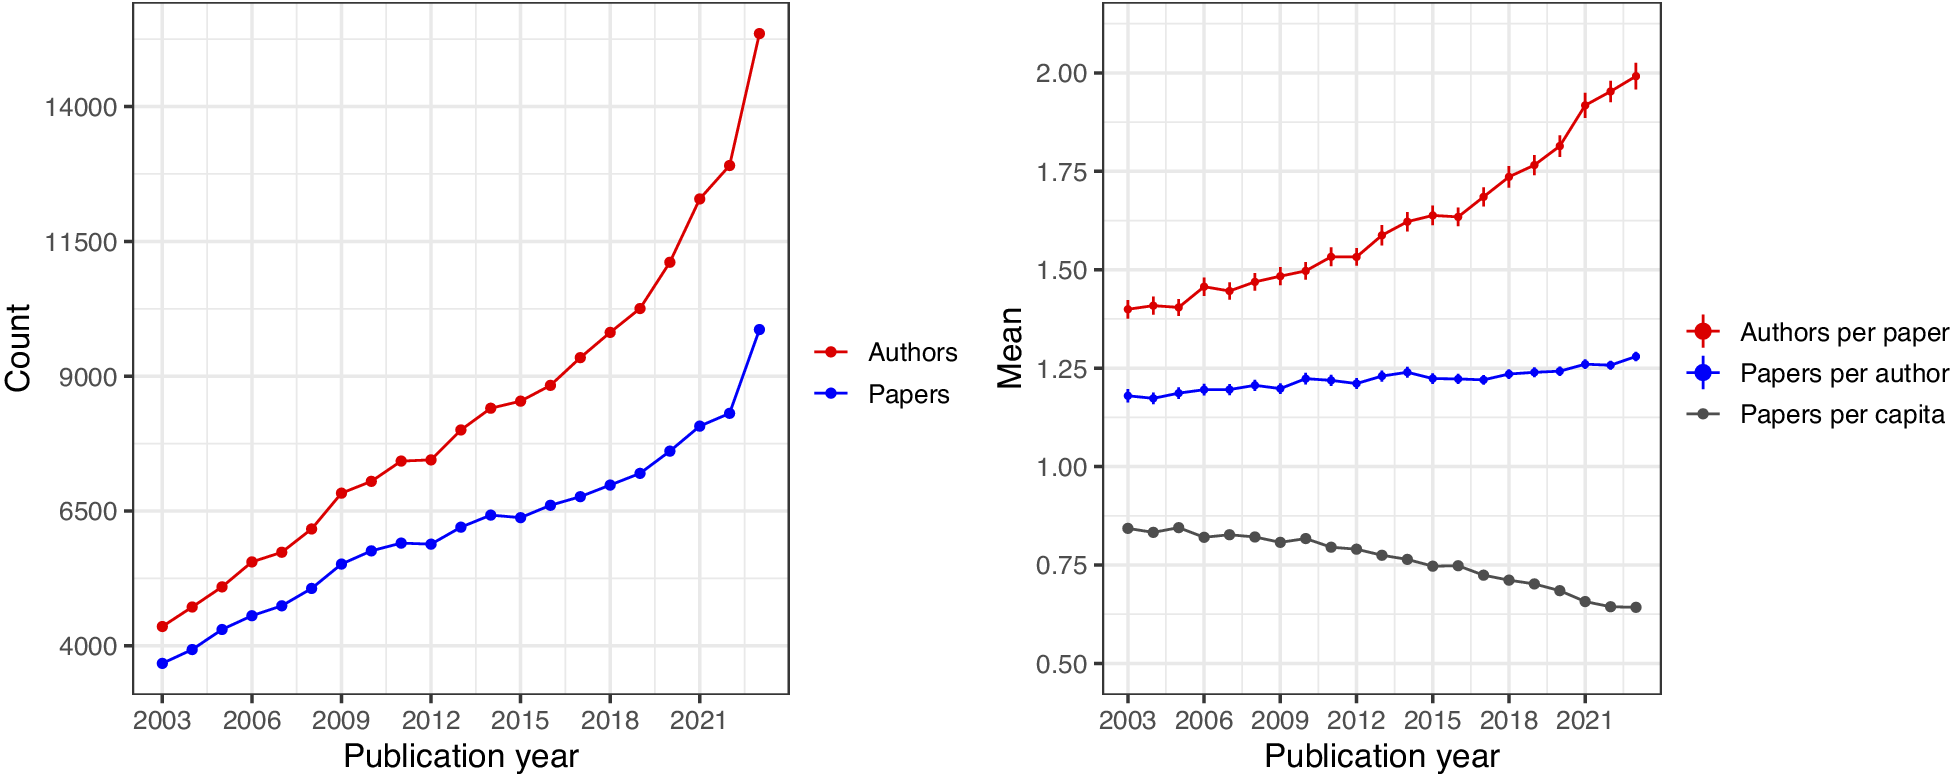
Notes. The left panel plots the count of unique authors (in red) and published papers (in blue) in the study period. The right panel shows the average number of authors per published paper (in red), the average number of published papers by each unique author in our sample (in blue), and the overall number of papers per unique author (in gray). To calculate the average number of authors per paper, we computed the mean number of authors per published paper per year. To calculate the average number of papers per author, we computed the total number of papers published by each author each year. Then, we computed the mean of that number for each year.

Productivity
The volume of political science research tripled between 2003 and 2023. What explains this growth? A common view attributes it to rising researcher productivity, driven by a “publish or perish” culture and increasing job scarcity—fewer academic positions for a growing pool of candidates (Diaz and McGrath Reference Diaz and McGrath2023). In this section, we empirically test whether publication growth reflects higher individual productivity among political scientists. Prior work has either examined why some scholars are more productive than others (e.g., Hesli and Lee Reference Hesli and Lee2011; Norris Reference Norris2021) or documented increases within specific research areas (e.g., Druckman et al. Reference Druckman, Green, Kuklinski and Lupia2006). To our knowledge, this is the first study to systematically quantify researcher productivity trends in the discipline.
We find limited evidence for this explanation when examining the discipline as a whole. Figure 4 (left panel) shows the count of unique authors (in red) and published papers (in blue) each year throughout the study period. The number of unique authors and the number of papers have increased since 2003. In 2003, 4,358 unique authors published a paper in a political science journal in our sample compared to 15,354 in 2023. Notably, the number of unique authors has increased faster than the number of unique papers, as seen in the widening gap between the blue and red lines in the left panel. Consequently, as the right panel shows (in gray), the yearly ratio of unique papers over unique authors, or papers per capita, is decreasing: on average, there were 0.84 papers per capita in 2003 versus 0.64 papers per capita in 2023. The decrease in the number of papers per capita results mechanically from the increasing popularity of coauthorship (figure 3). Put differently, the time it takes to write a paper with (say) two other coauthors is larger than one-third of the time it takes to write a single-authored paper. Unless extra coauthors proportionally boost the total number of papers published (e.g., by a factor of three), per capita productivity will decline mechanically.
Although coauthorship might depress the number of papers per capita, researchers’ productivity may still increase over time due to technological innovations, such as increased computing power, use of large language models (LLMs), and of collaboration tools like Zoom and Slack, and lower costs of conducting some forms of research; for example, by using online services such as MTurk and Upwork. Figure 4 shows (in red) that even though the average number of authors per paper increased from 1.3 in 2003 to 2.0 in 2023 (a 54% increase), the average number of papers published by each unique author in our dataset (in blue) only increased from 1.18 papers in 2003 to 1.28 papers in 2023 (an 8.5% increase). Thus, author-level productivity, marginalized over coauthored and single-authored work, increased by only 8.5%, while paper production almost tripled in the same period. Back-of-the-envelope calculations suggest that even if all 15,354 authors in 2023 had stayed at the 2003 productivity level of 1.18 papers per author, and assuming that the modal 2023 paper had two authors, 2023 would have seen more than 9,000 papers published, a little over 90% of the actual publication volume. Consequently, the modest increase in productivity likely accounts for only a small portion of the overall volume increase we documented earlier.
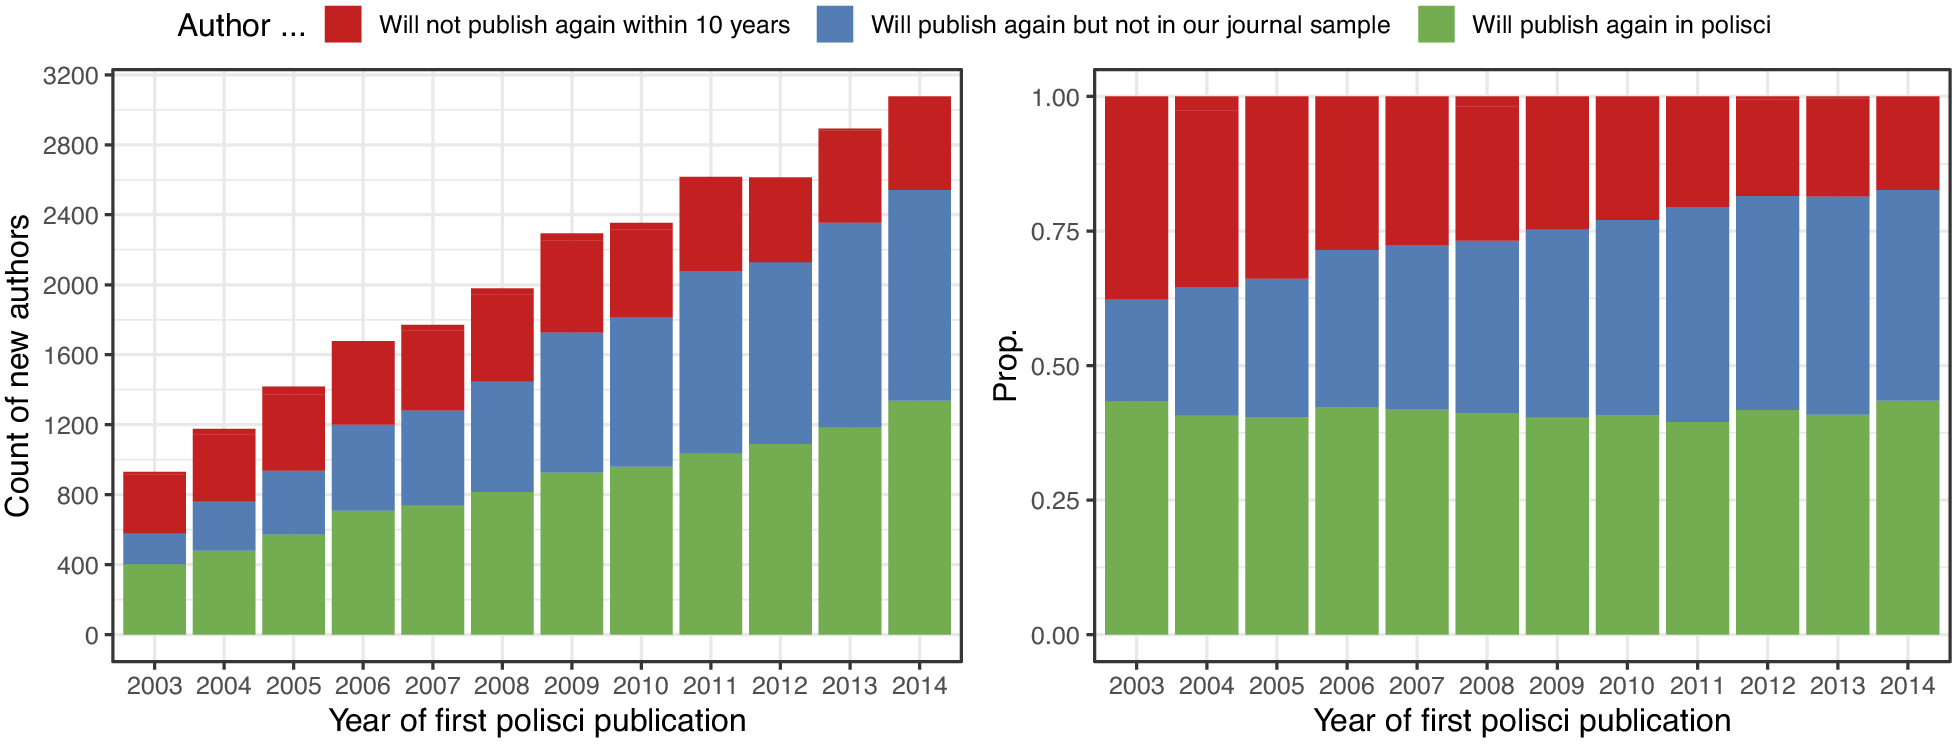
Slight increases in political scientists’ productivity (0.4% annualized over 21 years) are insufficient to explain the rapid growth of the discipline (5% annualized over that period). Instead, the expansion of the discipline is better explained by the growth of political-science-writing researchers. The left panel of figure 5 plots the count of new authors publishing in political science each year from 2003 to 2014. The colors of the bars distinguish whether researchers will publish again in political science within the next 10 years (green), whether they will publish again but not in political science journals within the next 10 years (blue), or whether they will only publish once within that period (red). The right panel shows the proportion of each group by year.
Publication Persistence among First-time Authors
Notes. The left panel shows the count of new authors—defined as authors who published their first in-sample political science publication each year—who will not publish again in any discipline within 10 years (red), who will publish again within 10 years but not in our sample of journals (in blue) and who will publish again within that same interval in an in-sample political science journal (in green). The right panel shows the corresponding yearly proportions of each of the three groups.

As shown in figure 5, there have been more than a thousand new political science authors every year since 2003, but a little under two-thirds of them will not publish again in our sample of political science outlets within 10 years. Of those, we note the reversal in the ratio of “single hitters” (red) compared to those who published only once in our sample of political science outlets but published again elsewhere (in blue). Of this latter group, 6% of authors will go on to publish papers in low-impact political science journals outside our sample, and 94% will only publish again completely outside the discipline. By and large, this group comprises researchers working in related fields like economics, psychology, communication, and sociology, pointing to the growing connection and relevance of political science to other disciplines and, conversely, the growing relevance of interdisciplinary ideas to political science.Footnote 8 In sum, our analysis suggests that new authors, instead of more productive authors, explain the bulk of the increase in political science volume.
Productivity in and beyond Political Science
Changes in productivity are unlikely to account for a substantial share of the large increase in in-sample political science output in the past two decades. However, we have also shown that around 60% of first-time political science authors will not publish in the discipline’s mainstream journals again. Could the productivity of individual political scientists be increasing but be obfuscated by this growing number of researchers who only publish once in the discipline? Competitive pressures intensified over our study period. Consequently, we expect to observe systematic differences between younger and older cohorts: researchers beginning their careers in more competitive environments should publish more intensely than their predecessors at comparable career stages.
To assess whether publication pressures have meaningfully changed researcher behavior, we compared cohorts at similar career stages across different periods. We explored two possibilities: First, the influx of one-time publishers may mask individual productivity gains. Second, younger political scientists may be adapting their publishing strategies. In particular, in response to publication pressure, younger cohorts may seek to increase output within the discipline’s mainstream, strategically targeting the discipline’s less influential but less selective outlets, or alternatively, diverting efforts toward high-impact multidisciplinary journals (such as Science, Nature, and PNAS) or related fields.
We tested whether political scientists have become more productive by focusing on those who establish sustained careers in the discipline. We classified “political scientists” as individuals who published at least five articles in any in-sample journal over 10 years and who published at least half these papers in political science journals. These researchers are “survivors” in the discipline. Next, we compared two cohorts of political scientists, thus defined, over 10 years: those who published their first article (anywhere) in 2004 and those who published it in 2014. This design isolated the effect of changing competitive pressures by holding researchers’ career stage constant. With this sample, we estimated the mean number of published papers per author by fitting the following model:
 $$ {\displaystyle \begin{array}{l}{\mathrm{Pubs}.}_{ic}=\sum \limits_{y=1}^{10}{\beta}_y\unicode{x1D540}\Big[\mathrm{Year}\ \mathrm{since}\ 1\mathrm{st}\hskip0.3em {\mathrm{pub}}_i=y\Big]+{\epsilon}_{ic}\end{array}} $$
Here, the $ {\beta}_y $
’s are estimators of the mean number of yearly published papers by authors from cohort
$ {\beta}_y $
’s are estimators of the mean number of yearly published papers by authors from cohort $ c $
each year
$ c $
each year $ y $
after their first publication, and
$ y $
after their first publication, and $ {\epsilon}_i $
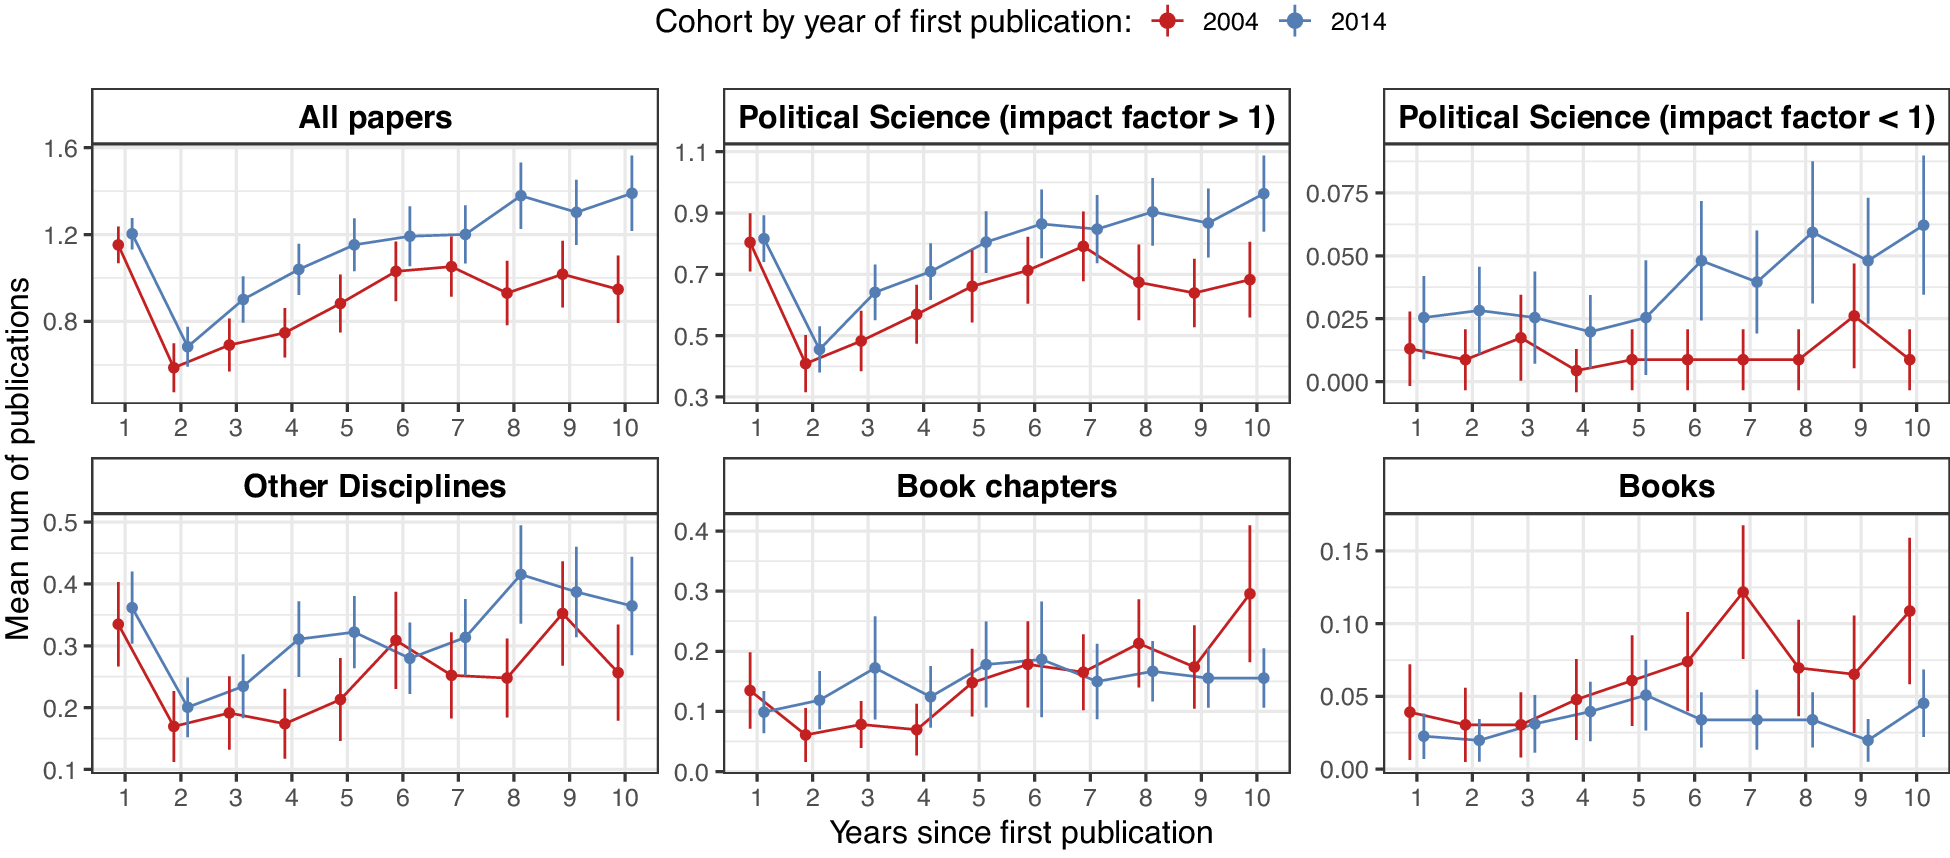
are robust standard errors clustered at the author level. Figure 6 reveals several striking patterns of changing academic production function across cohorts. First, the estimated mean number of yearly published papers in all outlets shows that the younger cohort is significantly more productive than the older cohort in terms of article output (top left panel). The 2014 cohort consistently outproduces the 2004 cohort across nearly all years since its first publication, with particularly large gaps emerging in later career years. In year 10, the 2014 cohort publishes approximately 46% more papers annually than their 2004 counterparts. Substantively, this difference is considerable.
$ {\epsilon}_i $
are robust standard errors clustered at the author level. Figure 6 reveals several striking patterns of changing academic production function across cohorts. First, the estimated mean number of yearly published papers in all outlets shows that the younger cohort is significantly more productive than the older cohort in terms of article output (top left panel). The 2014 cohort consistently outproduces the 2004 cohort across nearly all years since its first publication, with particularly large gaps emerging in later career years. In year 10, the 2014 cohort publishes approximately 46% more papers annually than their 2004 counterparts. Substantively, this difference is considerable.
Mean Number of Publications by Year since the First Publication for Political Scientists Who First Published in 2004 (red) or 2014 (blue)
Notes. We define political scientists as researchers who published five or more papers in their first decade, with at least half appearing in in-sample political science outlets. Top left, All papers; top middle, papers in political science journals with an impact factor of 1 or higher; top right, papers in political science journals with an impact factor of less than 1; bottom left, papers in other disciplines; bottom middle, book chapters; bottom right, books.

Second, this increased productivity is primarily concentrated in higher-tier political science outlets rather than lower-tier journals. Although the 2014 cohort does publish slightly more in lower-impact political science journals (with an impact factor of $ \le 1 $
), the magnitude is modest. To contextualize, on average, political scientists in the (younger) 2014 cohort publish 15.5 papers in a political science outlet with an impact factor
$ \le 1 $
), the magnitude is modest. To contextualize, on average, political scientists in the (younger) 2014 cohort publish 15.5 papers in a political science outlet with an impact factor $ \ge 1 $
for each paper they publish in outlets with an impact factor of < 1. By contrast, for the older cohort, this ratio is 2.7. The substantial productivity gains of the younger cohort are concentrated in higher-impact political science venues (impact factor
$ \ge 1 $
for each paper they publish in outlets with an impact factor of < 1. By contrast, for the older cohort, this ratio is 2.7. The substantial productivity gains of the younger cohort are concentrated in higher-impact political science venues (impact factor $ \ge 1 $
), suggesting that quality considerations remain important for our sample.
$ \ge 1 $
), suggesting that quality considerations remain important for our sample.
Third, both cohorts publish outside the discipline more often than in low-impact factor journals within the discipline. However, the younger cohort publishes outside the discipline more often than the older cohort, especially after year seven. From years seven to nine, the younger cohort slightly outpublishes the older cohort in other disciplines (averaging 0.31 vs. 0.25 papers annually). Moreover, the 2014 cohort published almost six times more in other disciplines than in low-impact political science journals by year 10, whereas the 2004 cohort published only 1.4 times more. This suggests that younger scholars likely place a higher premium on high-quality cross-disciplinary publications than low-tier disciplinary venues, relative to their older peers.
However, changes in the rates of book and book chapter production complicate the interpretation of these findings, because they may not reflect blanket increases in productivity for the younger cohort. Across the entire 10-year period, the 2004 cohort averages 0.07 books per year, whereas the 2014 cohort averages 0.04—a 43% difference. For book chapters, the 2004 cohort averages 0.16 chapters per year compared to 0.13 for the 2014 cohort—a 19% reduction. Consequently, cohort-level increases in the productivity of papers come partly at the expense of investing less time in the production of books and book chapters.
In sum, volume growth in political science stems largely from an increase in unique authors publishing in these outlets. Yet this aggregate pattern obscures important generational differences. Younger cohorts do publish at higher rates than their predecessors, particularly as they approach promotion decisions. The effort invested in publishing in higher-ranked journals suggests that a quality–quantity trade-off shapes researchers’ publication decisions. Younger scholars, however, spend considerably less time on books and book chapters. Volume remains only one metric of academic success, and comparing different outputs is not straightforward. What researchers study likely matters as much as how much they publish. The following section explores what political science researchers study and how the field has evolved.
Topics
This section introduces our classification of papers by topic, setting the stage for an exploration of whether political science has narrowed in topical focus over time and whether and how the discipline rewards topical diversity and novelty.
Researchers must balance disciplinary incentives with their personal research preferences and interests. For instance, Perestroika reformers worried that disciplinary pressures would limit intellectual diversity, pushing researchers toward safer, narrower questions and methodologically orthodox approaches (Gunnell Reference Gunnell2015; Monroe Reference Monroe2015). By analyzing how the discipline rewards topical diversity and novelty in practice, we examine whether political science has maintained topical diversity over time or whether structural incentives have led to the narrowing that reformers feared.
We extracted topics by applying structural topic modeling (STM; Roberts et al. Reference Roberts, Stewart, Tingley, Edoardo and Airoldi2013) to our corpus of political science articles ( $ n=\mathrm{111,560} $
). We selected a 30-topic model because it provided a good balance between specificity and comprehensiveness.Footnote
9 We manually named topics based on their most probable words (see detailed information on our STM approach in appendix F).
$ n=\mathrm{111,560} $
). We selected a 30-topic model because it provided a good balance between specificity and comprehensiveness.Footnote
9 We manually named topics based on their most probable words (see detailed information on our STM approach in appendix F).
Note that articles were not assigned a unique topic. Instead, STM outputs a posterior proportion, $ {\theta}_{it} $
, that paper
$ {\theta}_{it} $
, that paper $ i $
is allocated to topic
$ i $
is allocated to topic $ t $
, for each of the 30 topics. On average, however, only two to three topics result in a posterior proportion higher than 10%. Specifically, 74.1% of the papers have at most three topics with a proportion higher than 10% (for details, see appendix, tables F4 and F6).
$ t $
, for each of the 30 topics. On average, however, only two to three topics result in a posterior proportion higher than 10%. Specifically, 74.1% of the papers have at most three topics with a proportion higher than 10% (for details, see appendix, tables F4 and F6).
Our analysis focused on between-topic frequency, even though substantive interest might change over time within a given topic. For example, 20 years ago, the political communication literature focused extensively on media bias; however, in recent years, the field has shifted its attention to misinformation. Similarly, two decades ago, the “democracy and autocracy” topic focused on hybrid regimes. However, in recent years, scholars writing on this topic have shifted attention to questions surrounding autocratic resilience and democratic erosion. Such within-topic refocus is not captured in our data. Bracketing these caveats, in figure 7, we plot the mean topic proportion and 95% confidence intervals for all papers published in the top-20 political science outlets each year (blue) and all other outlets (red).Footnote 10
Mean Topic Proportion and 95% Confidence Intervals for All Papers Published in the Top 20 Political Science Outlets Each Year (blue) and All Other Outlets (red).
Note. Topics were estimated using STM and were labeled manually.

Several trends are worth noting. First, some topics have become more prevalent in recent years—in particular, political communication, Indigenous politics, social movements, and race and immigration—whereas other topics, such as terrorism, war, the US presidency, lobbying, and normative theory, have lost popularity. And some topics seem ever present, such as electoral institutions, bureaucratic politics, democracy and autocracy, and federalism and decentralization. This analysis helps identify which topics are more reliant on global events and fads and which the field considers more foundational, because interest in them is less influenced by the zeitgeist.
Second, there is a difference between the intensity with which topics are covered in the top-20 political science outlets and the rest of the discipline’s journals. Some topics are consistently overrepresented in top-20 outlets, such as civil wars and intergroup conflict, public opinion, quantitative methods, and fiscal politics, whereas other topics—European politics, post-Soviet politics, critical theory, and terrorism—are consistently under-represented in those top-20 journals. One explanation for this mismatch is the continued but shrinking (see Carammia Reference Carammia2022; Barcelo et al. Reference Barcelo, Paik, van der Windt and Zhai2025) dominance of US-based researchers and institutions in the top journals.
Third, trends in topic popularity tend to track in the same direction in the top-20 journals and the rest of the discipline; for example, the decline in research on the US presidency and financial and labor markets or the increase in public opinion scholarship and research applying a political culture lens. However, this is not always the case: for instance, interest in environmental politics has grown tremendously in the past two decades (Grossman, Sacks, and Xu Reference Grossman, Sacks and Xuforthcoming). During that same period, environmental politics scholars struggled to make inroads into political science’s most prestigious journals.Footnote 11 This trend is consistent with the idea, developed at greater length in the next section, that novelty in research does not get rewarded in journal placement, and its contribution to the field is realized with considerable lag.
Overall, although the discipline shows evidence of both rising and declining topics, there is also evidence of topical stratification between top journals and other journals, suggesting a two-tiered knowledge system that favors specific topics over others. Yet, despite potential incentives to focus on some topics over others, few topics disappear from political science’s research agenda altogether. As a discipline, political science continues to encompass a diverse range of subject matters.
Topical Novelty and Focus
Competitive pressures in political science generate a persistent tension between professional advancement and the pursuit of research breadth and innovation. Scholars face a trade-off between topical focus and thematic breadth: a narrowly focused paper enables deeper theoretical engagement within a specific domain but risks limited generalizability and visibility. Conversely, broader work offers cross-cutting insights and wider appeal, potentially at the expense of depth and disciplinary coherence. A parallel tension surrounds research novelty. Although innovative work can advance theory and attract attention, it also entails higher risks. Engaging established themes remains a safer route to acceptance and recognition, though one that is less likely to yield theoretical or conceptual breakthroughs.
These trade-offs have sharpened under “publish or perish” conditions. Novel research expands knowledge by challenging prevailing theories but often faces institutional resistance: reviewers may reject unfamiliar approaches, and even when successful, such work tends to gain recognition and citation more slowly (Wang, Veugelers, and Stephan Reference Wang, Veugelers and Stephan2017). By contrast, topical specialization fosters methodological rigor and signals expertise yet can limit influence and adaptability to emerging debates. In an environment where steady output is vital for career advancement, these incentives encourage safer and more incremental research trajectories.
In this section, we examine trends in topical novelty and focus over the past two decades, their relationship to collaboration patterns, and their association with publication success. Following Heiberger, Galvez and McFarland (Reference Heiberger, Galvez and McFarland2021), we conceptualize topical focus as the degree to which papers concentrate on few topics versus span multiple domains, and topical novelty as the extent to which papers combine previously unassociated rather than familiar topics. We begin by outlining our measurement strategy and provide basic descriptive statistics, then assess how collaboration relates to topical focus and novelty, and finally evaluate how these characteristics predict paper-level success, as indicated by journal placement and citation counts.
Measuring Novelty and Focus
To construct paper-level measures of topical focus and novelty, we refined measures proposed by Heiberger, Galvez, and McFarland (Reference Heiberger, Galvez and McFarland2021). For both indices, we used the output of the STM, detailed in the topic section. Recall that the STM model assumes that each paper is a mixture of different topics. The STM outputs the posterior proportion of paper i allocated to topic t, $ {\theta}_{it} $
, that paper
$ {\theta}_{it} $
, that paper $ i $
includes topic
$ i $
includes topic $ t $
, for each of 30 topics.We defined topical focus as the Herfindahl index of topics for each paper in our sample. It is computed by adding the squared topic proportion
$ t $
, for each of 30 topics.We defined topical focus as the Herfindahl index of topics for each paper in our sample. It is computed by adding the squared topic proportion $ {\theta}_{it} $
of paper
$ {\theta}_{it} $
of paper $ i $
including topic
$ i $
including topic $ t $
for all 30 topics:
$ t $
for all 30 topics: $ Focus={\sum \limits}_{t=1}^T{\theta}_{it}^2 $
. The index ranges from 0 to 1, and its interpretation is straightforward; the closer the index is to 1, the more topically focused a paper is. The closer it reaches zero, the more topically diverse is the paper.
$ Focus={\sum \limits}_{t=1}^T{\theta}_{it}^2 $
. The index ranges from 0 to 1, and its interpretation is straightforward; the closer the index is to 1, the more topically focused a paper is. The closer it reaches zero, the more topically diverse is the paper.
Our novelty index measures how rare or common a topic combination in each paper is relative to the topics in political science papers published during the preceding three years. It is constructed by first assigning to each paper the two highest proportion topics, as estimated by the STM model.Footnote 12 Next, we computed the proportion of all papers written over the preceding three years with either topic as one of their two most probable. Using this proportion, we can calculate the expected number of papers written on each two-topic combination throughout the period. The intuition is straightforward: when a topic is written about frequently, we should expect it to co-occur with other frequent topics more often than by chance alone.
Last, we calculated the actual observed share of papers that combine each dyad of topics and take the ratio of observed over expected papers with that specific topical combination $ r $
. We then assigned a novelty score
$ r $
. We then assigned a novelty score $ N=1-r $
to each paper in our sample. A zero value in the novelty score indicates we have as many papers on that combination of topics as expected. A score close to 1, the theoretical maximum, indicates a paper that combines topics in a perfectly novel way. Conversely, papers with negative scores combine topics that are used together during the past three years more than expected and are therefore not novel combinations. We report summary statistics for these characteristics in table 1.
$ N=1-r $
to each paper in our sample. A zero value in the novelty score indicates we have as many papers on that combination of topics as expected. A score close to 1, the theoretical maximum, indicates a paper that combines topics in a perfectly novel way. Conversely, papers with negative scores combine topics that are used together during the past three years more than expected and are therefore not novel combinations. We report summary statistics for these characteristics in table 1.
Summary Statistics for the Topical Focus and Novelty Indices

Notes. We calculated topical novelty using a rolling three-year count of all articles, for which the STM estimates a posterior probability of the second-most likely topic being more than 1. Then we calculated the novelty index for a subset of papers published after 2004, while the focus index is calculated for the entire sample of papers included in the STM.
Alternative measures of topical novelty focus on semantic “distance” between topics (e.g., Hackett et al. Reference Hackett, Leahey, Parker, Rafols, Hampton, Corte, Chavarro, John, Drake, Sheble, Vermeulen and Vision2021). Instead, our novelty measure captures “distance” from field-level publication patterns. This decision is theoretically motivated: a paper might combine semantically distant topics that are nevertheless often found together in political science. For instance, “public opinion and political psychology” and “quantitative methods” are often combined. Such a combination of topics could hardly be seen as novel. Conversely, a paper combining semantically similar topics may be highly novel when those topics are rarely used together. Our measure therefore isolates novelty as deviation from disciplinary practices, rather than conceptual breadth. The former, not the latter, should be theoretically affected by competitive pressures.
Collaboration, Topical Diversity, and Novelty
How do trends in competitive pressure and increased collaboration intersect to shape the intellectual content of political science research? We examine this question by analyzing topical novelty and diversity, two dimensions that capture how scholars navigate the tension between intellectual risk-taking and career safety.
Pursuing novel research combinations might carry significant risks in a competitive environment. However, collaboration might distribute these risks across team members, making it feasible to pursue innovative topic combinations that individual scholars would avoid more often. Alternatively, teams might gravitate toward consensus around safer, more focused topics that promise clearer publication pathways. The implications extend beyond individual career strategies. If collaboration enables intellectual risk-taking, the discipline’s shift toward teamwork could help maintain innovation despite competitive pressures. If teams instead prioritize focused, incremental work, then increased collaboration may limit topical risk-taking.
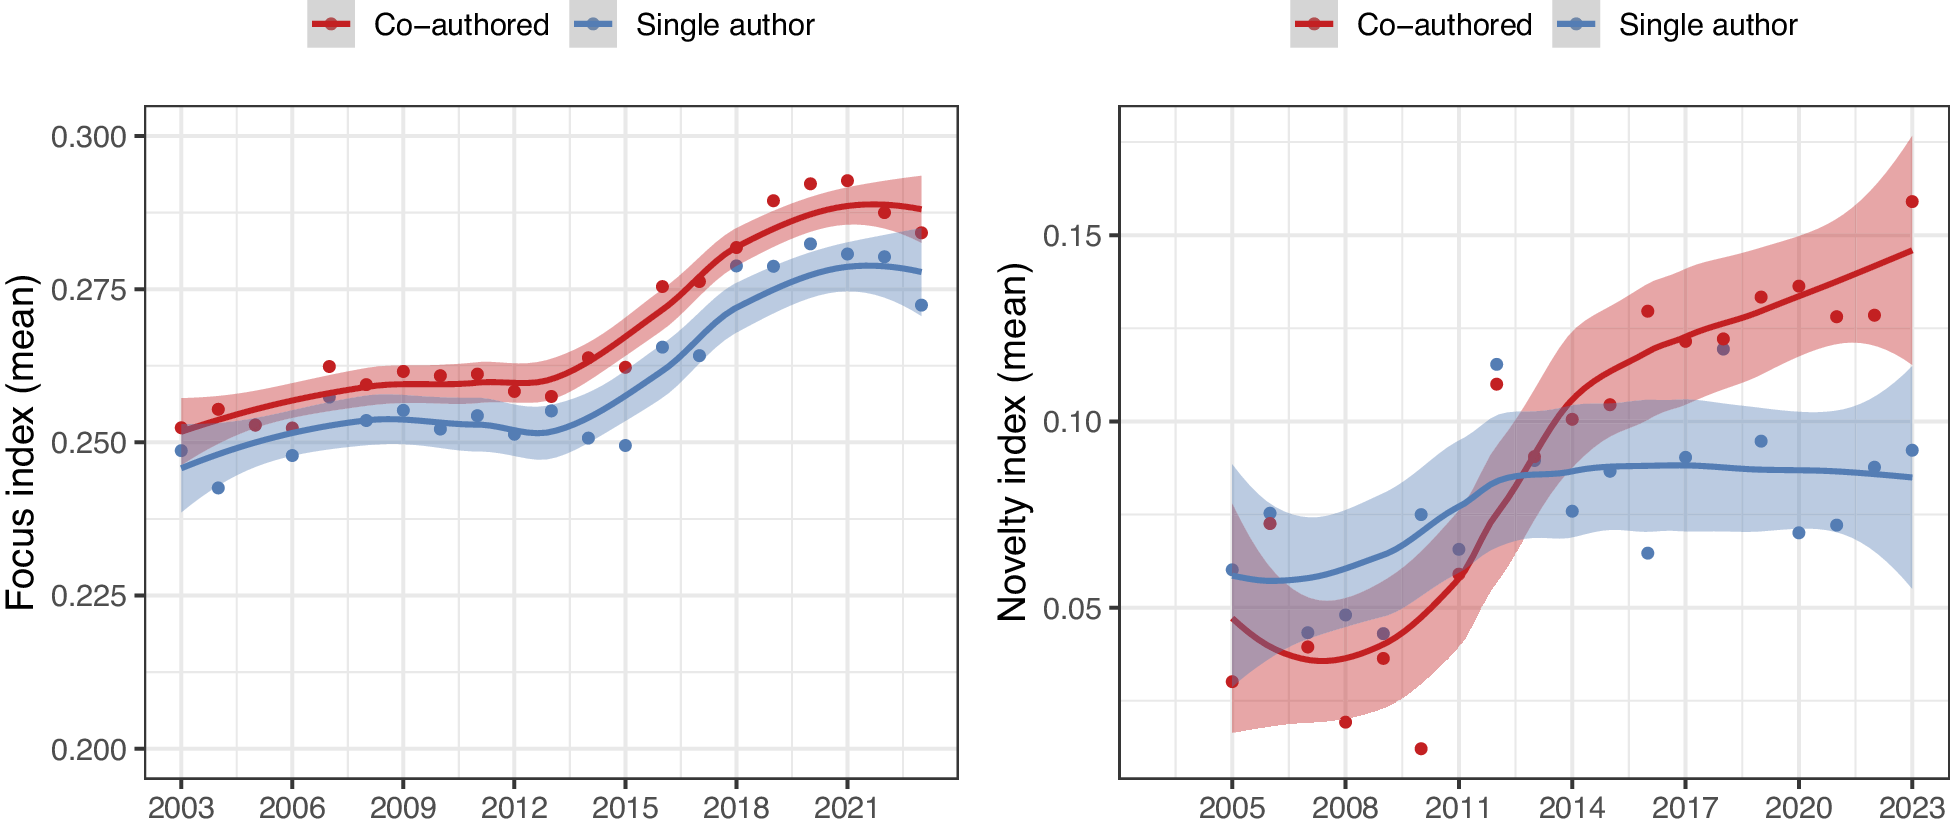
We assessed whether the discipline-wide shift toward collaboration spurs topical exploration and novelty and whether teams are more or less topically focused than individual researchers (see figure 8). The left panel shows the mean yearly topical focus index for coauthored political science research (in red) and single-authored work (in blue). Recall that higher index values represent more topically focused research, whereas smaller values represent more topically diverse papers. Overall, political science papers have become more topically focused in the past two decades, especially starting in 2013. Further, coauthored papers are slightly more topically focused than single-authored work.
Trends in Topical Exploration and Novelty
Notes. The left panel shows the yearly mean diversity index for coauthored (in red) and single-authored papers (in blue). The right panel shows the yearly mean novelty index for coauthored (in red) and single-authored papers (in blue). Gray bands mark the 95% confidence intervals.

In summary, structural changes within the discipline are prompting political science researchers to write more narrowly focused papers, and the disciplinary shift toward more collaborative work amplifies this trend. We explore these patterns more deeply in appendix, figure H11, where we compare the mean topical focus of papers published by two cohorts of “surviving” political scientists. We find that the younger cohort is as focused as the older cohort but produces slightly more novel research. We interpret this pattern as the general equilibrium, accounting for the increased risk-sharing benefits of collaboration for the younger cohort and their mounting publication pressures.
As for topical novelty in political science, the right panel of figure 8 shows that it has consistently increased in the past decades, especially for coauthored work. Although research published by teams in 2005 was as novel as research published by solo authors, by 2023, the novelty index for teams was, on average, 42% larger.
The correlational analysis we report in figure 8 shows systematic associations among topical focus, novelty, and coauthorship in political science research. However, research teams and research projects form endogenously, making it difficult to ascertain from raw associations whether team composition and size cause changes in topical novelty or focus or whether other factors shape topical breadth and simultaneously influence the size and composition of teams. To assuage some concerns about the interpretability of the results, we leveraged the richness of our data to compare how topical focus and novelty relate to coauthorship after parsing out all time-invariant author-level characteristics. To do so, we constructed a dataset where the paper-author is the unit of observation and compare how topical novelty and focus are related to coauthorship by comparing solo-authored and co-authored papers written by the same authors. We estimate the following model:
 $$ {\mathrm{Index}}_{ia}={\beta}_1\;\mathrm{Co}{\mathrm{Authored}}_{ia}+{\gamma}_a+{\varepsilon}_{ia} $$
where $ {\mathrm{Index}}_{ia} $
is the standardized index of either topical novelty or focus for paper
$ {\mathrm{Index}}_{ia} $
is the standardized index of either topical novelty or focus for paper $ i $
published by author
$ i $
published by author $ a $
;
$ a $
; $ {\mathrm{CoAuthored}}_{ia} $
is either a binary variable that takes the value of 1 if paper
$ {\mathrm{CoAuthored}}_{ia} $
is either a binary variable that takes the value of 1 if paper $ i $
written by author
$ i $
written by author $ a $
was cauthored and zero otherwise, or the log number of coauthors in paper
$ a $
was cauthored and zero otherwise, or the log number of coauthors in paper $ i $
, including author
$ i $
, including author $ a $
.
$ a $
. $ {\gamma}_a $
are author-fixed effects, and
$ {\gamma}_a $
are author-fixed effects, and $ {\varepsilon}_{ia} $
are robust standard errors, double-clustered at the paper and author levels. For comparability, we subset the sample and retained only papers for which we could estimate both indices.
$ {\varepsilon}_{ia} $
are robust standard errors, double-clustered at the paper and author levels. For comparability, we subset the sample and retained only papers for which we could estimate both indices.
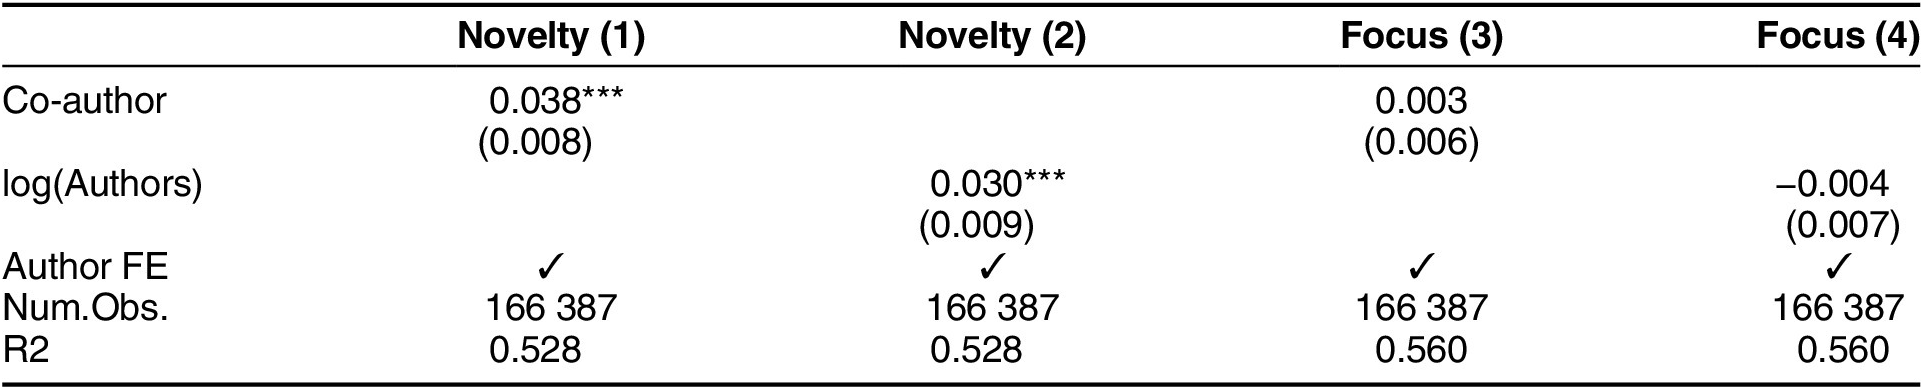
We report our estimates in table 2. When examining the extensive margin with the binary measure and the intensive margins with the continuous measure, we find that collaboration results in more novel published research after accounting for all time-invariant author-level characteristics. When we include author-fixed-effects, a coauthored paper is, on average, 3.8% of a standard deviation more novel than a single-authored work. Alternatively, going from a single-authored paper to a paper with two coauthors increases the novelty index by an average of $ \left(\mathit{\log}(2)-\mathit{\log}(1)\right)\times .030\approx 0.02 $
, or 2% of a standard deviation. However, after accounting for individual characteristics, coauthorship has no statistically significant association with paper focus, and the association is precisely estimated at zero.
$ \left(\mathit{\log}(2)-\mathit{\log}(1)\right)\times .030\approx 0.02 $
, or 2% of a standard deviation. However, after accounting for individual characteristics, coauthorship has no statistically significant association with paper focus, and the association is precisely estimated at zero.
Within-author Changes in Novelty and Focus: Solo vs. Coauthored Work

* p $ < $
0.05; ** p
$ < $
0.05; ** p $ < $
0.01; *** p
$ < $
0.01; *** p $ < $
0.001.
$ < $
0.001.
Notes. Estimated difference in the standardized novelty index and the focus index for coauthored papers relative to single-authored papers and the expected marginal change in both indices when the count of authors in a paper increases by one unit in the logarithmic scale (or around 2.7 more authors). Dependent variables are standardized. The unit of observation is the author-paper. Robust standard errors, double clustered at the author and paper, are reported in parentheses.
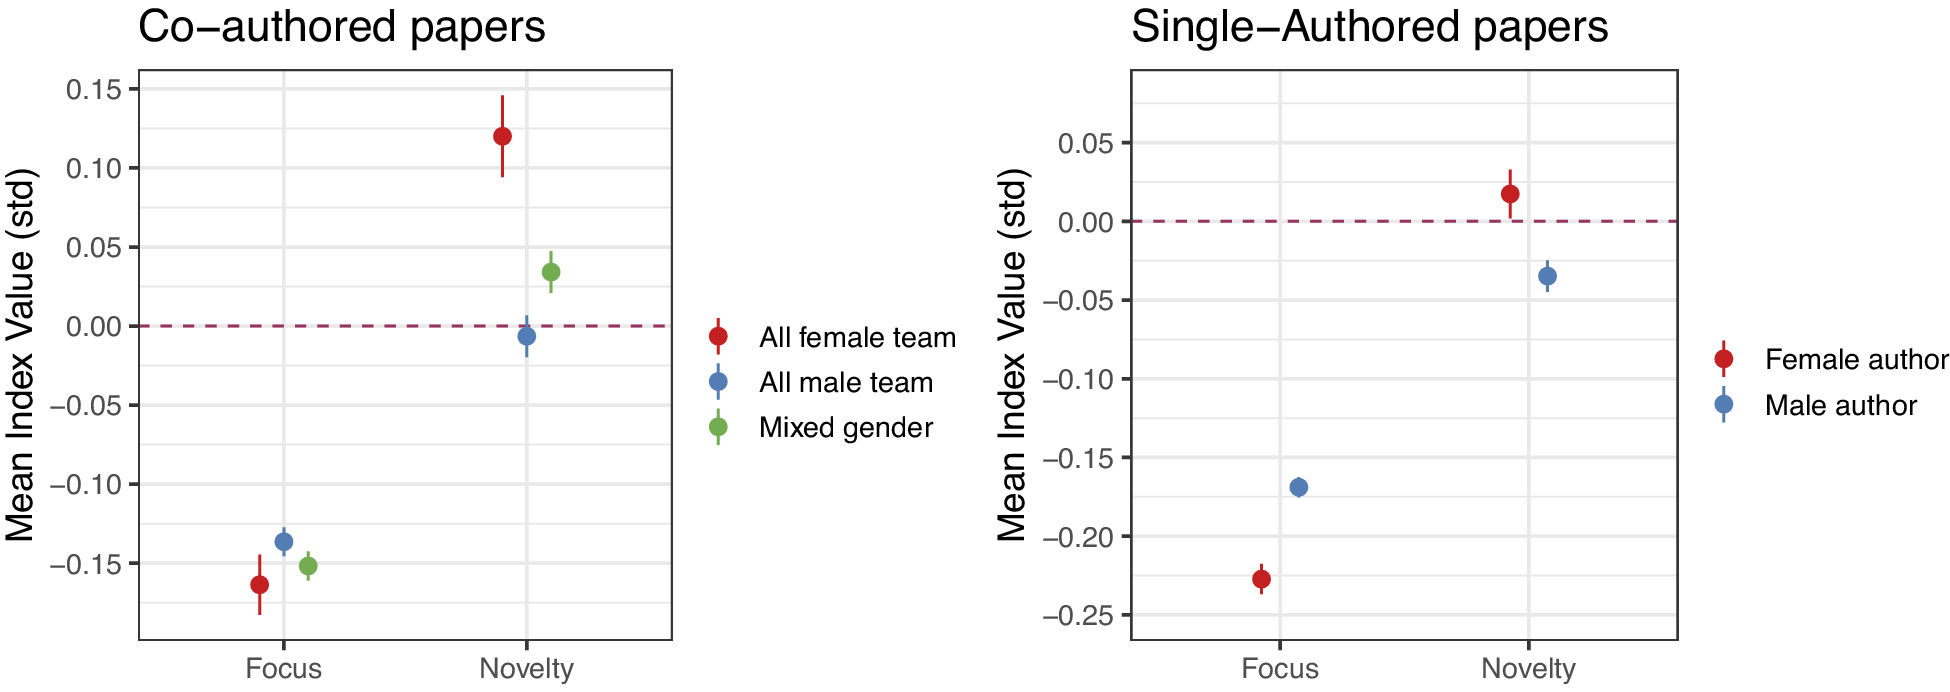
In these analyses, coauthorship teams are a blunt category that captures greater heterogeneity in authors’ research interests and methodological approaches relative to single-authored work. To the degree that coauthorship teams result in more diverse backgrounds, teamwork is associated with topically more novel work. However, we know that team composition varies greatly: some coauthorship teams are made up of researchers with similar backgrounds, whereas other teams might include researchers of different genders, seniority, and substantive focus. In figure 9, we explore one dimension of diversity: gender. Specifically, following Yang et al. (Reference Yang, Tanya, Teresa, Woodruff and Uzzi2022), we probed whether diversity in the gender of team members is related to novelty and topical focus by examining how these indices differ with the gender composition of coauthorship teams. As a benchmark, we examined how gender in single-authored papers correlates with the same measures.
Average Differences in Focus and Diversity by Team Gender Composition
Notes. The left panel plots the mean focus and novelty indices and 95% confidence intervals for coauthored papers written by all-female teams (in red), all-male teams (in blue), and teams of mixed gender (in green). The right panel plots the mean focus and novelty indices and the 95% confidence intervals for single-authored papers written by female authors (red) and male authors (blue).

In figure 9, we subset the sample, analyzing only papers where we could construct both topical focus and topical diversity indices. We standardized both indices for ease of comparison. The first striking result, shown in the left panel, is that the gender composition of teams is associated with no differential topical focus of published papers, consistent with results from table 2. However, when it comes to topical novelty, all-female teams publish the most novel papers, followed by mixed-gender teams and all-male teams. Comparing the right panel with the left, we can see that, overall, single authors regardless of gender publish papers that are slightly less topically focused than those produced by teams. Further, solo male researchers publish the least topically novel work.
Results from figure 9 are in tension with recent findings showing that gender-diverse teams produce more novel research (Yang et al. Reference Yang, Tanya, Teresa, Woodruff and Uzzi2022). Indeed, in our data as well, mixed-gender teams produced more novel research than single-gender teams: when pooling all-female teams with all-male teams, as do Yang et al. (Reference Yang, Tanya, Teresa, Woodruff and Uzzi2022), the average novelty score is lower than that of mixed-gender teams. This result, however, obfuscates the fact that all-female teams produce, on average, the most novel research in the discipline. In contrast, all-male teams produce, on average, the least novel output.Footnote 13
Novelty, Focus, and Publication Success
We have characterized research choices as strategies incentivized by the increasing pressure of metric-based evaluation systems. This section examines whether topical focus and novelty strategies yield career benefits that could motivate their adoption. The literature offers mixed predictions. Some studies find that novelty receives recognition in the scientific community (Antons, Joshi, and Salge Reference Antons, Joshi and Salge2019; Heiberger, Galvez, and McFarland Reference Heiberger, Galvez and McFarland2021). In contrast, others suggest that novel research follows a “high risk/high reward” pattern, with greater variance in outcomes and delayed recognition (Wang, Veugelers, and Stephan Reference Wang, Veugelers and Stephan2017). The consequences of topical focus remain unclear, with potential benefits from specialization (deeper insights, becoming a touchstone) competing against advantages of a broader appeal (Heiberger, Galvez, and McFarland Reference Heiberger, Galvez and McFarland2021).
We focused on two measures of paper-level success: citation counts and a journal’s impact factor. Citation counts are widely regarded as a measure of publication success because they reflect how much a research work influences the scientific community. This makes citation counts a good proxy for the paper’s impact: higher citation counts often indicate greater recognition, contribution, and relevance within a given field. Raw citation counts, however, have several limitations. They vary significantly across fields (e.g., American politics versus political theory), publication types (e.g., original articles versus book reviews), and periods. Put simply, specific fields, publication types, and later periods produce more publications and (hence mechanically) more citations than others (Waltman Reference Waltman2016). We addressed these limitations by normalizing citation counts by the year a publication appeared and document type.
We (partially) accounted for field diversity in citation counts by using journal placement. Specifically, we compared citation counts within journals and accounted for secular trends in citations because time since publication increases the likelihood of citation. By standardizing citations within journal-years, we could better assess the impact of these trends. The citation count standardized within year and journal tracks whether a specific paper garnered more citations than other papers published in the same year and outlet, allowing us to control for journal-level differences in popularity.Footnote 14 Because both indices have different scales, we transformed them to standard deviations, which allowed us to compare the magnitude of differences. We estimate the following model:
 $$ {\mathrm{Success}}_{ia}={\beta}_1\;{\mathrm{Index}}_{ia}+{\gamma}_a+{\varepsilon}_{ia} $$
where $ {\mathrm{success}}_{ia} $
is a measure of paper-level success, either the standardized count of citations or a binary variable that takes the value of one if paper
$ {\mathrm{success}}_{ia} $
is a measure of paper-level success, either the standardized count of citations or a binary variable that takes the value of one if paper $ i $
is published in a top-20 journal and zero otherwise.
$ i $
is published in a top-20 journal and zero otherwise. $ {\mathrm{Index}}_{ia} $
measures the standardized novelty or topical focus of paper
$ {\mathrm{Index}}_{ia} $
measures the standardized novelty or topical focus of paper $ i $
, published by author
$ i $
, published by author $ a $
;
$ a $
; $ {\gamma}_a $
are author-fixed effects; and
$ {\gamma}_a $
are author-fixed effects; and $ {\varepsilon}_{ia} $
are robust standard errors clustered at the author-paper level. We report results in table 3.
$ {\varepsilon}_{ia} $
are robust standard errors clustered at the author-paper level. We report results in table 3.
Association between Topical Novelty, Topical Focus, and Publication Success

* p $ < $
0.05; ** p
$ < $
0.05; ** p $ < $
0.01; *** p
$ < $
0.01; *** p $ < $
0.001.
$ < $
0.001.
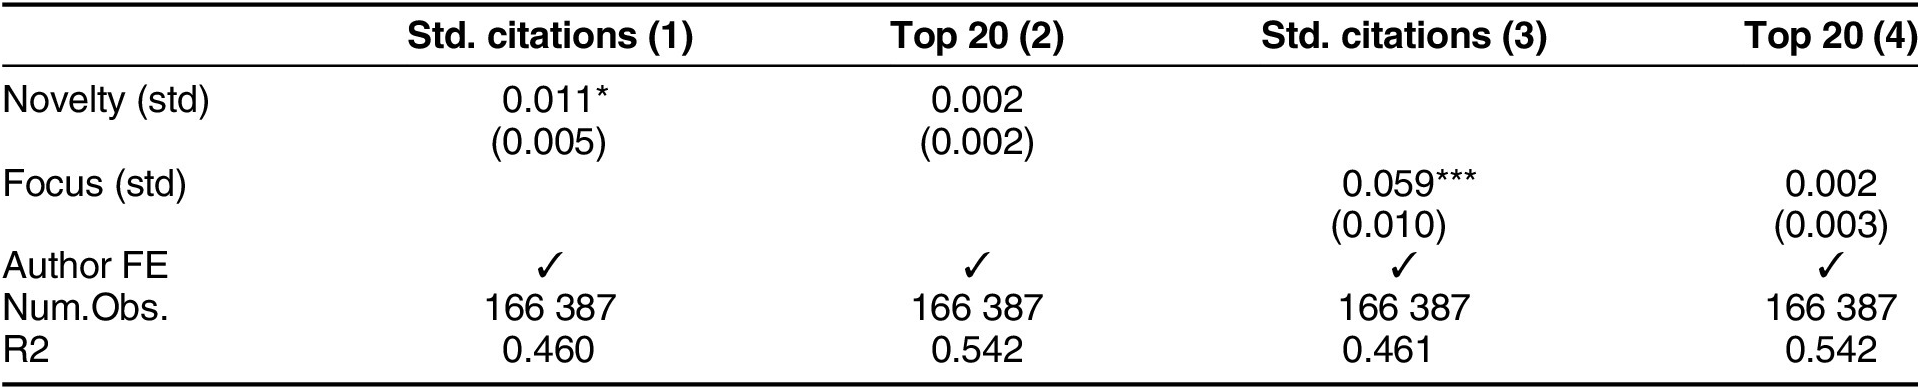
Notes. Columns (1) and (3) show the estimated change in standardized citations (within journal-year) associated with a one standard deviation increase in novelty and focus indices, respectively. Columns (2) and (4) show the estimated change in probability of publication in a top-20 journal. All models include author-fixed effects. Robust standard errors clustered at author and paper level in parentheses.
When comparing papers published in the same year and outlet, a one standard deviation increase in the novelty index is associated with a 1.1% of a standard deviation increase in the number of citations after accounting for all time-invariant author-level characteristics, the preferred specification. Regarding topical diversity, a one standard deviation increase in the focus index is associated with an increase in the number of citations of 5.9% of a standard deviation. However, topical focus and topical novelty are both statistically unrelated to the probability that a paper is published in a top-20 political science outlet with this specification.
Overall, the results suggest that although novel and focused papers perform (marginally) better in terms of citations than other contemporaneous papers published in the same outlets, they are not systematically more likely to be published in high-impact outlets. This finding aligns with research indicating that novelty is a risky strategy, only occasionally yielding significant rewards (Wang, Veugelers, and Stephan Reference Wang, Veugelers and Stephan2017). Top journals in the discipline are not risk-prone. Novel papers are not more likely to be published in prestigious outlets, but once published, they can accumulate citations as their value becomes recognized. In appendix figure H10, we show that more novel papers perform the same as less novel papers for the first 5–10 years after publication. After this, more novel papers become better cited, on average. Similarly, focused research is less likely to be published in a high-impact journal, potentially finding a place in lower-impact but more specialized journals, where it eventually receives attention from the right audience and becomes more frequently used by scholars relative to comparable papers published in the same year and outlet.
These results have implications for structural inequality along seniority and gender lines in the discipline. First, if novel research is recognized only in the long run, and female teams produce more novel research, then the discipline’s evaluation structure may disproportionately disadvantage female scholars. Second, if novel research is rewarded only in the long run while hiring and promotion committees increasingly assess scholars based on publication metrics, then this delayed recognition directly conflicts with tenure timelines, discouraging early-career scholars who need to clear these hurdles from pursuing novel research.
Methods
Career incentives shape not only what is studied but also how it is studied. The “credibility revolution” in political science has shifted standards of credible research, particularly in top-tier journals (Torreblanca et al. Reference Torreblanca, Dinneen, Grossman and Xu2025). This transformation has prioritized rigorous causal identification and research design. Assume that scholars internalize these standards under competitive pressure, rather than heeding calls for methodological pluralism. In that case, we should expect a discipline-wide shift toward quantitative methods, especially in prestigious outlets where career rewards concentrate. Following Pion-Berlin, Cleary, and Monroe (Reference Pion-Berlin, Cleary, Monroe and Monroe2005), we tested this by classifying papers into four methodological categories—quantitative, qualitative, normative, and formal theory—using maximum likelihood estimation and ChatGPT (appendix section G).
We highlight three trends. First, the share of political science papers in our sample that use quantitative analysis (blue lines in figure 10) has increased substantially over the past two decades. In 2003, only 45% of papers published in political science used quantitative methods; by 2023, that share had grown to 57% of published papers (figure 10, top-right panel). This trend is accentuated in the top-20 outlets (bottom-right panel). Second, the proportion of political science papers in our sample that rely exclusively on qualitative methods has remained constant at around 30% throughout the study period (top-right panel). However, the share of exclusively qualitative papers has decreased significantly (by more than 50%) in the top journals of the discipline over the past two decades (bottom right).Footnote 15 Notably, the number of books, which tend to be more qualitative than articles, published by political scientists each year has also been in steady decline since peaking in 2015 (see appendix figure E7). Third, although the yearly output of normative theory papers (green lines) has constantly hovered around 1,000 throughout the period (top-left), the share of normative papers has decreased substantially from 17% of papers in 2003 to 10% in 2023 (top-right).
Research Method Trends in Political Science: All Outlets vs. Top-20 Journals
Notes. The top-left panel shows the number of papers published in all political science outlets each year, classified as qualitative (in red), quantitative (in blue), normative (in blue), and formal (in purple). The top-right panel shows the proportion of all published papers by method over all published papers that year. The bottom row shows the same analyses but only papers published in the top-20 political science outlets per SJR ranking.

In an increasingly collaborative discipline, it is important to understand how methodological preferences differ based on team composition. Given the growing importance of quantitative methods in the discipline, one might expect researchers to adapt by collaborating with other, more quantitative scholars. Figure 11 reveals two insights in this respect. First, collaboration facilitates quantitative work regardless of the team’s gender composition, with coauthored papers more likely to use quantitative methods than single-authored papers. This finding suggests that an increase in collaboration is partly driven by a discipline that increasingly rewards quantitative work. Second, solo female authors are significantly more likely to publish qualitative research than other team compositions. This methodological preference may help explain publication gaps in top-tier journals (Breuning et al. Reference Breuning, Gross, Feinberg, Martinez, Sharma and Ishiyama2018), which favor quantitative research. These patterns highlight how collaboration and gender intersect to shape methodological choices in the discipline.
Difference in Probability of Publishing Quantitative or Qualitative Research by Team Gender Composition
Notes. Difference in probability is relative to male single-authored papers. Linear probability model with year-fixed effects. Error bars show 95% confidence intervals.

In sum, the methodological landscape has undergone significant transformation over the past 20 years, with quantitative approaches increasingly dominating prestigious journals—increasing from 70% in 2003 to 85% in 2023 in top-20 outlets—while exclusively qualitative work has declined by more than half in the overall political science mainstream (from 15% to 7%).Footnote 16 This methodological stratification aligns with our findings on topics, revealing a two-tiered system in which top outlets predominantly publish quantitative research. If publishing in a top-tier outlet requires writing a quantitative paper, then career incentives likely encourage researchers to adopt quantitative methods to secure publications in more prestigious venues. Meanwhile, qualitative and normative work remains viable primarily in less prestigious journals, further reinforcing the division between methodological approaches in the discipline. Moreover, this quantitative split parallels dimensions of gender and collaboration, with male authors and teams being the most likely to use quantitative methods (Teele and Thelen Reference Teele and Thelen2017). Given the disproportionate representation of quantitative papers in top journals, understanding the gender dynamics of methodological preference is critical to understanding any gender-based structural inequality in the discipline (Dion, Sumner, and Mitchell Reference Dion, Sumner and Mitchell2018). This is a promising avenue for future work.
Discussion
More than three decades ago, the APSA-commissioned assessment of the discipline noted that “political science is in a period of great vitality and increasingly rapid research development” (Finifter and Association Reference Finifter1993, p. ix). Our analysis of more than140,000 papers published in political science journals over the last two decades shows that this assessment remains accurate. However, the drivers and nature of this vitality have undergone fundamental changes. APSA eJob postings show more tenure-track positions in 2007 than in 2017, despite the discipline’s expansion. Yet more political scientists publish than ever. This tension—contracting positions alongside increasing numbers of researchers—illuminates the structural pressures reshaping the discipline.
We examine how this pressure has influenced the production of knowledge in political science, a rapidly growing discipline with an annualized growth rate of approximately 5%, resulting in the number of papers doubling every 13 to 14 years. We find that this growth stems primarily from an influx of researchers publishing in political science outlets and, to a lesser extent, from individual productivity gains. Younger cohorts are more productive than older peers, publishing more papers inside and outside the discipline. This comes partly at the expense of books and book chapters—an adaptation to market pressure.
Applying STM to our corpus, we show which topics gained and lost prominence, although this popularity is not always reflected in the top-20 journals. The discipline maintains a wide topical breadth overall. However, individual papers have become more topically focused. This specialization is rewarded: focused papers receive higher citations than broadly focused work in the same outlet and year. Topical novelty presents a different picture. Novel research is not preferentially placed in top journals and receives only weak citation rewards. We find a gendered dimension to these patterns: all-female teams produce more novel research on average, whereas all-male teams concentrate on incremental work. Finally, we document a methodological shift toward quantitative research and away from normative and qualitative work.
Our study advances existing literature on knowledge production in political science by combining comprehensive scope with methodological innovation. Prior work examined inequality along authorship patterns (Fisher et al. Reference Fisher, Cobane, Vander Ven and Cullen1998), gender composition (Teele and Thelen Reference Teele and Thelen2017), and methodological representation (Kasza Reference Kasza2010); tracked broad trends via bibliometrics (Barcelo et al. Reference Barcelo, Paik, van der Windt and Zhai2025; Carammia Reference Carammia2022); or applied machine learning within narrow windows (Mas-Verdu et al. Reference Mas-Verdu, Garcia-Alvarez-Coque, Nieto-Aleman and Roig-Tierno2021; Saraceno Reference Saraceno2020). We introduced measures of topical novelty and focus and provided tools for understanding how competitive pressures shape publication volume, intellectual content, and methodological choices. We also introduced a publicly available dataset of metadata for papers published in political science journals over 21 years, classifying each by method, novelty, and topical focus. These measures and data enable future research to assess the development of the discipline and help distinguish incremental from transformative work.
Overall, we find a discipline transformed by structural pressures, with more voices, more collaboration, and more output. What does this augur for political science? Competitive pressure may improve quality by selecting higher-performing researchers. Yet, the same pressures constrain the individual scientist who has to navigate a complex and fraught disciplinary landscape.
Data replication
Data replication sets are available in Harvard Dataverse at: https://doi.org/10.7910/DVN/O9SUR0.
Supplementary material
To view supplementary material for this article, please visit http://doi.org/10.1017/S1537592725104179.
Acknowledgments
We thank Irene Tang for setting up the data pipeline and Shuning Ge for estimating the Structural Topic Models. We thank Noa Rubinstein, Micaela Montero Johnson, Ria Rege, Clarice Wang, Erika Kishino, and Arihant Tripathi for research assistance; Allison Macdonald for sharing APSA’s historical eJobs data; and Yiqing Xu for comments on an earlier draft.


 Open access