

Introduction
Impact generated sulphate deposits and significance for life
Hydrothermal deposits within craters on Mars represent one of the most important targets in the search for life on Mars (Cabrol et al. Reference Cabrol1999; Newsom et al. Reference Newsom, Hagerty and Thorsos2001). Hydrothermal systems are realistic sites to sustain life due to the presence of liquid H2O, heat and dissolved nutrients and alkaline vents within these systems are considered to be locations where life could originate (Farmer & Des Marais Reference Farmer and Des Marais1999; Newsom et al. Reference Newsom, Hagerty and Thorsos2001; Osinski et al. Reference Osinski, Spray and Lee2005; Lane & Martin Reference Lane and Martin2012). Over 60 impact craters with associated hydrothermal activity have been discovered on Earth, and given the long bombardment history of Mars, impact craters could be a common site to search for life (Chapman & Jones Reference Chapman and Jones1977; Naumov Reference Naumov, Plado and Pesonen2002). Gale Crater has sulphates present within a layered sedimentary mound in the centre of the crater, named Mount Sharp, thought to be formed by hydrothermal springs, as there is a lack of features associated with lacustrine environments such as terraces, deltas and fans. (Rossi et al. Reference Rossi2008; Thomson et al. Reference Thomson2011; Schwenzer et al. Reference Schwenzer2012). Semi-hydrated Ca-sulphate, bassanite has been identified in Mawrth Vallis, one of the proposed landing sites for the ExoMars 2020 mission (Wray et al. Reference Wray2010).
The Eocene Haughton impact crater, located on Devon Island in the Canadian High Arctic Archipelago, provides a useful analogue site to study post impact sulphate deposits (Sherlock et al. Reference Sherlock2005). It is exceptionally well preserved, which is why it has been extensively studied, and has examples of sulphate deposits containing microbial life (Osinski & Spray Reference Osinski and Spray2001; Parnell et al. Reference Parnell2004). The current structure is composed of a central uplift overlaid with melt breccia, which is the most common impactite (Lindgren et al. Reference Lindgren2009). There is a gneissic crystalline basement, which is shocked and is inhabited by endolithic photosynthetic microorganisms. These organisms are more abundant in the shocked material due to an increased pore space as a result of impact fracturing, and increased translucence due to vaporization of opaque mineral phases (Cockell et al. Reference Cockell2002). The target rock included gypsum bearing carbonate rocks, Ordovician in age (Robertson & Sweeney Reference Robertson and Sweeney1983). Impact remobilized sulphate occurs as selenite, a transparent form of gypsum (CaSO4.2(H2O)), which cross-cuts the melt breccia as veins. Viable, extant cyanobacterial colonies are present within the selenite and are black in colour due to the UV protective pigments scytonemin and gloeocapsin (Cockell et al. Reference Cockell2002, Reference Cockell2003). Mobilization still occurs at present in the form of evaporitic crusts on bedrock surfaces and soil (Parnell et al. Reference Parnell2004).
Given that sulphates formed by hydrothermal activity are habitable substrates, and that shocking increases the space for an organism to exploit; shocked sulphates are important targets with which to find evidence of microbial life. If instrumentation could distinguish between shocked and un-shocked phases, and between various sulphate phases, this would be beneficial when identifying the most likely sulphates to contain life signatures.
Raman for Mars
Raman spectroscopy uses a monochromatic laser light source to irradiate a sample. Majority of the light, which interacts with the sample is scattered elastically, with no change in wavelength. However a small proportion of the light is scattered inelastically – either an increase or decrease in wavelength, known as Raman scattering. Raman spectroscopy produces a vibrational ‘fingerprint’, which is dependent on the vibrational state of molecules in a given compound (Ellery & Wynn-Williams Reference Ellery and Wynn-Williams2003).
The popularity of Raman spectroscopy has dramatically increased in the last 30 years due to its increasing range of applications (Pérez & Martinez-Frias Reference Pérez and Martinez-Frias2006). It is a useful astrobiological tool as it is a non-destructive technique, which is able to be miniaturized. It is sensitive to carbonaceous materials, which is one of the main targets of the ESA ExoMars mission but it is also sensitive to various microbial pigments, such as chlorophylls, carotenoids and scytonemin, which increase its appeal (Ellery & Wynn-Williams Reference Ellery and Wynn-Williams2003; Jehlička et al. Reference Jehlička, Edwards and Oren2014). It has a wavelength range covering most vibrational modes including carbonates, silicates and sulphates (i.e. most rock-forming minerals), therefore it can also be used for petrographic analysis (Haskin et al. Reference Haskin1997; Wang et al. Reference Wang, Haskin and Cortez1998).
Raman spectroscopy of gypsum and impact shocked gypsum
The Raman spectrum of gypsum characteristically shows a narrow intense band around 1008 reciprocal centimetres (cm−1), which is the v1 sulphate symmetric stretching mode, herein referred to as v1 sulphate band. The stretching modes of water occur around 3450 cm−1 (Berenblut et al. Reference Berenblut, Dawson and Wilkinson1970; Krishnamurthy & Soots Reference Krishnamurthy and Soots1971), shown in Fig. 1.
Extended spectra 100–4000 cm−1 showing v1 sulphate symmetric stretching mode (1007.89 cm−1) and stretching mode of H2O (~3450 cm−1).

The astrobiological community is interested in the effect of shocking on sulphates as they occur on Mars. Micro-scale deformation experiments of gypsum by Hogan et al. (Reference Hogan2012), show that the v1 sulphate band is least intense at the centre of deformation, where most load was experienced, and most intense at the outer margins of the deformation structure where least load was experienced. This is evidence that shocking reduces the v1 sulphate stretching band intensity. Instantaneous compressional deformation occurs in both meteorite (macro) shock events and micro-indentation experiments.
The effects of shock on gypsum have been discussed by Ramkissoon et al. (Reference Ramkissoon2014), using impact shock experiments with a two stage light gas gun and projectile, fired at plaster of Paris (gypsum). Their experiments show that devolatilization occurs as a result of the impact, based on the disappearance of water molecule bands around 3450 cm−1, and the shift of bands 427 and 487 cm−1, is indicative of anhydrite. Characterizing the dehydration of gypsum to anhydrite using Raman spectroscopy has been well studied and shows the sulphate stretching band exhibiting an increase in band position with increasing dehydration (Prasad et al. Reference Prasad, Pradhan and Gowd2001; Liu et al. Reference Liu, Wang and Freeman2009).
Bucio et al. (Reference Bucio2015) used experimentally impact-shocked gypsum to characterize post-impact phases using Raman spectroscopy and X-ray diffraction (XRD). This study compared Raman spectra obtained from naturally shocked samples with Raman spectra obtained from experimentally impact-shocked gypsum, published by previous authors, to assess if the spectral changes associated with shock are comparable, and ultimately if shocked gypsum can be differentiated from other phases of gypsum. The spectral changes were analysed by comparing v1 sulphate band positions against band widths, referred to as the full width at half maximum (FWHM).
Methods
Samples
Gypsum samples were separated into four groups:
-
(1) Unaltered gypsum – samples which have not experienced shock or dissolution and subsequent re-precipitation. The crystal habits range from grainy to massive or fibrous.
-
(2) Selenite – a transparent form of gypsum, which has a distinct platy crystal habit. Selenite at the Haughton structure formed by the dissolution of gypsum in the target rock, and circulated the structure before re-precipitating as selenite.
-
(3) Crusts – sulphate rich waters at the Haughton flows over the surface topography and slowly evaporates, leaving a mineral ‘crust’ on outcropped rock and soil.
-
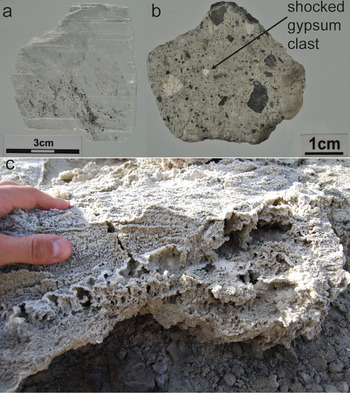
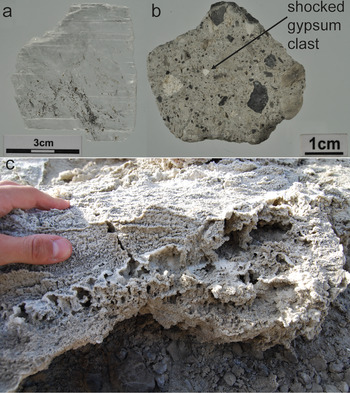
(4) Shocked gypsum – samples include a primary shocked gypsum nodule, and shocked gypsum fragments within melt breccia (see Fig. 2).
Fig. 2.Sample photographs. (a) Selenite, Haughton crater (S2), showing black pigmentation of bacterial colonies. (b) Melt breccia, Haughton crater (SH1), showing fragment of shocked gypsum. (c) Evaporitic gypsum crust, Haughton crater (C1).

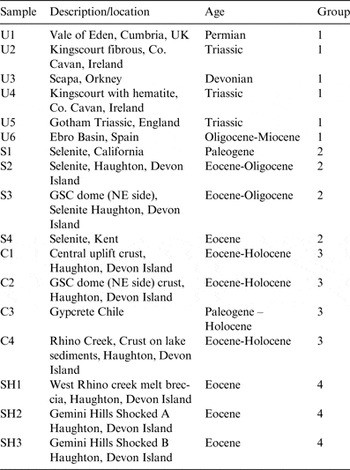
The majority of the samples originate from the Haughton impact crater, Devon Island, Canada; see Table 1 for more information on sample locations and ages. Minimal sample preparation was employed, simulating capabilities during a remote mission on Mars. If necessary, samples were cut to expose the sulphate, however where possible rough untreated surfaces were analysed. This study would be equally appropriate for the NASA 2020, SHERLOC instrument, which will have spatial mapping capabilities (Beegle et al. Reference Beegle2015).
Table of sample locations and ages
Raman spectroscopy configuration
Raman spectra were obtained using a Renishaw InVia H36031 confocal Raman microscope operating at a wavelength of 514.5 nm green monochromatic laser light, which is similar to the ExoMars flight instrument wavelength of 532 nm (Rull et al. Reference Rull2011). The laser power was 0.3 mW, avoiding laser induced heating of samples. A 50 × objective lens was used giving a laser ‘footprint’ of 1–3 µm in diameter, with an extended spectral range of 100–2000 cm−1. 10 s exposure time and 1 accumulation were acquired for each spectrum, giving a good signal-to-noise ratio. To include the stretching modes of water molecules, extended wavelength (100–4000 cm−1) was also measured using the above settings. Spectra were processed using a smooth, baseline subtraction and peak fit functions using WiRE 2.0 software. Peak fitting used a mixture of Gaussian and Lorentzian algorithms.
X-ray diffraction
Diffraction patterns were acquired on powder samples by using an X'Pert diffractometer (PANalytical, NL) equipped with Cu-kα radiation (1.54 Å; 45 kV/40 mA) in θ–θ reflectance geometry; data were collected from 5° to 80° 2θ with a step size of 0.013° and a time-per-step of 13.77 s. Crystalline phases were identified by comparison with ICDD PDF # [01-074-1433] (Gypsum). Samples were powdered by hand using a pestle and mortar.
Spectral parameter analysis
Ten spectra were obtained from each sample and average FWHM were plotted against sulphate band positions. Statistical variance tests were used to determine if sample groups are statistically different from each another.
Statistical analysis
Overlapping sample fields were examined using SigmaPlot statistical software package to confirm if the groups were statistically different. The sample groups failed the normality test therefore a non-parametric test was used. As two independent groups were compared, a Man–Whitney U test was used.
Results
Raman spectroscopy
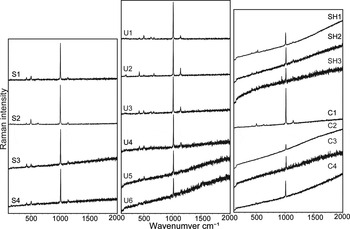
The spectra obtained across the sample set all show a v1 sulphate band position of around 1008 cm−1, which is indicative of gypsum (Krishnamurthy & Soots Reference Krishnamurthy and Soots1971), shown in Fig. 3. The shocked samples, SH2 and SH3, show a sloping baseline with increased signal-to-noise ratio compared with other samples e.g. selenite. Additionally the shocked samples show a weaker Raman signal, with lower band intensities. The spectra from evaporitic crusts are similar spectra to that of shocked samples, with low intensity bands and a higher signal-to-noise ratio, a part from the central uplift crust, which has an improved signal-to-noise ratio. The selenite group, have the cleanest spectra with intense v1 sulphate bands and a better signal-to-noise ratio relative to the shocked samples. Unaltered samples show similar spectra to selenite, except from U6 and U5, which have increased signal-to-noise ratios. Average v1 band positions for each are; unaltered (U) – 1009.615, selenite (S) – 1009.261, shocked (SH) – 1008.251, crusts (C) – 1008.262 cm−1. Based on these band positions all samples are classed as gypsum and have not experienced dehydration.
Extended Raman spectra for gypsum (100–2000 cm−1). x-axis is Raman shift in reciprocal centimetres (cm−1). y-axis is Raman intensity in arbitrary units (a.u.). ‘SH’ spectra have experienced shock from meteoric impact. ‘C’ spectra are gypsum samples, which have been dissolved then re-precipitated as evaporitic crusts. ‘S’ spectra are selenite, a transparent form of gypsum. ‘U’ spectra are from unaltered gypsum samples unaffected by shock or dissolution and re-precipitation.
X-ray diffraction
Eight gypsum samples were selected from the larger sample set for XRD analysis (Fig. 4), which cover the 4 Ca-sulphate groups. The cell parameters for each sample show that all eight samples are in the form of gypsum. It is common for impact shocked sample to experience partial or complete dehydration, however basanite or anhydrite phases are not found in specimen SH3, which is consistent with the Raman measurements obtained.
X-ray diffraction patterns.

Discussion
Raman spectroscopy – extended spectra
Selected samples were re-analysed using an extended wavelength range (100–4000 cm−1), to include the stretching modes of water molecules, shown in Fig. 5. An anhydrite control is included to show a completely dehydrated phase. As expected the anhydrite control shows a v1 sulphate band position of 1015.39 cm−1, and does not show the stretching modes of water molecules around 3450 cm−1. Sample SH1 has a fragment of gypsum, and the spectrum shows a v1 band position of 1007.52 cm−1, which is indicative of gypsum, although it does not show the presence of water molecules at the expected wavelength. As shocking promotes devolatilization, the loss of H2O molecules would be expected, and is well documented by other authors. Additionally, a change in v1 band position from 1008 to 1015 cm−1, would also be expected. Sample SH2 shows a band position of 1006.24 cm−1, and has the stretching modes of water molecules. This is indicative of gypsum, and suggests that either no dehydration has occurred, or that the specimens have been rehydrated.
Extended Raman spectra for gypsum and anhydrite (100–4000 cm−1). Spectra include v1 sulphate stretching mode and H2O molecule stretching mode around 3500 cm−1.

Experimental work by Ramkissoon et al. (Reference Ramkissoon2014) and Bucio et al. (Reference Bucio2015), clearly show that shocking by impact generates, semi-hydrated and completely hydrated Ca-sulphate phases in the form of basanite and anhydrite, respectively. This can be seen in the v1 sulphate band positon and the presence, or absence, of the stretching modes of water molecules. This relationship does not appear to be realized in naturally impact shocked Ca-sulphates from Haughton crater.
v1 band position against band FWHM
The sulphate band position was plotted against the FWHM to determine if these Raman parameters could distinguish between the gypsum specimens. Fig. 6(a) shows the four types of gypsum used in this study presented as fields. Each point is an average of ten spectra. Selenite has the largest field, which overlaps with unaltered samples. Selenite and unaltered fields plot independently from shocked or crust fields, showing that Raman spectroscopy can distinguish between certain phases of gypsum. The shocked field plots on the edge of the crusts field. Samples with overlapping fields were analysed for statistical significance. No significant difference was found between the shocked and crust sample band positions (P = 0.966, Mann–Whitney Sum test) and FWHM (P = 0.251), indicating that Raman spectroscopy cannot currently distinguish between impact shocked gypsum and gypsum, which has been dissolved and re-precipitated as a mineral crust. In contrast, a significant difference is evident between selenite and unaltered sample band positions (P = 0.045) and FWHM (P = 0.020). This shows that using the sulphate v1 band position versus FWHM, differences between gypsum phases are evident. Raman can therefore identify gypsum phases with enhanced habitability.
Sulphate band position against sulphate band full width at half maximum (FWHM), with each point representing an average of ten spectra. x-axis, is the sulphate (v1) band position in reciprocal centimetres (cm−1). y-axis, is the sulphate (v1) FWHM. (a) Samples are separated into their geological groups. (b) Samples are distinguished by sample classification (Table 1). (c) Samples are distinguished based on crystal size. Squares denote a crystal size <0.5 cm; diamonds denote a crystal size between 0.5 and 2 cm; circles denote a crystal size >2 cm.

Figure 6(b) distinguishes samples according to their classification in Table 1. Figure 6(c) distinguishes samples according to crystal size, which was determined petrographically. However, there does not appear to be any control based on crystal size.
Conclusions
A range of gypsum samples were analysed using Raman spectroscopy, to determine if this technique can differentiate between Ca-sulphates, which have enhanced habitability, and those that do not. Results show that Raman spectroscopy cannot currently determine a significant difference between gypsum, which has been shocked by meteoric impact (enhancing the habitability), and gypsum, which has been dissolved and re-precipitated as an evaporitic crust. Raman spectroscopy is able to differentiate between unaltered gypsum and selenite by plotting v1 sulphate band position against v1 sulphate band FWHM, and as selenite has been found with viable extant microbial colonies at Haughton impact crater, it is regarded as having enhanced habitability.
The presence of H2O bands in spectra obtained from shocked samples highlights the complexity of Raman spectra observed from naturally shocked samples compared with experimental shock studies. This indicates current capabilities of Raman spectroscopy, for the interpretation of gypsum habitability, prior to its use on the European Space Agency's ExoMars 2020 mission.
Acknowledgements
This work was funded by STFC grant ST/L001233/1. The University of Aberdeen Raman facility was funded by the BBSRC grant BBC5125101. Thanks to Jo Duncan for XRD assistance.



 Open access

