


Introduction
Trypanosomatids are unicellular eukaryotes that differ from other eukaryotes in their maintenance of intracellular thiol redox homoeostasis using trypanothione and trypanothione reductase (TR) (Krauth-Siegel and Comini, Reference Krauth-Siegel and Comini2008). Unique aspects of trypanosomatid biology can be exploited as therapeutic targets in the treatment of human African trypanosomiasis (HAT; sleeping sickness), American trypanosomiasis (Chagas disease) and Leishmaniases (including both the cutaneous and visceral forms), which collectively affect the health of more than 1 billion people globally (Alcântara et al., Reference Alcântara, Ferreira, Gadelha and Miguel2018). Because they contain enzymes and features unique to trypanosomatid biology, pathways for the biosynthesis and utilization of trypanothione have been an ongoing focus of antitrypanosomal drug development (Richardson et al., Reference Richardson, Nett, Jones, Abdille, Gilbert and Fairlamb2009; Equbal et al., Reference Equbal, Suman, Anwar, Singh, Zaidi, Sardar, Das and Ali2014; Agnihotri et al., Reference Agnihotri, Singh, Shakya and Pratap2016).
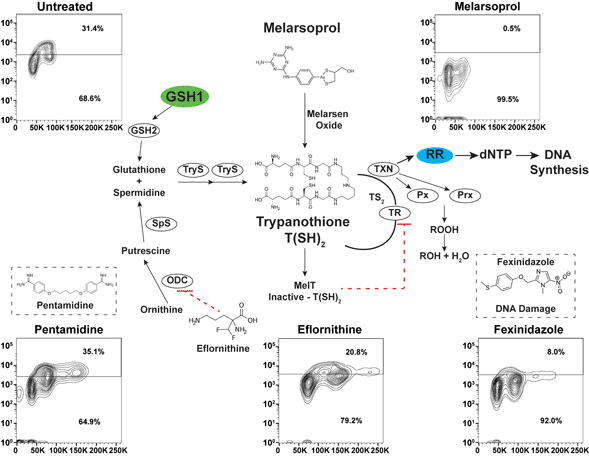
Trypanothione [N1,N8-bis(glutathionyl) spermidine] biosynthesis relies on the formation of glutathione from γ-glutamylcysteine synthetase (GSH1) and glutathione synthetase (GSH2). Ornithine decarboxylase (ODC) and spermidine synthetase enzymes produce the spermidine for trypanothione synthesis from ornithine via a putrescine intermediate (biosynthetic pathways summarized in Fig. 1A) (Krauth-Siegel and Comini, Reference Krauth-Siegel and Comini2008). The conjugation of two molecules of glutathione and spermidine is catalysed by the trypanosome-specific enzyme trypanothione synthetase in two steps, generating trypanothione [abbreviated T(SH)2]. In the cytosol, T(SH)2 reduces protein disulfides including thioredoxin and the trypanosomatid-specific oxidoreductase tryparedoxin (TXN). TXN can detoxify hydroperoxides (ROOH), converting them to alcohol (ROH), and delivers electrons to ribonucleotide reductase (RR) whose reduced form is required to form dNTPs for DNA synthesis (Krauth-Siegel and Comini, Reference Krauth-Siegel and Comini2008).
Antitrypanosomal drugs: effects on cell cycle and DNA synthesis. (A) Model depicts the enzymes of the trypanothione pathway: γ-glutamylcysteine synthetase (GSH1), glutathione synthetase (GSH2), ornithine decarboxylase (ODC), spermidine synthetase (SpS), trypanothione synthetase (TryS), trypanothione reductase (TR), tryparedoxin (TXN), glutathione-peroxidase-type enzymes (Px), 2-cys-peroxidases (Prx) and ribonucleotide reductase (RR). Antitrypanosomal drugs and their association with the pathway are also depicted. (B) Sample gating controls from flow cytometry analysis of cell cycle by propidium iodide (top panel) and DNA synthesis analysis by BrdU incorporation assay (bottom panel). (C) Effects of drugs on cell cycle after 24 h of treatment at the indicated drug concentrations. (D) Effects of DNA synthesis after 24 h of drug treatment followed by 1 h of BrdU incorporation. Flow cytometry data are presented as a single replicate representative of at least three biological replicates.

Melarsoprol is a classic arsenical drug that is critical for the treatment of HAT (caused by Trypanosoma brucei spp.), especially during second-stage infection when the parasites enter the central nervous system (CNS) (Denise and Barrett, Reference Denise and Barrett2001; Fairlamb and Horn, Reference Fairlamb and Horn2018). Melarsoprol treatment is burdened with difficult administration regimens, high host toxicity and naturally occurring drug resistance (Fairlamb and Horn, Reference Fairlamb and Horn2018). Once inside the cell, melarsoprol is converted to melarsen oxide (Fig. 1A), which preferentially binds T(SH)2 (Fairlamb et al., Reference Fairlamb, Henderson and Cerami1989). One-to-one binding of melarsen oxide to T(SH)2 forms the stable adduct MelT, a direct inhibitor of TR function (Fairlamb et al., Reference Fairlamb, Henderson and Cerami1989), which is responsible for the NADPH-dependent reduction of trypanothione disulfide (TS2) back to active T(SH)2. Thus, melarsoprol treatment is expected to impair diverse biological outcomes associated with T(SH)2 functions (Fig. 1A), which has impeded the precise elucidation of the mode of cell killing of melarsoprol.
Determining the mechanism of melarsoprol killing has been further complicated by the fact that arsenicals such as melarsoprol are promiscuous drugs that can react with dithiol groups in neighbouring proteins (Fairlamb et al., Reference Fairlamb, Henderson and Cerami1989). Recently, the clinical significance of melarsoprol has been diminished through the successful use of nifurtimox eflornithine combination therapy and the recent approval of fexinidazole, which can be administered in pill form (Lindner et al., Reference Lindner, Lejon, Chappuis, Seixas, Kazumba, Barrett, Mwamba, Erphas, Akl, Villanueva, Bergman, Simarro, Ebeja, Priotto and Franco2020). The interaction of eflornithine (difluoromethylornithine) with the trypanothione pathway has been precisely elucidated to arise from its function as an ornithine analogue that functions as a chemical inhibitor of ODC, preventing putrescine synthesis (Fonseca et al., Reference Fonseca, Comini, Resende, Santi, Zoboli, Moreira and Murta2017). In T. brucei, cross-resistance can occur between melarsoprol and the aromatic diamidine pentamidine, which has been linked to the transport of both drugs by closely related aquaglyceroporins (Alsford et al., Reference Alsford, Turner, Obado, Sanchez-Flores, Glover, Berriman, Hertz-Fowler and Horn2011). The nitroimidazole drug fexinidazole is providing new promise for the treatment of second-stage T. b. gambiense infections (Deeks, Reference Deeks2019). Fexinidazole is activated by intracellular nitroreductase (NTR) and while the mechanism of action remains unclear, DNA damage arising from nitroimidazole byproducts has been implicated, which warranted its inclusion in this study (Wyllie et al., Reference Wyllie, Patterson and Fairlamb2013, Reference Wyllie, Foth, Kelner, Sokolova, Berriman and Fairlamb2016; Rocha-Garduño et al., Reference Rocha-Garduño, Hernández-Martínez, Colín-Lozano, Estrada-Soto, Hernández-Núñez, Prieto-Martínez, Medina-Franco, Chale-Dzul, Moo-Puc and Navarrete-Vázquez2020). Despite the emergence of improved medicines against T. brucei infections, elucidating the mechanism of melarsoprol-induced cell death would provide critical understanding on the ongoing development of antitrypanosomal therapeutics.
In this study, we focused on evaluating one set of possible outcomes arising from antitrypanosomal in vitro drug treatments in T. b. brucei, namely DNA synthesis. Based on the inhibition of trypanothione through melarsoprol binding, and the requirement of this pathway to generate dNTPs by RR (Hofer et al., Reference Hofer, Ekanem and Thelander1998; Dormeyer et al., Reference Dormeyer, Reckenfelderbäumer, Lüdemann and Krauth-Siegel2001), we hypothesized that melarsoprol treatment would inhibit DNA synthesis. In addition, we predicted that increasing the abundance of intracellular trypanothione, by overexpressing the rate-limiting enzyme in its biosynthesis (GSH1) (Shahi et al., Reference Shahi, Krauth-Siegel and Clayton2002; Fonseca et al., Reference Fonseca, Comini, Resende, Santi, Zoboli, Moreira and Murta2017), would alleviate the predicted DNA synthesis defect. Here we analysed the effects of melarsoprol and other important antitrypanosomal drugs for their effects on cell cycle and DNA synthesis in the context of GSH1 overexpression to determine their interaction with the trypanothione pathway.
Materials and methods
Trypanosoma brucei cell lines, culture methods and cell counting
Cell lines were generated from Lister 427 bloodstream-form parasites derived from the single marker line (Wirtz et al., Reference Wirtz, Leal, Ochatt and Cross1999) and maintained in HMI-9 medium (Hirumi and Hirumi, Reference Hirumi and Hirumi1994) supplemented with serum plus (Sigma-Aldrich Serum Plus Medium Supplement 14008C). GSH1 overexpression cell line was generated by cloning Tb927.10.12370 into pLEW100v5-BSD, followed by transfection into SM by AMAXA Nucleofector (Burkard et al., Reference Burkard, Fragoso and Roditi2007), and evaluated in a previous publication (Carter et al., Reference Carter, Gomez, Gritz, Larson, Silva-Herzog, Kim, Schulz and Hovel-Miner2020). Antitrypanosomal drugs were resuspended in DMSO (melarsoprol, pentamidine and fexinidazole) or water (eflornithine) prior to dilution in HMI-9 at the indicated concentrations and evaluated, generally 24 h post-treatment (unless otherwise indicated in supplemental materials). Cell counting was conducted by haemocytometry and the per cent cell growth inhibition was determined by comparing the number of cells in the treated culture to an untreated control (% cell growth/untreated growth).
Cell cycle analysis by flow cytometry
Standard flow cytometry approaches were used to measure cell cycle progression using propidium iodide (PI) staining of approximately 5 million cells following formaldehyde fixation as described (Pozarowski and Darzynkiewicz, Reference Pozarowski, Darzynkiewicz and Schönthal2004).
Immunofluorescence microscopy
Immunofluorescence analysis was carried out using standard protocols as described previously (Glover et al., Reference Glover, McCulloch and Horn2008). Samples were mounted in Vectashield (Vector Laboratories, Burlingame, CA, United States) containing 4′,6-diamidino-2-phenylindole (DAPI) and evaluated on a Zeiss 710 Spectral confocal microscope to count the number of nuclei (N) and kinetoplasts (K) per cell for 100–200 cells per treatment condition.
BrdU incorporation assays
Exponentially growing T. brucei was prepared for BrdU incorporation assays similar to previously described assays (da Silva et al., Reference da Silva, Muñoz, Armelin and Elias2017a) with empirically determined modifications. Parasites were incubated in HMI-9 medium with 100 mm of 5-bromo-2-Deoxyuridine (BrdU, Sigma Aldrich B5002) for 1 h at 37°C, harvested by centrifugation, washed 2× in PBS and fixed with 1% paraformaldehyde for 20 min. Fixed cells were then permeabilized with 0.1% Triton X-100 for 30 min, treated with 3 m HCl, washed three times in PBS and incubated with anti-BrdU antibody conjugated with Alexa Fluor 647 (1:250 dilution, Thermo Fisher B35140), 1:1000 DAPI (1 mg mL−1) and 0.5% BSA overnight. Prepared cells were then washed with PBS and resuspended before flow cytometry analysis.
Results
Melarsoprol treatment inhibits DNA synthesis
Defects in cell cycle progression have been previously observed during the in vitro treatment of T. brucei with diverse antitrypanosomal drugs (Thomas et al., Reference Thomas, Baker, Hutchinson, Dominicus, Trenaman, Glover, Alsford and Horn2018). To analyse the effects of antitrypanosomal drugs on DNA synthesis, we selected concentrations of drug that resulted in 50–75% inhibition of cell growth after 24 h of treatment [melarsoprol (26 nm), eflornithine (100 mm), fexinidazole (70 mm), pentamidine (5 nm)], which correlates with 2–3× the EC50 from each drug from previous studies (Alsford et al., Reference Alsford, Turner, Obado, Sanchez-Flores, Glover, Berriman, Hertz-Fowler and Horn2011). Cell cycle analysis by DNA density with PI staining showed that treatment with melarsoprol (26 nm) resulted in a 20% reduction in the number of cells in S phase and G2 (from 40% in untreated to 20% during melarsoprol treatment) (Fig. 1C). In contrast, eflornithine treatment caused a minor increase in G2 cells (7%), while fexinidazole and pentamidine treatments caused significant increases in the number of cells in S phase and G2 (17 and 30% increase, respectively – Fig. 1C). Notably, melarsoprol was the only drug treatment analysed here that did not result in an increase in the G2 peak.
Based on the decreased number of cells in G2 during melarsoprol treatment and the established relationship between melarsoprol and trypanothione pathway, we predicted that melarsoprol treatment could be inhibiting DNA synthesis. To test this prediction, we employed a BrdU incorporation assay to measure the proportion of cells synthesizing DNA during drug treatments [protocol modified from da Silva et al. (Reference da Silva, Muñoz, Armelin and Elias2017a)]. Untreated parental controls consistently resulted in approximately 30% of cells undergoing DNA synthesis after 24 h of growth (Fig. 1B – gating controls). Following 24 h of melarsoprol treatment (26 nm), we observed an almost complete loss of BrdU-positive DNA synthesizing cells (Fig. 1D). This was in contrast with other drugs, whose loss of cell viability was similar to melarsoprol but resulted in diverse effects on DNA synthesis. Pentamidine treatment caused a subtle but reproducible increase in the BrdU-positive population (from 30 to 35%), eflornithine decreased DNA synthesis by approximately 10%, and fexinidazole treatment resulted in a more than 20% reduction in DNA synthesizing cells (Fig. 1D). Thus, the nearly complete loss of DNA synthesizing cells following was unique to melarsoprol under these conditions and consistent with the decrease in S phase and G2 cells observed in cell cycle analysis (Fig. 1C).
Overexpression of GSH1 alleviates melarsoprol-induced cell cycle defects
The observed decrease in the G2 peak following melarsoprol treatment (26 nm, 24 h) is inconsistent with a previous study that reported an increase in the abundance of G2 cells (35 nm, 24 h) (Thomas et al., Reference Thomas, Baker, Hutchinson, Dominicus, Trenaman, Glover, Alsford and Horn2018). Thus, we evaluated the cell cycle effect over three concentrations of melarsoprol (17, 26 and 35 nm) for 24 h. We observed that 17 nm treatment began to broaden and reduce the height of the G2 peak, 26 nm resulted in 20% decrease in the total number of cells in the combined S phase and G2 regions, and 35 nm appears to cause broad accumulation of cells from G1 to G2 with no specific G2 peak, though arguably the analysis of the highest concentration of melarsoprol could be complicated by decreased cell viability (Fig. 2A). Therefore, in our hands, progressive loss of cells in G2 was clearly observed during melarsoprol treatment and differences with the previous report could arise from alternative lots of melarsoprol, parental cell line variations or the evaluation of a treatment condition with decreased cell viability.
Cell cycle defects arising from melarsoprol treatment. (A) Cell cycle analysis of parental cell line (SM) untreated or treated with melarsoprol at 17, 26 and 35 nm for 24 h. (B) Cell cycle analysis of cell line overexpressing GSH1 untreated or treated with melarsoprol at 17, 26 and 35 nm for 24 h shown as an overlay (green) with parental cells under the same treatment conditions. (C) Left – overlay of parental cells under all melarsoprol treatment conditions in comparison with untreated. Right – overlay of GSH1-induced cells under all melarsoprol treatment conditions in comparison with untreated. Flow cytometry data are presented as a single replicate representative of at least three biological replicates. (D) Counts of nuclei and kinetoplasts per cell following immunofluorescent microscopy analysis using DAPI staining after 24 h of melarsoprol treatment at the indicated concentrations. n = the number of cells counted per condition. Per cent of cells counted as 1N2K are shown as white text in the red portion of the bar graph. Microscopy slides were made from a single biological replicate experiment and the number of cells counted (n =) are shown at the top of each bar.

The GSH1 enzyme is essential and represents the rate-limiting step of trypanothione biosynthesis (Huynh et al., Reference Huynh, Huynh, Harmon and Phillips2003; Agnihotri et al., Reference Agnihotri, Singh, Shakya and Pratap2016). Induced expression of GSH1 was identified in a gain-of-function screen for genes whose expression can promote survival during melarsoprol treatment and resulted in a 1.5-fold increase in the relative EC50 of melarsoprol (Carter et al., Reference Carter, Gomez, Gritz, Larson, Silva-Herzog, Kim, Schulz and Hovel-Miner2020). To determine if the cell cycle and DNA synthesis defects observed during melarsoprol treatment were associated with the trypanothione pathway, we overexpressed the gene encoding GSH1 (Tb927.10.12370) and analysed the effects during melarsoprol treatment (Supplementary Fig. S1 – qRT-PCR, 20-fold increase in GSH1 transcripts). The overexpression of GSH1 had only a modest effect on cell cycle progression (4% more cells in the combined S phase and G2 regions). However, during melarsoprol treatment, we observed a pronounced improvement in cell cycle progression during GSH1-induced expression compared to the parent. This resulted in complete recovery of the G2 peak at 26 nm and a profile at 35 nm melarsoprol that largely alleviated the drug-induced cell cycle defect (Fig. 2B). Overlays of untreated and melarsoprol treatment conditions in parental and GSH1-induced cells clearly demonstrated the ability of GSH1 expression to largely recover the G2 population that was lost in parental cells under the same conditions (Fig. 2C).
Trypanosomatids have two DNA-containing organelles that can be monitored by DAPI staining: the nucleus (N) and the kinetoplast (K), which is a network of DNA housed in their single mitochondrion (Zíková et al., Reference Zíková, Verner, Nenarokova, Michels and Lukeš2017). Trypanosomatid cell cycle progression begins with duplication of kinetoplast DNA (kDNA), followed by kinetoplast division (generating a 1N2K cell), then nuclear DNA duplication and division (2N2K), and, then cytokinesis (Hammarton, Reference Hammarton2007). Thus, T. brucei cell cycle progression can be monitored by immunofluorescence microscopy with DAPI staining to count the number of kinetoplasts and nuclei per parasite. Treatment of cells with 26 nm melarsoprol for 24 h resulted in a marked increase in cells in the 1N2K state (from 9% in untreated to 15% in treated cells), which was alleviated (or did not occur) upon GSH1 overexpression (Fig. 2D, sample microscopy images in Supplementary Fig. S2). It is notable that GSH1 overexpression alone resulted in an increase in 1N2K cells compared to the untreated parent (14% compared with 9%) and the cells in this population decreased when grown in melarsoprol. Thus, by both flow cytometry and immunofluorescence microscopy analysis of cell cycle, GSH1 overexpression can alleviate melarsoprol-induced cell cycle defects.
GSH1 overexpression alleviates melarsoprol-induced DNA synthesis defects
We then sought to determine if overexpression of GSH1 could alleviate the DNA synthesis defect observed during melarsoprol treatment. The lowest concentration of melarsoprol analysed (17 nm) resulted in a decrease in DNA synthesizing cells (from 26 to 6%) and the two higher concentrations of melarsoprol (26 and 35 nm) resulted in a complete loss of DNA synthesis within 24 h (Fig. 3A). Overexpression of GSH1 significantly compensated for the loss of DNA synthesizing cells observed during melarsoprol treatment at both 17 and 26 nm over three biological replicate experiments (Fig. 3B). The effect of GSH1 overexpression on maintaining the DNA synthesizing cell population was also apparent at timepoints earlier than 24 h (Supplementary Fig. S3, 6 and 12 h of melarsoprol treatment compared). GSH1 overexpression resulted in an average of approximately 13% more cells undergoing DNA synthesis during 17 and 26 nm drug treatment at 24 h than in native GSH1 expression levels (Fig. 3C). The highest concentration of melarsoprol analysed (35 nm) also displayed increased DNA synthesis during GSH1 overexpression but was not statistically significant over three biological replicates. Therefore, melarsoprol treatment resulted in a pronounced DNA synthesis defect, the likely source of the observed G2 cell cycle defect, which was significantly alleviated by the overexpression of GSH1.
DNA synthesis during melarsoprol treatment and GSH1 overexpression. (A) DNA synthesis analysed by BrdU incorporation assay for parental cells treated with melarsoprol at the indicated drug concentrations. (B) Cell line overexpression GSH1 analysed for BrdU-positive population during melarsoprol treatment. (C) Biological triplicate data from parental cells (grey) and GSH1 overexpressing cells (green) for the per cent of BrdU-positive cells from each melarsoprol treatment condition. Statistical significance is shown in brackets over comparative data: *P < 0.02 and **P < 0.003.

GSH1 effects on DNA synthesis are melarsoprol-specific
Treatments with the four drugs evaluated in this study all resulted in a 50–75% inhibition in growth over 24 h (Fig. 4D – grey bars). Yet, only melarsoprol (26 nm) demonstrated a complete loss of BrdU-positive, DNA synthesizing, cells and decrease in the G2 population. Overexpression of GSH1 had no effect on cell cycle progression during eflornithine treatment, partially improved fexinidazole-induced defects, and unexpectedly exacerbated the pentamidine-induced defect resulting in a broad peak overlapping S phase and G2 (Fig. 4A). In contrast with the ability of GSH1 overexpression to significantly recover DNA synthesis during melarsoprol treatment, the proportion of BrdU-positive cells was largely unaffected by GSH1 induction during eflornithine, fexinidazole and pentamidine treatments (Fig. 4B).
GSH1 overexpression effects during antitrypanosomal drug treatments. Comparison of parental cell line (grey) and GSH1 overexpressing cell line (green) during antitrypanosomal drug treatments for 24 h in vitro at the concentrations indicated for their effects on: (A) cell cycle, (B) DNA synthesis by BrdU incorporation assay, and (D) growth inhibition, statistical significance is shown as Not Significant (N.S or *P < 0.03 and **P < 0.002). (C) Evaluation of fexinidazole effects on DNA synthesis over biological triplicates (left graph) and at additional drug concentrations.

Fexinidazole is poised to largely replace melarsoprol as a treatment for second-stage HAT (Deeks, Reference Deeks2019; Lindner et al., Reference Lindner, Lejon, Chappuis, Seixas, Kazumba, Barrett, Mwamba, Erphas, Akl, Villanueva, Bergman, Simarro, Ebeja, Priotto and Franco2020), yet its effects on parasite cell biology have not been widely reported. We found that fexinidazole has a significant and reproducible effect on decreasing the number of DNA synthesizing cells (~20% reduction during 70 μ m treatment), which was not alleviated by the overexpression of GSH1 (Fig. 4C). Thus, fexinidazole's effects on DNA synthesis appear to arise independently from the trypanothione pathway.
While all the drug treatments analysed here resulted in upwards of 50% growth inhibition over 24 h (Fig. 4D), they did not consistently result in reduced DNA synthesis. Thus, DNA synthesis inhibition, such as that observed during melarsoprol treatment, is not likely a general outcome of a drug-induced cessation of growth. Melarsoprol was analysed over three concentrations that range from approximately 30 to 70% growth inhibition over 24 h (Fig. 4D). Overexpression of GSH1 was able to significantly recover cell growth during melarsoprol treatment (Fig. 4D), which correlated with the increase in DNA synthesis observed over the same conditions (Fig. 3). In contrast, overexpression of GSH1 adversely affected cell growth during pentamidine treatment and had no significant effect on eflornithine-treated cells. Fexinidazole-associated growth inhibition was partially alleviated (~12% improvement) by GSH1 overexpression, but it is unclear at this time if this results from improved DNA synthesis or other aspects of cellular redox (Fig. 4). Together these data strongly suggest that inhibition of DNA synthesis by melarsoprol, through disruption of the trypanothione pathway, contributes to T. brucei growth inhibition.
Discussion
Trypanosomatids possess a typical eukaryotic class I RR that catalyses the rate-limiting step in the de novo synthesis of dNTPs required for DNA synthesis and cell division (Hofer et al., Reference Hofer, Ekanem and Thelander1998; Dormeyer et al., Reference Dormeyer, Reckenfelderbäumer, Lüdemann and Krauth-Siegel2001). In T. brucei, T(SH)2 is a direct donor of reducing equivalents required for RR in a reaction catalysed by TXN (see Fig. 1A) (Dormeyer et al., Reference Dormeyer, Reckenfelderbäumer, Lüdemann and Krauth-Siegel2001). Therefore, inhibition of DNA synthesis is implicated among the complex outcomes of T(SH)2 and TR inhibition associated with melarsoprol treatment but had not been investigated previously. Genetic manipulation of enzymes in trypanothione biosynthesis and utilization pathways, including RNAi knockdown of TXN and Px enzymes, has resulted in impaired cell growth or decreased virulence (Krieger et al., Reference Krieger, Schwarz, Ariyanayagam, Fairlamb, Krauth-Siegel and Clayton2000; Wilkinson et al., Reference Wilkinson, Horn, Prathalingam and Kelly2003).
Here we have shown that treatment with melarsoprol resulted in a complete inhibition of DNA synthesis within 24 h. We have also demonstrated that this outcome is directly associated with the trypanothione pathway through the overexpression of GSH1. This implicates the inhibition of T(SH)2/TXN providing reducing equivalents to RR as a mode of cell killing for melarsoprol. The data suggest that in the absence of reduced RR, the limiting pool of dNTPs is depleted during kinetoplast DNA synthesis (as evidenced from the accumulation of 1N2K cells in Fig. 2D) and is insufficient for nuclear DNA replication. Despite the strength of the evidence regarding the effect of melarsoprol on DNA synthesis and cell cycle, demonstrating that this outcome is specifically dependent on RR and the abundance of dNTPs will require future investigation. The complex outcomes of the trypanothione pathway are subject to alternative interpretations of the data presented herein, which could arise from secondary effects and alternative metabolic perturbations. Precise determination of the effects of melarsoprol treatment on RR function will require direct measurement of the dNTP pools and could be supported by elucidating the effects of genetic manipulation of tryparedoxin, the substrate of RR, on DNA synthesis.
Interpretation of the data presented here requires that we consider the direction of causality. There are two possibilities: (A) melarsoprol treatment causes growth inhibition, which in turn results in a decrease in DNA synthesis or (B) melarsoprol treatment causes a decrease in DNA synthesis that results in growth inhibition. To help disentangle this issue, we have presented two major bodies of evidence: (1) the effects of melarsoprol treatment on DNA synthesis at multiple concentrations (Fig. 3) and earlier timepoints (Supplementary Fig. S3) and (2) the inclusion of other drugs that similarly inhibit growth (Figs 1 and 4).
The matter of cell viability is always a concern when conducting experiments under toxifying conditions. From previous studies, we know that complete cell death during melarsoprol treatment requires 3 days in 35 nm, 4 days in 26 nm and 5 days in 17 nm (Carter et al., Reference Carter, Gomez, Gritz, Larson, Silva-Herzog, Kim, Schulz and Hovel-Miner2020). Thus, it was notable that we observed a 20% decrease in DNA synthesis in 17 nm melarsoprol within 24 h (Fig. 3), which corresponded with only a 30% reduction in cell growth (Fig. 4D). Similarly, DNA synthesis inhibition was detected during 35 nm melarsoprol treatment within 6 h (12% decrease, Supplementary Fig. S3). While these data strongly suggest that DNA synthesis is being inhibited prior to the cessation of growth, future studies could precisely elucidate the timeline of events using cell viability assays conducted in a refined treatment time course alongside measurements of DNA synthesis.
To further evaluate the cause and effect relationship between DNA synthesis and cell viability, we included three additional antitrypanosomal drug treatments that inhibited cell growth similarly to 35 nm melarsoprol (Fig. 4D), namely eflornithine (100 μ m), fexinidazole (70 μ m) and pentamidine (5 nm). None of the other drugs treatments analysed here resulted in the pronounced inhibition of DNA synthesis observed during melarsoprol treatment. Therefore, it is not inherently true that growth inhibition (50–75% shown for all drugs, Fig. 4D) results in DNA synthesis inhibition and clearly not of the same magnitude observed for melarsoprol.
It is notable that 24 h of eflornithine treatment had only a modest effect on DNA synthesis, since the drug directly inhibits ODCs ability to synthesize the putrescine required for spermidine and, ultimately, T(SH)2 biosynthesis (Baker et al., Reference Baker, Alsford and Horn2010). It is likely that the pools of T(SH)2 precursors were not limiting in the experimental timeframe analysed here but longer treatments with eflornithine would further exacerbate DNA synthesis defects. Pentamidine treatment had the most significant effect on the accumulation of cells in G2 without resulting in a reduction in DNA synthesizing cells. Unexpectedly, overexpression of GSH1 during pentamidine treatment resulted in a complete alteration of the cell cycle profile to form a single broad peak encompassing S phase and G2 (Fig. 4A, pentamidine 5 nm), which was also observed, though less pronounced in a 4 nm treatment (data not shown). While both melarsoprol and pentamidine use similar aquaglyceroporins for their uptake (Alsford et al., Reference Alsford, Eckert, Baker, Glover, Sanchez-Flores, Leung, Turner, Field, Berriman and Horn2012), until now there was no indication that pentamidine interfaced with the trypanothione pathway. While it is unclear why overexpression of GSH1 would result in the observed cell cycle phenotype during pentamidine treatment, perhaps it suggests a previously unrecognized association that warrants further investigation.
In 2018, fexinidazole was approved as an oral treatment for first-stage (bloodstream) and second-stage (CNS) T. b. gambiense (Fairlamb, Reference Fairlamb2019) and is actively being explored for its therapeutic potential in T. cruzi and Leishmania sp. infections (Wyllie et al., Reference Wyllie, Patterson and Fairlamb2013; Bahia et al., Reference Bahia, Nascimento, Mazzeti, Marques, Gonçalves, Mota, de Diniz, Caldas, Talvani, Shackleford, Koltun, Saunders, White, Scandale, Charman and Chatelain2014; Lindner et al., Reference Lindner, Lejon, Chappuis, Seixas, Kazumba, Barrett, Mwamba, Erphas, Akl, Villanueva, Bergman, Simarro, Ebeja, Priotto and Franco2020). Fexinidazole and other clinically relevant nitroheterocyclic drugs, including nifurtimox, are activated by an NADH-dependent bacterial-like NTR whose genetic alterations can result in cross-resistance to these drugs (Wyllie et al., Reference Wyllie, Foth, Kelner, Sokolova, Berriman and Fairlamb2016). While mechanisms of fexinidazole resistance have been evaluated, the drug's mode of action and biological consequences to the parasite require further investigation. Fexinidazole has been broadly reported to be a DNA synthesis inhibitor (Deeks, Reference Deeks2019) yet the data presented here represent the first detailed evaluation of this claim. We observed a significant reduction (~20%) of DNA synthesis during fexinidazole treatment over 24 h which was correlated with an accumulation of cells in G2 (Fig. 1). Notably, overexpression of GSH1 did not result in a significant recovery of DNA synthesis during fexinidazole treatment but did partially recover cell growth and cell cycle progression (Fig. 4). We think the data indicate that the DNA synthesis defect associated with fexinidazole treatment occurs independently from the T(SH)2/TXN pathway, perhaps arising from DNA damage resulting from nitroimidazole byproducts.
In conclusion, DNA synthesis inhibition appears to be an attractive mode of action for potent antitrypanosomal drugs. The trypanosomatid RR itself is not likely significantly divergent from its eukaryotic hosts to function as a suitable drug target. However, there are many trypanosomatid-specific aspects of DNA replication machinery that should continue to be explored in the development of chemotherapeutics against African trypanosomes, American trypanosomes and Leishmania parasites (Uzcanga et al., Reference Uzcanga, Lara, Gutiérrez, Beaty, Beske, Teran, Navarro, Pasero, Benítez and Poveda2016; da Silva et al., Reference da Silva, Pavani, Damasceno, Marques, McCulloch, Tosi and Elias2017b).
Supplementary material
The supplementary material for this article can be found at https://doi.org/10.1017/S0031182021000317
Data
The authors confirm that the data supporting the findings of this study are available within the article [and/or] its supplementary materials. Raw data from flow cytometry experiments are available from the corresponding author (G.H.M.) on request.
Acknowledgements
The authors would like to thank George Washington University for access to the Flow Cytometry and Nanofabrication and Imaging Center Core Facilities.
Author contributions
Stephen Larson was responsible for the generation and initial analysis of the majority of the data presented herein. Larson also participated in project design and development, drafting of the original manuscript and provided edits on all manuscript versions. McKenzie Carter was responsible for generating, maintaining and evaluating the GSH1 overexpression cell line. Dr Carter was also intellectually involved in project development and provided edits at all stages of manuscript preparation and revisions. Dr Hovel-Miner was primarily responsible for the conception and design of the project, evaluation of the resulting data and all stages of manuscript preparation and revision.
Financial support
No external grants supported this research.
Conflict of interest
None.
Ethical standards
Not applicable.


 Open access