

INTRODUCTION AND BACKGROUND
Weathering is a ubiquitous phenomenon that operates at different rates throughout the Earth's surface. Its feedback among glaciation, chemical weathering and carbon cycling has affected the global climate system over geological time scales (Gislason and others, Reference Gíslason2009; Torres and others, Reference Torres, Moosdorf, Hartmann, Adkins and West2017). It is widely accepted that silicate weathering has a profound influence on long-term (million years) CO2 cycling (Urey, Reference Urey1952; Berner and others, Reference Berner, Lasaga and Garrels1983; Sharp and others, Reference Sharp, Tranter, Brown and Skidmore1995; Gislason and others, Reference Gíslason2009; Elderfield, Reference Elderfield2010). However, the rapid dissolution kinetics of carbonate weathering has not been given equal attention in studies of global CO2 cycles (Liu and others, Reference Liu, Dreybrodt and Liu2011; Torres and others, Reference Torres, Moosdorf, Hartmann, Adkins and West2017). Particularly, importance of sulphuric-acid-generating processes (sulphide oxidation (SO)) requires more attention.
The weathering of trace sulphide and carbonate minerals, characterised as coupled sulphide oxidation and carbonate dissolution (SO-CD), provides a transient source of CO2 (Raiswell, Reference Raiswell1984; Tranter and others, Reference Tranter2002; Wadham and others, Reference Wadham2010; Torres and others, Reference Torres, West and Li2014), and thus becomes important to consider with respect to CO2 flux (Eqns (1–3)). SO also includes transformation of redox-sensitive elements (sulphur, iron and oxygen) and, once coupled with the carbonate dissolution (CD) process, occurs more rapidly than with silicate minerals (Eqns (1) and (2)). Overall SO-CD (Eqn (3)) therefore supplies more minerals for reaction and affects the global CO2 budget (Torres and others, Reference Torres, West, Clark, Paris, Bouchez, Ponton and Adkins2016, Reference Torres, Moosdorf, Hartmann, Adkins and West2017). The estimation of CO2 release as a result of SO-CD involving glacial sediments is important to explain the potential influence of chemical weathering in glacial–interglacial cycles of the Earth's climate (Hodson and others, Reference Hodson, Tranter and Vatne2000; Torres and others, Reference Torres, Moosdorf, Hartmann, Adkins and West2017). This depends upon the burial and subsequent oxidation of the carbon and sulphur compounds involved in reaction (Berner and others, Reference Berner2000).
 $$4{\rm Fe}{\rm S}_2 + 15{\rm} {\rm O}_2 + 14{\rm} {\rm H}_2{\rm O}\to {\rm 4Fe}\lpar {{\rm OH}} \rpar _3 + 8{\rm H}_{\rm 2}{\rm S}{\rm O}_4$$
 $${\rm CaC}{\rm O}_3 + {\rm H}_2{\rm S}{\rm O}_4\to {\rm C}{\rm O}_2\lpar {\rm g} \rpar + {\rm H}_2{\rm O}+{\rm C}{\rm a}^{2 +} + {\rm S}{\rm O}_4^{2-}. $$
The release of CO2 from Eqn (2) occurs immediately (Torres and others, Reference Torres, West and Li2014). Moreover, subglacial chemical weathering is equally affected by the carbonation of the rock surface via atmospheric CO2, SO-CD reactions (Tranter and others, Reference Tranter2002; Wadham and others, Reference Wadham2010) and simple hydrolysis (Yde and others, Reference Yde, Tvis Knudsen and Nielsen2005; Stachnik and others, Reference Stachnik2016a). This SO-CD process dominates in the distributed drainage system of the subglacial environment (Tranter and others, Reference Tranter2002).
 $$\eqalign{& 4{\rm Fe}{\rm S}_2({\rm s}) + 16{\rm C}{\rm a}_{1-x}\lpar {{\rm M}{\rm g}_x} \rpar {\rm C}{\rm O}_3({\rm s}) + 15{\rm} {\rm O}_2({\rm aq}) \cr & \quad + 14{\rm} {\rm H}_{\rm 2}{\rm O} \cr & \qquad {\mathbin{\lower.3ex\hbox{$\buildrel\textstyle\leftarrow\over {\smash{\rightarrow}\vphantom{_{\vbox to.5ex{\vss}}}}$}}} 16\lpar {1-x} \rpar {\rm C}{\rm a}^{2 +} ({\rm aq}) + 16x{\rm M}{\rm g}^{2 +} ({\rm aq}) \cr & \quad \quad + 16{\rm HC}{\rm O}_3^- ({\rm aq}) + 8{\rm SO}_4^{2-} ({\rm aq}) + 4{\rm Fe}\lpar {{\rm OH}} \rpar _3({\rm s}).}$$
These reactions (i.e. SO, simple hydrolysis) also lead to the dissolution of silicates under subglacial conditions and in the proglacial zone, which have a similar effect as the dissolution of atmospheric CO2 (Tranter and others, Reference Tranter2002). Present studies in glacierised catchments require determination of the relationship between the aforementioned reactions to identify the relative importance of CO2 sequestration via weathering fluxes.
In addition, the mechanism of long-term atmospheric CO2 drawdown, regulated via climate–landform relations, temperature fluctuation and variable runoff, is thought to stabilise CO2 concentrations in the atmosphere and thus global climate (Maher and Chamberlain, Reference Maher and Chamberlain2014). Siliciclastic/siliceous rock weathering enhanced by carbonic acids derived from atmospheric CO2 dissolution causes a long-term CO2 drawdown (Eqns (4) and (5)) due to CaCO3 precipitation (Eqn 5; Sharp and others, Reference Sharp, Tranter, Brown and Skidmore1995, Tranter and others, Reference Tranter2002). One mole of CO2 returns to the atmosphere, whereas another is deposited as carbonate minerals in marine sediments (Eqn 5). However, the location and magnitude of the carbonate precipitation are poorly constrained. Quantification of these processes is equally important because they modify CO2 feedback, which affects atmospheric loading and drives climate change processes.
 $$\eqalign{&{\rm CaA}{\rm l}_{\rm 2}{\rm S}{\rm i}_{\rm 2}{\rm O}_{\rm 8}{\rm}+{\rm 2C}{\rm O}_{\rm 2}\lpar {{\rm aq}} \rpar {\rm}+{\rm 2} {\rm H}_{\rm 2}{\rm O} \cr & \to {\rm C}{\rm a}_{\rm 2}^{\rm +} \lpar {{\rm aq}} \rpar {\rm}+{\rm 2HC}{\rm O}_{\rm 3}^- \lpar {{\rm aq}} \rpar {\rm}+{\rm } {\rm H}_{\rm 2}{\rm A}{\rm l}_{\rm 2}{\rm S}{\rm i}_{\rm 2}{\rm O}_{\rm 8}\lpar {\rm s} \rpar}$$
 $${\rm C}{\rm a}^{{\rm 2 +}} {\rm}+{\rm 2\ HC}{\rm O}_{\rm 3}^- \to {\rm CaC}{\rm O}_{\rm 3}{\rm}+{\rm C}{\rm O}_{\rm 2}{\rm}+{\rm } {\rm H}_{\rm 2}{\rm O}{\rm.} $$
The process leading to short-term consumption of CO2 is the carbonation of carbonates (CC), which is represented as follows:
 $$\eqalign{&{\rm C}{\rm a}_{{\rm 1 -} x}\lpar {{\rm M}{\rm g}_x} \rpar {\rm C}{\rm O}_{\rm 3}\lpar {\rm s} \rpar {\rm}+{\rm C}{\rm O}_{\rm 2}\lpar {{\rm aq}} \rpar {\rm}+{\rm } {\rm H}_{\rm 2}{\rm O} \cr & \to \lpar {{\rm 1}-x} \rpar {\rm C}{\rm a}^{{\rm 2 +}} \lpar {{\rm aq}} \rpar {\rm}+{\rm } x{\rm M}{\rm g}^{{\rm 2 +}} \lpar {{\rm aq}} \rpar {\rm}+{\rm 2HC}{\rm O}_{\rm 3}^-.}$$
The release of CO2 is initiated in first-order streams, where it begins to transform via biotic and abiotic reactions and is stored in terrestrial environments in various forms such as precipitated carbonates and transient CO2 sinks in soils, ice and snow.
In the present paper, the role of the Himalayan glacierised mountain system in CO2 cycling via glacial weathering is examined, highlighting the spatial variations in solute concentration and their relation to possible causal factors such as lithology and runoff. The quantitative assessment of long-term and short-term CO2 consumption through silicate vs carbonate weathering and the relative contribution of solute fluxes in glacial weathering reactions within this region are also determined. There is a lack of such comprehensive studies combining data from different glacierised basins in the Himalayan region.
STUDY SITES
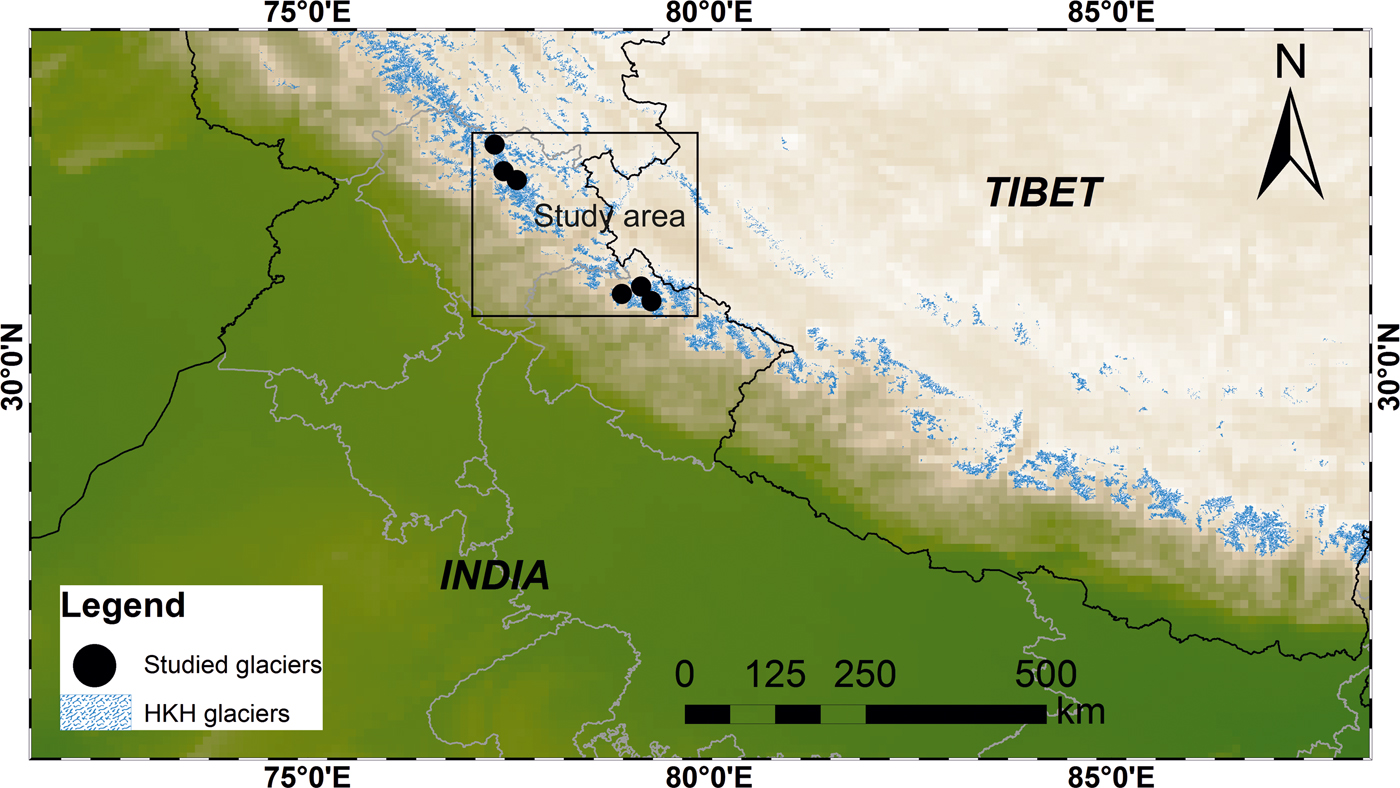
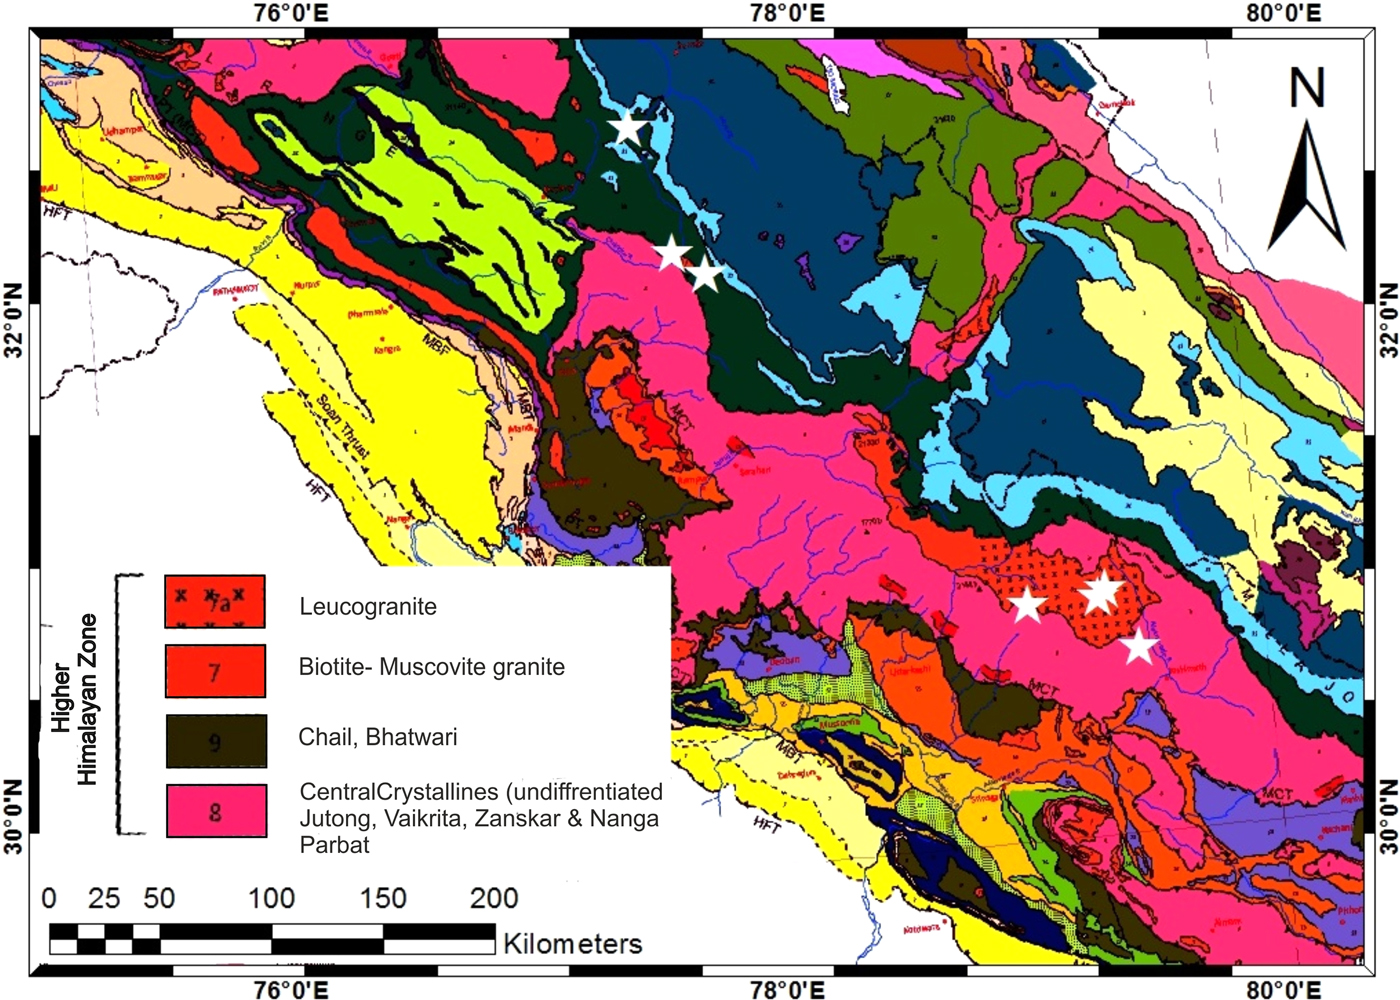
This study was focused on the glacierised catchments of the central Higher Himalayan Crystalline (HHC) belt (Table 1). Available datasets from selected Indian Himalayan glacial catchments draining the crystalline belt of the Himalaya were compared. The location of the studied glacial catchments is shown in Figure 1. The study area is bounded between major thrust systems comprising complex metamorphic and granitic rocks (Valdiya, Reference Valdiya1999; Yin, Reference Yin2006; Fig. 2). Major rock types of the area consist of calc-silicate gneiss and calc-schist rocks interbedded with subordinate biotite-psammitic gneiss and granite pegmatite apatite veins. These are bounded by the floor thrust of the Main Central Thrust (MCT) in the South and the Trans Himadri Fault in the North (Heim and Gansser, Reference Heim and Gansser1939; Valdiya, Reference Valdiya1998).
Study area representing the glacial distribution of Hindu Kush Himalayan region and the studied glacierised catchments are marked as black circle symbol.
Geological map of Western Himalaya showing major lithologies modified after Thakur and Rawat (Reference Thakur and Rawat1992). The studied glaciers are marked as star symbol.
The focus of Indian Himalaya glaciers underlain by Higher Himalayan Crystalline bedrock of metamorphic and calcisilicatic lithologies

METHODS
Solute provenance calculations
For the requirement of working with a full ablation season of geochemical data, the Himalayan melt period of June to October was considered for this study. We assembled data of temporal and spatial solute fluxes from carefully selected central Himalayan glaciers between 1989 and 2012. We averaged all the solute data for the whole season collected near the snout of the glaciers. The Himalayan glaciers drain 80% of their discharge during the prevailing ablation periods and thus a majority of the major ion flux occurs during this period as well. The details of selected glaciers and sampling periods are as follows:
1. Meltwater samples were collected from the stream originating from the Chhota Shigri glacier at 3800 m a.s.l. for 10–15 d (from the last week of September to the first week of October) for each year between 2003 and 2007. A total of 40 samples were collected during each sampling year (Sharma and others, Reference Sharma, Ramanathan and Pottakkal2013).
2. For the hydro-chemical studies of the Patsio glacier, a total of 72 meltwater samples were collected during September for three consecutive years: 2010, 2011 and 2012 (Singh and others, Reference Singh, Ramanathan and Sharma2015a).
3. The Satopanth and Bhagirathi glaciers were sampled during the middle of the summer ablation period from 17 to 23 August 1989, and towards the end of the ablation period from 11 to 19 October 1991 (Chauhan and Hasnain, Reference Chauhan and Hasnain1993).
4. Sampling of meltwater at the Bara Shigri glacier was carried out during the ablation period of July and September 2012 and from August to September 2013 (Singh and others, Reference Singh, Ramanathan and Sharma2015a; Reference Singh, Ramanathan, Pottakkal and Kumarb).
5. The Chaturangi glacier meltwater was sampled during August and September 2008 (Singh and others, Reference Singh, Ramanathan, Pottakkal and Kumar2015b).
6. Gangotri glacier meltwater samples were collected during pre-monsoon (May–June), monsoon (July–August) and post-monsoon (15–30 September) periods during 2008 (Singh and others, Reference Singh, Ramanathan, Pottakkal and Kumar2014). For the successive year of 2009 (from 10 to 25 June) meltwater samples were collected for another study (Singh and others, Reference Singh, Ramanathan, Pottakkal and Kumar2014).
7. The solute concentration of the Dokriani glacier used for the study was reported by Hasnain and Thayyen (Reference Hasnain and Thayyen1996) for the whole ablation season from June to September 1994 (Hasnain and Thayyen, Reference Hasnain and Thayyen1999).
The major ion concentrations reported in mg L−1 and μeq L−1 were transformed to μmole L−1 for calculations.
We apportioned the meltwater solute concentration into crustal, sea-salt and aerosol components before assessing the chemical weathering and atmospheric CO2 consumption contributions. NO3− and Cl− were assumed to be of atmospheric and marine origin and the sea-salt contributions of Ca2+, Na+, Mg2+ and K+ were estimated using standard seawater ratios of SO42−/Cl− (0.051) as used by Holland (Reference Holland1978). Although NO3− could also be produced in a glacial system (Wynn and others, Reference Wynn, Hodson, Heaton and Chenery2007), no such study for the Himalayan region has been completed to date. As the site-specific snowpack-derived sulphate, nitrate and chloride data were not available for every site, the average concentration for the Himalayan snowpack was calculated from available datasets and the atmospheric SO42−/Cl− ratio (0.44) was used for calculation (Supplementary Table S1 and references therein).
For determination of the provenance of the HCO3−, we divided it into different categories following the procedure of Sharp and others (Reference Sharp, Tranter, Brown and Skidmore1995), Hodson and others (Reference Hodson, Tranter and Vatne2000) and Tranter and others (Reference Tranter2002). We improved these methods by including the simple hydrolysis reaction in the provenance budgets according to Hodson and others (Reference Hodson, Porter, Lowe and Mumford2002).
Concentration associated with simple hydrolysis of carbonates (SHC)
We assumed that SHC accounts for ~110 µM of the total concentration of HCO3− as this has been widely reported for chemical weathering under subglacial conditions (Tranter and others, Reference Tranter2002; Wadham and others, Reference Wadham2010). Simple hydrolysis (Eqn 7) occurs during the initial stage of the meltwater and subglacial bedrock/sediment contact, and it plays an important role in chemical weathering (Tranter and Wadham, Reference Tranter and Wadham2013).
 $$\eqalign{&{\rm C}{\rm a}_{(1-x{\rm )}}{\rm M}{\rm g}_x{\rm C}{\rm O}_{\rm 3}\lpar {\rm s} \rpar + {\rm H}_{\rm 2}{\rm O}{\mathbin{\lower.3ex\hbox{$\buildrel\textstyle\leftarrow\over {\smash{\rightarrow}\vphantom{_{\vbox to.5ex{\vss}}}}$}}} \lpar {1-x} \rpar {\rm C}{\rm a}^{{\rm 2 +}} \lpar {{\rm aq}} \rpar \cr & \quad + x{\rm M}{\rm g}^{2 +} \lpar {{\rm aq}} \rpar {\rm}+{\rm HC}{\rm O}_{\rm 3}^- \lpar {{\rm aq}} \rpar {\rm}+{\rm O}{\rm H}^-\lpar {{\rm aq}} \rpar.}$$
Concentration associated with aerosol hydrolysis of HCO3−
During the process of carbonate weathering, the neutralisation of nitric and sulphuric acid occurs. Each mole of nitrate produces one mole of HCO3− and each mole of sulphate (atmospherically derived) produces two moles of HCO3−. Atmospheric SO42− was deduced from the difference between the total SO42− and the sea-salt-derived SO42− concentration.
Concentration associated with SO-CD
The presence of sulphide and carbonate minerals in the rocks (although as a minor amount) can dominate weathering because of their nature of rapid dissolution. SO-CD therefore determines the crustally-derived sulphates and carbonates, such that two moles of HCO3− are produced with each mole of SO42−.
Concentration associated with carbonation of silicates
It was assumed that the Na and K that are crustally derived (i.e. *Na+ and *K+) were produced in the meltwater through the carbonation of aluminosilicate minerals. However, this reaction also contributes to the Ca2+ and Mg2+ fluxes. Therefore, the concentration of HCO3− derived from the carbonation of aluminosilicate minerals is 3.4 times the (*Na+ + *K+) concentration (Sharp and others, Reference Sharp, Tranter, Brown and Skidmore1995; Hodson and others, Reference Hodson, Tranter and Vatne2000; Table 2) if the weathering environment conforms to global mean ratios of chemical weathering of silicate rocks (after Holland, Reference Holland1978).
Solute concentration of selected Indian Himalayan glaciers in the atmospheric, aerosol, marine and crystal provenance categories

Dataset presents per cent (%) contribution of ion to its average concentration. CH is for Central Himalaya, WH is for Western Himalaya.
Concentration associated with CC minerals
The CC produces both crustal and atmospherically-derived HCO3− in equal proportions. The protons associated with nitrates and sulphates were assumed to produce crustally derived HCO3− only via carbonate weathering, and so the residual concentration represented the sum of SHC (defined above) and carbonate carbonation.
Concentration of HCO3− associated with atmospheric CO2
The atmospherically-derived bicarbonate concentration was calculated as all of the silicate-derived HCO3− and half of the HCO3− associated with the CC.
Concentration associated with microbial oxidation of carbon
The synthesis of past geochemical data has underscored the potential for CO2 sources to include organic matter oxidation in subglacial environments (Hodson and others, Reference Hodson, Tranter and Vatne2000; Wadham and others, Reference Wadham2010; Horan and others, Reference Horan2017). However, recent studies have suggested that organic carbon as a solute source may actually be less important in subglacial environments than previously believed (Graly and others, Reference Graly, Drever and Humphrey2017) particularly in silicate catchments typical of the Himalayan basins presented in this study. Additionally, dissolved organic carbon (DOC) is usually low in the Himalayan streams (Panwar and others, Reference Panwar, Gaur and Chakrapani2017). Therefore, we assumed that dissolved inorganic carbon (DIC) generated via organic carbon oxidation is negligible.
Calculation of saturation indices, pCO2 and sulphate mass fraction (SMF)
Saturation indices were calculated to determine the tendency for dissolution/precipitation of minerals and the partial pressure of CO2 (pCO2) in the Himalayan glacierised basins. We used the PHREEQC software using the MINTEQ database (Parkhurst and Appelo, Reference Parkhurst, Appelo and Survey2013). The concentration of dissolved constituents (P, Ca, K, Mg, Na, H4SiO4, SO42−, HCO3− and Cl−), water temperature and pH were used as input data. The H4SiO4 concentration was not available for the Dokriani glacier (Hasnain and Thayyen, Reference Hasnain and Thayyen1999). We assumed the water temperature to be 0.01°C for the glacial meltwater (Stachnik and others, Reference Stachnik, Yde, Kondracka, Ignatiuk and Grzesik2016b). Additionally, water temperature data were not provided in most previous studies from glacierised basins in the Himalaya. The logarithm of electron activity (pE) of 7.0 was used (Mitchell and Brown, Reference Mitchell and Brown2008).
The SMF was calculated using Eqn (8). A SMF equal to 0.5 shows the predominance of SO coupled with CD. When the SMF is <0.5, CC increases in importance. An excess of SMF >0.5 suggests additional sources of sulphate originating from the SO coupled to the silicate weathering, carbonate precipitation, or Ca and Mg efflorescent salt dissolution (Cooper and others, Reference Cooper, Wadham, Tranter, Hodgkins and Peters2002; Tranter and others, Reference Tranter2002).
The SMF was calculated using Eqn. (8) as follows:
 $${\rm SMF} = {^\ast}{\rm SO}_4^{2-} /{\rm} \lpar {{^\ast}{\rm SO}_4^{2-} + {\rm HC}{\rm O}_3^-} \rpar ,$$
*SO42− – the concentration of sulphate, corrected for atmospheric and marine input (in μeq L−1), HCO3− – the concentration of bicarbonate (in μeq L−1).
Further details of the calculations and normalisation of solute fluxes are presented in the Supplementary Appendix (A).
Atmospheric CO2 flux calculation
The dataset reported from the Himalayan glacierised basins is further used to calculate the atmospheric CO2 drawdown. CO2 consumption was estimated from a flux calculation, requiring the combination of the atmospheric-derived HCO3− concentration and mean annual runoff. The mean annual runoff values are taken here as specific discharge (water discharge per unit basin area or ‘R’) of the studied basins.
RESULTS
The precipitation ionic ratios in the Himalayan catchments were used to quantify the atmospheric solute content. The ionic ratios of Na+/Cl− and Mg2+/Cl− in snow, ice and rain were near those observed in seawater (Supplementary Table S1A, B). Whereas the ratios of K+/Cl−, Ca2+/Cl− and SO42−/Cl− in snow, ice and rain tended to be orders of magnitude higher. This suggests a marine and terrestrial contribution of ionic species. Ratios of all the major cations vs Cl− for snow and ice were very similar, whereas the ratios for rain were higher by a factor of 2 and 4 for Mg2+/Cl− and Ca2+/Cl−, respectively (Supplementary Table S1B).
Our calculations show that ~90% of the SO42− is derived from crustal SO, while ~9% of the sulphates are formed via aerosols and only 1% via sea salts (Table 2). Similarly, to SO, dissolution of evaporites could also provide a source of Ca2+ and SO42− but without the concurrent increase in CO2 release. However, we think CD most likely controls the Ca2+ concentration in water due to negative saturation index with respect to calcite (Table 3). Also, evaporite dissolution is small in glacierised basin in the Himalaya comparing to CD and sulphide oxidation (e.g. Sharma and others, Reference Sharma, Ramanathan and Pottakkal2013; Singh and others, Reference Singh, Ramanathan and Sharma2015a, Reference Singh, Ramanathan, Pottakkal and Kumarb).
Median (in bold) and min–max range of saturation indices and partial pressure of CO2 (pCO2) for meltwater from Himalayan glacierised basins

Sical, Sidol, Sigyp, SIhal, refer to the saturation indices of calcite, dolomite, gypsum and halite, respectively; pCO2 refers to partial pressure of CO2; n.d., not determined due to lack of Si concentration in water.
The provenance of HCO3− is complex. The mass-balance calculations presented here show the average value for all the studied glaciers. Aerosol hydrolysis contributes ~2%, SO/CD contributes ~21%, bicarbonates derived through silicates contribute ~21.4%, simple hydrolysis contributes 20%, carbonate carbonation contributes ~9.4%, while HCO3− derived via the atmosphere contributes ~26.1%. The mean HCO3− concentration derived via the carbonation process is ~30.6% (Table 2). These values do not accord with the results of Blum and others (Reference Blum, Gazis, Jacobson and Chamberlain1998) as they work further downstream where calcite oversaturation occurs, but quantify that an equal proportion of HCO3− is released from the weathering of calc-silicate rocks. Many rivers of the Himalayan system are typically oversaturated in terms of calcite, and Ca is being lost in the solid phase (Bickle and others, Reference Bickle, Tipper, Galy, Chapman and Harris2015). Bickle and others (Reference Bickle, Tipper, Galy, Chapman and Harris2015) showed that calcite precipitation results in an overestimation of silicate-derived Ca and Mg (and Sr) by a factor of 2.
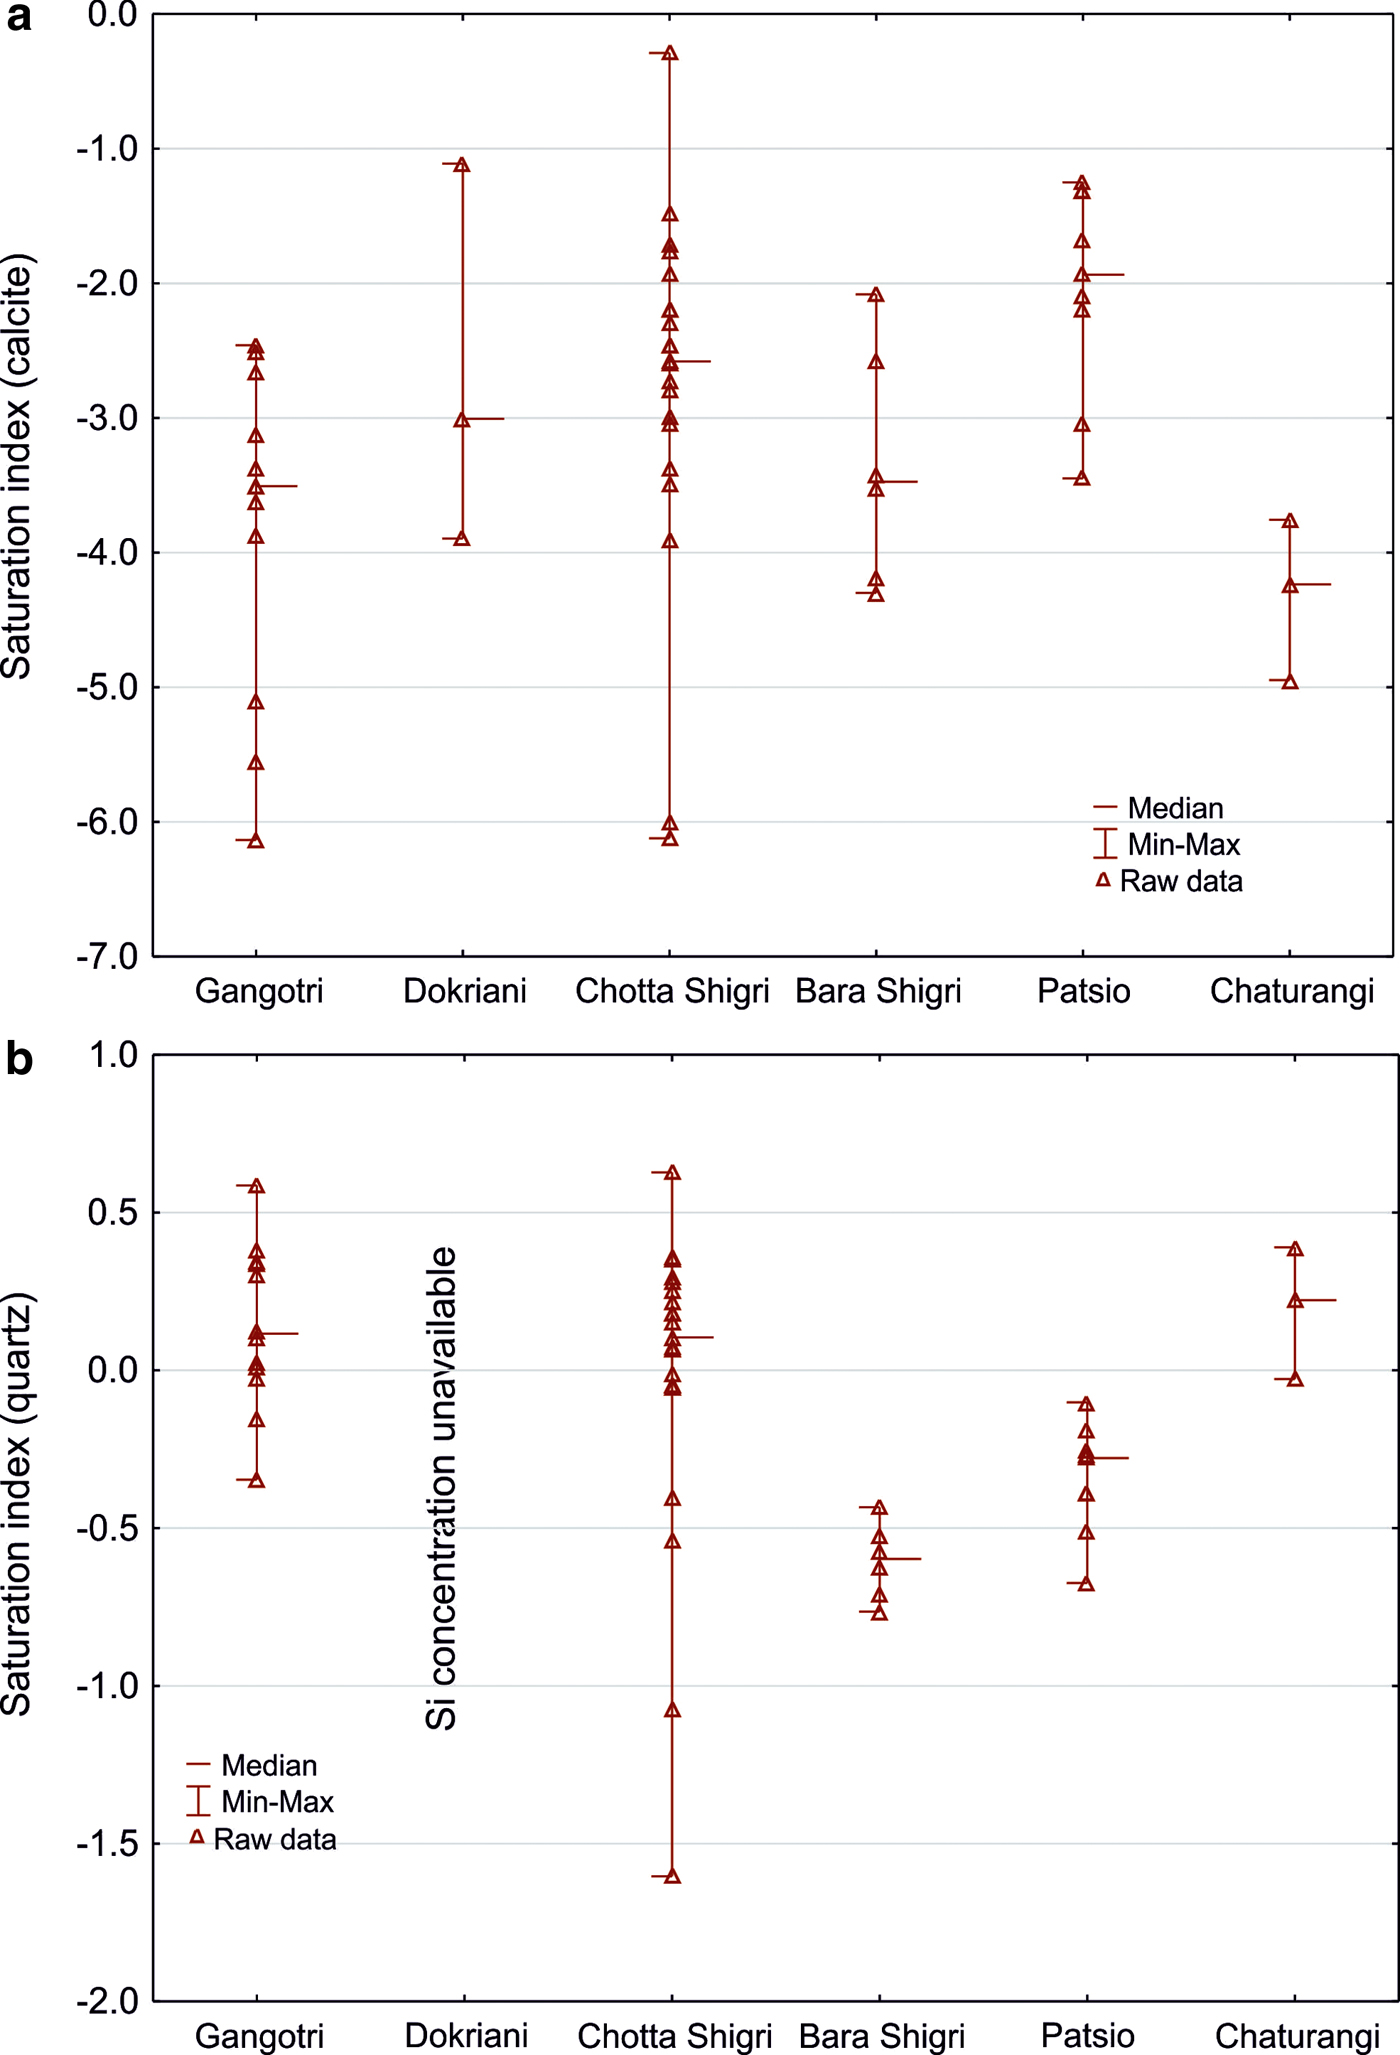
We therefore checked for calcite saturation using the PHREEQC geochemical model (Table 3). Our results reveal that water is usually undersaturated with respect to carbonate minerals (calcite and dolomite saturation indices <0), halite and gypsum, but oversaturated with respect of quartz (Fig. 3). Carbonate precipitation is therefore unlikely near the Himalayan glacierised basins as the SI for carbonates suggest dissolution rather than precipitation.
Saturation indices calculations from PHREEQC software coupled to the MINTEQ database for calcite (a) and quartz (b). Note that y-axis have a different range of parameters.
Based on the aforementioned solute provenances, the average CO2 consumption attributed to silicate and carbonate weathering was calculated. The consumption of CO2 through weathering of silicate minerals was found to be nearly 10.6 × 10⁴ mole km−2 a−1 (19%); whereas 15.7 × 10⁴ mole km−2 a−1 (28%) for simple hydrolysis reaction; 13.6 × 10⁴ mole km−2 a−1 (24%) derived from atmosphere; 9.6 × 10⁴ mole km−2 a−1 (17%) through SO-CD reaction; 5.9 × 10⁴ mole km−2 a−1 (11%) through carbonate carbonation and 1.4 × 10⁴ mole km−2 a−1 (2%) by the aerosol hydrolysis. Table 4 shows variability between the western and central Himalayan glaciers.
The average atmospheric CO2 consumption rates attributed to carbonate and silicate weathering and their relative percentage values in selected Indian Himalayan glaciers

DISCUSSION
Glacial catchments have high chemical denudation rates because of high water fluxes and suspended sediment loads (1.2–4 times greater than the global means; Anderson and others, Reference Anderson, Drever and Humphrey1997; Tranter and Wadham, Reference Tranter and Wadham2013). Temperate glaciers in alpine catchments show higher chemical weathering rates due to intense physical weathering and, in our case, a favourable monsoonal climate (Sundriyal and others, Reference Sundriyal, Shukla, Tripathee, Dobhal, Tiwari and Bhan2018). The Himalayan glaciers are governed by strong seasonal discharge (Tipper and others, Reference Tipper2006b; Bookhagen and Burbank, Reference Bookhagen and Burbank2010) and rapid retreat (Bolch and others, Reference Bolch2012), contributing to an increase in solute yields and CO2 consumption. The HHC glaciers receive nearly ~80% of their precipitation from the southwest monsoon system (Bookhagen and Burbank, Reference Bookhagen and Burbank2010). A potential change in global climate, such as the weakening of the global monsoon circulation, forest cover reduction, and an increase in aerosol concentration, evapotranspiration process and surface energy budget, has significantly changed the intensity of rainfall and moisture availability in the Himalayan region (Gaffen and Ross, Reference Gaffen and Ross1999; Duan and Yao, Reference Duan and Yao2003; Ramanathan and others, Reference Ramanathan, Crutzen, Kiehl and Rosenfeld2001, Reference Ramanathan2005). These climatic constraints have ultimately affected the weathering pattern of the region along with the role of temperature, which is behind the feedback mechanism of the climate–weathering relationship (Gabet and others, Reference Gabet, Wolff-Boenisch, Langner, Burbank and Putkonen2010). An analysis of large rivers indicates that a good correlation exists between CO2 consumption and silicate weathering flux (Gaillardet and others, Reference Gaillardet, Dupré, Louvat and Allegre1999) and its consumption in terms of chemical weathering is associated with the tectonic uplift of the Himalaya (Sharp and others, Reference Sharp, Tranter, Brown and Skidmore1995). However, due to uplift, the increase in chemical weathering are not reflected in the long-term (>1 Ma) CO2 budget, as the calculated CO2 consumption rate only increases by a factor of 2 (Jacobson and Blum, Reference Jacobson and Blum2003).
Chemical weathering and non-weathering sources of solute in the Himalaya – regional distribution
The contribution of solute from dissolution of aerosols and aeolian dust in our study is greater than that of other glacierised basins (Wake and Mayewski, Reference Wake and Mayewski1993). The high SO42−/Cl− ratio (Supplementary Table S1B) may be attributed to high altitude favouring an increase in SO42− aerosol deposition (Polesello and others, Reference Polesello2007), enhanced by atmospheric circulation, domestic biomass burning (Shrestha and others, Reference Shrestha2000), or an influx of CaSO4 (Mayewski and others, Reference Mayewski, Lyons and Ahmad1983). As the sulphate produced is already oxidised, the SO-CD process may therefore be overestimated. Similarly, the great difference between the cation/Cl− ratios in the rain vs those of snow and ice shows that wet and dry deposition may also contribute cations (Shrestha and others, Reference Shrestha, Wake and Dibb1997; Shrestha and others, Reference Shrestha2000). Dissolution of CaSO4 aerosol is also accompanied by dissolution of aged sea salts delivered flowing long transport from the sea (Geng and others, Reference Geng2010), and evaporite deposits from more local stream waters and springs (Evans and others, Reference Evans, Derry, Anderson and France-Lanord2002). However, during the monsoon, aerosols become depleted, whereas during the winter and the pre-monsoon period, the aerosol concentration increases (Shrestha and others, Reference Shrestha2000, Reference Shrestha, Barros and Khlystov2010). Furthermore, additional Cl− from the Himalayan cold and warm springs has been shown to cause high concentrations and saturation with respect to halite (Evans and others, Reference Evans, Derry, Anderson and France-Lanord2002). Meltwater from our glacierised basins show low Cl− concentration and significant undersaturation with respect to halite (Table 3) suggesting that even if high Cl− springs source the surface water, they likely have a little contribution to dissolved solids yields comparing with the bulk runoff from glacier-fed basins.
The cation denudation rates of the Himalayan glacial catchments are 1.2–4 times greater than global mean (Anderson and others, Reference Anderson, Drever and Humphrey1997). Considering the lithological aspect, the silicate weathering and particularly plagioclase weathering of the HHC rocks is the most rapid in the Himalaya (West and others, Reference West, Bickle, Collins and Brasington2002). Previous studies of the Dokriani and Lirung glaciers of the higher Himalaya characteristically represent the HHC lithology releasing high carbonates via weathering fluxes and a proportionately low silicate flux compared with the Bore and Chinnya catchments of the Middle Hills Nepalese Himalaya (West and others, Reference West, Bickle, Collins and Brasington2002). Our results also show that despite the high carbonate weathering, carbonate precipitation does not appear to occur because of undersaturation with respect to the carbonate minerals (Table 3). This is unlike the other studies that show carbonate precipitation forming travertine deposits in catchments with limited snow/ice cover in the Himalaya (Tipper and others, Reference Tipper, Galy and Bickle2006a). The present study suggests the chemical weathering processes operating in the Himalaya are more complex than previously stated. The chemical composition studies at the Gangotri, Chhota Shigri, Bagni, Kafni, Dokriani and Patsio glaciers show neutral pH at all these glaciers with the control of carbonate weathering and SO as a dominating driving force (Fig. 4). The results presented here elucidate that, except for the Chhota Shigri glacier, the crustally derived sulphate fluxes on average are greater than those derived from other sources (Fig. 4). At the Chhota Shigri glacier, the presence of pyrite in small veins is a major source for SO and so bicarbonates are largely derived from carbonate weathering only and partly from silicate weathering (Sharma and others, Reference Sharma, Ramanathan and Pottakkal2013). It is interesting to note that the sea salt, aerosol and crustal proportions were different in 2006 and 2007 compared with 2003, 2004, 2005, 2008 and 2009. This difference may have been due to variable flow regime but at this point, it is difficult to explain because of the unavailability of long-term continuous data.
Estimated solute fluxes of selected central Himalayan glacierised catchments showing relationship of partitioned atmospheric and crustal components. Provenance categories represent here the per cent (%) contribution of respective solute flux (estimated through Table 2). (a), (b) and (c) denote the pre-monsoon, monsoon and post-monsoon fluxes, respectively.

The HCO3− fluxes presented were derived predominantly from silicates and simple hydrolysis processes in the western Himalayan Glaciers (the Chhota Shigri, Bada Shigri and Patsio glaciers) compared with the central Himalayan glaciers (the Gangotri, Dokriani and Satopanth glaciers) (Fig. 4). The SO-CD-derived HCO3− fluxes show greater prominence in the central Himalaya as well as more carbonate carbonation. Overall, carbonate carbonation and SO-CD in the Himalayan system are clearly contributing larger HCO3− fluxes than the silicate-derived fluxes.
SO and silicate weathering
Glaciers of the HHC catchments (the Chhota Shigri, Patsio, Dokriani and Lirung glaciers) highlight the importance of the SO process as a primary driver of sulphates in meltwater (Fig. 4) as discussed in previous studies (West and others, Reference West, Bickle, Collins and Brasington2002; Sharma and others, Reference Sharma, Ramanathan and Pottakkal2013; Singh and others, Reference Singh, Ramanathan and Sharma2015a, Reference Singh, Ramanathan, Pottakkal and Kumarb). SO creates strong sulphuric acid that may be associated with both carbonate and silicate weathering, leading to a possible decrease in the importance of long-term CO2 consumption associated with the latter. The coupling of SO and silicate weathering under a subglacial drainage system suggests a long residence time for the water (Wadham and others, Reference Wadham2010). High saturation indices with respect to quartz suggest both dissolution and precipitation occur in the glacierised basins (Table 3). This agrees with other studies from the Yukon stating that both precipitation and dissolution reactions control silicate fluxes from subglacial conditions (Crompton and others, Reference Crompton, Flowers, Kirste, Hagedorn and Sharp2015).
SO-CD is an important process that releases CO2 into the hydrological system, thereby offsetting the drawdown of atmospheric CO2 by carbonation. The SO-CD reaction is therefore identified as a transient source of CO2 to the atmosphere (Torres and others, Reference Torres, West and Li2014, Reference Torres, Moosdorf, Hartmann, Adkins and West2017). Closer observation of bicarbonate and sulphate solute fluxes indicates a negative correlation (r = −0.42) between crustally derived SO42− and hydrolysis-derived HCO3− and between SO-CD and silicate-derived HCO3− (r = −0.63) for all of the studied glaciers (Supplementary Table S4). Figure 4 shows that as the HCO3− produced from SO-CD becomes low, more silicate carbonation occurs consuming the CO2 produced via the SO-CD reactions (Eqns 1 and 2) in the subglacial environment. This indicates an excess of CO2 release from SO-CD being balanced with CO2 consumption via carbonation during the silicate weathering process. However, available meltwater chemistry provenance models (e.g. Sharp and others, Reference Sharp, Tranter, Brown and Skidmore1995; Hodson and others, Reference Hodson, Tranter and Vatne2000), which we have used in our study, appear not to include that source of CO2 in glacierised basins. We propose that further works on solute provenance in glacierised catchments should include CO2 release associated with SO-CD.
Comparing our study to those from different parts of the world (e.g. the Mackenzie River in Canada by Calmels and others, 2007; Liwa River in Taiwan by Das and others, Reference Das, Chung and You2012) also links silicate weathering and SO to the CO2 release. The Mackenzie River weathering study estimates 62% of the carbonate weathering is via sulphuric acid (Calmela and others, 2007). The high SO rates at the Liwa River (Das and others, Reference Das, Chung and You2012) and the importance of SO coupled with carbonate carbonation reaction (Stachnik and others, Reference Stachnik2016a, Reference Stachnik, Yde, Kondracka, Ignatiuk and Grzesikb) also indicate the likely importance of sulphides for simulating CO2 release.
Carbon dioxide consumption in the Himalayan region
Geographical and geological features of a catchment have a pronounced effect on weathering in glacial environments (Hodson and others, Reference Hodson, Tranter and Vatne2000; Tranter and Wadham, Reference Tranter and Wadham2013). A comparison of global CO2 consumption rates attributed solely to Ca-Mg of silicate weathering is ~9.0 × 10⁴ mole km−2 a−1 (Gaillardet and others, Reference Gaillardet, Dupré, Louvat and Allegre1999) and in the New Zealand Southern Alps 6.9 × 10⁴ mole km−2 a−1 on the eastern side and 14 × 104 mole km−2 a−1 on the western side (Jacobson and Blum, Reference Jacobson and Blum2003). This is similar to the present study of CO2 consumption in the Himalaya estimated from different concentrations (Table 4). This contribution of silicate weathering to CO2 consumption in the Himalaya is similar to the average global CO2 consumption through silicate weathering. Considering the study of the Indian Himalayan rivers (Krishnaswami and Singh, Reference Krishnaswami and Singh2005) in the Ganga River catchment, the total consumption of atmospheric CO2 from the weathering of silicate rocks was found to be 4 × 10⁵ mole km−2 a−1, nearly ten times greater than the values of this study. This is because the bulk chemistry of the large rivers reflects their silicate lithology and therefore underestimates the importance of carbonate weathering.
However, in our first-order catchments, we are not considering the production/burial or respiration/oxidation of organic matter and associated CO2 released into the atmosphere in the watershed as well as the secondary mineral precipitation that is prevalent in the larger Himalayan river systems.
CONCLUSION
The findings of this study provide new insights into carbon cycling related to CO2 consumption via weathering. We have demonstrated the consumption and/or release of CO2 coupled to SO is equally responsible for regulating CO2 cycling. Geochemical modelling suggests that the water is usually undersaturated with respect to carbonate minerals (calcite and dolomite), halite and gypsum but is oversaturated in terms of quartz. High saturation indices with respect to quartz suggest both dissolution and precipitation and therefore intensive carbonation of silicates via atmospheric CO2. SO creates strong acid that may be associated with silicate weathering leading to a possible decrease in the importance of long-term CO2 consumption via carbonation of silicates via atmospheric CO2. By contrast, the saturation indices for carbonates suggest dissolution rather than precipitation producing high solute Ca2+ and SO42− fluxes typical for glacial environments on account of the importance of SO coupled to carbonate weathering. We, however, postulate that in the Himalaya and Southern Alps silicate weathering and the SO-CD reaction are exchanging CO2 and suggest that further consideration of CO2 release from the SO-CD process could provide a better understanding of global CO2 consumption by weathering.
Previous attempts have focused on long-term consumption (~millions of years) of CO2 via silicate carbonation, but these show little influence is likely in context of future climate change scenarios because of its low importance as a weathering mechanism. However, chemical weathering of carbonates also causes CO2 consumption, but this process is short-term (~thousands of years), making it more appropriate to include in climate change models. We believe that the potential of SO weathering reaction findings will be particularly helpful for understanding the present-day solute acquisition process in glacierised catchments of the Himalaya and invaluable for establishing how the long-term carbon cycle of the Earth is balanced.
SUPPLEMENTARY MATERIAL
The supplementary material for this article can be found at https://doi.org/10.1017/aog.2019.5
ACKNOWLEDGEMENT
We acknowledge Agata Krawczyk for English corrections of the manuscript. We are grateful to the scientific editor Andy Hodson for intellectual inputs that have improved the manuscript significantly. We are also thankful to three anonymous reviewers for their constructive comments.


 Open access