

1. Introduction
Multiple QTLs mapping usually has higher resolution for QTLs mapping than single QTL analysis. The maximum likelihood method such as composite interval mapping (Zeng, Reference Zeng1994) and multiple QTLs mapping (Kao et al., Reference Kao, Zeng and Teasdale1999) measure the importance and significance of QTLs using likelihood ratio or p-value. Unlike the likelihood based method, Bayesian multiple QTLs mapping usually uses posterior inclusion probability (the frequency of a QTL being included in the model) to assess the importance of a QTL.
Bayesian model selection technology implemented via Monte Carlo Markov chain (MCMC) for QTL mapping has been studied in the last two decades (e.g. Xu, Reference Xu2003; Yi et al., Reference Yi, Yandell, Churchill, Allison, Eisen and Pomp2005; Mutshinda & Sillanpää, Reference Mutshinda and Sillanpää2010). The reversible jump MCMC method (RJMCMC) is an important method for multiple QTLs mapping (Gaffney, Reference Gaffney2001), which propose to add or delete a QTL from the model according to the prior probability and accept this proposal with their acceptance probability. The frequency of a QTL being accepted in the model is then called the posterior inclusion probability. Usually a QTL having higher posterior probability is more important. Besides the RJMCMC, the other two famous Bayesian model selection techniques, Bayesian composite model space (Yi et al., Reference Yi, Yandell, Churchill, Allison, Eisen and Pomp2005) and Bayesian stochastic search variable selection (SSVS; George & McCulloch, Reference George and McCulloch1993; Yi et al., Reference Yi, George and Allison2003), also describe the importance of a QTL by the posterior inclusion probability.
In recent years, some Bayesian shrinkage methods (BSAs) have been developed for QTLs mapping (e.g. Xu, Reference Xu2003; Mutshinda & Sillanpää, Reference Mutshinda and Sillanpää2010; Fang et al., Reference Fang, Jiang, Li, Yang, Fu, Pu, Gao, Wang and Yu2012). In this kind of analysis, all QTLs effects are included in the model and estimated, which does not need special model selection because the effects of “insignificant” QTLs would be shrunk to zero. Usually these methods have excellent performance on model fitting. However, compared with the Bayesian model selection method, Bayesian shrinkage analysis cannot provide the posterior inclusion probability of a QTL for declaring the importance of a QTL (Yi et al., Reference Yi, George and Allison2003). Instead of using posterior probability, some researchers assess the importance of QTLs by the estimated effect or standardized effect (Xu, Reference Xu2003; Mutshinda & Sillanpää, Reference Mutshinda and Sillanpää2010; Fang et al., Reference Fang, Jiang, Li, Yang, Fu, Pu, Gao, Wang and Yu2012). But the (standardized) effect is not directly related to the statistics for declaring the significance of a QTL. Recall that the effect divided by standard deviation is used to formulate t-statistic for testing the significance of the regression coefficient of multiple linear regressions. When compared with it, the posterior probability reflects the frequency of a QTL being included in the model (the important QTL will be more frequently included in the model), so it is more likely to reflect the importance of a QTL.
In this research, two new approximate methods for estimating the posterior inclusion probability are developed for Bayesian shrinkage analysis. We take Xu's (Reference Xu2003) BSA as an example and divide the posterior distribution of a QTL effect into two parts, one has a distribution close to zero and the other part has a distribution deviated from zero (see Fig. 1); then we approximate the posterior inclusion probability as the proportion of the distribution deviated from zero.
The typical density distribution of the QTLs effects. Point A is the lowest point between two peaks, which approximately divides the posterior distribution into two symmetric distributions, one has a mean close to zero and the other has a mean deviated from zero.

2. Method
(i) Multiple QTLs model and prior distribution
Consider a backcross population, the multiple QTLs model can be expressed as
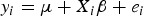 $${y_i} = \mu + {X_i}{\rm \beta} + {e_i}$$
where y i is the phenotypes; μ is the population mean; β = (β1,…, β p ) T , and β j is the effect of QTL j; X i = (x i1,…,x ip ) T , where p is the number of markers, and x ij is the genotypic indicator of jth marker and ith individual, which equals to 1 or –1 depending on the genotypes of the marker; e i is the residual error, which follows normal distribution, e i ~ N(0, σ e 2).
The prior distribution for a QTL effect β j is very important in shrinkage analysis (BSA). Xu (Reference Xu2003) takes a normal distribution for β j with variance following Jeffreys' prior, p(σ e 2) ~ 1/σ e 2.
The special posterior distribution of marker effect
The conditional posterior probability of a QTL effect of BSA follows normal distribution with mean
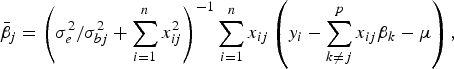 $${\bar{\beta}_j} = \left( {\sigma _e^2 /\sigma _{bj}^2 + \sum\limits_{i = 1}^n {x_{ij}^2}} \right)^{ - 1}\sum\limits_{i = 1}^n {{x_{ij}}} \left( {{y_i} - \sum\limits_{k \ne j}^p {{x_{ij}}{\beta _k} - \mu}} \right),$$
and variance
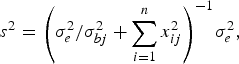 $${s^2} = {\left( {\sigma _e^2 /\sigma _{bj}^2 + \sum\limits_{i = 1}^n {x_{ij}^2}} \right)^{ - 1}}\sigma _e^2, $$
where the variance σ bj 2 follows inverted chi-square distribution χ− 2(1, β j 2).
Typically, the distribution of the posterior probability distribution of a QTL effect usually has a bimodal distribution (see Fig. 1 or Fig. 2 in Che & Xu, Reference Che and Xu2010). Therefore, we assume that it is the combination of two symmetric distributions; one has a mean deviated from zero and the other has a mean concentrated at zero.
The typical output of the estimated posterior probabilities with FitMix and SimMix, and the typical output of the estimated QTLs effects.

(ii) Inferring posterior probability from mixture distribution
We assume that the distribution with a mean deviated from zero characterizes the distribution of a QTL effect not being shrunk to zero (QTL being included in the model), but the other distribution reflects the probability of a QTL effect being shrunk to zero (QTL being excluded in the model). Therefore, the proportion of the distribution deviated from zero could reflect the posterior probability of a QTL. We employ two approaches to estimate this proportion. One method fits the two distributions mathematically and the other method fits the two distributions intuitively.
(a) Fitting mixture t distributions (FitMix)
The posterior distribution with Jeffreys' prior follows t distribution, so we fit a mixture t distribution here. The mixture model can be expressed as,
 $$p\ ({\beta _j};{v_k},{u_k},{\sigma _k}) = \sum\limits_{k = 1}^k {{\pi _k}} \cdot f\,({\beta _j}\vert{v_k},{u_k},{\sigma _k}),$$
where K is the number of component distribution, if K = 2, two component distribution is fitted and if K = 1, one component distribution is fitted; p (β j ;vk, uk, σk ) is the density of a QTL effect; π k is the probability of each distribution; f (β j |vk, uk, σk ) is the density function of t distribution with the degree of freedom v k ; the location parameter u k and the scaling parameter σ k . The expectation-maximization algorithm is used to update π k , vk, uk and σ k , iteratively, which is implemented via the function “gamlss.mx” of R package “gamlss”. The convergence threshold is set as 10−4 (mx.cc = 1e-04); the maximum iteration number is 200 (n.cyc = 200); the t distribution is chosen (family=“TF”); the number of mixture distribution (K) is set as 2. The complete code to achieve this is “gamlssMX (yourVector ~1, data = yourData, family = “TF”, K = 2, control = MX.control(cc = 1e-04, n.cyc = 200, trace = T, seed = yourSeed, plot = T))”, where the “yourVector” and “yourData” are the inputs. However, one problem is that when the proportion of distribution deviated from zero or centered at zero is very close to 1, the distribution is essentially one distribution and it is very difficult and inefficient to fit mixture distribution. In this situation, fitting two distributions would not be better than fitting one distribution. Therefore we also try to fit one-component distribution using “gamlss.mx” by setting K = 1; then we compare AIC of fitting two models to that of fitting one model, and the model with smaller AIC is chosen and used to estimate posterior probabilities. If K = 2 is chosen, the proportion of the distribution deviated from zero is just the estimation of the posterior probabilities; but if K = 1 is chosen, the proportion of distribution deviated from zero is set as 0 or 1 depending on whether one-component distribution is centered or deviated from zero. Another problem is that “gamlss.mx” needs a good initial value to start properly, but the initial value sometimes is not easy to set, so we used random seed as the input (as suggested in the package). To save time, we maximally try ten random seeds, if the program still could not start; we stop the fitting program for this locus and set the posterior probability as zero.
(b) Simply separating two distributions from mixture distribution (SimMix)
In order to facilitate summary, two distributions in Fig. 1 are approximately divided at Point A, the lowest point between two peaks, so that the proportion of distribution deviating from zero is very easily obtained by cumulating the probability of the component to the left of point A. By doing this, we can get the approximate posterior inclusion probabilities for all QTLs using their estimated effects from post-MCMC samples.
3. Simulation
(i) Simulation of a single marker and a single QTL
We studied a backcrossed population with a sample size of 150. One marker and one QTL (at the marker) with effect 0·25 were simulated. The residual variance was 1. In this simulation, we aimed to study if the bimodal is really caused by a QTL itself (not by linkage).
(ii) Simulation of a single QTL
The same population setup as above was used but one chromosome with a length of 100 cM was simulated and one QTL was simulated at the center of the chromosome. Twenty one markers were covered on the chromosome. The QTL effect was 0·386, and the residual variance was 1, so that the QTL explained 13% of the total variance.
(iii) Simulation of multiple QTLs
We used the same population setup as above, but a large genome, 2500 cM long, was simulated, which contains five chromosomes of the same length. The simulation mimics the true North American Barley population and map. In total, 501 evenly spaced markers were covered on the genome and 15 QTLs were simulated. The true positions and effects of these QTLs are shown in Fig. 2. The residual variance was set as 1, so these QTLs explained 85% of the total variance.
(iv) Real-data analysis
The barley dataset from the North American Barley Genome Mapping Project was used to test the performance of the proposed method. The data are collected from a Steptoe × Morex doubled-haploid population containing 150 lines; each was grown in nine different environments for agronomic traits and 16 different environments for malting quality traits, respectively. Three traits, alpha amylase, yield and lodging were used for analysis, where the phenotypes were averaged across all environments. The dataset includes 223 markers covering a genome of ~1500 cM, which can be downloaded from http://wheat.pw.usda.gov/ggpages/SxM/.
4. Results
In all simulations and real-data analysis, the Markov chain was run for 11 000 rounds and thinned every ten rounds with the first 1000 rounds discarded.
(i) Simulation of a single marker and a single QTL
The simulations were repeated several times and the typical density of the estimated QTL effect are shown in Fig. 1S (see Supplementary Material), from which we can see that the QTL effect is indeed bimodal distribution, suggesting that the bimodal distribution of the density is really caused by the QTL itself, which excludes the possibility of interference from the linkage of other markers.
(ii) Simulation of a single QTL
The estimated effects of all QTLs in each MCMC were stored and used to summarize their posterior probabilities. The general patterns of profiles of the posterior probabilities of FitMix and SimMix are shown in Fig. 3. They are similar and both produce a highest peak around simulated QTL position.
The typical estimated posterior probability profiles of QTLs effects of FitMix and SimFit by simulating one QTL.

To further validate the two methods, 50 simulations were performed, we firstly generated all the density distributions at the simulated position and the typical density distributions are shown in Fig. 4. There are four kinds of typical patterns. The density of Fig. 4(a) is centered at zero, which means the proportion of the non-zero distribution is rather small and thus produces a rather weak posterior probability estimate (the posterior probability estimates with FitMix and SimMix were 0 and 0·047, respectively); the density of Fig. 4(b) and (c) has a mixture density, one is close to zero and the other is deviated from zero, but the proportion of non-zero part of Fig. 4(b) is smaller than that of Fig. 4(c), the posterior probability of the two methods of Fig. 4(b) were 0·508 and 0·511, and those of Fig. 4(c) were 0·943 and 0·948, respectively; Fig. 4(d) shows a single distribution, which has a large proportion of the non-zero distribution that deviates from zero. So it strongly supports high posterior probability (the estimates of FitMix and SimMix were 1 and 0·997, respectively). We also summarized the frequencies of four typical density distributions, which turns out to be 0·36 (18/50), 0·42 (21/50), 0·18 (9/50) and 0·04 (2/50), for the situation shown in Fig. 4(a), (b), (c) and (d), respectively.
Four kinds of typical density distributions of QTLs effects. A: QTL with rather weak posterior probability; B and C: QTLs with moderate posterior probability; D: QTL with very strong posterior probability.

After generating the posterior probabilities for each replication, we studied the correlation of the estimated posterior probabilities between FitMix and SimMix. The estimated posterior probabilities with FitMix against SimMix are plotted in Fig. 5, in which we can see that the posterior probabilities with the two methods are related especially for the higher posterior probabilities. The correlation coefficient was 0·81. The mean of the estimated positions with FitMix and SimMix from 50 replications were 10·09 and 10·07, respectively, and they were very close. The standard deviation for the estimated mean was 0·201 and 0·197, respectively. To assess the power of each method, the MCMC was also run 100 times for the simulation without QTLs simulated; then the highest estimate of posterior probabilities for FitMix and SimMix were stored and used to generate their empirical distributions. The 95% percentile of the distribution was taken as the threshold for declaring the significance. Then the power was summarized for both methods and they were 64% (32/50) and 76% (38/50) for FitMix and SimMix, respectively. The power of FitMix was lower than that of SimMix, which will be explained in the Discussion.
The correlation of the estimated posterior probabilities between FitMix and SimMix.

(iii) Simulation of multiple QTLs
The typical posterior probability profiles for FitMix and SimMix are shown in Fig. 2. They produce quite similar profiles, but FitMix has a lower resolution to estimate low posterior probabilities (<0·1). The reason is explained in the Discussion.
The simulation was repeated 50 times. We also simulated 100 datasets without simulating QTLs and used FitMix and SimMix to generate the posterior probabilities after MCMC was run; then constructed an empirical distribution with the top posterior probabilities in each run and determined the threshold for declaring the significance as the 95% percentile of the empirical distribution. The power of each simulated QTL for FitMix and SimMix are shown in Fig. 6. The simulated effects corresponding to the 15 simulated QTLs are also shown in Fig. 2. It can be seen that generally the power is changed with absolute effects, which suggests that the estimated posterior probabilities with FitMix and SimMix are able to reflect the importance of the QTL. But the powers of all the simulated QTLs with FitMix are higher than those with SimMix, which will be explained in the Discussion.
The power of FitMix and SimMix and the corresponding true absolute effects.

(iv) Real-data analysis
Figs 7, 2S and 3S (see Supplementary Material) show the estimated posterior probability and QTLs effects for alpha amylase, yield and lodging, respectively. It can be seen that FitMix and SimMix have similar posterior probability estimates except for low posterior probabilities. Furthermore, the posterior probabilities are changed with their estimated effects. These suggest that the estimated posterior probabilities with FitMix and SimMix make sense.
The profiles of the estimated posterior inclusion probabilities with FitMix and SimMix for alpha amylase, and profiles of the estimated QTLs effects.

We further used permutation to generate a threshold for declaring the significance of QTLs, which was repeated 100 times and the 95% percentile of the posterior probability was taken as the threshold. For alpha amylase, both FitMix and SimMix found two QTLs and both were overlapping in two methods; for yield, both FitMix and SimMix found four QTLs, and three of them were overlapping; for lodging, both FitMix and SimMix found two QTLs and both were overlapping. We also compared these results to those of the first reports from the website http://wheat.pw.usda.gov/ggpages/SxM/QTL.html, and all our significant QTLs immediately bracketed the corresponding peaks of the reported QTLs except one for height, and in such case, we found an additional QTL linked to the one reported on chromosome 7. Furthermore, it is worth mentioning that not all the significant QTLs reported were found by us, probably because we did not use individuals from across all environments and we just simply averaged phenotypes for all environments together.
5. Discussion
Two methods, FitMix and SimMix, were developed for summarizing the posterior inclusion probabilities of QTLs, by which we can know the importance or even test the significance (by permutation) of a QTL. Both the simulation and real-data analysis show that the proposed method can give a reasonable approximation for posterior inclusion probabilities. The results reflect that our assumption of the mixture distribution of the QTL effect (one close to zero and the other one deviated to zero) makes sense although it is difficult to mathematically prove that.
From the single QTL and multiple QTLs results, we can see that both FitMix and SimMix can give very reasonable estimates of posterior probabilities, but FitMix is not more powerful than SimMix. The problem is that FitMix sometimes fails to start fitting due to a bad initial value. Of course we can try many initial values, but FitMix is time consuming, which takes ~1–2 min to run one point in our study. Therefore we tried a maximum of ten seeds to start the fitting, if it still failed to start, we stopped and set the posterior probability as zero, which was expected to decrease the false positive risk, but it would also decrease the power. Compared with FitMix, SimMix was very fast and only took half a minute for 500 loci.
Another problem is that FitMix has a low resolution to estimate low posterior probability, which can be seen from the graphs, where the signals are usually abrupt compared to those of SimMix. Actually, if the mixture distribution is very “like” one-component distribution, it is difficult to distinguish two distributions from two-component distribution; in this case FitMix is very inefficient to give a precise estimate for the proportion of two components. As a result, the AIC of fitting one distribution (K = 1) and two distribution (K = 2) are very close and FitMix usually takes K = 1. Therefore, when the posterior probabilities are very low, the estimates usually mass at zero. One solution to this problem is to increase the post-MCMC sample, i.e. run more MCMC runs to achieve high resolution, but of course it will take more time.
In this study, we mainly focus on the estimate of posterior probability of QTLs, by which one can also test the significance of a QTL by permutation in terms of the estimated posterior probabilities. Several methods were developed to test the significance of a QTL for BSA. The 90% credible interval (CI) of the posterior distribution of a QTL effect is suggested by some researchers (Wang et al., Reference Wang, Zhang, Li, Masinde, Mohan, Baylink and Xu2005; Li et al., Reference Li, Das, Fu, Li and Wu2011), but as admitted by Wang et al. (Reference Wang, Zhang, Li, Masinde, Mohan, Baylink and Xu2005), CI sometimes produces many false positive signals. Maybe the bimodal nature of the density of a QTL effect affects the CI, so after correction for the mixture model, CI is expected to work better. We do not compare our method to this method, because we do not focus on the testing of the “significance”, and we are only interested in the estimate of the posterior probabilities of QTLs.
We only tested the performance of the proposed methods for BSA. The method can also be applied to other kinds of Bayesian shrinkage estimation methods, such as Extended Bayesian LASSO (EBL) or improved Bayesian Lasso (Fang et al., Reference Fang, Jiang, Li, Yang, Fu, Pu, Gao, Wang and Yu2012), as long as the distribution of the QTL effect is bimodally distributed. It is worth mentioning that our method can also be applied to SSVS, because we found the posterior probability of the QTL effect was also bimodally distributed (results not shown). But the posterior QTL inclusion probability of SSVS can be inferred directly together with other parameters from MCMC sampling, which therefore is able to provide a benchmark to assess the performance of our estimates. We found both FitMix and SimMix estimated QTLs inclusion probabilities very close to the MCMC estimates from SSVS itself if the prior was approximately chosen, except for QTLs with low posterior probabilities (results not shown). Some researchers prefer to use SSVS for QTLs mapping, genomic selection and genetic risk prediction of disease (Verbyla et al., Reference Verbyla, Hayes, Bowman and Goddard2009; Zhou et al., Reference Zhou, Carbonetto and Stephens2013), by which one can know the posterior probabilities from MCMC. But the problem of SSVS is that users have to find a way to set ‘prior' to model selection, which usually has a large effect on the performance of SSVS. The appealing feature of BSA is that it is a prior-choice free method, and the model selection can be achieved completely by itself.
This work was financially supported by Program for new Century Excellent Talents In Heilongjiang Provincial University grant 1253-NCET-001, Chinese National Natural Science Foundation grant 3100100 and Scientific Research Fund of Heilongjiang Provincial Education Department (12531470).
Author contributions
M.F. conceived the method; R.Q.Y. designed experiment; D.G.Y., S.S.H. and D.J. performed the experiment. All authors wrote the paper.
Declaration of interest
None.
Supplementary material
The online supplementary material can be found available at http://journals.cambridge.org/GRH.


