



Food composition databases (FCDB) are fundamental for estimating dietary intakes of energy and nutrients based on food consumption surveys( Reference Burlingame 1 , Reference Stadlmayr, Charrondiere and Enujiugha 2 ). High-quality, comprehensive and country-specific nutrient values of foods are required as inadequate food composition data may lead to a failure in understanding relationships between nutrient intakes and health or disease( Reference Leclercq, Valsta and Turrini 3 ). When establishing FCDB, laboratory analysis carried out specifically for the database compilation is preferred, but the costs involved go far beyond the resources available in many parts of the world( Reference Greenfield and Southgate 4 , Reference Harrison 5 ). Available FCDB often comprise a combination of original analytical values taken from published or unpublished laboratory reports, imputed values derived from analytical values obtained for a similar food or for another form of the same food, calculated values derived from recipes, copied values from other tables and databases, and/or presumed values( Reference Greenfield and Southgate 4 ).
Assessing the quality of the data in FCDB is necessary to verify the appropriateness of the compiled nutrient values. This necessitates to look deeply into the origins of nutrient values and to evaluate not only the laboratory and the analytical methodology, but also the compilation process and sampling protocols, the actual sampling and the handling, preparation and storage of the samples( Reference Burlingame 1 ). Guidelines for quality assessment of food composition data have been developed( 6 – Reference Westenbrink, Oseredczuk and Castanheira 8 ) including criteria for food identification and description, component nomenclature, sampling plan, handling and storage, number of analytical samples, analytical methods and analytical quality control and documentation, and mode of expression of results. However, such a quality assessment depends on the availability of thorough documentation of the nutrient values. This documentation is missing for most FCDB, especially in Africa.
Furthermore, databases are often incomplete for key foods and nutrients, which may result in large errors in some nutrient intake estimations( Reference Charrondiere, Vignat and Møller 9 ). This requires imputation of nutrient values from other sources, thereby facing incompatible food and nutrient definitions, analytical methods and modes of expression across databases, resulting in diverging nutrient values. In addition, nutrient values for similar foods can be different due to agronomic factors and (industrial) food processing (e.g. fortification)( Reference Roe, Bell and Oseredczuk 10 ).
The research project FONIO (Upgrading quality and competitiveness of fonio for improved livelihoods in West Africa), funded by the European Union’s Sixth Framework Programme, aimed to explore the quality and competitiveness of fonio (a traditional cereal) as a potential healthy and nutritive food for urban areas in sub-Saharan Africa and Europe( 11 ). In the framework of this project, energy and nutrient intakes of women of reproductive age in Bamako, Mali, were evaluated in a food consumption study. The current Mali food composition database, TACAM (Table de Composition des Aliments du Mali)( Reference Barikmo, Ouattara and Oshaug 12 ), provides composition data for 268 food items. For fifty-nine of these food items, the nutrient composition of samples was analysed in Norway and South Africa( Reference Barikmo, Ouattara and Oshaug 12 , Reference Langenhoven, Kruger and Gouws 13 ). For the other 209 food items, composition data were taken from other sources, mostly from the FAO Food Composition Table for Use in Africa ( Reference Leung, Busson and Jardin 14 ). Absence of documentation for many values prohibits a quality assessment of TACAM.
In addition, as TACAM does not cover all foods and nutrients of interest, there is a need to review and complete nutrient values to allow the estimation of energy and nutrient intakes. In the present paper we first describe the pragmatic approach we used to evaluate the completeness and trustworthiness of TACAM and the process for updating the existing table with missing or unreliable nutrient values. Next we compare the nutrient intakes calculated from a weighed food record using the adjusted TACAM with the intakes based on chemical analysis of duplicate portions of diets collected on the same day.
Materials and methods
Participants
The food consumption study conducted in the framework of the FONIO project comprised thirty-six apparently healthy non-pregnant, non-lactating women (aged 15–49 years), randomly selected in Bamako, the capital city of Mali, using a three-stage cluster sampling protocol. The sampling procedure has been described elsewhere( Reference Kennedy, Fanou-Fogny and Seghieri 15 , Reference Arimond, Wiesmann and Becquey 16 ). Women were selected based on their willingness to participate in the study. Verbal informed consent was obtained from the participants before the dietary assessment, witnessed and formally recorded.
Dietary intake data collection
One-day weighed food records were obtained in March 2007 (weekends and special event days excluded), which corresponds to the post-harvest season. Data were collected by trained experienced field assistants. The women received verbal instructions about the weighing of foods and ingredients before preparation and about the collection of duplicate portions for all consumed foods. All foods, ingredients, beverages and snacks consumed by the women were recorded and weighed by the assistants, during one day, from 07.00 hours until the last evening meal consumed. Leftovers were also weighed when necessary. Detailed descriptions of the foods/ingredients and recipes were obtained. When the meal was cooked in batch for the family, the total amount of cooked food was also weighed to derive the proportion consumed by the woman from the total cooked dish for the family. This proportion was used to determine the amount of ingredients consumed from the total amount of ingredients used in the preparation of the dish. Amounts of ingredients consumed from mixed dishes and snacks with unknown amounts of ingredients (gifts, foods purchased or consumed outside the household) were determined using the standard recipes method( Reference Gibson and Ferguson 17 ). To allow collection of duplicate portions, the women were requested to cook sufficient amounts for this purpose and to serve two identical portions on separate plates for their own consumption before serving the other household members. This was done under close supervision of the field assistants. In the case of gifts, foods purchased or consumed outside the household, women were asked to collect a duplicate portion identical to what they consumed. Also, if going out, the women were followed by the field assistants who recorded and weighed and collected duplicate portions of all foods consumed. Women were financially compensated for collecting a duplicate portion. Weights were measured using an electronic kitchen scale (Soehnle, Plateau Art, model 65086, 10 kg maximum) and recorded to the nearest 2 g. The duplicate portions of all foods, beverages and snacks consumed (reduced by the same amount of leftovers when any) were weighed, collected separately, pooled per day per woman and packed in airtight polyethylene bags by the field assistants. The packed bags with foods were stored immediately in isotherm containers filled with ice. The filled isotherm boxes were collected by the study supervisor and transported immediately to the Food Technology Laboratory (LTA) of the Institute of Rural Economy (IER) in Bamako, Mali; the duplicate portions were stored at −20°C, transported on dry ice to the Division of Human Nutrition, Wageningen University, The Netherlands and stored at −80°C until analysis.
Energy and nine nutrients of interest including protein, fat, available carbohydrates, dietary fibre, Ca, Fe, Zn and vitamin A (retinol and β-carotene expressed as retinol activity equivalents (RAE)) were analysed. These were considered relevant for the FONIO project based on their public health relevance and the likely availability of nutrient values in food composition tables.
Phase 1: Food composition database
For the purpose of the FONIO project, an FCDB comprising nutrient values for all ninety foods consumed by the participants was developed specifically for that study, using TACAM( Reference Barikmo, Ouattara and Oshaug 12 ) as the primary source. For the compilation of our FCDB, further referred to as the adjusted TACAM (a-TACAM), a two-stage process was used. First, we updated the database with missing data (foods and nutrients). Second, we evaluated the a-TACAM in a pragmatic way based on an expert systems approach.
For the ninety foods, 180 nutrient values (20 %) out of 900 were not available in TACAM. Mainly values on micronutrients such as Ca, Fe, Zn and vitamin A (RAE) were missing. In addition, eleven consumed foods (110 nutrient values, 12 %) were not available in TACAM. For missing nutrient values, values for comparable foods were imputed from the following sources: the South African Food Data System( Reference Langenhoven, Kruger and Gouws 13 ), The Composition of Foods Commonly Eaten in East Africa ( Reference West, Pepping and Temalilwa 18 ), the US Department of Agriculture’s national nutrient database for standard reference, release 20( 19 ), the International Mini List( Reference Calloway, Murphy and Bunch 20 ) and the Dutch food composition table NEVO( 21 ). Additional sources( Reference Mitchikpe, Ategbo and van Raaij 22 – Reference Platt 24 ) were used for Zn values when not available in the above-mentioned sources. Before imputing values, comparable foods were checked for food description (taxonomic, name, species), moisture and component description (water, fat and protein content) and composition of brand names, especially when borrowed from the FCDB mentioned above. Nutrient values imputed from comparable foods with different moisture content but comparable component description (definition, analytical method and same expression) were adjusted to account for differences in moisture content.Footnote * For the staple foods found in TACAM, the nutrient value of the cooked form was preferred when documented. To account for nutrient losses during cooking of other foods for which only raw values are provided in TACAM, such as fish, meat and vegetables, the US Department of Agriculture’s retention factors, release 6( 25 ) were applied( Reference Kennedy, Fanou-Fogny and Seghieri 15 ). RAE values were missing in TACAM for all consumed foods, so β-carotene and retinol values were converted into RAE using the International Vitamin A Consultative Group’s recommended conversion factors( 26 ). Only β-carotene as pro-vitamin A carotenoid was used since information on other pro-vitamin A carotenoids (β-cryptoxanthin and α-carotene) was not available. The general Atwater factors for available carbohydrates, protein and fat were used in calculating energy( 27 ).
To evaluate the trustworthiness of the a-TACAM, a pragmatic approach based on the modified expert system, as developed by Holden( Reference Holden 28 ), was used for twenty-five frequently consumed foods( Reference Doets 29 ). Compositional values for nine nutrients (protein, fat, available carbohydrates, dietary fibre, Ca, Fe, Zn, retinol and β-carotene) were evaluated. When documentation of these nutrient values was available, a confidence scoring system was applied to assess their trustworthiness based on the food description, sampling plan and number of samples, sample handling and validity/quality control of analytical methods. If not available, nutrient values from the a-TACAM were compared with values of similar foods provided in other FCDB. If a-TACAM nutrient values were falling within the range used for comparison, they were accepted. If the values fell out of the range, Dixon’s criteria for testing extreme observations in a single sample( Reference Snedecor and Cochran 30 ) were used to test whether the a-TACAM value deviated significantly from the value reported in other food composition sources. For statistically significant outliers, values were replaced by averaging nutrient values of similar foods with comparable component description from other sources.
Phase 2: Comparing energy and nutrient intakes based on a-TACAM and chemical analysis
Nutrient intakes
Individual daily nutrient intakes were computed using the VBS Food Calculation System, version 4 (BaS Nutrition Software, The Netherlands) based on the newly created FCDB, a-TACAM. The values thus obtained are called ‘estimated’ values.
The contributions of individual foods to energy and nutrient intakes were calculated based on the estimated values. Nutrient densities, which reflect the amount of nutrients per unit energy in foods, were calculated per 4184 kJ (1000 kcal).
Chemical analysis
Bones and other non-edible parts such as pits were removed from the duplicate portions. The edible parts were freeze-dried, homogenized and analysed for macro- and micronutrient composition. Moisture was determined by drying the fresh and freeze-dried foods in a vacuum oven at 95°C until constant weight( Reference Osborne and Voogt 31 ). Total nitrogen was analysed using the automated Kjeldahl method( Reference Hambleton and Noel 32 ). Protein was calculated using a nitrogen-to-protein conversion factor of 6·25( Reference Jones 33 ). Total fat content was measured using acid hydrolysis of the sample and subsequent extraction of the fat with a 1:1 (v/v) mixture of diethyl ether and petroleum ether( Reference William 34 ). Total dietary fibre was determined using the Prosky procedure( Reference Prosky, Asp and Furda 35 ). Ash was determined by heating the defatted and dried food in a muffle furnace at 550°C for one night. Available carbohydrates per 100 g of fresh food were calculated by difference: 100–(weight in g/100 g of protein+fat+water+ash+fibre). Alcohol was not included in the snacks and meals of the women and therefore not included in the calculation of available carbohydrates and energy. Energy content of each duplicate portion was calculated from the amount of protein, fat, carbohydrate and fibre on the basis of energy conversion factors( 27 ) as follows: protein, 16·7 kJ/g; fat, 37·7 kJ/g; carbohydrate, 16·7 kJ/g; dietary fibre, 8·36 kJ/g. Energy contents of all duplicate portions were calculated in kilocalories (1 kcal=4·184 kJ).
Element analysis (Ca, Fe and Zn) was carried out at the chemical biological laboratory of Wageningen University using inductively coupled plasma–atomic emission spectroscopy after microwave digestion as described by Novozamsky et al.( Reference Novozamsky, van Eck and Houba 36 ). The analytical procedure is described elsewhere( Reference Koréissi-Dembélé, Fanou-Fogny and Hulshof 37 ). Vitamin A and carotenoids were analysed by HPLC at the Division of Human Nutrition of Wageningen University. The analytical procedure is described elsewhere( Reference Talsma, Brouwer and Verhoef 38 ). RAE was calculated as retinol+1/12 β-carotene+1/24 α-carotene+1/24 β-cryptoxanthin. All results based on chemical analysis are further referred to as ‘analysed’ values.
Analytical quality control
For ash, fat and nitrogen, baby food (Humana Milchwerke Westfalen eG, Herford, Germany) was used as in-house control sample to monitor analytical performance. Within- and between-run CV were, respectively: 0·9 % and 1·6 % for ash; 2·3 % and 3·9 % for fat; and 0·8 % and 1·2 % for nitrogen, over a period of more than 10 years. For fibre, the in-house control sample was breadcrumbs; between-day CV=4·2 % (within-day variation not recorded). For retinol and carotenoids, homogenized baby food (mixed vegetables with egg; Nutricia Nederland BV, Zoetermeer, The Netherlands) was used as in-house control material. Within- and between-run CV were, respectively: 1·9 % and 9·6 % for retinol; 6·1 % and 13·3 % for α-carotene; and 3·9 % and 7·7 % for β-carotene, over a 3-year period. Results from the 2006 FAPAS proficiency testing showed the following Z-scores, as a measure for deviation from the consensus value (accuracy): −0·2 for fibre; +0·7 for nitrogen; and 0·0 for ash. Results from proficiency tests organized by the National Food Administration (Uppsala, Sweden) showed average Z-scores over a 10-year period as follows: +0·52 for ash; +0·99 for dry matter; +1·72 for fat; and −0·24 for nitrogen.
For Fe and Zn, grass and strawberry samples were used as in-house control material to monitor analytical performance. Analytical variation was 6 % for both elements. The chemical biological laboratory participates in the International Plant-Analytical Exchange programme organized by Wageningen Evaluation Programs for Analytical Laboratories (www.wepal.nl). Results from proficiency tests (average result of eleven ring test samples) showed a mean Z-score of 1·7 for Fe and 0·4 for Zn over a 1-year period. Analysis on four separate days of NIST (National Institute of Standards and Technology) SRM (Standard Reference Material) 2383, with certified values for retinol (80 µg/100 g), β-cryptoxanthin (138 µg/100 g), α-carotene (83 µg/100 g) and β-carotene (312 µg/100 g), showed average deviations of 2·3 % for retinol, 2·3 % for β-cryptoxanthin, 0·9 % for α-carotene and 1·9 % for β-carotene.
Statistical method
Statistical analyses were done with the statistical software package IBM SPSS Statistics for Windows Version 19.0.0.1. During the recording day, one woman was not able to deliver the last meal for personal reasons and was excluded from the analysis, leaving a total sample of thirty-five women. P values of <0·05 were considered statistically significant for all analyses. The distribution of intake data was tested for normality using the Kolmogorov–Smirnov test. Intakes were not normally distributed; thus, summary values are reported as medians and their respective interquartile ranges. The Wilcoxon signed-rank test was used to determine whether the differences between estimated and analysed nutrient intakes were significantly different from zero. Spearman’s correlation was computed to assess the relationship between estimated and analysed nutrient values. To assess the level of agreement between estimated and analysed nutrient values, the method suggested by Bland and Altman( Reference Bland and Altman 39 ) was used. Regression analysis on the differences v. the average nutrient values was used to see whether the slopes of the difference between estimated and analysed nutrient intakes were significantly different from zero.
Results
Study population characteristics and dietary pattern
Median age was 34 years (interquartile range 24–40) years. More than half of the study population had attended primary school or Islamic school. BMI ranged from 16·8 to 38·7 kg/m2 with a mean of 24·0 (sd 5·9) kg/m2. The women’s diet was based on starchy staples, mainly refined white rice, refined wheat flour, millet or sorghum, accompanied by a sauce typically made from vegetables and beef or fish. Eighteen foods in total contributed to more than 50 % of energy and nutrient intakes (Table 1). Energy and carbohydrates were mainly from cereal products (rice) and sugar (used in tea and porridge); protein was mainly coming from animal products; while peanut oil, nuts (groundnut paste) and animal products contributed most to fat intake; fibre was mainly derived from vegetables (mainly dried okra); Ca, Fe and Zn were mainly derived from cereals, animal products and vegetables (mostly dried okra); cow’s milk, mango, lettuce and red palm oil contributed most to vitamin A (RAE).
Contribution of food items to dietary energy and nutrient intakesFootnote † among Malian women aged 15–36 years (n 35)

CHO, carbohydrates; RAE, retinol activity equivalents.
† The top five food contributors to more than 50 % dietary energy and nutrient intake are mentioned. Empty cells mean food is not among the top five contributors to the nutrient.
Phase 1: The a-TACAM food composition database
Eighty-eight per cent of the nutrient values, mostly macronutrients, were ‘acceptable’ (197 of 225Footnote * nutrient values); 8 % (seventeen nutrient values) were considered implausible because of a low confidence score and replaced; and 5 % (eleven nutrient values) that were missing were updated. Values mainly replaced were Fe (four nutrient values) and β-carotene (five nutrient values). Values mainly updated were Zn (six nutrient values). Only three values for proximate composition (fat, available carbohydrates and dietary fibre) were replaced after comparison (Table 2). Based on this evaluation we concluded that the a-TACAM is an acceptable FCDB for estimating intakes of energy and nutrients, especially Fe and Zn, in the study population in Mali.
Values added or replaced, and corresponding foods and ingredients, in the adjusted Mali food composition database, a-TACAM. (From Doets( 27 ), Appendix 8; summary of Doets’ study findings, with nutrients replaced after quality evaluation and missing values added)

CHO, carbohydrates.
TACAM=value accepted in TACAM after evaluation; Replaced=TACAM value replaced after evaluation; Updated=value does not exist, new value has been added; empty cells mean food does not contain the specific nutrient.
Phase 2: Comparing energy and nutrient intakes
The nutrient density of protein, fat and vitamin A was significantly higher (by 6 %, 19 % and 71 %, respectively) and available carbohydrate and Fe density were significantly lower (by 14 % and 53 %, respectively) in estimated compared with analysed intakes.
Median daily energy intake of the women was 6054 kJ (1447 kcal) and 6795 kJ (1624 kcal) for estimated and analysed values, respectively. Fat accounted for 30 % and 26 %, and available carbohydrates for 56 % and 66 %, of estimated and analysed energy intake, respectively. The estimated and analysed protein, fat and dietary fibre intakes did not differ, but the estimated intake of available carbohydrates was 17 % lower compared with the analysed intake. Estimated Fe intake was 57 % lower and estimated vitamin A intake was 45 % higher compared with analysed intakes, while estimated and analysed Ca and Zn intakes did not differ (Table 3).
Estimated (obtained from one-day weighed food records using the adjusted Mali food composition database, a-TACAM) and analysed (by chemical analysis of duplicate portions) energy, nutrient densities and intakes of Malian women aged 15–36 years (n 35) at population level

IQR, interquartile range; RAE, retinol activity equivalents.
Correlation significant at *P<0·05, **P<0·001 level (two-sided).
† Estimated by Wilcoxon signed-rank tests.
‡ Ratio=(analysed–estimated intake)/analysed intake; a minus sign expresses overestimation of the estimated value.
§ Contribution of protein, fat, carbohydrates and fibre to energy intake.
Agreement between nutrient intakes from a-TACAM and chemical analysis
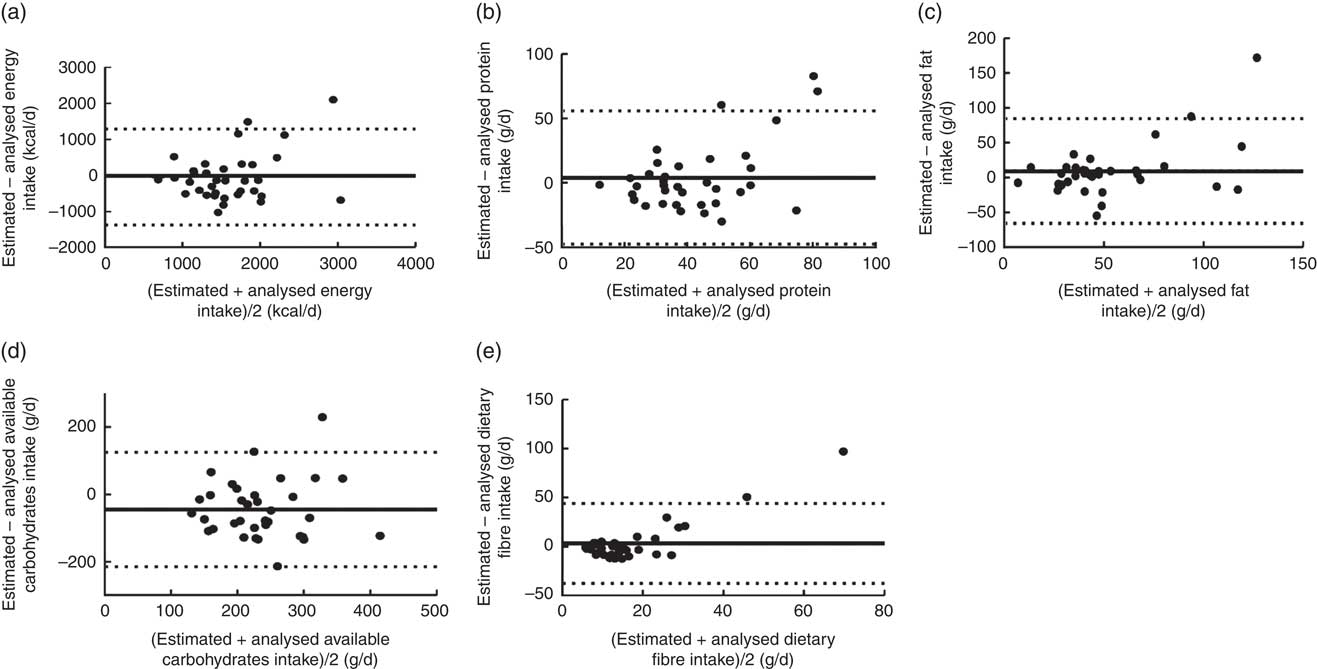
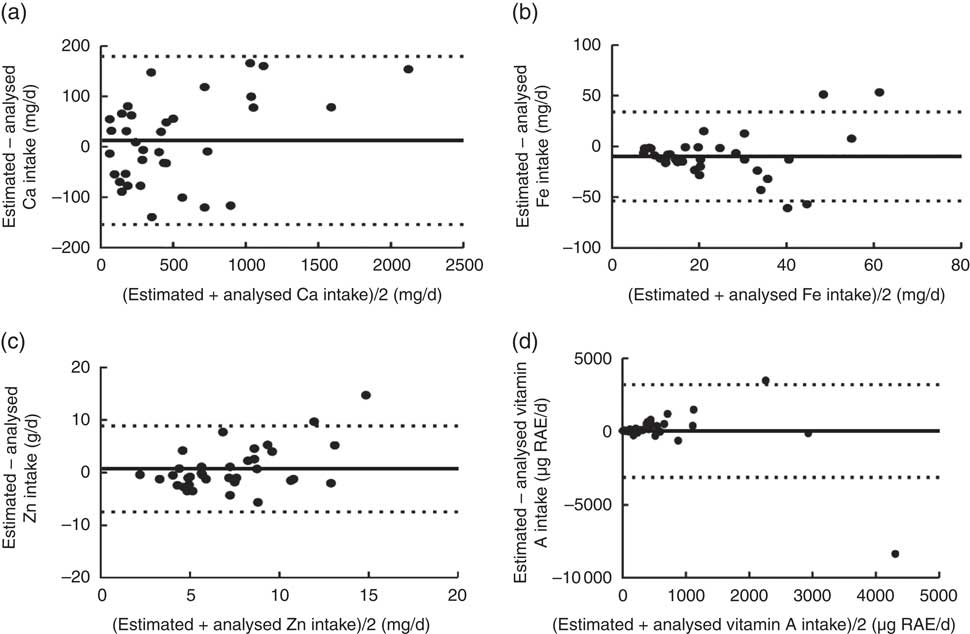
Correlation coefficients between estimated and analysed values ranged from 0·38 to 0·61 and were significant for all intakes and densities (Table 3). Bland–Altman plots showed absence of agreement between estimated and analysed values, as the variation in differences between the individual estimated and analysed values is large with wide limits of agreement (Figs 1 and 2). Regression analysis showed that the difference between estimated and analysed intakes increased with higher intake levels for most of the nutrients except for energy, available carbohydrates and Fe (Table 4). At lower average intakes, differences in Fe (<20 mg), Ca (<500 mg) and vitamin A (<1000 µg RAE) intakes were clustered around zero (Fig. 2).
Bland–Altman plots assessing the level of agreement between estimated and analysed daily macronutrient intakes among Malian women aged 15–36 years (n 35). The difference in intake between the estimated (obtained from one-day weighed food records using the adjusted Mali food composition database, a-TACAM) and analysed (using chemical analysis of duplicate portions) values is plotted v. the average intake from the two methods for: (a) energy (1 kcal=4·184 kJ), (b) protein, (c) fat, (d) available carbohydrates and (e) dietary fibre. ——represents the mean difference (bias) and – – – represent the limits of agreement
Bland–Altman plots assessing the level of agreement between estimated and analysed daily micronutrient intakes among Malian women aged 15–36 years (n 35). The difference in intake between the estimated (obtained from one-day weighed food records using the adjusted Mali food composition database, a-TACAM) and analysed (using chemical analysis of duplicate portions) values is plotted v. the average intake from the two methods for: (a) calcium, (b) iron, (c) zinc and (d) vitamin A (retinol and β-carotene expressed as retinol activity equivalents (RAE)). ——represents the mean difference (bias) and – – – represent the limits of agreement
Regression analysis of difference v. average of estimated (obtained from one-day weighed food records using the adjusted Mali food composition database, a-TACAM) and analysed (by chemical analysis of duplicate portions) energy and nutrient intakes of Malian women aged 15–36 years (n 35) at population level

RAE, retinol activity equivalents.
Discussion
The present study is the first to assess nutrient intakes in Africa from both chemical analysis and a food composition table. We compared the nutrient intakes estimated from a weighed food record using the adjusted Mali food composition table (a-TACAM) with those based on chemical analysis of duplicate portions of diets collected on the same day. Our study indicates that, at population level, the a-TACAM leads to similar mean energy and nutrient intakes as compared with analysed intakes, except for available carbohydrates, Fe and vitamin A. With respect to nutrient density, only mean estimated and analysed densities of dietary fibre, Ca and Zn are similar. In contrast, at the individual level, the agreement between estimated v. analysed nutrient intakes and densities is poor.
In general, both estimated and analysed intakes in our study population are much lower than those reported in previous studies of the FONIO project( Reference Kennedy, Fanou-Fogny and Seghieri 15 , Reference Arimond, Wiesmann and Becquey 16 ). Intake in these studies was assessed using a non-consecutive repeated 24 h recall, but limitations related to weaknesses inherent to a 24 h recall are likely not leading to the magnitude of differences found in the current study. Also, the 24 h recall was carried out with approximately 100 women. The sub-sample participating in the weighed food record was probably not representative of the main sample as the women were conveniently selected.
The presence of a field assistant in the household for a whole day and the weighing of all foods and ingredients before preparation may have caused a record bias which may explain the low average estimates of energy intake( Reference Reh 40 , Reference Nelson 41 ).
Although the underestimation is not likely to have influenced the comparison of estimated and analysed intakes, higher intakes might reduce the observed correlations because for some nutrients the difference between the estimated and analysed intakes increased with higher intakes.
In general, a discrepancy between estimated and analysed values may reflect the different methods used to derive nutrient values and the time window related to the composition of the actual foods eaten (short term, analysed) and documented composition embedded in an FCDB (long term, estimated). In our study, many values were imputed or borrowed when computing the a-TACAM. Despite the efforts that were made to have a matched food description, the foods may not be exactly the same. Also, we used retention factors from the US Department of Agriculture which may not be fully applicable to the population under study, as cooking procedures may be different. The observed differences for available carbohydrates, Fe and vitamin A intakes thus may be due to the type of foods, cultivars, genetic, agricultural and environmental factors (growing conditions, geographic location, climate, fertilizer use, and plant maturity and colour at harvest) and post-harvesting factors such as storage, processing or preparation( Reference Greenfield and Southgate 4 ), specific conditions that may prevail in the study locality that are normally not reflected in an FCDB.
The main sources of available carbohydrates in our study were starchy staples such as refined white rice, refined wheat flour, bread or millet/sorghum( Reference Kennedy, Fanou-Fogny and Seghieri 15 ). Variation may occur during the cooking process by modifying the water content and differences in water content will likely account for many of the differences in available carbohydrate content in the food( Reference Burlingame, Mouillé and Charrondière 42 ). The estimated available carbohydrates were calculated by difference; therefore a small bias in the estimation of other nutrients (protein, fat, water, ash and fibre) could propagate into the value for available carbohydrates in a specific food. In addition, a definition problem may occur with the use of total carbohydrates instead of available carbohydrates in some FCDB, such as the South African food composition database, which could have contributed to the observed differences. Moreover, nutrient values imputed from comparable foods with different moisture content but comparable component description (definition, analytical method and same expression) were adjusted to account for differences in moisture content. This could also contribute to the observed differences.
Underestimation of Fe intakes may be due to Fe contamination of drinking-water from corroded Fe pipes( Reference Sarin, Snoeyink and Bebee 43 ) or from Fe pots used for cooking because of Fe release into the food being cooked( Reference Adish, Esrey and Gyorkos 44 , Reference Kröger-Ohlsen, Trùgvason and Skibsted 45 ). The type of grinder, the Fe contamination during in-field milling of millet and sorghum, and the extraction rate when milling cereal to flour could also increase Fe content in processed cereal foods( Reference Icard-Vernière, Hama and Guyot 46 ). Soil contamination of flours is very common due to harvesting conditions of cereals and could increase the Fe content in the prepared foods if not cleaned carefully before preparation. Also, the use of water with high Fe content may have increased the Fe content of the actual foods consumed( Reference Gibson, Wawer and Fairweather-Tait 47 ). During rainy seasons, runoff water carries much organic material and suspended solids into the Niger River, the main source of piped water in Mali( Reference Gibson, Wawer and Fairweather-Tait 47 ), and could therefore increase water Fe content.
There is substantial evidence that contaminant Fe may contribute significantly to Fe intake in developing countries, when consumed in large amounts, despite the assumed poor absorption( Reference Icard-Vernière, Hama and Guyot 46 – Reference Hallberg, Björn-Rasmussen and Rossander 49 ). Gibson et al. have also reported that dietary Fe intake based on food composition data may underestimate the contribution of potentially exchangeable contaminant Fe from soil( Reference Gibson, Wawer and Fairweather-Tait 47 ). Therefore, estimated values could be closer to the reality as we are interested in available Fe.
The higher estimated vitamin A intake may have several reasons. The first is that losses may be due to storage of foods( Reference Rahman, Wahed and Ali 50 ). Losses of β-carotene related to drying and storage conditions of up to 70 % have been reported on dried sweet potatoes after 4 months of storage( Reference Bechoff, Westby and Owori 51 ). Heat treatment of red palm oil can lead to significant losses of carotene( Reference Sampaio, Ayala and Silva 52 , Reference Okiy and Oke 53 ). Another reason for the observed discrepancy between estimated and analysed values may be related to the preference of some women for specific nutrient-dense foods. For example, most of the women consumed dried okra, Jew’s mallow (jute leaves), amaranth leaves and red palm oil in sauces during the recording day. In addition, the study was done during the season of mangoes. A previous study has reported a higher content of vitamin A especially β-carotene in these foods( Reference Barikmo, Ouattara and Oshaug 12 ) and most of the women have been found consuming them. Furthermore, the major problem is that the estimated vitamin A intake based on a-TACAM could overestimate β-carotene (and therefore RAE) because the older analytical methods (from which the nutrient values were derived in the food composition table) do not differentiate between β-carotene and other carotenoids owing to the use of spectrophotometric methods. Furthermore, RAE values were missing in TACAM for all consumed foods, β-carotene and retinol values were converted into RAE; therefore a small bias in the estimation of these nutrients could propagate into the value for RAE in a specific food.
Our study was restricted to: (i) one day of food intake recording, excluding weekend days; (ii) a unique food season; and (iii) a relatively limited sample size. With the low diversity of the diet and the restriction in food choice due to low living standards (even when a large range of foods is locally available)( Reference Persson, Winkvist and Hartini 54 ), there are only a limited number of foods contributing to energy and nutrient intakes. Small errors in nutrient values of these foods, especially when eaten frequently, may contribute to large bias in intake of that particular nutrient. The small sample size may have limited our power to detect meaningful differences between analysed and estimated nutrient intakes at population level. For example, if a somewhat arbitrary mean difference of 10 % between analysed and estimated macronutrient content were considered acceptable, then a sample size of n 159 would be required to show this difference to be statistically significant.
Despite these limitations, our results are consistent with other (European) studies that documented no significant differences between calculated and analysed energy, protein and fat intakes( Reference Bedogni 55 ), but unreliable retinol and β-carotene intakes when estimated using food composition tables( Reference Fidanza and Perriello 56 ). Therefore, we conclude that the adjusted Mali food composition table a-TACAM seems sufficiently acceptable to be used for assessing average population-level intakes of energy, protein, fat, dietary fibre, Ca and Zn for low-intake populations. For estimating carbohydrates, vitamin A and Fe intakes and for assessing nutrient densities, the current Mali food composition table may lead to considerable bias.
Acknowledgements
Acknowledgements: The authors especially acknowledge and thank the enumerators for the weighed food record and the duplicate portion collection, and Mrs Traoré Soungalo F. Traoré and Mrs Camara Adam Fané (technicians in the LTA, IER) for helping with the handling and shipment of duplicate portions to Wageningen University. They also thank the laboratory staff of the Division of Human Nutrition, Wageningen University, for handling and analysing the duplicate portions. Financial support: This work was supported by the European Union (FP6/EU/INCO FONIO project; grant number INCO CT-2005-015403); the Netherlands Academic Exchange Service Organization for International Cooperation in Higher Education (NUFFIC; grant number NFP-PhD 07/30 CF3762) through a PhD scholarship to Y.K.-D.; and the Nutricia Research Foundation Training Fellowship (project number 2014-T4) through supplemental funding for ending the thesis. These funders had no role in the design, analysis or writing of this article. Conflict of interest: None. Authorship: Y.K.-D., E.L.D. and I.D.B. were responsible for formulating the research question(s), designing the study including project conception, research plan and study oversight; Y.K.-D. and E.L.D. carried out the research, analysed data and performed the statistical analysis; N.F.-F. participated in the fieldwork (the weighed food record and the collection of duplicate portions); Y.K.-D. and I.D.B. wrote the first draft of the paper; E.L.D., P.J.M.H. and D.M. provided technical input into the subsequent drafts; and Y.K.-D. had primary responsibility for the final content. All authors read and approved the final manuscript. Ethics of human subject participation: This study was conducted according to the guidelines laid down in the Declaration of Helsinki and all procedures involving human subjects/patients were approved by the ethical committee of the Malian National Institute of Research in Public Health (Mali). Written informed consent was obtained from all subjects/patients. Verbal consent was witnessed and formally recorded.



