1. Introduction
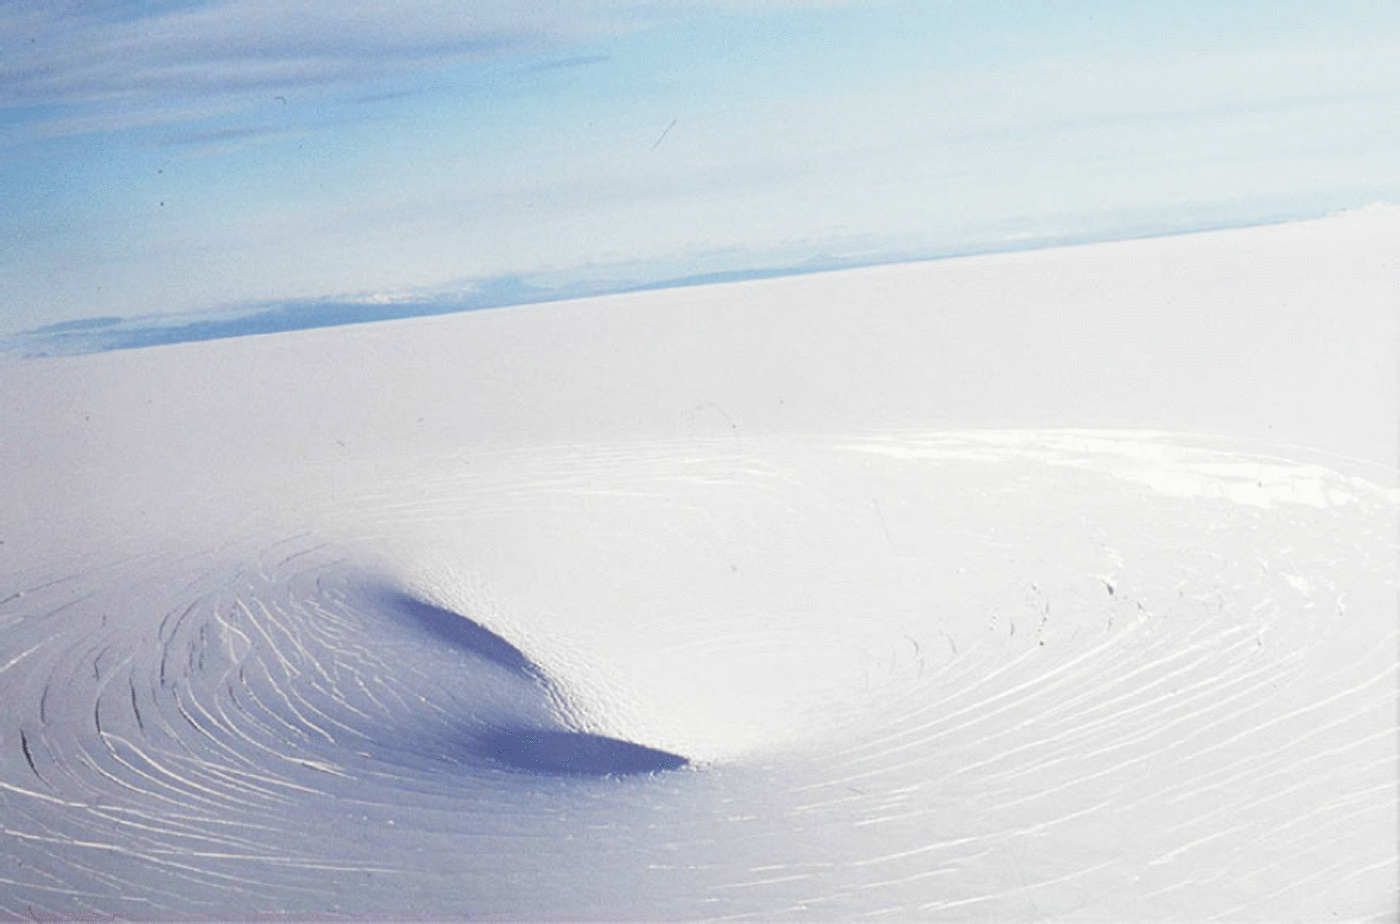
Ice cauldrons are depressions which form on ice caps when basal ice is melted to form subglacial lakes which then drain (Reference BjörnssonBjörnsson, 1988). Two well-known examples are the Skaftá cauldrons on the ice cap Vatnajökull in east Iceland, which lie above subglacial lakes which drain every year. A dramatic example of cauldron formation occurred during the 1996 eruption at Gjálp, also under Vatnajökull. Figure 1 shows a forming cauldron in its early stages. The ice surface subsided at a rate of ∽12mh–1, as the basal fissure eruption melted the subglacial ice. The resultant meltwater (∽3km3) drained towards the subglacial lake Grímsvötn, from where a jökulhlaup eventually emerged. Another less dramatic example has recently been observed on the surface of the Antarctic Ice Sheet, where a subsidence of the order of 4 m has occurred over a period of several years above an inferred subglacial lake, whose area is likely to be hundreds of km2 (Reference Wingham, Siegert, Shepherd and MuirWingham and others, 2006).
An ice cauldron forming after the Gjálp eruption under Vatnajökull in 1996. The cauldron is about 2 km in diameter and hundreds of metres deep. Ring shear fractures can be seen, indicating yield of the ice. The subsidence rate of the ice surface was initially about 12 mh–1; for further information see Reference Guðmundsson, Sigmundsson, Björnsson and HögnadóttirGuðmundsson and others (2004). Photograph courtesy of M.T. Guðmundsson.

The subsidence is not passive, as ice is viscous. The drawdown of the ice, necessary to accommodate the discharge of the subglacial floodwater, requires the floodwater to be underpressured in order that it can suck down the ice. The underpressure competes with the viscosity of the ice, and the consequence is that there must be a dynamic relationship between the underpressure and the rate of subsidence of the ice.
The purpose of this paper is to propose the nucleus of a theory that will predict how the rate at which the ice surface deforms is related to the water pressure in the basal lake. This theory will apply to cauldrons such as that in Figure 1, and also to the smaller depressions which have recently been observed on the surface of the Antarctic Ice Sheet (Reference Wingham, Siegert, Shepherd and MuirWingham and others, 2006). The basis for our theory lies in the approximate treatment of the ice overlying the lake as a viscous ‘beam’. The theory is essentially that of classical beam theory in elasticity, except that viscosity replaces elasticity thus introducing an extra time derivative to the problem. The approximation is based on the large aspect ratio of the ice, and is thus a version of the shallow ice approximation. It is similar to the description of ice shelf dynamics, insofar as normal stresses are dominant, but there the similarity ends. Since space is restricted, this paper provides a theoretical summary. For full details, see Reference EvattEvatt (2006).
2. Viscous Beam Theory
2.1. Basic equations
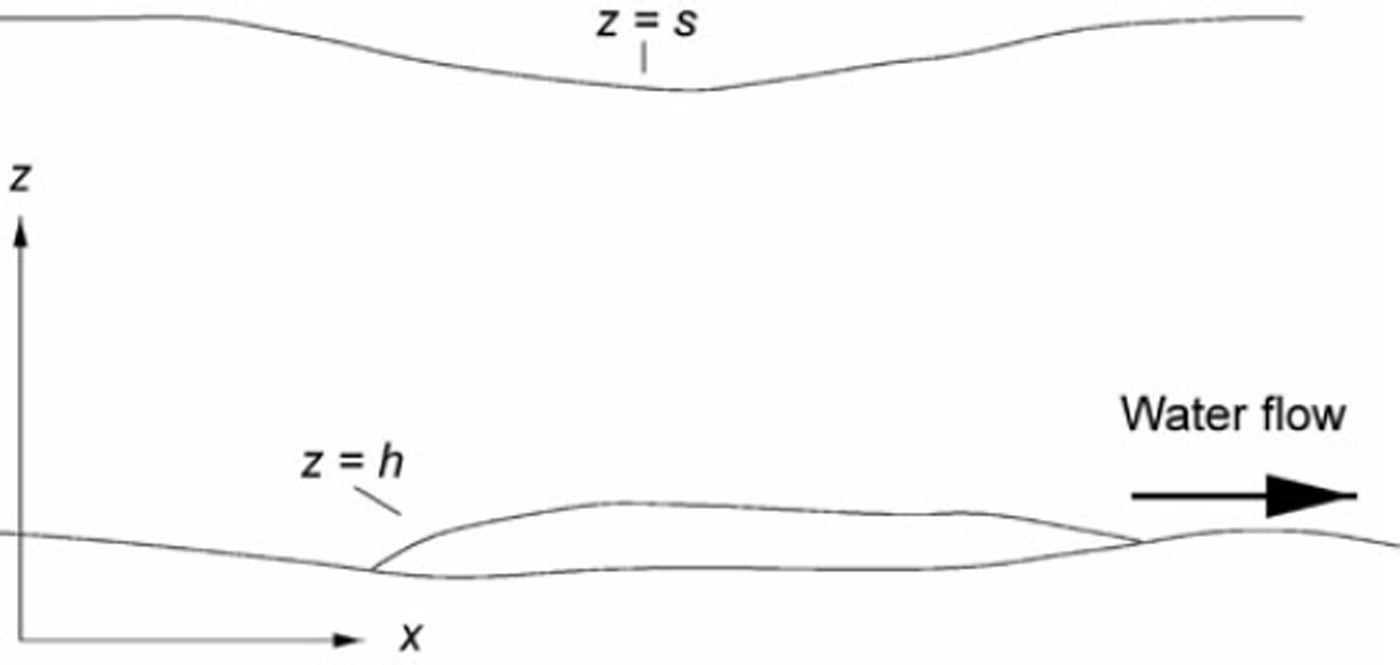
The geometry of the situation we wish to consider is shown in Figure 2. For simplicity and pedagogy, we work in two dimensions: x and z. The corresponding components of velocity are u and w, the deviatoric longitudinal stress is Ƭ 1 and the shear stress is Ƭ 3. The equations of slow flow (that is, flow at zero Reynolds number, also known as Stokes flow) can then be written in the form (where subscripts x, z and later t denote partial derivatives)
Schematic diagram of cauldron geometry.

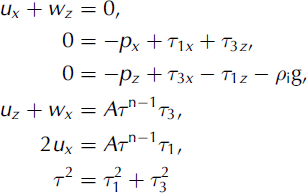
where p is pressure, is the second stress invariant, A is the flow law rate coefficient, typically dependent on temperature, n (=3) is the exponent in Glen’s law, ρ i is ice density, and g is the acceleration due to gravity. The boundary conditions at the top and bottom surfaces are those of stress continuity and material integrity (manifested as the kinematic condition). These boundary conditions take the following forms: on z = s,

while at the lake roof z = h,
where a is the surface accumulation rate and m is the basal melt rate.
In addition, we suppose that the water pressure in the lake is hydrostatic, which implies
Finally, if the net volume flux out of the lake is Q, then

where A L is the lake area. Our 2-dimensional theory assumes the lake is rectangular in shape.
2.2 Non-dimensionalization
Let us suppose that the lake is of width l and the ice is of depth d. We define the aspect ratio to be
The basis of viscous beam theory (Reference HowellHowell, 1996; Reference RibeRibe, 2001) is the assumption that ν is small. We suppose that a suitable scale for the rate of subsidence is w s, and that a suitable scale for the longitudinal stress is ƬA . In beam theory, the greatest stresses are normal stresses, and if we consider also the variation of the flow rate coefficient A with temperature, then the rate-controlling value of A is its minimal value, obtained at the surface. We let A s denote this surface value, and suppose for simplicity that it is constant. The drainage from the lake is controlled by the effective pressure of the lake (Reference NyeNye, 1976), defined as
and we suppose that a typical value of this is N 0 and that the time scale appropriate to channel drainage is t 0.
It is appropriate to scale the variables as
The beam stress is chosen to be

in order to balance terms in the definition of longitudinal strain rate.
With these scales, the equations become
and we retain the now dimensionless A in case we want to have it as a function of temperature and thus depth: in the present paper, only the case A = 1 is considered.
The boundary conditions become, on the surface z = s,
where
and
On the lake roof, z = h,
where
The parameters and ß are defined by
The lake hydrostatic condition Equation (4) becomes
where
and the lake refilling equation (5) becomes, in dimensionless terms,
where x – and x + are the upstream and downstream positions of the lake margins.
The deflation rate scale w s must be determined, if the effective pressure scale is known. The way it is chosen is by selecting the parameter μ to balance terms in the hydrostatic equation, and we do this by choosing
and we will see that this is appropriate for closed subsurface lakes.
The three other parameters involved in finding an approximate solution to this set of equations are γ, β and ν. Generally, we can assume γ ≳ 1, ν ≪ 1 and β ≳ 1. We therefore begin by seeking approximate solutions for ν ≪ 1, and then subsequently considering possible choices for γ and β. The limit ν → 0 is the classical approximation associated with beam theory.
2.3 The beam equation
With ν ≪ 1, we havew ≈ w(x, t ), Ƭ ≈ |Ƭ 1| and uz þ wx ≈ 0, from which we obtain
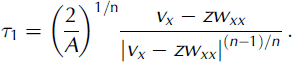
where v(x, t ) is to be determined. From Equations (10), (11) and (14), we see that p þ Ƭ 1 ∽ ∽β 2. (Strictly, this requires γβ ∽ ν2 but for the moment we only use this to motivate the definition of the following equation. See later comment after Equation (28).) We therefore define
From (21), we find
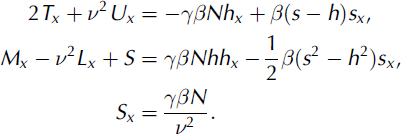
We now define three quantities: the bending moment M, the shear force S and the tension T as

We also define the secondary quantities uplift force U and lifting torque L to be

Integrating the force balance equations and applying the boundary conditions at z = s and z = h, we find that
Subject to suitable boundary conditions, these equations will enable us to provide a closed solution which determines the surface depression rate –w in terms of the underlying effective pressure N.
The simplest assumption for the boundary conditions is that the positions of the lake margins are fixed, so that the values xare constant. The ice at the margins does not subside, so we set
In reality, the margins will move as the ice sags, forming a moving grounding line problem. The solution in the case of ice sheet/ice shelf transition is itself non-trivial (Reference SchoofSchoof, 2007).
The second condition at a margin is less easy to motivate. The horizontal velocity scale in the beam is ∽w s (see Equation (8)), so that for the rapid subsidence in the Vatnajökull cauldrons, we would expect to prescribe u = 0 and thus v = wx = 0 at the margin (clamped conditions). For the much smaller rates of subsidence appropriate to the Antarctic sub-glacial lake (Reference Wingham, Siegert, Shepherd and MuirWingham and others, 2006), the horizontal velocity scale is much smaller than that of the surrounding ice-sheet ice. A more appropriate boundary condition may be to prescribe zero longitudinal stress, thus Ƭ 1 = 0. Another argument in favour of this is that the beam stress ƬA will typically be much larger than the normal stress scale in the ice sheet.
Another consideration is the effect of temperature in the ice. The rate of subsidence in the beam depends on the surface rate constant A s and the beam stress ƬA . The effective beam viscosity is thus Generally the beam stresses are higher than the basal shear stress beyond the lake, while the surface rate coefficient may be much lower: for example, in Antarctica. If we suppose that the beam ice is much stiffer than the ice-sheet ice, then this also suggests conditions of zero longitudinal stress at the margins, i.e. Ƭ 1 = 0.
None of these arguments are watertight, and the issue of the correct choice of effective boundary conditions is one of difficulty. We do not pursue the issue further in this paper, but to be specific we will choose conditions of zero longitudinal stress at the margins, based on the idea that the ice-sheet ice is very weak in comparison to the beam ice.
Neglecting terms in ν makes it unlikely that we can satisfy this pointwise, but we can certainly suppose that this condition can be applied in a vertically integrated sense. We therefore
We solve Equations (26) by formally assuming γβ ∽ ν 2. This is useful for exposition, but in fact the resulting approximations are still valid even if γβ ≫ γβ2, as is easily checked. The only term we retain on the right hand sides of Equations (26) is therefore the forcing term for S. Neglecting terms of relative O(γβ), we then have that T = T(t ) and the boundary conditions (28) imply that T = 0. A consequence of this from Equation (23) is that
where z m is the mid-depth point, defined as
From this it follows that
where
and the beam equation takes the resultant form
subject to
An expression for N results from the hydrostatic equation (17), together with the approximate kinematic equations
Let us suppose for simplicity that a * and m * are negligible. Then the depth H = s – h depends only on x. If we suppose that it is constant, then sx = hx and the integral of Equation (17) is, from the definition of μ in Equation (20),
where s = sþ (constant, since w = 0 at xþ) and N = Nþ at x = xþ. Differentiating, we finally have
In the assumptions made in choosing scales t 0, N 0 and w s, the terms in Equation (37) are all O(1), and it is this which motivates the choice made in Equation (20).
2.4 An approximate solution
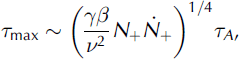
An approximate solution to the beam equation (33) and the lake refilling equation (37) can be obtained using a boundary layer theory. For details, see Reference Evatt, Fowler, Clark and HultonEvatt (2006). Here we summarize the results. We first estimate the size of the term γβ/γβ 2 for the cauldron in Figure 1. The ice depth is about 500m and the cauldron width ∽2 km, so we take γβ ∽ 0:2. The product γβ = N 0 /ƬA is the ratio of the channel effective pressure scale to the beam stress. Typical values of w s ≈ 105ma–1 (12mh–1), A s ≈ 10–2 bar–3 a–1 (based on a surface temperature of –108C; see Reference PatersonPaterson, 1994) and n = 3 are employed; with these values, we find ƬA ≈ 20 bar. This is comparable to typical estimates of channel effective pressure (Reference EvattEvatt, 2006), and then γβ ∽ Oð1Þ and γβ/γβ 2 ≫ 1. In this case, the solution becomes of singular perturbation type, and supports boundary layers near the lake margins.
There is a central flat portion of the ice beam in which N ≈ 0, i.e. the ice is essentially floating. The refilling equation together with Equation (19) then implies that the boundary condition for the flow in the channel is
which is essentially the same refilling condition that has been used in the past (Reference FowlerFowler, 1999). This is the first conclusion of the present study.
Near the margins, there are boundary layers of thickness
The governing boundary layer equation has a similar solution if we assume that the rising limb of the flood hydrograph is given by a power law of the form
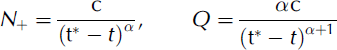
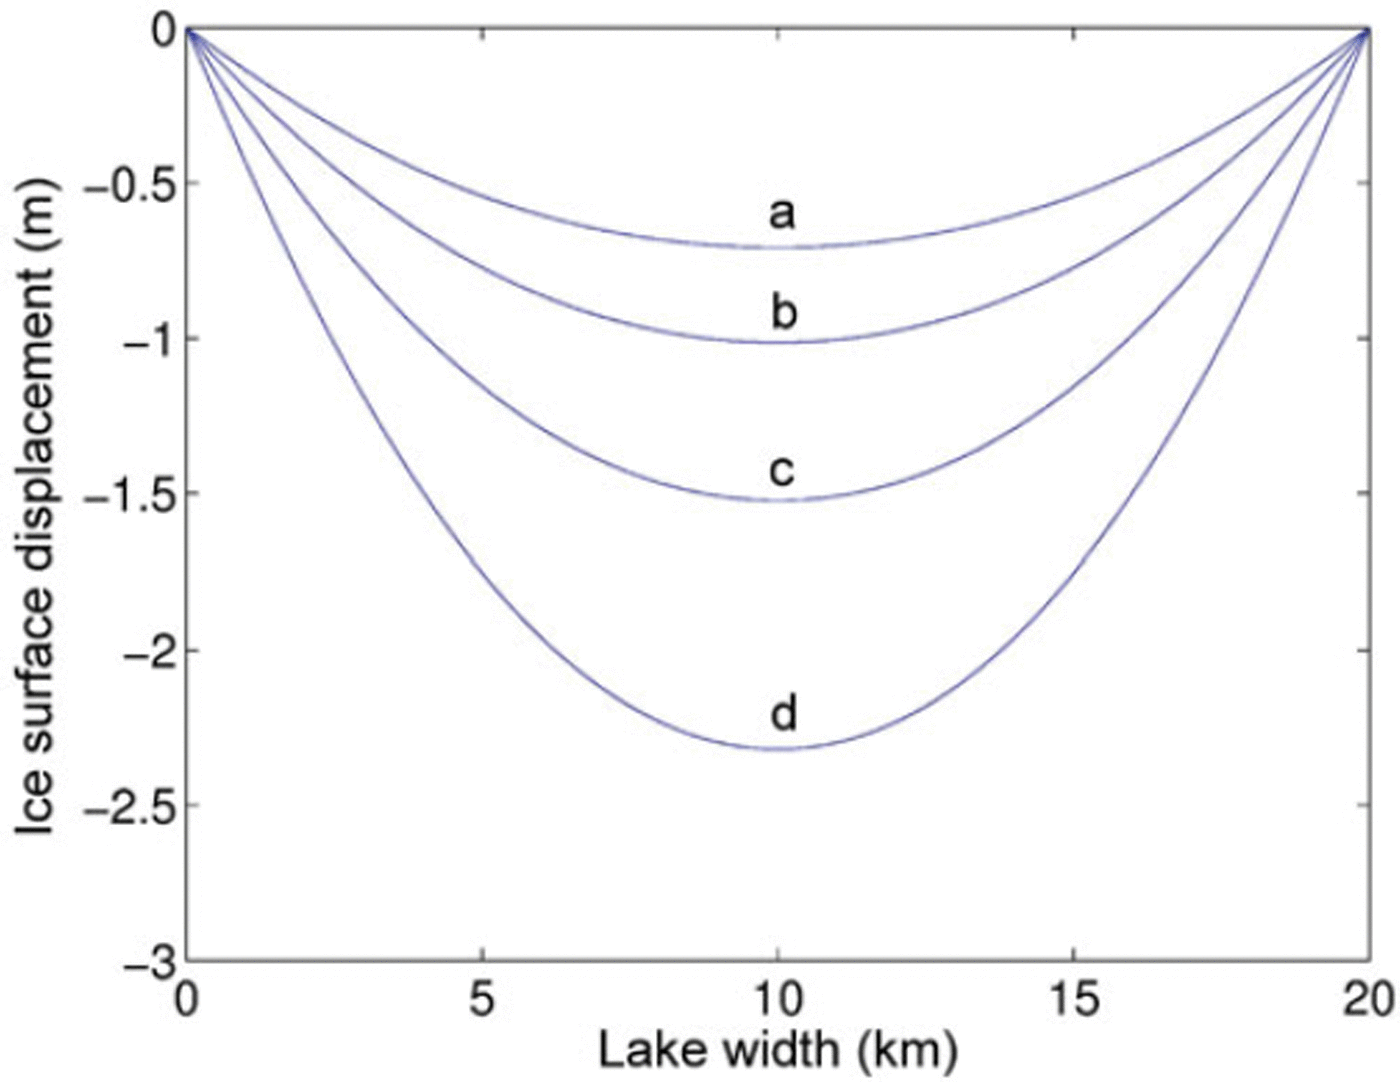
where c and α are positive constants. This was demonstrated by Reference NyeNye (1976) with α = 3. Here t is time and t* is a constant chosen to fit the numerically computed form of the hydrograph. An essentially analytic solution for w can thus be obtained, and from this the surface deformation history can be computed by integrating Equation (35). The result of doing this is shown in Figure 3, which shows a theoretical subsidence sequence above a lake whose discharge follows the Nye rising hydrograph equation (40). The parameter choices for this lake are chosen to be appropriate for a sub-Antarctic lake.
Solution of Equation (35) (beginning at t = 0 days) at times t = 350 days (a), t = 371 days (b), t = 382 days (c) and t = 393 days (d) using Equation (40) for Nþ, with t = 1, c = 2.5 10–3, α = 3, γβ/ν2 = 15.8, and a time scale of t 0 = 416 days. The units of vertical subsidence are in metres, and the units of horizontal distance are km. The results in the figure correspond to a choice of μd = N 0 /ρ ig = 3 m, and thus N 0 = 0.3 bar. The results are plotted for a lake of width 20 km, in which case if d = 4 km and γβ = 0.2 γβ = 0.63, corresponding to a value of A = 0.48 bar. No surface fracture is expected in this case.

3. Cauldrons and Ring Fractures
It is of interest to calculate the maximum stress in the beam. From Equation (23), the maximum stress is at the surface and base of the ice, and is given by
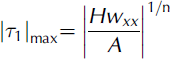
We can use the boundary layer theory to estimate the maximum stress. After some algebra, we find that the maximum dimensional stress is
where we take n = 3. This occurs at a distance from the margin of
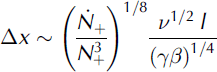
where l is the lake width. If Ƭ max reaches the yield stress c of ice, then the ice will fracture forming a crevasse and the overlake ice will reset itself to the application of effective boundary conditions at the position of this ring fracture. Thereafter, continued rise of effective pressure will allow a new ring fracture to occur in-lake of the old fracture, and in this way a sequence of such fractures may form, with a spacing indicated by Equation (43) as seen in Figure 1. If we equate Ƭ max = Ƭ c and use Equation (42) to eliminate N_ þ, we find that the fracture spacing should be
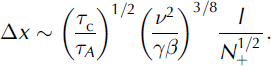
If A ≫ c and γβ/ν2 ≫ 1, as we surmise for the cauldron of Figure 1, then we see that Δx ≪ l (clearly observed in Fig. 1). However, it is not easy to get good quantitative agreement with observed fracture spacing for which a consideration of viscoelastic effects may be necessary.
4. Floods in the Antarctic
Recently, Reference Wingham, Siegert, Shepherd and MuirWingham and others (2006) observed subsidence of the Antarctic ice sheet surface of the order of 4m occurring over a period of ∽3 years. They ascribe these local deflations to small lake flooding events (one lake floods into another 300 km away, above which the ice surface rises several metres). Our theory can be applied to these floods provided the value of μ in Equation (35) is appropriate; specifically, we need μd ≈ 4m. From Equations (20) and (16), μ ≈ γ = N0/ρigd, so we see that the depth of subsidence is of the order N 0 /ρ ig. Assuming this is 4 m, we infer that N 0 ≈ 0.4 bar. This is essentially the value that was inferred for the effective pressure under ice stream B (Whillans ice stream) (Reference Blankenship, Bentley, Rooney and AlleyBlankenship and others, 1987), where the ice overlies marine sediment (Reference Kamb, Alley and BindschadlerKamb, 2001). The lake described by Reference Wingham, Siegert, Shepherd and MuirWingham and others (2006) lies in the Adventure subglacial trench, which was presumably a large lake even before Antarctic glaciation (Reference DrewryDrewry, 1983, sheet 6), and thus likely to be bedded with glaciolacustrine sediments. We interpret the small subsidence observed by Reference Wingham, Siegert, Shepherd and MuirWingham and others (2006) as indicative of a high-pressure canal-type drainage system (Reference Walder and FowlerWalder and Fowler, 1994), although jökulhlaups in such drainage systems have not previously been described. Other interpretations are possible: for example, that the lake was small and simply emptied.
Figure 3 shows a sequence of the surface profiles s as time increases, obtained by solving the surface kinematic equation (35). The two features of these shapes are their depth and the sharpness of the boundary layers. The depth is controlled by the parameter μ = γ while the boundary layer thickness is (γβ/ν2)½ The depression of the surface of ∽3m (over an ice depth of 4000 m) suggests that μ ∽ 10–3 and N 0 ∽ 0.3 bar. To calculate γβ = N0/TA′ we use the definition of ƬA in Equation (9). With γβ ∽0.2, w s ∽ 3 ma–1, d ∽ 4000 m, A s ∽ 10–4 bar–3 a–1 (at –508C; Reference PatersonPaterson, 1994), we find ƬA ∽ 0.67 bar and thus γβ ∽ 0:45. With γβ ∽ 0:2
(a 20km wide lake), we have the boundary layer width (ν2/γβ)¼ ∽ 0:55. In this case the boundary layers are quite wide, as indicated in Figure 3, where they essentially extend to the centre of the depression.
5. Conclusions
The formation of cauldrons on the surface of ice caps is associated with the emptying of subglacial lakes. The rate of subsidence is directly related to the rate of lake discharge, but requires an underpressure in the lake in order to drawdown the overlying ice. The underpressure in the lake is therefore related to the rate of subglacial lake discharge. This has consequences for theories of jökulhlaups, since this relationship is an essential part of the flood hydrograph theory. Previous theories (e.g. Reference NyeNye, 1976) have in effect simply assumed a flotation condition for the ice over the lake, but it is not obvious that this will apply when the lake is isolated from the atmosphere. In this paper we have presented the elements of a theory which can be used to predict the relationship between ice surface subsidence and lake underpressure. The theory is that of a viscous beam (Reference HowellHowell, 1996; Reference RibeRibe, 2001), and is based on the assumption of small aspect ratio (depth/length) of the ice above the lake. Providing a further parameter γβ = N0/TA is not too small, where N 0 is the scale of the effective pressure at the entrance to the lake drainage channel and ƬA is the size of the deviatoric normal stress in the ice, a boundary layer theory shows that the bulk of the ice can effectively be considered to be approximately in flotation, thus vindicating the Nye assumption for closed subglacial lakes.
For rapid channel drainage, such as occurs following subglacial volcanic eruptions, the induced beam stresses may be very large (of the order 10 bar), and will cause closely spaced ring fractures to occur in the beam as it collapses. The present theory can be used to predict an approximate fracture spacing, but does not seem to give good quantitative agreement with observation, perhaps because the model is not sophisticated enough.
The recent observation of small subsidence events (of the order of metres) on Antarctica is indicative of small floods. The duration of these floods (with a time scale of a year) is comparable to those of simulations using Nye’s (1976) theory (Reference Evatt, Fowler, Clark and HultonEvatt and others, 2006), but the slight depressions either indicate very shallow lakes, or may imply that such floods occur in channelized flow over soft sediments at low effective pressure. We consider this latter (tentative) explanation to be more robust. It raises further questions concerning the nature of hydraulic drainage under ice sheets.
Acknowledgements
G.W.E. thanks W.H.R. Evatt for financial support and the Centre for Polar and Ocean Modelling at University College, London, for the award of a research assistantship. A.C.F. thanks the University of Limerick for their continued support of his research.