


Experimental models that test the limits of human function have been instrumental in characterising the capacity and regulation of numerous physiological systems, including the capacity for maximal O2 uptake(Reference Hill, Long and Lupton1), time spent without energy intake(Reference Stewart and Fleming2) and most recently maximal levels of sustained energy expenditure(Reference Thurber, Dugas and Ocobock3). This approach advances our fundamental understanding of human physiology and provides important insights into susceptibility towards pathophysiology. For over 100 years, however, our knowledge about metabolic health and disease has been derived almost entirely from experiments that investigate an appropriate quantity of food, either according to prescribed requirements or perceived hunger. A major rationale for such studies is to address the negative health outcomes associated with obesity, which is caused by an inappropriate quantity of food being consumed – with nutrient consumption exceeding energy requirements.
It is remarkable that, to our knowledge, no study has ever examined the metabolic response to eating beyond feeling comfortably full in a single eating occasion. Indeed, even more general data on the physiological limits of human eating are scarce. Some data from the Massa tribe of Cameroon suggest humans can sustain intake of approximately 36·6 MJ/d for 2 months and gain approximately 11 kg of adipose tissue as a result, but no metabolic outcomes were measured(Reference Pasquet, Brigant and Froment4). Metabolic effects of prescribed overfeeding are better understood, revealing disruption of glycaemic control after just 24 h when a 78 % energy surplus is prescribed(Reference Parry, Woods and Hodson5). Similar detriments to glycaemic control have been well characterised following 7 d energy surplus of approximately 50 %(Reference Parry, Smith and Corbett6–Reference Walhin, Richardson and Betts8). This disruption of glycaemia results in marked increases in TAG and VLDL-TAG concentrations and reduced VLDL-TAG clearance, after 4 d in healthy men(Reference Aarsland, Chinkes and Wolfe9). Nonetheless, these studies did not test the capacity, or the metabolic consequences, of a maximal effort to overeat.
Data on the metabolic consequences of eating to the limits of human physiology will provide novel insights regarding the physiological responses to common overeating that drives our ongoing obesity epidemic and the extreme overeating that occurs on certain occasions. Moreover, investigating extremes is an effective method to fully understand how systems are regulated more generally – so this approach may advance future understanding of the mechanisms associated with human obesity and metabolism, thus identifying potential targets for body weight management and metabolic health. In the present study, we established the metabolic, endocrine, appetite and mood responses to both eating until comfortably full and eating beyond comfortably full to the perceived point of maximal eating.
Experimental methods
Study design
Fourteen men (mean: age 28 (sd 5) years, body mass 77·2 (sd 6·6) kg, height 1·79 (sd 0·05) m and BMI 24·2 (sd 2·2) kg/m2) completed a randomised crossover study with two trials. On one occasion, participants ate a homogenous mixed-macronutrient meal (Margherita cheese and tomato pizza) until they were comfortably full, and on the other occasion, they were asked to eat the same food but until they could not eat another bite. Metabolic, endocrine, appetite and mood responses to the test meals were measured for 4 h following ingestion of the first bite. This study was approved by the Research Ethics Committee for Health (reference number EP 17/18168) at the University of Bath. Inclusion criteria were a BMI between 18·5 and 29·9 kg/m2, age between 18 and 65 years, able and willing to consent to the study procedures and no anticipated change in lifestyle between trial dates. Exclusion criteria were any reported condition or behaviour/any reported use of substances which may pose undue personal risk to the participant or introduce bias to the experiment, or any diagnosed metabolic disease. Trials were separated by a mean of 33 (sd 20; range 14–76) d. Randomisation was completed by A. H. using www.randomizer.org. Water intake was permitted ad libitum throughout each trial.
Preliminary measures
Participants were asked to adhere to their habitual diet and physical activity for the 48 h preceding trial days. They recorded what they ate for dinner the evening before their trial day and replicated this before their second trial day. Participants were asked to record how they commuted to the laboratory on the morning of the trial day and replicate this for the second trial day. Participants were asked to consume a pint of water between waking and travelling to the laboratory.
Anthropometric measures
Participants arrived in the laboratory at approximately 10.00 hours having fasted for >10 h. Height was measured using a stadiometer in the Frankfurt plane (Harpenden; Holtain Ltd). Body mass was measured using a balance scale (Weylux 424; H. Fereday & Sons Ltd) with participants wearing light clothing. Waist and hip circumferences were measured using a handheld tape measure (Seca Ltd). Sagittal abdominal diameter was measured at end-tidal volume with participants lying supine with their legs bent at 45° using an abdominal calliper (Holtain Ltd).
Whole-body physiological measures
Participants were asked to sit, and tympanic temperature was measured using a handheld thermometer (Braun Thermoscan). Blood pressure and heart rate were measured using an automated sphygmomanometer (Diagnostec EW3106; Panasonic). Hand grip strength was measured using a handheld dynamometer (T.K.K.5001 GRIP A; Takei Scientific Instruments Co. Ltd). Participants remained seated with the arm straightened proximal to the body, and the highest of three attempts was recorded.
Blood sampling and analysis
A cannula (BD VenflonTM Pro; Becton Dickenson & Co.) was inserted antegrade into an antecubital forearm vein approximately 15–45 min prior to ingestion of the meal. A 5 ml of blood was drawn at each sample. The cannula was flushed with sterile NaCl 0·9 % (B. Braun) to maintain patency throughout the trial (repeated at each blood sample; 0, 30, 60, 90, 120 and 240 min). Blood samples were aliquoted into sterile collection tubes (Sarstedt). Samples were left to clot at room temperature for 15 min before being centrifuged at 4000 g for 10 min at 4°C. Serum was placed on dry ice and then stored at −80°C awaiting analyses. Serum glucose, TAG, NEFA and lactate were measured using commercially available assay kits on an automated analyser (RX Daytona; Randox Laboratories Ltd). Inter-assay CV were <3 % for glucose, <2 % for TAG, <7 % for NEFA and <3 % for lactate. Intra-assay CV were <2 % for glucose, <2 % for TAG, <5 % for NEFA and <3 % for lactate. Serum insulin was measured using a commercially available ELISA kit (Mercodia AB), with an intra-assay CV of <5 %. Insulin concentrations were converted from µIU/ml to pmol/l using the conversion 1 µIU/ml = 6000 pmol/l(Reference Knopp, Holder-Pearson and Chase10). Serum total ghrelin, total glucose-dependent insulinotropic peptide (GIP), total glucagon-like peptide-1 (GLP-1) and total peptide tyrosine–tyrosine (PYY) were measured using commercially available ELISA kits (MilliporeSigma). Intra- and inter-assay CV were <4 and <7 % for ghrelin, <5 and <7 % for GIP, <8 and <15 % for GLP-1 and <8 and <12 % for PYY, respectively.
Appetite and mood ratings
Participants completed a series of 0–100 mm appetite and mood scales, with each scale ranging from ‘Not at all’ (0) to ‘Extremely’ (100). They were instructed to draw a straight vertical line on the scale relating to how they felt in relation to a number of statements at the time of measurement. Statements asked included ‘I feel hungry’, ‘my stomach feels full’, ‘I have desire to eat something savoury’, ‘I have desire to eat something sweet’, ‘I feel physically tired’, ‘I feel sleepy/drowsy/half awake’, ‘I feel energetic/active/lively’ and ‘I feel lethargic/sluggish’. The scales were completed at baseline, immediately following cessation of the meal, and at 4 h following ingestion of the first bite. Appetite and mood ratings have previously been validated for use in nutrition research(Reference Flint, Raben and Blundell11,Reference Hamer, Dye and Siobhan Mitchell12) .
Test meal
The test meals were delivered to the laboratory at 11.00 hours and were sliced by the research team into small, consistently portioned, slices to serve to the participants (mean slice weight 77·5 (sd 18·5) g, range 40·3–145·4 g, n 305). The test meal was Domino’s® Original Cheese & Tomato Classic Crust pizza. Nutrition information per 100 g: energy 1188 kJ, fat 10·3 g, of which saturates 5·5 g, carbohydrate 33·5 g, of which sugars 6·7 g, fibre 2·0 g, protein 13·4 g, salt 1·31 g (obtained online 21 June 2018). In the ad libitum trial, participants were instructed to ‘eat until you are comfortably full’, ‘eat all you would like to eat’ and ‘until you have satiated your hunger’. In the maximal trial, they were instructed ‘this is maximal eating’, ‘eat all you can eat’ and ‘until you cannot physically eat another bite’. Up to four participants completed their trial at the same time with tables facing the corner of the room. During the test meal, participants were asked not to communicate with each other. Participants were instructed to place their hand in the air when they had finished a pizza slice and wanted another. Participants weighed the slice when they received it using portable weighing scales (Smart Weigh) and recorded the time on their stopwatch each time they finished a slice. If a slice could not be finished, the leftovers were weighed. Energy and nutrient intakes were determined by multiplying the energy density of the food by the mass of food consumed.
When participants finished ingesting the pizza, measures of waist and hip circumferences, sagittal abdominal diameter, tympanic temperature, blood pressure, heart rate, hand grip strength and appetite/mood ratings were obtained. These measures were repeated a final time at 240 min following ingestion of the first bite. Blood samples were obtained at 30, 60, 90, 120, 180 and 240 min following ingestion of the first bite of pizza. Blood pressure was measured at 60, 120, 180 and 240 min following ingestion of the first bite of pizza. Participants sat upright on chairs for the duration of each trial. Participants were not permitted to perform any activities other than eating during the feeding period. Once they had indicated they no longer wished to eat, they could engage in sedentary activities like reading, using a smartphone or using a laptop.
Statistical analyses
Descriptive statistics were calculated using Microsoft Excel (Microsoft). Energy intake, AUC and incremental AUC (iAUC) were compared using a paired t test. Paired data were first assessed for a normal distribution using a Shapiro–Wilk test, along with visual inspection of frequency distributions (Wilcoxon tests applied wherever paired differences deviated significantly from a normal distribution). Similarly, the possibility of order effects between treatments for the above parameters was explored using a two-way ANOVA with condition, order and condition-by-order terms included in the model, along with visual inspection of individual responses under each sequence (there were no significant main effects of trial order for any variable and reported effects of condition were evident irrespective of the order in which conditions were applied). Baseline data were also subjected to this same analysis for trial order effects, which revealed no differences between the first and second trials for any outcome. For all other outcomes that involved time-series measurements within trials, two-way repeated-measures ANOVA was used to detect significant time, trial or time × trial interactions, with post hoc Šidák corrections applied using GraphPad Prism (GraphPad Software Inc.). Significance was accepted as p ≤ 0·05. Data are presented as mean (lower 95 % CI, upper 95 % CI) unless otherwise stated.
Results
Energy intake and eating rate
Mean energy intake was 6397 (95 % CI 4481, 8313) kJ (1529 (95 % CI 1071, 1987) kcal) greater in the maximal trial compared with the ad libitum trial (Fig. 1(a)). Eating rate appeared to be similar between trials (Fig. 1(b)). Mean eating time was 16 (sd 5) min for the ad libitum trial and 53 (sd 13) min for the maximal trial (P < 0·01). Mean nutrient intakes from each trial and reference nutrient intakes for UK adults are displayed in Table 1. Mean pizza slices were 76 (sd 20) g; there were no differences in pizza slices between trials (ad libitum 75 (sd 21) g, maximal 76 (sd 20) g, P = 0·60).
(a) Mean, 95 % confidence interval and individual energy intake achieved during an ad libitum and maximal eating occasion (condition effect P < 0·01). Macronutrient contribution to energy intake is displayed. CHO, carbohydrate, PRO, protein. (b) Individual eating rate towards cessation of eating during an ad libitum and maximal eating occasion.

Nutrient intakes following ad libitum and maximal eating*
(Mean values and standard deviations)
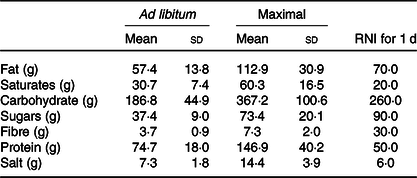
RNI, reference nutrient intakes.
* Daily RNI for UK adults are displayed for comparison.
Metabolic responses
Serum insulin concentrations increased more in the maximal trial v. ad libitum (Fig. 2(a)). Serum insulin iAUC was 55 % greater in the maximal (67·7 (95 % CI 47·0, 88·5) nmol/l × 240 min) v. ad libitum trial (43·8 (95 % CI 28·3, 59·3) nmol/l × 240 min, P < 0·01; Fig. 2(b)). Serum glucose concentrations were not significantly different between trials (Fig. 2(c)). Serum glucose iAUC did not differ between trials (P = 0·19; Fig. 2(d)).
Mean (95 % CI) serum concentrations of insulin ((a) condition effect: P = 0·03, time × condition interaction effect: P = 0·13), glucose ((c) trial effect: P = 0·09, time × condition interaction effect: P = 0·28), TAG ((e) condition effect: P = 0·10; time × condition interaction effect: P < 0·01), NEFA ((g) condition effect: P = 0·15; time × trial interaction effect: P = 0·24) and lactate ((i) time effect: P < 0·01; condition effect: P = 0·16; time × condition interaction effect: P = 0·84) in the 4-h postprandial period following an ad libitum and maximal eating occasion. Mean (95 % CI) and individual incremental AUC (iAUC) for serum insulin (b), glucose (d), TAG (f) and total AUC for serum NEFA (h) and lactate (j) across the 4-h postprandial period following an ad libitum and maximal eating occasion. † Wilcoxon test used as data non-normally distributed. * P < 0·05. (a, c, e, g, i) ![]() , ad libitum;
, ad libitum; ![]() , maximal.
, maximal.

Serum TAG concentrations remaining significantly elevated in the maximal v. ad libitum trial (Fig. 2(e)). Serum TAG iAUC was greater in the maximal trial v. ad libitum (P < 0·01; Fig. 2(f)). Serum NEFA concentrations were not statistically different between trials (Fig. 2(g)). Serum NEFA AUC tended to be greater in maximal trial v. ad libitum (P = 0·06; Fig. 2(h)). There was a condition-by-order interaction effect (P = 0·01) for serum NEFA AUC but no order effect per se (P = 0·41). Serum lactate concentrations were similar between trials, but decreased in both trials at 30 min compared with baseline (Fig. 2(i)). Serum lactate AUC was similar between the trials (P = 0·14; Fig. 2(j)).
Gut hormones
Serum total ghrelin concentrations decreased in both trials without differences between trials (Fig. 3(a)). Serum total ghrelin AUC was lower in the maximal trial than in ad libitum (P = 0·02; Fig. 3(b)). There was a condition-by-order interaction effect for serum ghrelin AUC (P = 0·04) but no effect of order per se (P = 0·08). Serum total GIP concentrations increased more in the maximal trial compared with ad libitum at 240 min postprandial (Fig. 3(c)). Serum total GIP iAUC was greater in the maximal trial compared with ad libitum (P < 0·01; Fig. 3(d)). Serum total GLP-1 concentrations increased more in the maximal trial than in ad libitum (Fig. 3(e)). Serum total GLP-1 iAUC was greater in the maximal trial than in the ad libitum trial (P < 0·01; Fig. 3(f)). Serum total PYY concentrations increased more in the maximal trial than in ad libitum by 240 min postprandial (Fig. 3(g)). Serum total PYY iAUC was greater in the maximal trial than in ad libitum (P = 0·03; Fig. 3(h)).
Mean (95 % CI) serum concentrations of total ghrelin ((a) condition effect: P = 0·23; time × condition interaction effect: P = 0·15), total glucose-dependent insulinotropic peptide (GIP) ((c) condition effect: P = 0·02; time × condition interaction effect: P = 0·12), total glucagon-like peptide-1 (GLP-1) ((e) condition effect: P < 0·01; time × condition interaction effect: P < 0·01) and total peptide tyrosine–tyrosine (PYY) ((g) condition effect: P = 0·07; time × condition interaction effect: P < 0·01) in the 4-h postprandial period following an ad libitum and maximal eating occasion. Mean (95 % CI) and individual AUC for serum total ghrelin (b) and incremental AUC (iAUC) for total GIP (d), total GLP-1 (f) and total PYY (h) across the 4-h postprandial period following an ad libitum and maximal eating occasion. * P < 0·05. (a, c, e, g) ![]() , ad libitum;
, ad libitum; ![]() , maximal.
, maximal.

Anthropometry and whole-body responses
Systolic blood pressure increased in the postprandial period in both trials (time effect: P < 0·01; condition effect: P = 0·03; time ×condition interaction effect: P = 0·31; Table 2). Diastolic blood pressure did not differ at baseline or across the postprandial period between trials (time effect: P = 0·33; condition effect: P = 0·64; time × condition interaction effect: P = 0·24; Table 2). Heart rate increased from baseline in both trials (time effect: P < 0·01) but increased more in the maximal trial compared with ad libitum (condition effect: P = 0·02; time × condition interaction effect: P = 0·02; Table 2).
Blood pressure and heart rate responses to ad libitum or maximal eating
(Mean values and standard deviations)
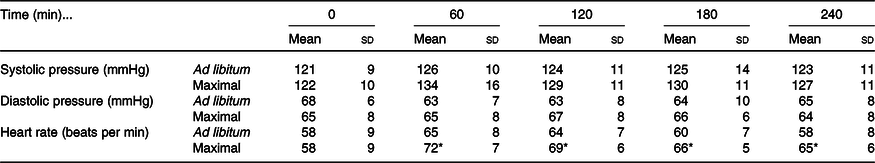
* P <0·05 v. same time point in ad libitum.
Waist circumference increased in both trials following ingestion of the meal (time effect: P < 0·01; condition effect: P = 0·01; time × condition interaction effect: P = 0·22; Table 3). Hip circumference demonstrated a trivial increase in both trials (time effect: P < 0·01), with no differences detected between trials (condition effect: P = 0·48; time × condition interaction: P = 0·64; Table 3). Sagittal abdominal diameter increased more in the maximal trial immediately post-eating and 240 min following ingestion of the test meal (time effect: P < 0·01; condition effect: P < 0·01; time × condition interaction effect: P < 0·01; Table 3). Tympanic temperature increased marginally during the postprandial period in both trials (time effect: P < 0·01; condition effect: P = 0·46; time × condition interaction effect: P = 0·14; Table 3). Hand grip strength decreased marginally in both trials (time effect: P < 0·01; condition effect: P = 0·25; time × condition interaction effect: P = 0·74; Table 3).
Anthropometric and whole-body responses to the test meals following ad libitum and maximal eating
(Mean values and standard deviations)
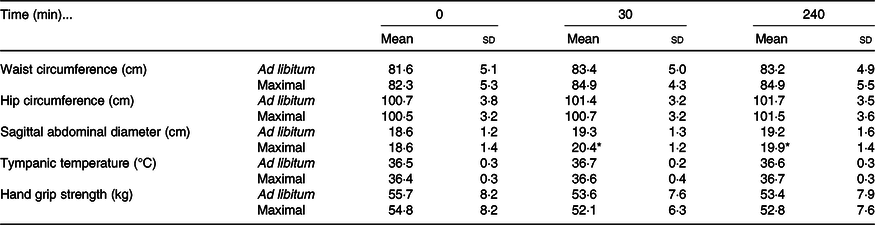
* P < 0·05 v. same time point in ad libitum.
Appetite and mood ratings
Hunger decreased in both trials and remained significantly lower by 240 min postprandial in the maximal trial v. ad libitum (Fig. 4(a)). Fullness increased to a greater extent in the maximal trial v. ad libitum and subsequently declined at the same rate to 240 min (Fig. 4(b)). Desire for savoury food decreased to very low levels in both trials but was significantly lower at 240 min in the maximal trial v. ad libitum (Fig. 4(c)). Desire for sweet food decreased only for the maximal trial, remaining significantly lower than for the ad libitum trial at 240 min (Fig. 4(d)).
Mean (95 % CI) scores for ratings of hunger ((a) condition effect: P < 0·01; time × condition interaction effect: P < 0·01), fullness ((b) time effect: P < 0·01; condition effect: P < 0·01; time × condition interaction effect: P = 0·02), desire for savoury food ((c) time effect: P < 0·01; condition effect: P < 0·01; time × condition interaction effect: P < 0·01), desire for sweet food ((d) time effect: P < 0·01; condition effect: P < 0·01; time × condition interaction effect: P < 0·01), physical tiredness ((e) condition effect P < 0·01; time × condition interaction effect: P = 0·39), sleepiness ((f) time effect: P = 0·02; condition effect: P < 0·01; time × condition interaction effect: P = 0·07), energy ((g) time effect: P < 0·01; condition effect: P < 0·01; time × condition interaction effect: P < 0·01) and lethargy ((h) time effect: P < 0·01; trial effect: P < 0·01; time × trial interaction effect: P < 0·01) using visual analogue scales during an ad libitum and maximal eating occasion. * P < 0·05. (a, c, e, g) ![]() , ad libitum;
, ad libitum; ![]() , maximal.
, maximal.
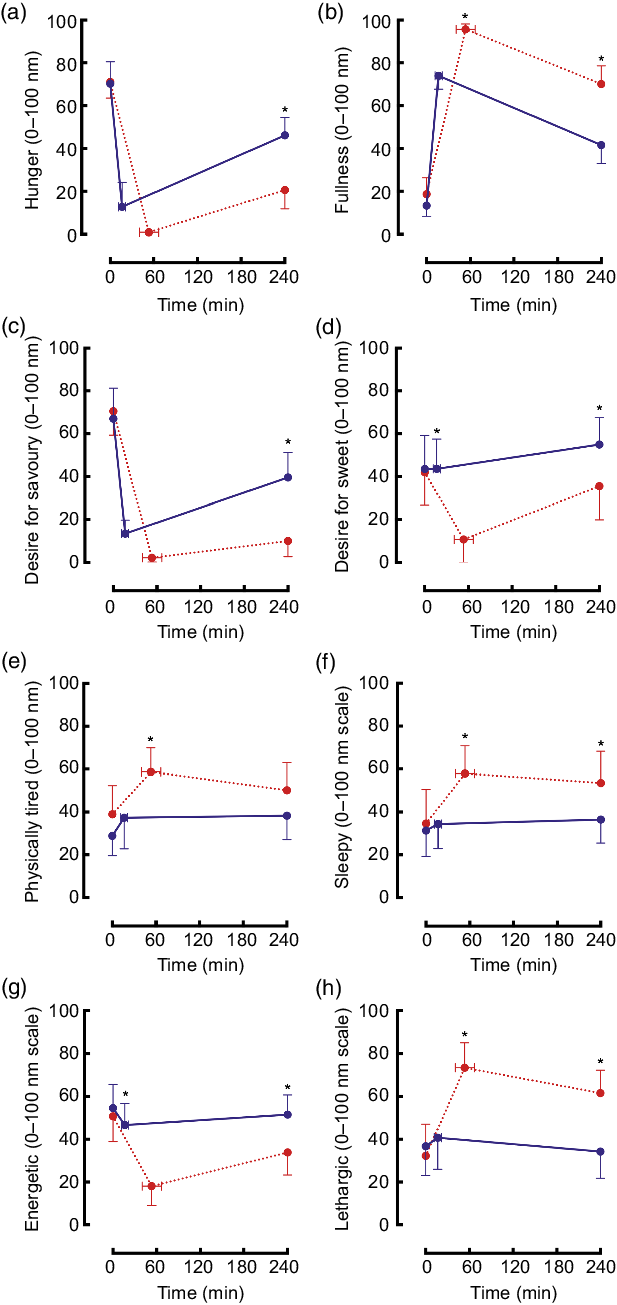
Physical tiredness increased and was higher throughout the maximal trial v. ad libitum (Fig. 4(e)). Sleepiness did not change in the ad libitum trial, however, remained elevated throughout the postprandial period in the maximal trial (Fig. 4(f)). Energetic feelings decreased markedly throughout the postprandial period in the maximal trial (Fig. 4(g)). Ratings of lethargy increased significantly and substantially in the maximal trial (v. ad libitum) and remained elevated (Fig. 4(h)).
Relative changes
The relative (percentage) changes between the maximal trial and the ad libitum trial are presented in Fig. 5. Whilst mean energy intake was 102 (sd 57) % greater in the maximal trial, most other outcomes remained similar between trials. GLP-1 iAUC (mean 97 (sd 79) %) and insulin iAUC (mean 57 (sd 53) %) displayed the most variability of other outcomes between trials.
Mean and individual change (%) between a maximal and an ad libitum eating occasion. GLP-1, glucagon-like peptide-1; iAUC, incremental AUC; PYY, peptide tyrosine–tyrosine; VAS, visual analogue scale; GIP, glucose-dependent insulinotropic peptide; HR, heart rate; PP, postprandial.

Discussion
The present study is the first to assess the metabolic and appetite responses to maximal eating. Mean energy intake doubled when participants were asked to eat a maximal amount compared with ad libitum eating, and all participants consumed more energy (between 29 and 227 % more energy content) in the maximal trial compared with ad libitum. Notwithstanding this doubling of energy intake, many of the physiological responses remained well controlled within the postprandial period.
We observed that glycaemic control is well maintained following an initial overeating occasion. In the present study, serum glucose concentrations were tightly regulated in both trials, such that eating twice as much energy, and approximately 180 g more carbohydrate, did not alter the 4-h postprandial glucose response in proportion to the increased carbohydrate load. These responses do not suggest the maximal feeding impaired glycaemic control. These responses may be due to greater rates of insulin-stimulated glucose uptake into peripheral tissues including skeletal muscle(Reference Zierath, He and Guma13) and adipose tissue(Reference Marin, Rebuffe-Scrive and Smith14) in the maximal trial v. ad libitum. This potential mechanism is consistent with the elevated postprandial insulin concentrations measured throughout the maximal trial v. ad libitum. Increasing insulinaemia across the ranges observed in the present study dose-dependently increases peripheral glucose disposal rates(Reference Groop, Bonadonna and DelPrato15). It is therefore likely that glucose clearance rates were increased to maintain similar circulating concentrations between trials. This is consistent with other work using stable isotope tracers following 5 d of habitual macronutrient overfeeding in healthy men(Reference Morrison, Kowalski and Bruce16). It is also important to consider the role of gastric emptying, which is delayed by increasing the energy content of a meal per se (Reference Hunt and Stubbs17), whereas (over)consumption of specific macronutrients within a meal alters gastric emptying rates compared with consuming carbohydrates alone. Ingestion of 25, 50, 75 and 100 g of carbohydrate from bread results in an proportional increase in postprandial glycaemia(Reference Wolever and Bolognesi18), and however, when fat is added to a carbohydrate-rich meal, gastric emptying can be delayed and postprandial glycaemia can be attenuated(Reference Cunningham and Read19). Furthermore, gut hormones (GLP-1, ghrelin and PYY) may have played an important role in the postulated delay of gastric emptying with maximal eating(Reference Delgado-Aros, Kim and Burton20–Reference Pironi, Stanghellini and Miglioli22). We cannot dismiss the possibility of a type 2 error whereby we were underpowered to detect a change in glucose response to maximal eating; however, based on our results, any effect is likely to be small. Postprandial glycaemia is well maintained following an initial overeating occasion, with elevated insulinaemia and delayed gastric emptying likely contributing to this control.
Postprandial lipaemic responses were increased following a maximal eating occasion. Ingestion of excessive energy in the maximal trial led to an increased postprandial triacylglycerolaemia and a tendency for elevated NEFA concentrations. A trend towards higher NEFA concentrations following maximal eating in the present study may indicate spillover of dietary fatty acids into the circulating NEFA pool(Reference McQuaid, Hodson and Neville23). When fat is ingested alone, postprandial TAG responses across a 4 h period increase in direct proportion to the increase in fat ingested(Reference Dubois, Beaumier and Juhel24), but when carbohydrate(Reference Cohen and Berger25,Reference Westphal, Leodolter and Kahl26) or protein(Reference Westphal, Kastner and Taneva27) is added to oral fat ingestion, postprandial triacylglycerolaemia is attenuated. This potentially explains the relatively modest increase in postprandial TAG in the present study, which was approximately 1·5-fold, despite a 2-fold increase in fat intake. However, it should be acknowledged that we observed a relatively short postprandial period for investigating TAG responses; significant trial differences were only observed between 2 and 4 h postprandial. A duration of 6–8 h may have been more appropriate for assessment of postprandial lipid metabolism(Reference Lairon, Lopez-Miranda and Williams28). However, the duration we measured was the same as previous data showing a doubling of lipaemia with fat ingestion alone(Reference Dubois, Beaumier and Juhel24), so it is unlikely there would be a doubling of lipaemia from the present study meal if we had measured for 8 h. Elevated postprandial insulinaemia likely contributes to regulating postprandial TAG concentrations by suppressing hepatic VLDL secretion and reducing availability of NEFA to the liver(Reference Malmstrom, Packard and Watson29). Insulin also stimulates adipose tissue lipoprotein lipase activity and therefore increases uptake of fatty acids into adipose tissue(Reference Sadur and Eckel30). Consumption of a maximal amount of food increases postprandial lipaemia in the initial 4-h postprandial period, but to a lesser extent than expected based on the fat content of the meal alone.
A maximal eating occasion produced variable gut hormone responses in the present study. Both GIP and GLP-1 potentiate glucose-stimulated insulin secretion(Reference Dupre, Ross and Watson31,Reference Kreymann, Williams and Ghatei32) , which may have contributed to the elevated postprandial insulinaemia we observed in the maximal trial. Ghrelin and GIP are primarily secreted proximally along the gastrointestinal tract in the stomach and duodenum(Reference Date, Kojima and Hosoda33,Reference Pais, Gribble and Reimann34) , whereas GLP-1 and PYY are secreted more distally along the gastrointestinal tract towards the ileum and colon(Reference Pais, Gribble and Reimann34,Reference Lundberg, Tatemoto and Terenius35) . Ghrelin and GIP were less impacted by eating beyond comfortable fullness in the maximal trial, compared with the larger increases observed in GLP-1 and PYY between the trials. This suggests that the more proximally secreted gut hormones may be saturated when consuming food until comfortable fullness, whereas the physiological limit of GLP-1 and PYY secretion is not reached until eating beyond comfortable fullness. The greater suppression of postprandial ghrelin in response to maximal eating observed in the present study is consistent with previous research showing that postprandial ghrelin AUC decreases with an increase in energy content of the meal, but with no differences between 8368 and 12 552 kJ meals(Reference le Roux, Patterson and Vincent36), which suggests ghrelin was suppressed to near maximal from ad libitum eating of a mixed-macronutrient meal. It should be noted that we measured total concentrations of each gut hormone. Measuring all isoforms of each gut hormone would provide greater understanding of responses to a maximal feeding stimulus.
The cessation of eating in the present study could have been due to energy sensing and/or gastric distension. Waist circumference and sagittal abdominal diameter increased to a greater extent in the maximal trial v. ad libitum. Food volume, energy density and macronutrient composition all influence postprandial fullness(Reference Marciani, Cox and Pritchard37,Reference Rolls, Castellanos and Halford38) , and so in the present study, we can only infer that individuals reached the maximal energy intake they could achieve from food with an energy density of 11·88 kJ/g. We purposely chose a palatable and energy-dense food for the present study, exploring maximal capacity to feed with foods of different energy densities could be worthwhile for investigating the contribution of both volume and energy sensing to feelings of fullness. Furthermore, measuring the habitual energy density of the diet for participants could be important – for example, individuals with a more energy sparse diet may achieve a higher volume of food intake on a regular basis to achieve energy balance, whereas energy-dense diets require a lower volume of food for a similar nutrient intake. This may result in an adaptive response that dictates the capacity to overeat in response to a test meal with a fixed energy density. It is also noteworthy that the postprandial period from cessation of the test meal was different between trials, and this may have influenced the magnitude of the differences we observed in response to the magnitude of difference in energy intake. The duration of the postprandial period could be matched in future studies with timers started at the onset and cessation of food intake.
More generally, the present results demonstrate that values typical for daily metabolic requirements can be met in a single meal of moderately energy-dense food. This relates to the capacity of healthy humans to eat in substantial excess of energy needs, with conscious restraint and/or other strategies being required to avoid this occurring regularly(Reference Rogers39,Reference Rogers and Brunstrom40) . There is an acute cost of overeating, including, as demonstrated in this study, increased feelings of sleepiness, lethargy and physical tiredness, and reduced feelings of energy. The notion of postprandial somnolence is well established, although the mechanisms are not well understood. Cerebral blood flow does not decrease following ad libitum (≥5020 kJ) ingestion of pizza(Reference Eicke, Seidel and Krummenauer41), which refutes the theory that postprandial blood flow is redistributed away from the brain and towards the mesentery following normal feeding occasions – although it is possible that the volume ingested in the maximal trial in the present study could have influenced cerebral blood flow, which would require assessment in future work. Consistent with a challenge to haemodynamic control, we observed a greater heart rate response to maximal v. ad libitum eating. A vast array of peptides are secreted by the gastrointestinal tract in response to feeding(Reference Rehfeld42), and many of these are known to act as neuropeptides to influence appetite control(Reference Suzuki, Jayasena and Bloom43). It has also been hypothesised that postprandial release of gastrointestinal hormones and their action on the hypothalamus may characterise a controlled process of postprandial somnolence(Reference Bazar, Yun and Lee44), perhaps with the function encouraging the diner to rest, and thereby keep safe, while they digest. Our present data, however, do not show any correlations between the change in gut hormone concentrations and increased sleepiness (not displayed). Nonetheless, irrespective of mechanisms, it seems likely that postprandial somnolence, and its avoidance, plays a significant role in shaping meal patterns. Most obviously, for example, motivation to work and work efficiency will be higher if the meal just eaten, be it breakfast or lunch, is modest size rather than the maximum or near maximum than can be eaten(Reference Rogers and Brunstrom40,Reference Craig and Richardson45,Reference Smith, Ralph and McNeill46) . It is notable, therefore, that the amount that participants chose to eat in the ad libitum meal, to be ‘comfortably full’, had rather little impact on mood, including causing no increase in postprandial lethargy and sleepiness. To our knowledge, it is not known whether feelings of tiredness translate to reduced postprandial physical activity energy expenditure. If this was to be the case, individuals who overeat frequently could be caught in an undesirable cycle of increased energy intake and reduced physical activity energy expenditure, making it more difficult to achieve a negative energy balance and increasing the risk of developing obesity. This is an important avenue for future research.
Consistent with the phenomenon of sensory-specific satiety(Reference Rogers and Brunstrom40,Reference Rolls, Rolls and Rowe47) , desire for savoury foods was satiated in both trials immediately following ingestion of the (savoury) test meal, but only recovered substantially by the end of the postprandial period in the ad libitum trial – by which time, the next usual eating occasion may often occur based on a pattern of three main meals and snacks across the day(Reference Mattson, Allison and Fontana48). Desire for sweet foods was not satiated at all in the ad libitum trial, confirming that the decline in the reward value was specific to savoury food and supporting the theory that, even in the immediate postprandial period, humans are almost always ready to eat, even when apparently satiated(Reference Rogers39,Reference Rogers and Brunstrom40) . However, following eating in the maximal trial, the desire for sweet food was satiated despite the meal consumed being primarily savoury, demonstrating, as might be expected(Reference Rogers and Hardman49), the complete inhibition of desire to eat by extreme fullness.
The present study intended to recruit both males and females. Unfortunately, no females enrolled on the present study, but future research should aim to repeat the study in females to identify any potential sex differences that may occur or provide a more complete evidence base regarding these findings. Furthermore, we obtained venous samples. Whilst the use of venous blood is appropriate in a crossover design as any differences are within-subject, our research has previously shown that arterialising venous samples by heating a dorsal hand vein can influence the measurement of postprandial glucose and GLP-1 concentrations(Reference Chen, Edinburgh and Hengist50,Reference Edinburgh, Hengist and Smith51) . Future studies should characterise the postprandial responses to nutrients using arterialised blood. The differences we observed between conditions for blood measures may be dependent on the length of the postprandial period – a longer postprandial period where concentrations of various outcomes return to baseline would provide more information about the differences between conditions. In the present study, meals were ordered from a fast food restaurant; therefore, we cannot guarantee that the macronutrient composition was identical across trials. We studied a cohort of men of a healthy weight; in future, it would be interesting to characterise the capacity to overeat in people with obesity and the subsequent metabolic effects to an initial overeating occasion in this population. Furthermore, it would be fascinating to measure the capacity and metabolic effects of individuals who are able to achieve extreme energy intakes in one sitting.
In summary, our study shows that healthy men have the capacity to eat twice as much energy as required to achieve comfortable fullness at a single meal. Postprandial glycaemia is well regulated in response to this initial overeating occasion, with elevated postprandial insulinaemia likely contributing to the maintenance of glucose control. Postprandial serum TAG concentrations are elevated following an initial overfeed, but not in direct proportion to the fat content of the meal. Gut hormones continue to be secreted/suppressed when individuals eat beyond comfortably full, but the magnitude of the change is not consistent between hormones and this may be dictated by their site of secretion along the gastrointestinal tract. Following an initial maximal feed, participants reported no desire for sweet foods despite not eating any sweet foods. Feelings of lethargy and sleepiness are elevated following maximal eating in healthy men. These results demonstrate the physiological capacity of healthy humans to deal with a considerable energy surplus in the form of a maximal eating occasion.
Acknowledgements
The authors thank Dr Oliver Perkin and Dr Yung-Chih Chen for their support with cannulation for some trials. The authors thank all study participants for their commitment to the study.
This research project did not receive any direct funding. A. H. and R. M. E. are funded by the University of Bath and The Rank Prize Funds. R. G. D. is funded by the University of Bath Tarr Studentship. J. B. is funded by the Thailand Research Fund through the Royal Golden Jubilee PhD programme. L. J. J. has received funding for research from and/or acted as a consultant for Decathlon SA, the Collagen Research Institute, PepsiCo, Inc., Volac International Ltd, British Summer Fruits, Lucozade Ribena Suntory and Progressive Sports Technologies. L. J. J. has also received funding to attend conferences from GSSI and Danone Nutricia. In all cases, no personal payments were received by L. J. J. P. J. R. has received financial support for research from Sugar Nutrition UK, provided consultancy services for Coca-Cola Great Britain and received speaker’s fees from the International Sweeteners Association, the Global Stevia Research Institute, ILSI-Brasil, ILSI-Europe and ILSI-India. Part of his research is supported by the NIHR Biomedical Research Centre at University Hospitals Bristol NHS Foundation Trust and the University of Bristol. The views expressed in this publication are those of the author and not necessarily those of the NHS, NIHR or the Department of Health and Social Care. J. T. G. has received financial support from, has received research funding, and/or has acted as a consultant for Arla Foods Ingredients, Lucozade Ribena Suntory, Kenniscentrum Suiker and Voeding, and PepsiCo. J. A. B. has received financial support from, has received research funding and/or has acted as a consultant for GlaxoSmithKline, Lucozade Ribena Suntory, Kellogg’s, Nestlé and Pepsi Co.
A. H., L. J. J., J. T. G. and J. A. B. formulated the research question. A. H., L. J. J., P. J. R., J. T. G. and J. A. B. designed the study. A. H., R. M. E., R. G. D. and J.-P. W. collected the data. A. H., R. M. E. and J. B. analysed the data. A. H., R. M. E., R. G. D., J.-P. W., J. B., L. J. J., P. J. R., J. T. G. and J. A. B. contributed to writing the manuscript and approved the final version of the manuscript.
The authors declare no conflicts of interest related to this project.


