


INTRODUCTION
Due to global warming, the rate of glacier recession has increased since the beginning of the 20th century and is expected to increase further in the future (Weller and others, Reference Weller, Symon, Arris and Hill2005). The retreat of glaciers results in the exposure of large expanses of deglaciated ground that transforms rapidly due to physical and chemical weathering as well as microbial and finally plant colonization (Frey and others, Reference Frey2010; Zumsteg and others, Reference Zumsteg2012). Proglacial environments of receding glaciers have received increasing recognition in recent years as they provide a unique field setting to study the geochemical and microbial development of young terrestrial soil ecosystems. Both the initiation of rock weathering and the activity of pioneer microorganisms play important roles in the initial growth and maintenance of soil ecosystems. Initial microbial colonizers fix C and N into bioavailable forms, which in turn promote the development of more complex and efficient microbial communities as well as later plant establishment (Donhauser and Frey, Reference Donhauser and Frey2018). Such shifts in microbial communities in recently deglaciated terrains have been extensively studied (e.g. Ohtonen and others, Reference Ohtonen, Fritze, Pennanen, Jumpponen and Trappe1999; Nemergut and others, Reference Nemergut2007; Bajerski and Wagner, Reference Bajerski and Wagner2013; Rime and others, Reference Rime2015).
The development of microbial communities in recently deglaciated terrain is primarily limited by low C and nutrient contents (Mindl and others, Reference Mindl2007; Göransson and others, Reference Göransson, Venterink and Bååth2011), as well as large temperature and moisture fluctuations (Bradley and others, Reference Bradley, Singarayer and Anesio2014; Mateos-Rivera and others, Reference Mateos-Rivera2016). Weathering is considered to be one of the dominant processes controlling C and nutrient availability as it exerts a strong control on the development of microbial communities and their ability to generate and recycle organic matter (Bradley and others, Reference Bradley, Singarayer and Anesio2014). Changes in C and nutrient contents, weathering advancement and microbial community structures are thought to have strong feedbacks with each other. Previous interdisciplinary studies have integrated both comprehensive geochemical data and microbial data (e.g. Bernasconi and others, Reference Bernasconi2011; Bradley and others, Reference Bradley2016), yet, the correlation between geochemical and microbiological variables remains poorly quantified. Thus, our understanding of the functional linkages between soil weathering, C and nutrients and microbial community structures in recently deglaciated terrain remains limited.
Little is known about the variability of ecosystem development different on the dominant landforms of proglacial terrains. Among these, the differences between ecosystems developing on moraines or in glaciofluvial outwash area remain little understood.
To address these gaps, we compared a proglacial moraine and glaciofluvial outwash in a High Arctic terrain and examined and quantified the relationships between weathering advancement, C and nutrient contents and the development of microbial community structures.
MATERIAL AND METHODS
Study area and sampling method
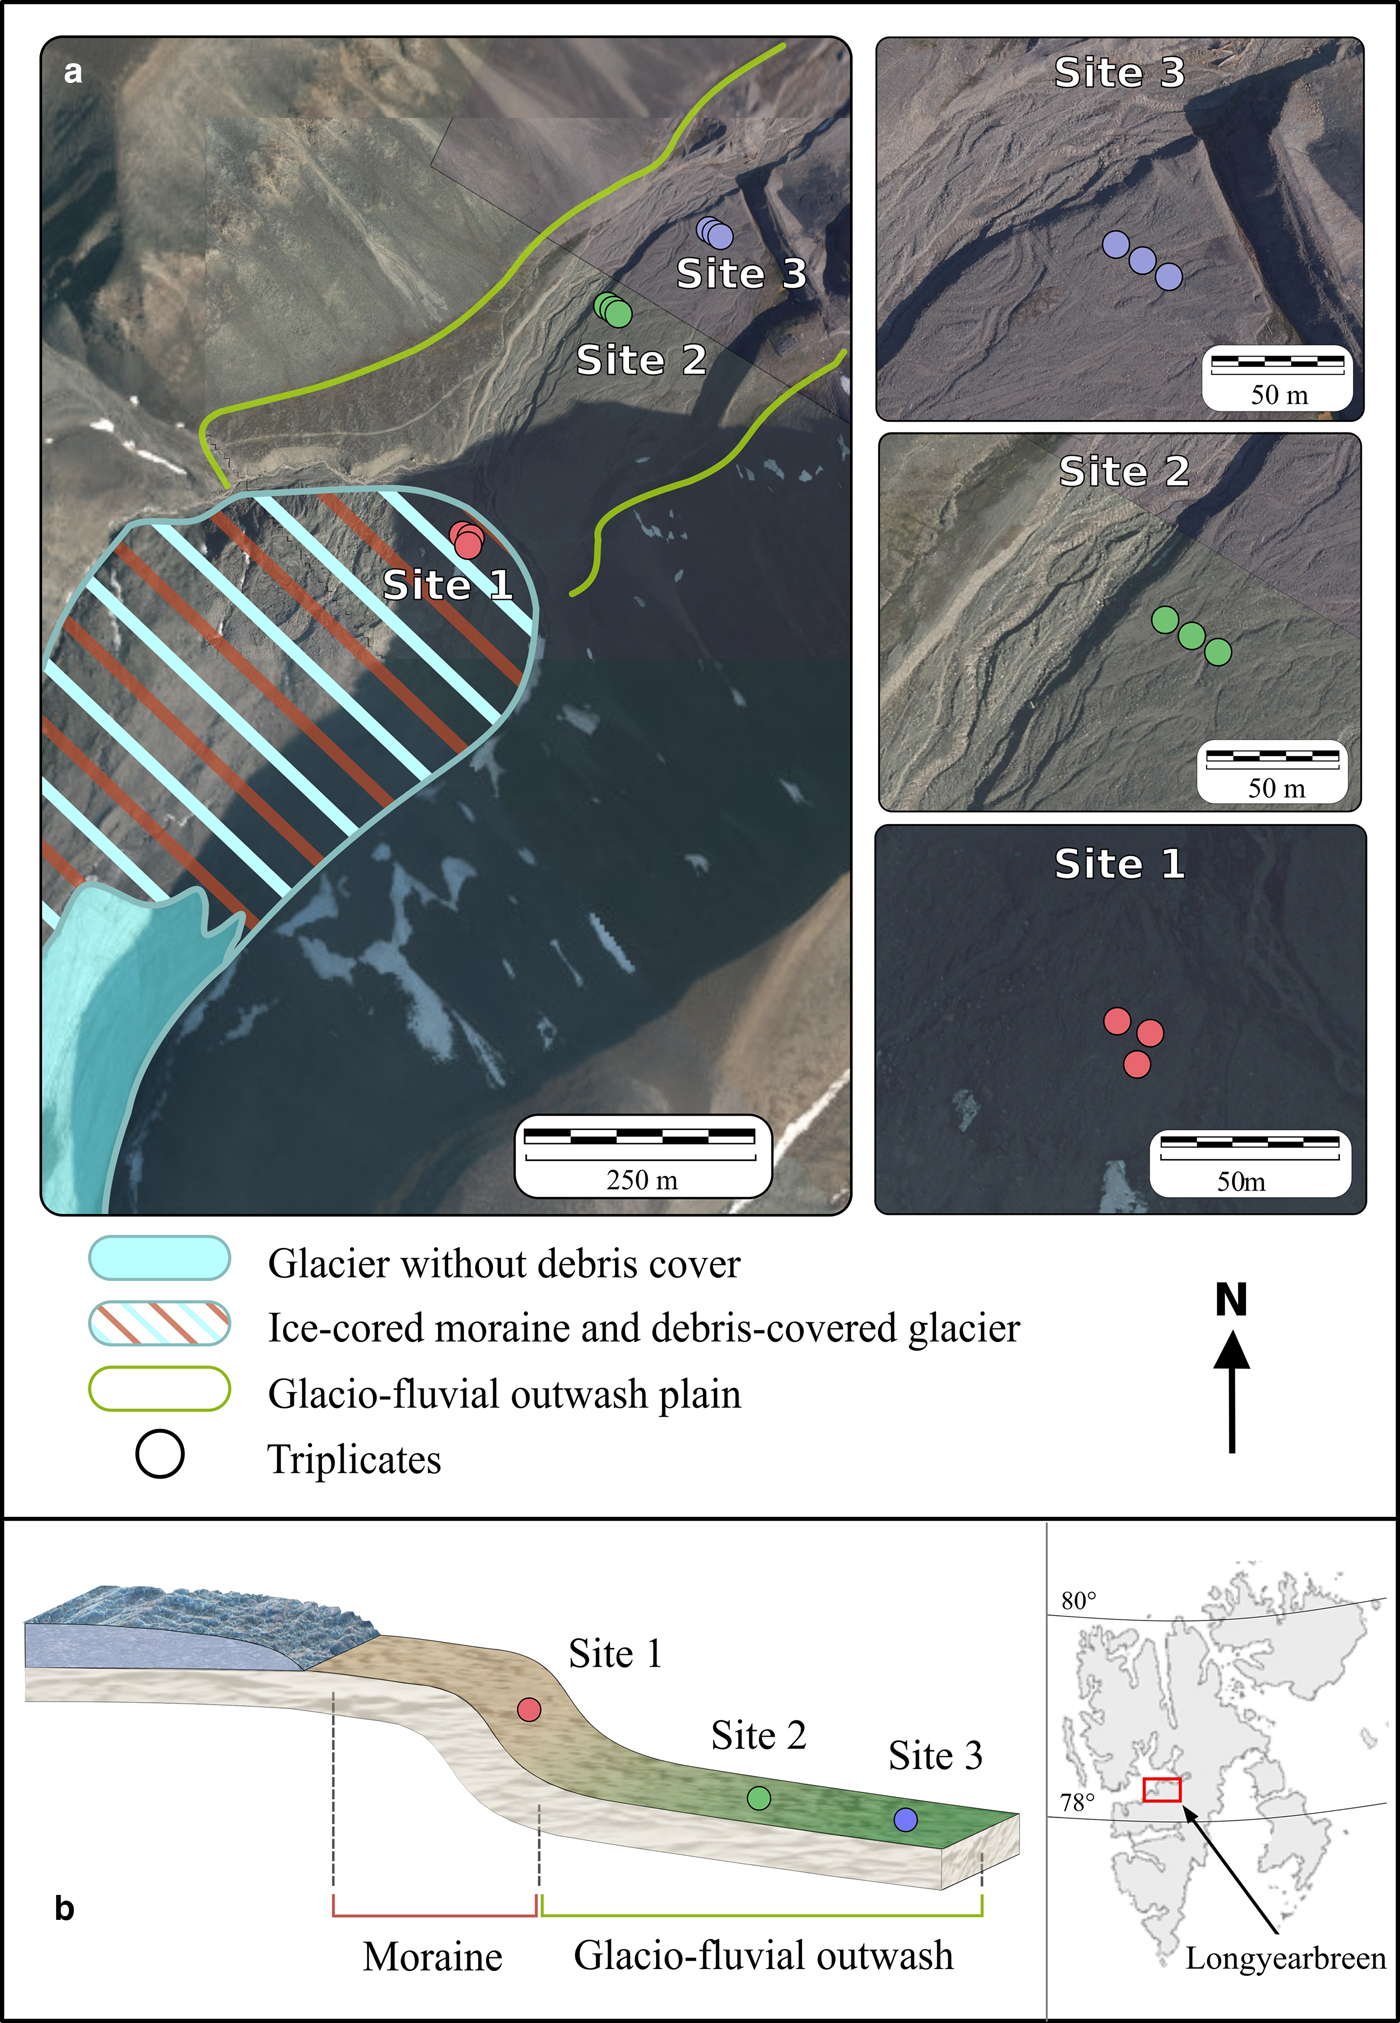
Soil samples were collected in November 2016 in the proglacial area of Longyearbreen (Spitsbergen, Svalbard (78.19°N, 15.54°E)) (Fig. 1). Longyearbreen is a glacier that is flowing within a catchment with a lithology made up of late Tertiary shales, siltstones, and sandstones and coal seams (Major and others, Reference Major and Nagy1972).
Aerial images, geomorphological setting (a), topographical schematic and location (b) of the proglacial area of Longyearbreen, Svalbard.
The average annual temperature at Longyearbyen airport (5 km away, 28 a.p.s.l) is −5.6 °C, ranging between −12.7 °C for February (coldest month), 6.7 °C for July (warmest month) and −7.5 °C for November (sampling period) (Norwegian Meteorological Institute, 2017). The mean annual temperature in 2016 was −0.1 °C and the mean temperature in November 2016 was −1 °C at Longyearbreen's airport meteorological station (timeanddate.com., 2018). The annual precipitation is typically 213 mm (water equivalent) (Climate-Data.org., 2017).
Longyearbreen is a 4.5 km long, 0.5 km wide glacier that flows into a near V-shaped subglacial valley (Etzelmüller and others, Reference Etzelmüller2000), enclosed within sediment-mantled slopes characterized by steep incision gullies and slope-foot debris cones. Longyearbreen is a cold-based glacier presumably frozen to the bed in most parts, at least in its outer margins, with temperatures at the glacier bed of ~−4 °C in (March–May 2001, 2002, 2003; Humlum and others, 2005). As a result, basal ice sliding is expected to be limited or even absent, while surface ice flow velocities are <1 ma−1 in the lower most part of its ablation area (Etzelmüller and others, Reference Etzelmüller2000). The ice mass flux is dominated by internal deformation and has little erosion potential. Longyearbreen's ice front is debris covered and no evidence of surging for Longyearbreen exists (Humlum and others, 2005). Overall, the total glaciated area of Svalbard has decreased by 13.1% since the end of the LIA (Martín-Moreno and others, Reference Martín-Moreno, Allende Álvarez and Hagen2017). However, Longyearbreen has not or only minimally retreated since the end of the LIA, yet it has thinned by 20–30 m (Humlum and others, 2005) and has thus no LIA moraine. Based on mass-balance measurements, Etzelmüller and others (Reference Etzelmüller2000) estimated an annual mass loss of −0.5 m (water equivalent) for Longyearbreen during the period 1977–1992 (Hagen and Liestøl, Reference Hagen and Liestøl1990).
The geomorphology of the proglacial area of Longyearbreen is dominated by two major landforms: an ice-cored moraine and a glaciofluvial outwash (Fig. 1). The moraine consists of unsorted angular glacigenic deposits containing a random mixture of boulder to gravel-sized rocks within a fine soil matrix that is ice cored in many places (Etzelmüller and others, Reference Etzelmüller2000). Etzelmüller and others (Reference Etzelmüller2000) pointed out that lower part of Longyearbreen is a mix of ice-cored moraines and debris-covered glacier and further specifically indicated that an ice-cored moraine terminates Longyearbreen's marginal area. The glaciofluvial outwash is a gently sloping depositional landform that consists of secondary glacigenic or slope deposits that are frequently reworked by fluvial processes. However, estimates of the formation ages for both the moraine and the outwash are lacking.
We collected a set of nine soil samples at three locations: site 1 was located on the ice-cored moraine (from here onwards called moraine for simplicity) and two sites on the glaciofluvial outwash plain (sites 2 and 3, from here onwards called outwash) (Fig. 1). At all sites, the ground was covered with between 5 and 10 cm of fresh snow. At each location, triplicate samples were collected in a ~15 m radius area to assess local soil heterogeneities. The three soil samples at site 1 (Fig. 1 and Table 1) were collected on the steep (30°) toe-slope of the moraine, 500 m away from the glacier terminus. In contrast, the six soil samples at sites 2 and 3 were collected in the flat-lying area on the glaciofluvial outwash on the same terrace. The distance between site 1 and site 2 was 300 m and the distance between site 2 and site 3 was 150 m. Note that reaching the glacier snout was not possible for security reasons due to unstable ice-cored moraines and dark winter conditions.
Location details, sites description and basic physical and chemical parameters measurements of samples at each site

* pH and conductivity were measured in an aliquot of the separated waters.
GPS-coordinates, air and ground temperature, as well as land cover and geomorphological setting were documented in detail (Table 1). Subsequently, soil samples were collected to a maximum depth of ~15 cm into sterile whirl-pack sample bags using a shovel, chisel and hammer. Prior to each sampling, the sampling equipment was sterilized using ethanol wipes and then was also conditioned in the surrounding soil. Finally, at each site a host rock (free lying ~20 cm diameter rock) was also collected. After sampling, all samples were maintained frozen at −20 °C until processed.
Geochemical analyses on liquids
Prior to analyses, samples were thawed and the excess water was separated from the solids through settling and decanting.
The pH and conductivity were measured in aliquots of the separated waters using an Orion Star™ pH and conductivity meter, after calibration with NIST standards. The majority of the remaining separated waters were filtered through 0.2 µm polycarbonate filters and particulates on the filters were retained for geochemical analyses of the solids. Aliquots of the separated soil water were filtered through single-use 0.22 µm syringe filters directly into acid-washed 30 ml HDPE Nalgene bottles and into 1.5 ml Dionex vials for nutrients and major ion analyses, respectively. Inorganic nutrient concentrations (PO43−, NH4+, NO3−, NO2−) were analyzed using a Gallery Plus Automated Photometric Analyzer (Thermo Fischer Scientific™, Hemel Hempstead, UK), while major ion concentrations (Cl−, NO3−, SO42−, PO43−, Na+, NH4+, Mg+, Ca+, K+) were analyzed using an ICS-5000 Capillary System (Thermo Fischer Scientific™).
Geochemical analyses of solids
Upon thawing it became apparent that large proportions of the samples from sites 2 and 3 were vegetation (grasses, mosses). This vegetation was manually separated from the soil as well as possible; weighing before and after revealed that ~13 ± 10% and 5 ± 4% of the sample wet weight in sites 2 and 3, respectively, was vegetation and not soil. This separated vegetation as well as all soil samples were dried at 105 °C for a week. Soils were subsequently size fractionated by sieving into <2, 2–8, 8–15, 15–50 and >50 mm size fractions in order to study the progression of weathering. Note that none of the soil material collected was larger than 100 mm diameter. All soil size fractions, as well as the three-collected host rocks were crushed (<63 µm powder) using a ball mill. Care was taken to avoid particularly carbon cross-contamination between the crushing of samples, and therefore, in-between each sample, the ball mill was cleaned by milling ashed sand for 10 min. Vegetation samples from sites 2 and 3 were also crushed in a separated batch for elemental analyses.
In all separated fractions (including filtered particulates and vegetation samples), total carbon (TC), total organic carbon (TOC), total nitrogen (TN) as well as organic carbon (δ 13Corg) and nitrogen (δ 15N) isotopes were determined using an elemental analyzer (NC2500 Carlo Erba) coupled with an ConFlowIII interface on a DELTAplusXL mass spectrometer (ThermoFischer Scientific). The TOC contents and δ 13Corg values were determined on in situ decalcified samples. Replicate determinations show a standard deviation <0.2% for TC, TOC and TN and 0.2‰ for δ 13Corg and δ 15N. The analytical precision was 0.1% for TC, TOC and TN and was 0.2‰ for δ 13Corg and δ 15N.
The elemental composition of the milled soil fractions was determined through X-ray fluorescence (XRF) analyses of fused glass beads using a PANalytical AXIOS Advanced XRF machine equipped with a rhodium tube. For major elements, we achieved a detection limit of 0,01% and ≤10 ppm for minor elements. Further details of the geochemical analyses on solids are found in Supplementary Information (Tables S3 and S4).
Using the XRF data, we calculated the Chemical Index of Alteration (CIA) to obtain an indicator of weathering progress. Overall, a CIA value of ≤50 indicates fresh, un-weathered rocks, whereas CIA values >50 indicate an increased degree of alteration. The CIA index is primarily applicable for metasediments (thus applicable for the type of rock types in our catchment) and has been widely employed (see review of Bahlburg and Dobrzinski, Reference Bahlburg and Dobrzinski2011) since it was first introduced in Nesbitt and Young (Reference Nesbitt and Young1982). Compared with other chemical weathering indices (Meunier and others, 2013), the CIA takes also into account the contributions of potassium and its association with calcium and sodium (Price and Velbel, Reference Price and Velbel2003). The CIA index values were calculated from the molecular proportions of oxides as the ratio of aluminum to the sum of major cations as follows (Eqn 1):
 $${\rm CIA} = 100 \times \displaystyle{{{\rm A}{\rm l}_{\rm 2}{\rm O}_3} \over {{\rm A}{\rm l}_{\rm 2}{\rm O}_{\rm 3}{\rm}+{\rm CaO}+{\rm N}{\rm a}_{\rm 2}{\rm O}+{\rm } {\rm K}_{\rm 2}{\rm O}}}.$$
Further details on all geochemical analyses of solids are given in Supplementary Information.
DNA extraction, PCR amplification and Illumina MiSeq sequencing
Total genomic DNA was extracted from ~20 g soil per sample using the Power Soil DNA Isolation Maxikit (Qiagen, Hilden, Germany) according to the manufacturer's instructions with some modifications: just prior to loading the extracts on columns, we switched to using the Power Soil DNA Isolation Minikit (Qiagen) in all subsequent steps according to the Minikit protocol in order to obtain a concentrated DNA eluate. DNA was quantified with PicoGreen (Invitrogen, Carlsbad, CA, USA). The V3–V4 region of the bacterial small-subunit (16S) rRNA and the internal transcribed spacer region 2 (ITS2) of the eukaryotic (fungal and some groups of protists and green algae) ribosomal operon were PCR amplified using primers and conditions previously described in Frey and others (Reference Frey2016) with 5 ng of template DNA. PCRs were run in triplicate and pooled. Bacterial and fungal amplicon pools were sent to the Génome Québec Innovation Center at McGill University (Montréal, Canada) for barcoding using the Fluidigm Access Array technology (Fluidigm) and paired-end sequencing on the Illumina MiSeq v3 platform (Illumina Inc., San Diego, CA, USA). Archaeal 16S rRNA genes were amplified with a nested PCR approach. The first PCR reaction was performed using the primers 20F and 958R (Delong, Reference DeLong1992) with a total of 5 ng template DNA per reaction. The second PCR was performed with the primers Arch349F and Arch806-R (Takai and Horikoshi, Reference Takai and Horikoshi2000) with 3 µL of the first PCR amplicon as template for the second PCR reaction. The PCR products were purified using Agencourt Ampure Xp (Agencourt Bioscience, USA). The pooled amplicons were sent to GATC Biotech (Konstanz, Germany) and sequenced on a Genome Sequencer Illumina platform (Illumina Inc.). A detailed description of PCR conditions and sequencing of archaeal amplicons can be found in the Supplementary Information. Raw sequences have been deposited in the European Nucleotide Archive under the accession number PRJEB23649.
Sequence quality control, OTU clustering and taxonomic assignments
Quality filtering, clustering into operational taxonomic units and taxonomic assignment were performed as described previously (Frey and others, Reference Frey2016). A customized pipeline largely based on UPARSE (Edgar, Reference Edgar2013; Edgar and Flyvbjerg, Reference Edgar and Flyvbjerg2015) implemented in USEARCH v. 9.2 (Edgar, Reference Edgar2010), but with some additional modifications, was used. Briefly, paired-end reads were merged using the USEARCH fastq mergepairs algorithm (Edgar and Flyvbjerg, Reference Edgar and Flyvbjerg2015). Substitution errors arising due to phasing events during Illumina sequencing were corrected applying Bayes Hammer (Nikolenko and others, Reference Nikolenko, Korobeynikov and Alekseyev2013). PCR primers were removed using Cutadapt (Martin, Reference Martin2011) and reads were quality-filtered using the USEARCH fastq filter function. Subsequently, sequences were dereplicated discarding singletons and clustered into OTUs of 97% identity (Edgar, Reference Edgar2013). OTU centroid sequences were checked for the presence of ribosomal signatures with Metaxa2 (Bengtsson-Palme and others, Reference Bengtsson-Palme2015) or ITSx (Bengtsson-Palme and others, Reference Bengtsson-Palme2013). Quality-filtered reads were mapped on the filtered set of centroid sequences and taxonomic classification was conducted querying against customized versions of GREENGENES (DeSantis and others, Reference DeSantis2006), SILVA (Quast and others, Reference Quast2012) and UNITE (Nilsson and others, 2015) for bacteria, archaea and fungi, respectively.
Quantitative real-time PCR
In order to obtain an absolute quantification of bacterial and archaeal gene copy numbers, we performed a quantitative PCR using the CFX Connect™ Real-Time PCR Detection System (Bio-Rad Laboratories, Inc., Hercules, USA). Primers (100 µM) Eub341F and Eub534R (Muyzer and others, Reference Muyzer, De Waal and Uitterlinden1993) were used to amplify bacterial 16S rRNA genes applying KAPA HiFi SYBR Green reagent (KAPA Biosystems). qPCR reactions were run in triplicates. For amplification of the archaeal 16S rRNA, the primers Parch340-F and Arch1000-R were used (Gantner and others, Reference Gantner, Andersson, Alonso-Sáez and Bertilsson2011). Specificity of qPCR reactions was verified by melt curve analysis. Genomic standards (Escherichia coli culture for bacteria and Methanosarcina barkeri for archaea) were included in each qPCR run to ensure linearity and expected slope values of the Ct/log curves. PCR efficiency, based on the standard curve, was calculated using the BioRad CFX manager software and varied between 95 and 100%. Bacterial and archaeal 16S rRNA gene copy numbers were calculated per g of sediment (wet weight). A detailed description of qPCR can be found in the Supplementary Information.
Statistical analyses
Arithmetical mean properties and std dev. of geochemical properties of triplicate samples were calculated for each site and each size fraction. Pearson's linear correlation coefficients were used to examine whether CIA, TC, TOC, δ 13Corg, TN and δ 15N vary significantly with size fraction. All statistical analyses of the geochemical data were performed using OriginPro 8.5 or Microsoft EXCEL.
For analysis of microbial diversity, indices of α-diversity (local diversity; Whittaker, Reference Whittaker1960), observed richness (S obs) and Shannon diversity (H), were estimated based on OTU abundance matrices rarefied to the lowest sequence numbers. We assessed differences in α-diversity indices as well as bacterial and archaeal gene copy numbers between different sites by performing a one-way analysis of variance (ANOVA) in R v.2.15 (R development Core Team, 2012). Tukey's Honestly Significant Difference (Tukey HSD) post hoc tests were conducted to examine pairwise differences among habitats with the TukeyHSD function (R development Core Team, 2012). Bray–Curtis dissimilarities were calculated based on square-root transformed relative abundances of OTUs. Differences in community structures (β-diversity) were assessed by conducting a permutational ANOVA (PERMANOVA, number of permutations = 9999) with the function adonis and an analysis of similarity (ANOSIM, number of permutations = 9999) implemented in the vegan R package (Oksanen and others, Reference Oksanen2007). Principal coordinate analysis (PCoA) ordinations were calculated using the ordinate function implemented in the R package phyloseq (McMurdie and Holmes, Reference McMurdie and Holmes2013). PCoAs on geochemical variables were performed on z-transformed data. All graphs were generated in R with the ggplot2 package (Wickham, Reference Wickham2016) if not specified otherwise. The DistLM procedure (McArdle and Anderson, Reference McArdle and Anderson2001) was performed in Primer6+ (Clarke and Gorley, Reference Clarke and Gorley2006) to identify geochemical parameters that correlate best with microbial community structures using the adjusted R 2 selection criterion with the ‘stepwise’ procedure. Correlation of geochemical variables significantly explaining variance in the microbial data individually and the PCoA ordination scores were subsequently calculated with the envfit function implemented in the R package vegan (Oksanen and others, Reference Oksanen2007). Colinearity between geochemical variables was assessed based on a correlation matrix of pairwise Pearson correlations. This matrix was visualized as heatmap with a dendrogram calculated by hierarchical clustering using the function heatmap.2 implemented in the R package gplots (Team R, Reference Team2012; Warnes and others, Reference Warnes, Bolker, Bonebakker and Gentleman2016). We conducted an indicator species analysis to identify OTU–site associations using the multipatt function (number of permutations = 99 999) implemented in the indicspecies R package (De Cáceres and others, Reference De Cáceres, Legendre and Moretti2010). Singleton sequences were removed for the analysis. Indicator OTUs with P < 0.05 were considered significant. Indicator OTUs classified at the genus level were depicted in a taxonomic tree generated in iTOL (Letunic and Bork, Reference Letunic and Bork2011) together with the correlation values indicating OTU–site associations. To test the relationship between OTU–site associations and geochemical properties, we also calculated Spearman rank correlation values between the relative abundance of the indicator OTUs and geochemical variables which significantly explained variance in the microbial community structures as determined by the DistLM procedure. To this end, we used the corr.test function implemented in the psych R package (Revelle, Reference Revelle2014). Correlations were depicted as heatmap using the function heatmap.2 implemented in the R package gplots (Team R, Reference Team2012, Warnes and others, Reference Warnes, Bolker, Bonebakker and Gentleman2016) together with the taxonomic tree of indicator OTUs.
RESULTS AND DISCUSSION
Geochemical characteristics of liquids
The pH and conductivity were higher in site 1 (moraine) than in sites 2 and 3 (glaciofluvial outwash) with values of 8.8 and 380 µS.cm−1 in samples from site 1 and 7.4 and 86 µS.cm−1 in the samples from site 3 (Table 1). The changes in pH and conductivity observed in the present study are likely a consequence of root exudates (e.g. protons and organic acids) released from the vegetation present in samples from sites 2 and 3 and may also be affected by the snow covering the collected soil samples. Overall, no noteworthy variations were measured in aqueous geochemical parameters, except that Na and Cl− were higher in site 1 than in sites 2 and 3, while K, Mg and Ca and SO42− were lower in site 1 than in sites 2 and 3 (Table S2, Supplementary Information).
Geochemical and physical analyses of solids
Physical characteristics
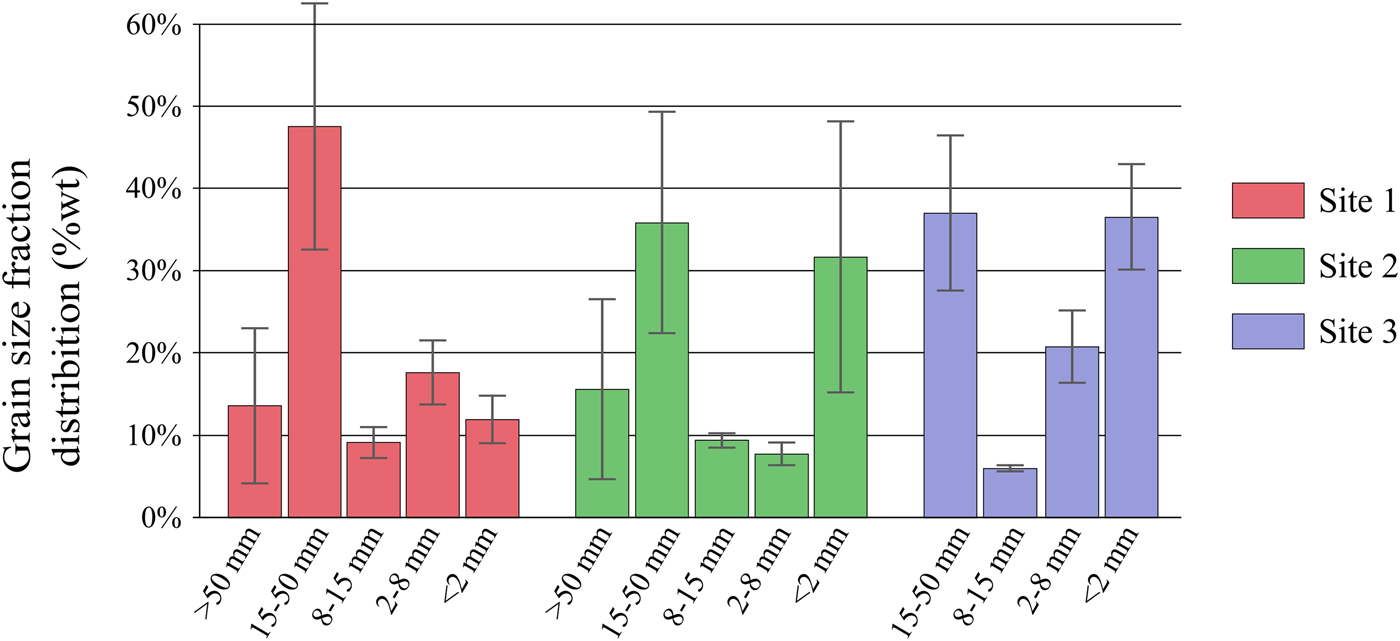
Grain size fractionation measurements clearly revealed smaller grain size in the glaciofluvial outwash than in the moraine (Fig. 2; Table 2). Overall, the <2 mm size fraction was more abundant in the glaciofluvial outwash (on average 34% for sites 2 and 3) than in the moraine (12% for site 1) whereas >2 mm showed the opposite trend (89% for site 1 and on average 66% for sites 2 and 3). This pattern can likely be explained as the result of physical weathering being more intense in the glaciofluvial outwash as it undergoes more frequent hydrological disturbances than the moraine.
Average grain size distribution per site (mean of triplicate per site). Vertical bars indicate the std dev. among triplicates.
Chemical index of alteration (CIA) and carbon and nitrogen data for the various soil size fractions. Values indicate averages and std dev. on triplicate samples

* The std dev. was not calculated if less than three samples were collected. n.a. no data available.
Weathering parameters
The CIA values for the finer fractions (<2 and 2–8 mm) suggest a slightly greater weathering advancement in the glaciofluvial outwash than in the moraine with CIA values being ~2% lower in site 1 than in sites 2 and 3. Furthermore, the CIA values of the <8 and >8 mm size fractions do not display any noticeable difference in site 1 but such differences were clearer in sites 2 and 3. When the data were plotted in a ternary diagram (Fig. 3; Table S3, Supplementary Information), the <2 and 2–8 mm size fractions showed a clear decreasing relative abundance in Ca and Mg and the relative increase in Na and K. The observed changes in the relative abundance of Ca, Mg, Na and K are typical characteristics indicating feldspar alteration (Price and Velbel, Reference Price and Velbel2003).
Ternary plot showing the differences in geochemical characteristics of sites 1–3 (for simplicity only the values of the <2 and 2–8 mm soil fractions are plotted; dataset for all other size fractions are available in Table S3, Supplementary Information).

The samples from the moraine (site 1) clustered together, and somewhat apart from the samples from the glaciofluvial outwash (sites 2 and 3). These different patterns are also supported by the aqueous analyses (Table S2, Supplementary Information). It should be noted that the comparison between solid and liquid geochemical data is less conclusive due to the variability of both ice content of the soils and snow cover at the sites during collection. In our study, the assertion that weathering is more advanced in the glaciofluvial outwash than in the moraine is not as straight forward and is in part contradicted by the gradual decrease in CIA for the larger size fractions (15–50 and >50 mm) with CIA values being ~4% lower in site 1 than in sites 2 and 3. Overall, CIA results therefore suggest heterogeneous patterns of weathering progression from the moraine to the glaciofluvial outwash (Table 2). Additionally, the high variability in CIA values between triplicate samples at each site indicates a large degree of compositional heterogeneity (Table 2). Although a weathering progression between soil size fractions is clear, it is possible that mineralogical changes that result from the advancement of weathering from the moraine to the glaciofluvial outwash might be masked by the inherent heterogeneities on the complex lithologies in the catchment area. Elucidating this variability was however outside of the scope of this study. The three host rocks collected as possible representative lithologies at each site (Table 2) had variable CIA values with the host rock sample from the moraine at site 1 being far more weathered (CIA value of 75) than those from the glaciofluvial outwash at sites 2 and 3 (CIA values of 56 and 65). This likely indicates that the single rocks collected randomly in the dark under snow cover cannot be considered representative of the lithology at the same sites.
Carbon and nitrogen
On average for all sites, our data revealed that TC (R 2 = 98%), TOC (R 2 = 79%) and TN (R 2 = 99%) were negatively correlated with size fractions (Fig. 4; Table 2), whereas δ 13Corg (R 2 = 92%) showed a positive correlation with size fraction (P < 0.05). Carbon and nitrogen analyses revealed clear differences between the moraine and the glaciofluvial outwash with TC, TOC and TN being two to threefold higher in sites 2 and 3 than in site 1 for the particulates, <2 and 2–8 mm fractions. For example, the TOC of the <2 mm fraction samples from site 1 (1.4 ± 0.4%) were almost three times lower than in samples from site 3 (4.0 ± 1.6%) and little to no variations in carbon or nitrogen values were evident between samples from sites 2 and 3 (Fig. 4 and Table 2). Similar TOC and TN values were reported in the moraine (1.6 and 0.02%, respectively) (Nakatsubo and others, Reference Nakatsubo2005) and glaciofluvial outwash (2.8 and 0.2%, respectively) (Wojcik and others, Reference Wojcik, Juri Palmtag, Hugelius, Weiss and Kuhry2019) of another glacier in Svalbard (Austre Brøggerbreen). Furthermore, the measured differences in TOC and TN values between the moraine samples and the glaciofluvial outwash samples in this current study are consistent with estimates reported from various other recently deglaciated areas, e.g. Puca glacier, Peru (Nemergut and others, Reference Nemergut2007), the Damma glacier, Switzerland (Bernasconi and others, Reference Bernasconi2011), Dongkemadi glacier, China (Liu and others, Reference Liu2012), Larsemann Hills glaciers, Antarctica (Bajerski and Wagner, Reference Bajerski and Wagner2013) or Robson glacier, Canada (Hahn and Quideau, Reference Hahn and Quideau2013). Neither δ 13Corg nor δ 15N values varied significantly between sites. Not surprisingly, the vegetation separated from the soils in the samples from sites 2 and 3 had substantially higher TOC and TN values and the δ 13Corg and δ 15N values clearly indicated higher plant signatures (−27.4 and −0.1). The slight decrease in δ 13Corg with decreasing grain size likely only indicates a shift from C derived from microbes to C derived more from plant organic material. It should be noted that several coal seams from the Lower Tertiary sequence are present in the Longyear catchment (Yde and others, 2008). Besides affecting acidity, the presence of coal and dispersed organic matter in sedimentary and metasedimentary rocks and soils may result in the supply of nitrogen to the biota via the degradation of nitrogen-bearing minerals (Holloway & Dahlgren, 2002; Yde and others, 2008).
Variation in TOC contents in the different size fractions at the three sites with error bars representing the std dev. of replicates. Different colors indicate different sites. Similar trends were observed for TC and TN (see Table 2).

Overall, the shift in C and N isotopic ratios, the increase in C and N contents as well as the observed progression of chemical and physical weathering indicate a higher degree of soil ecosystem development in the glaciofluvial outwash (sites 2 and 3) than in the moraine (site 1).
Microbial community structures
Microbial community compositions
We retrieved 116 013 (12 890 ± 2238 per sample) bacterial 16S rRNA gene, 322 649 (35 850 ±59 571) archaeal 16S rRNA gene and 413 374 (45 930 ±11 782 per sample) fungal ITS2 high-quality sequences, which were clustered into 1638 (850 ± 58 per sample) bacterial, 24 (3 ± 2.6 per sample) archaeal and 1157 (390 ± 123 per sample) fungal OTUs, respectively. Bacterial communities were dominated by Proteobacteria (31.4% of all sequences), followed by Bacteroidetes (27.1%), Verrucomicrobia (11.7%), Acidobacteria (7.7%) while 0.4% of the sequences remained unclassified at the phylum level. Thaumarchaeota constituted the majority of archaeal communities (62.4% of all sequences) followed by Euryarchaeota (31.3%), Bathyarchaeota (3.9%), Woesearchaeota (2.1%) and Lokiarchaeota (0.35%). Fungal communities consisted mainly of Ascomycota (78.3%) followed by Basidiomycota (3.63%), Zygomycota (0.180%) and Chytridiomycota (0.0382%), while 17.9% of the fungal sequences remained unclassified at the phylum level.
Microbial gene copy numbers and α-diversity
Bacterial 16S rRNA gene copy numbers were highest in samples from site 2 and lowest in samples from site 1 (1.72 × 10⁷ ± 3.62 × 10⁶ and 5.17 × 10⁴ ± 8.29 × 10⁴ per g soil, respectively) with significant differences (P < 0.05) between site 2 vs sites 1 and 3 (Table 3). Archaeal gene copy numbers ranged from 1.73 × 10² ± 2.83 × 10² in site 1 to 2.01 × 10⁵ ± 2.62 × 10⁵ per g soil in site 2. Archaeal gene copy numbers followed a similar pattern among sites as bacterial gene copies; however, differences between the sites (P < 0.05) were not significant.
Bacterial and archaeal 16S rRNA gene copy numbers and bacterial, archaeal and fungal α-diversity

Values represent means ± std dev. (n = 3). Different letters indicate significant (P < 0.05) differences between individual means. P-values were obtained by one-way analysis of variance (ANOVA) followed by Tukey's HSD post-hoc testing, ∗∗∗P < 0.001, ∗∗P < 0.01, ∗P < 0.05, n.s. = not significant.
Bacterial observed richness (S obs) was higher in the glaciofluvial outwash sites 2 (755 ± 65.60) and 3 (779 ± 20.07) than in the moraine site 1 (691 ± 12.10) while Shannon diversity (H) was highest in the samples from site 2 (5.50 ± 0.24) and lowest in samples from site 3 (5.35 ± 0.07, Table 3). However, neither S obs nor H indicated significant differences between the sites for bacteria (P < 0.05). For fungal communities, both S obs and H were higher in sites 2 (237.33 ± 64.29 and 2.95 ± 0.26, respectively) and 3 (397.33 ± 60.86 and 3.97 ± 0.36, respectively) than in site 1 (237.33 ± 64.29 and 2.95 ± 0.26, respectively), but only differences in H were significant. On the contrary, archaeal S obs and H were higher in site 1 (8 ± 3.46 and 1.50 ± 0.44, respectively) than in sites 2 (4.33 ± 3.51 and 0.93 ± 0.84, respectively) and 3 (3.33 ± 2.52 and 0.34 ± 0.30, respectively), however not significantly.
Collectively, for both gene copy numbers and α-diversity indices, a contrasting picture between the outwash plain sites 2 and 3 vs the moraine site 1 is apparent with higher gene copies and a higher diversity in the former two. Higher gene copy numbers and diversity indices indicate richer, more complex microbial communities. Taken together with the observed increase in C, N content and the progression of weathering, these patterns point toward alleviation of severe, restrictive environmental conditions such as the paucity of C and nutrients in sites 2 and 3 compared with site 1, creating an increase in available niches. Likewise several authors found increasing bacterial (Kandeler and others, Reference Kandeler, Deiglmayr, Tscherko, Bru and Philippot2006; Bajerski and others, Reference Bajerski and Wagner2013; Frey and others, Reference Frey, Bühler, Schmutz, Zumsteg and Furrer2013; Rime and others, Reference Rime2015), fungal (Rime and others, Reference Rime2015) and archaeal (Mateos-Rivera and others, Reference Mateos-Rivera2016) gene copy numbers with increasing soil development along forefields of receding glaciers. Also, microbial diversity was found to increase with increasing distance from the glacier and thus increasing ecosystem development in other studies (Nemergut and others, Reference Nemergut2007; Brown and Jumpponen, Reference Brown and Jumpponen2014; Rime and others, Reference Rime2015).
Microbial β-diversity
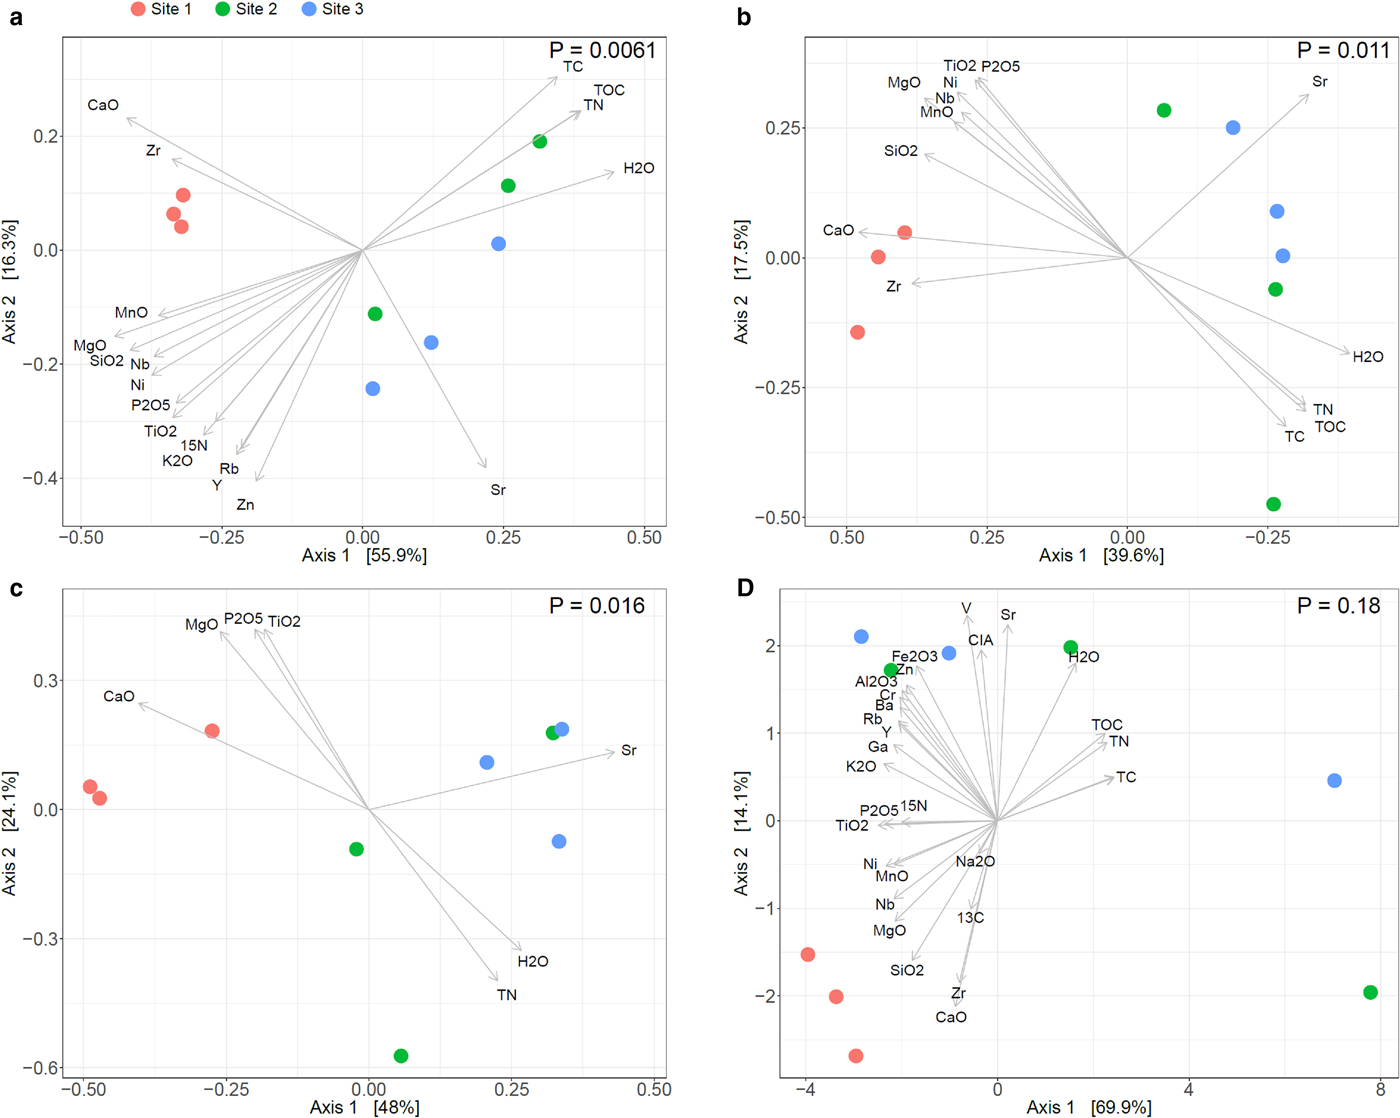
PCoA showed distinct bacterial, fungal and archaeal community structures among the three sites with a high percentage of total variation explained by the first two axes (in total 72.2% for bacteria, 57.1% for fungi and 72.1% for archaea, respectively, Figs 5a–c). Bacterial and fungal communities in samples from the two glaciofluvial outwash sites 2 and 3 were similar to each other but they both strongly differed from the samples from the moraine site 1. Archaeal communities showed a similar trend, but the separation of site 1 from the other two sites was less pronounced. Interestingly, the bacterial community structures from sites 2 and 3 exhibited a much higher within-site variability compared with samples from site 1, while for fungi and archaea, a larger variability was only observed in samples from site 2. Significant differences of microbial community structures between the sites were confirmed by PERMANOVA (P = 0.0061, 0.016 and 0.0111 for bacteria, archaea and fungi, respectively) and supported by ANOSIM statistics (P = 0.0104, 0.0227 and 0.0069 for bacteria, archaea and fungi, respectively). These results are congruent with other studies that report pronounced changes of microbial community structures from recently deglaciated sites to sites at intermediate distance from the glacier front with convergence of the community in more distant sites which was associated with increasing vegetation cover stabilizing microbial communities (e.g. Brown and Jumpponen, Reference Brown and Jumpponen2014; Rime and others, Reference Rime2015; Kazemi and others, Reference Kazemi, Hatam and Lanoil2016). Plant establishment likely also contributes to driving differences of microbial community structures between the vegetated sites 2 and 3 and the unvegetated site 1.
PCoA of geochemical variables at the three sites geochemical parameters with bacterial (a), fungal (b) and archaeal (c) community structures and geochemical parameters alone (d). Ordination of microbial community structures was based on Bray–Curtis dissimilarities. The variance explained by each PCoA axis is given in parentheses. Vectors represent correlations of geochemical parameters with the PCoA ordination scores. P-values indicate significance of the differences between sites based on permutational analysis of variance (PERMANOVA).
Furthermore, for archaea, on the moraine site 1, we detected Lokiarchaeota, Bathyarchaeota and Woesearchaeota, which were not present in any of the samples from sites 2 and 3 (see also Fig. S1, Supplementary Information). In contrast, site 3 was dominated by Thaumarchaeota with only a few Euryarchaeota sequences (Fig. S1, Supplementary Information). In the light of geochemical soil properties indicating an increase of soil development in the two glacial outwash sites compared with the moraine sites, this shift from Euryarchaeota to Thaumarchaeota is in line with previous studies (Zumsteg and others, Reference Zumsteg2012; Mateos-Rivera and others, Reference Mateos-Rivera2016), where Euryarchaeota were found to colonize the bare soil and Thaumarchaeota were suggested to colonize more developed soils. In addition, Thaumarchaeota include members of the Nitrososphaerales, which are able to oxidize ammonia to nitrite and to fix CO2 (Schleper and others, Reference Schleper, Jurgens and Jonuscheit2005; Spang and others, Reference Spang2010; Mateos-Rivera and others, Reference Mateos-Rivera2016), and might thus importantly contribute to the C and N-cycle (Nicol and others, Reference Nicol, Tscherko, Embley and Prosser2005; Spang and others, Reference Spang2010).
It should be noted that our sampling campaign took place in winter. Seasonality has been shown to exert an impact on microbial communities in arctic and alpine environments (Schmidt and Lipson, Reference Schmidt and Lipson2004; Lazzaro and others, Reference Lazzaro, Brankatschk and Zeyer2012; Schostag and others, Reference Schostag2015). Seasonal variations are associated with low temperature and frozen ground as well as low UV radiations (Lazzaro and others, Reference Lazzaro, Brankatschk and Zeyer2012; Bradley and others, Reference Bradley, Singarayer and Anesio2014). Moreover, climatic variations and snow cover across different seasons affect C and nutrient fluxes which additionally influence microbial communities (Hodkinson and others, Reference Hodkinson, Coulson and Webb2003; Schmidt and others, Reference Schmidt2008; Lazzaro and others, Reference Lazzaro, Franchini, Brankatschk and Zeyer2010). Therefore, seasonal effects should be studied more intensively in order to enhance our understanding of biogeochemical cycles in proglacial ecosystems.
In order to link changes in the overall community structure to certain taxa at the OTU level and to assess, whether these taxa were associated with a certain site or distributed evenly across sites, we performed an indicator species analysis. We found 83 bacterial (5.2% of all OTUs; Fig. 6a) and 30 fungal indicator OTUs (2.6% of all OTUs; Fig. 6b) that were significantly associated with one or several sites (P < 0.05) and could be classified at the genus level. Archaea displayed very little diversity and hardly classified at genus level, therefore indicator analysis did not reveal meaningful patterns for archaea and was not included. For both bacteria and fungi most OTUs were associated with site 1. The abundance of bacterial and fungal indicator OTUs ranged from 0.004 to 1.37% and 0.0012 to 2.07%, respectively.
Bacterial and fungal indicator species and their correlations with geochemical variables. Bacterial (a) and fungal (b) indicator OTUs that correlated significantly (P < 0.05 with one or several sites) and could be classified at the genus level are depicted in a taxonomic tree, respectively. The shape plot represents the point-biserial correlation coefficients between OTUs and sites. Geochemical variables significantly (P < 0.05) explaining variance in the bacterial and fungal community structures as determined by the distLM procedure were correlated with the relative abundance of the indicator OTUs using Spearman rank correlations, represented in a heatmap. Closed and open symbols indicate if these correlations were significant (P < 0.05) or not, respectively. Bar plots indicate the relative abundance of the OTUs in the whole dataset.
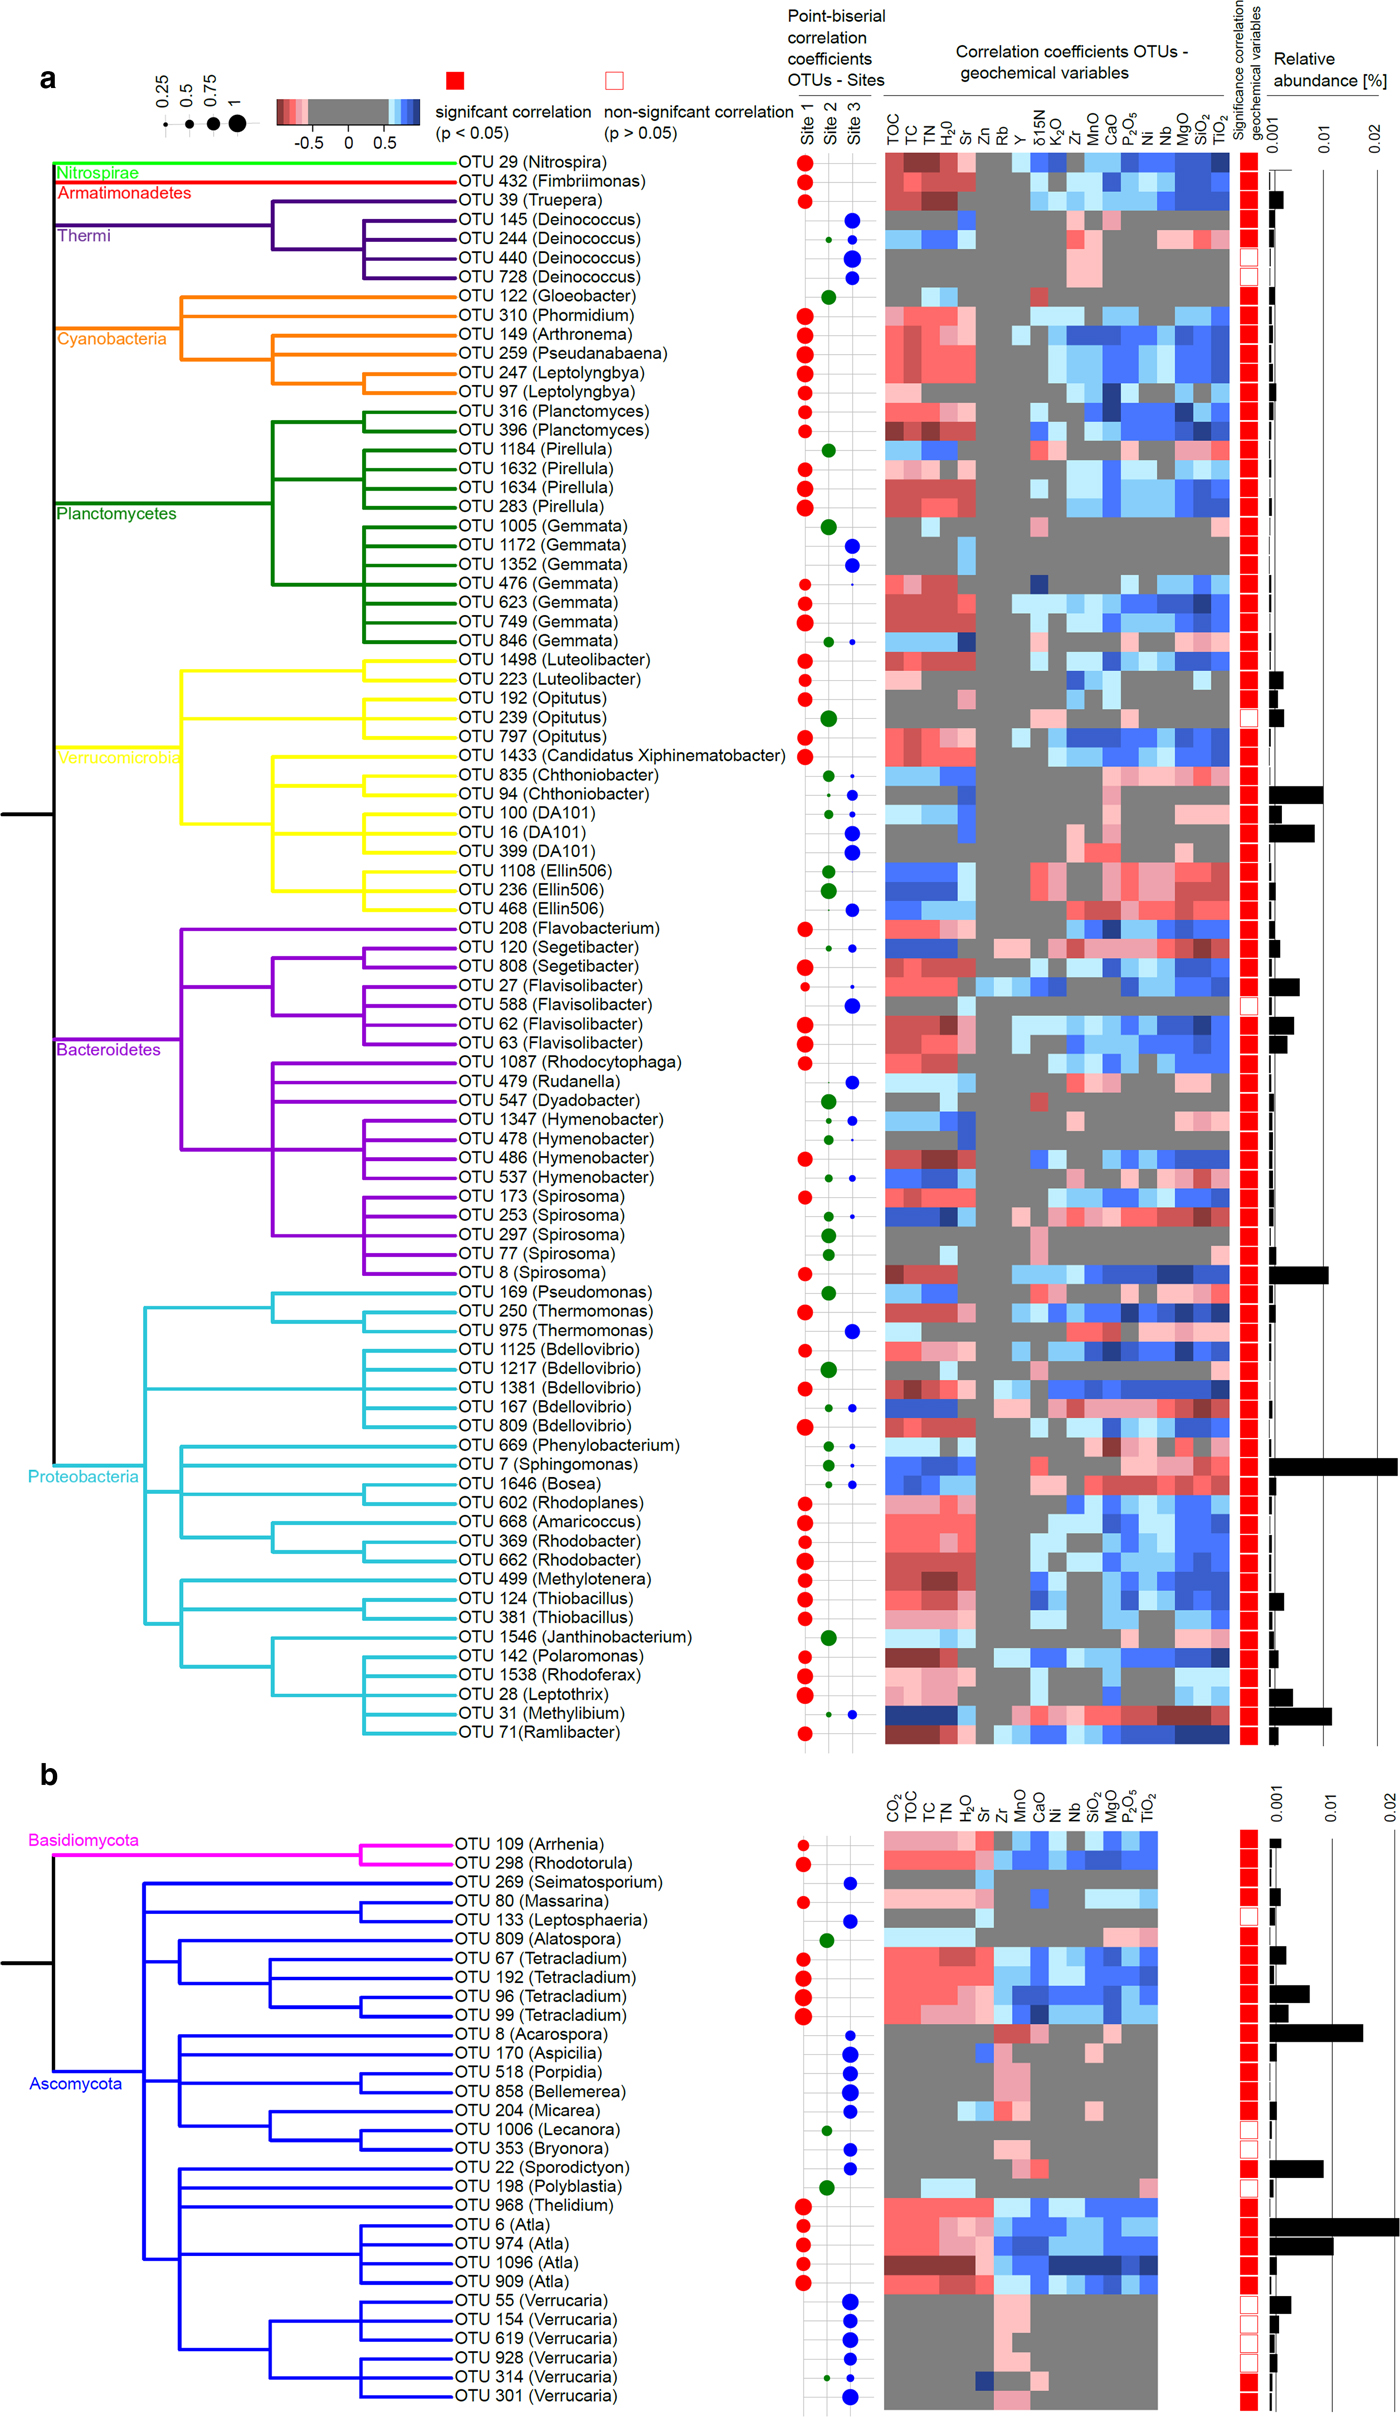
For bacteria, association with a certain site was mostly not consistent throughout taxonomic groups with a few exceptions: For instance, indicators within the genus Deinococcus were associated with site 3. Cyanobacterial genera with the exception of Gloeobacter were associated with site 1. Cyanobacteria are autotrophic organisms with the ability to fix N2. They can also withstand strong UV radiation, fluctuating temperature and moisture conditions (Janatková and others, Reference Janatková2013). Thus, these organisms might contribute to the build-up of the carbon and nitrogen pool in the plant-free moraine site. Cyanobacteria such as Phormidium or Leptolyngya have been isolated previously in Arctic environments such as Svalbard (Matula and others, 2007; Pessi and others, 2018) and have also been found to increase with altitude and thus decreasing stage of soil development in the Himalaya (Janatková and others, Reference Janatková2013; Čapková and others, Reference Čapková, Hauer, Řeháková and Doležal2016). Phormidium was also found to be associated with the surface of barren soils at the Damma glacier in the Swiss Alps (Frey and others, Reference Frey, Bühler, Schmutz, Zumsteg and Furrer2013; Rime and others, Reference Rime2015). Moreover, we found several genera among α- and β-Proteobacteria associated with site 1 which are known for a versatile metabolism involving photoorganoheterotrophy, photolithoautotrophy and chemoheterotrophy under both aerobic and anaerobic conditions, such as Rhodobacter and Rhodoplanes (Imhoff and others, Reference Imhoff, Trüper and Pfennig1984; Hiraishi and Ueda, Reference Hiraishi and Ueda1994; Pujalte and others, Reference Pujalte, Lucena, Ruvira, Arahal and Macián2014). Furthermore, the chemolithotrophic sulfur oxidizer Thiobacillus was associated with site 1 and might contribute to mobilizing nutrients from the bedrock by weathering (Garrity and others, Reference Garrity, Bell, Lilburn, Brenner, Krieg and Staley2005; Borin and others, Reference Borin2010; Dold and others, Reference Dold2013). Likewise, Polaromonas, commonly retrieved from cold environments (Darcy and others, Reference Darcy, Lynch, King, Robeson and Schmidt2011; Hell and others, Reference Hell2013; Larose and others, Reference Larose, Dommergue and Vogel2013) and known to contribute to granite weathering in alpine environments (Frey and others, Reference Frey2010), was associated with site 1. Conversely, the predominantly plant-associated genera Pseudomonas, Sphingomonas and Bosea were associated with the vegetated sites 2 and 3 (Marcondes de Souza and others, 2012; Vorholt and others, Reference Vorholt2012).
For fungi, we found two indicator OTUs within the phylum Basidiomycota which were associated with site 1. On the one hand, we found the yeast-like genus Rhodotorula, which is known for a versatile lifestyle, global distribution and has been found previously in cold environments such as glacial ice and barren rocks (Buzzini and others, Reference Buzzini, Turk, Perini, Turchetti and Gunde-Cimerman2017) and permafrost soils (Frey and others, Reference Frey2016). On the other hand, we found an OTU affiliated with Arrhenia which has been recovered previously from cold environments (Ohenoja and others, Reference Ohenoja and Ohenoja2010). Within the phylum Ascomycota, we mostly found lichenized fungi which are associated with nutrient-poor environments, moisture and temperature fluctuations and being involved in obtaining nutrients by weathering from the bedrock material (Nash, Reference Nash2008; Brunner and others, Reference Brunner2011). The genus Verrucaria was associated with site 3 and encompasses mostly sub-aquatic representatives such as V. margacea to which three of our six indicator OTUs affiliated with Verrucaria belong. Thus, temporarily submerged conditions at the floodplain site 3 might favor the presence of OTUs affiliated with Verrucaria. This genus displays a global distribution and is not restricted to cold environments (Galloway, Reference Galloway and Nash2008). Members of the class Lecanoromycetes, of which indicator OTUs were also mostly associated with site 3, on the other hand, comprise mostly terrestrial species, although a few sub-aquatic representatives exist and grow predominantly on tree bark and rocks (Gueidan and others, Reference Gueidan, Hill, Miadlikowska and Lutzoni2015). As for Verrucaria, indicator OTUs belonging to Lecanoromycetes mostly include cosmopolitan species although for some genera members have been associated also with, e.g. a bipolar distribution (Bryonora) or even semiarid environments (Aspicilia) (Galloway, Reference Galloway and Nash2008). The genus Atla, which was consistently associated with site 1, including A. alpina to which all the indicator OTUs identified here belong has been described rather recently (Savić and Tibell, Reference Savić and Tibell2008) and has been reported to grow on soil and calcareous rocks in Scandinavia, Spitsbergen and the Alps and thus seems to prefer temperate to cold environments. Moreover, we found OTUs affiliated with the genus Tetracladium to be associated with site 1 which was found to be associated with sparsely vegetated soils in the forefield of the Damma glacier by Rime and others (Reference Rime2015).
Relationships between geochemical and microbial variables
A major goal of this study was to quantify the correlation between weathering advancement, C and nutrients contents and microbial community structures. PCoA of the geochemical parameters (Fig. 5d; Fig. S2, Supplementary Information) revealed similar clustering of the sites compared to the patterns of microbial community structures (Figs 5a–c). Samples from site 1 formed a distinct group that was well separated from samples from sites 2 and 3, which were more closely related to each other but which also displayed a higher within-site variability. However, the three sites were not significantly distinct based on PERMANOVA. The similarities of patterns between the sites for geochemistry and microbial community structures suggest strong relationships between the two. We also employed DistLM to estimate to what extent geochemical variables correlate with changes in microbial community structures (Table 4; Table S5, Supplementary Information). Investigated separately, 21 of 29 geochemical variables significantly (P = 0.05) correlated with the bacterial data, whereas only 15 and seven variables significantly correlated with the fungal and archaeal data, respectively. For bacteria CaO (48.6% of variance), H2O (48.4%), MgO (47.9%), SiO2 (44.4%) and TOC (44.1%) were revealed as the best predictors of community structures. For fungi CaO (37.1%), MgO (31.6%), H2O (30.4%), Sr (28.2%) and SiO2 (27.4%) and for archaea CaO (40.2%), Sr (39.9%), MgO (33.3%), P2O5 (28.6%) and TN (27.2%) explained most variance, respectively. These results highlight the tight relationship between microbial community structures development and nutrient build-up (increasing TOC and TN abundance) together with the progression of weathering (decreasing CaO, MgO and SiO2 abundances).
Variance of prokaryotic and fungal community structure constrained by geochemical variables

Variance in the microbial data explained by each variable individually was assessed based on the marginal test of the DistLM procedure; P-values are obtained from a permutational test implemented in DistLM; ∗∗∗P < 0.001, ∗∗P < 0.01, ∗P < 0.05, n.s. = not significant; The first ten variables explaining most variance in the bacterial, archaeal and fungal data are shown, respectively, the full table can be found in the Supplementary Information material. b.d. below detection limit.
Variables that significantly (P < 0.05) explained variance in the microbial data were subsequently correlated with PCoA ordination scores of the microbial community data. For all three domains, CaO, Sr and Zr were correlated with the differences between site 1 vs sites 2 and 3, although Zr was not found as a significant predictor of archaeal community structure. All other variables were either correlated with the high within-site variations within sites 2 and 3 or showed no clear pattern. Both DistLM and correlation of the geochemical parameters with the PCoA ordinations scores indicated a high colinearity between geochemical variables. A strong correlation was found between TC, CO2, TN, TOC and H2O (Fig. S3, Supplementary Information). This cluster was strongly negatively correlated with SiO2, MgO, TiO2, K2O, Ni and Nb. Sr, δ 13Corg, Na2O, CIA, V, Zr and CaO did not exhibit any strong positive or negative correlation, whereas Fe2O3, Rb, Zn, Al2O3, Cr, Ba, Ga and Y formed another cluster.
Changes in Ca and Mg could be linked to changes in pH (Chigira and Oyama, Reference Chigira and Oyama2000), which in other proglacial ecosystems studies has been inferred to be strongly correlated to microbial community structures in previous studies (Zumsteg and others, Reference Zumsteg2012; Rime and others, Reference Rime2015). In addition, TOC and TN contents were closely linked with bacterial and fungal communities and to a smaller extent with archaeal community structures. This is consistent with the results of previous studies that revealed that soil C and N contents were tightly associated with the microbial community structure (Zumsteg and others, Reference Zumsteg2012; Rime and others, Reference Rime2015) and enzymatic activity in soil (Tscherko and others, Reference Tscherko, Rustemeier, Richter, Wanek and Kandeler2003). Our results also indicated a strong correlation between soil geochemical elemental composition and microbial community structures. Soil elemental composition has previously been found to exert a major influence on microbial community structures in oligotrophic environments (e.g. Carson and others, Reference Carson, Rooney, Gleeson and Clipson2007) and this relationship was reported in previous studies on recently deglaciated terrains (Bernasconi and others, Reference Bernasconi2011), highlighting the feedbacks between soil geochemistry and ecosystem development and their interconnectivity with each other. Biological weathering performed by pioneer microorganisms, in particular, has previously been reported to play a central role in the initial build-up of a labile nutrient pool in recently deglaciated terrain (Schmidt and others, Reference Schmidt2008; Frey and others, Reference Frey2010; Schulz and others, Reference Schulz2013). In addition, it should be noted that we also found strong correlations among the geochemical variables themselves (Fig. S3, Supplementary Information). With the available data, we are not able to further elucidate causal associations between geochemical variables and microbial community structures.
In order to elucidate the relationship of OTU–site associations with geochemical variables, we correlated our indicator species with the set of variables significantly explaining variance in the bacterial and fungal community data, respectively (Fig. 6). For both bacteria and fungi, indicators associated with site 1 were negatively correlated with TOC, TC and TN and positively correlated with most of the mineral oxides, of which CaO, P2O5, MgO, SiO2, TiO2 displayed the strongest correlations. OTUs associated with sites 2 and 3 consistently showed the reverse trend. Fungal indicator OTUs generally displayed weaker correlations with geochemical variables than bacterial indicator OTUs, especially those associated with site 2 or site 3. Also for bacteria, correlations of indicators associated with site 2 or 3 with geochemical variables were weaker than those of indicators associated with site 1.
The consistent relationship between indicator OTUs for a certain site and geochemical variables suggests that the latter are crucial drivers of OTU–site associations. The positive correlation of site 1-associated indicators with minerals and negative correlation with soil C and N is in agreement with the ecological role of the respective indicators discussed above: For instance, among bacterial indicators associated with site 1, we found versatile autotrophs capable of C- and N-fixation as well as of obtaining nutrients from rocks by weathering such as Cyanobacteria, Thiobacillus and Polaromonas (Garrity and others, Reference Garrity, Bell, Lilburn, Brenner, Krieg and Staley2005; Frey and others, Reference Frey2010; Janatková and others, Reference Janatková2013). Fungal indicators associated with site 1 include, for example, the highly versatile yeast-like genus Rhodotorula (Buzzini and others, Reference Buzzini, Turk, Perini, Turchetti and Gunde-Cimerman2017). The predominant occurrence of these taxa in the C and nutrient-poor site 1 in our study confirms that they possess a highly specialized lifestyle allowing them to thrive under oligotrophic conditions allocating carbon and nutrients from external sources. Conversely, in the more developed glacial outwash sites 2 and 3, such specialized oligotrophs are likely outcompeted by organisms that degrade more complex, plant-derived organic matter present in the soil, such as Sphingomonas and Pseudomonas (Goldfarb and others, Reference Goldfarb2011). In accordance with this interpretation, Rime and others (Reference Rime2015) found oligotrophic, versatile taxa such as Geobacter in a barren soil while taxa able to degrade complex organic compounds were associated with developed soils in the proglacial area of Damma glacier, Switzerland. Here, we corroborate such associations of indicator OTUs with barren, plant-free soils vs more developed, vegetated soils. In addition, for the first time, we support an indicator analysis with a comprehensive geochemical characterization thus substantiating the linkage between OTU–site associations with soil C- and N-content as well as elemental composition. Collectively, linking the results of indicator analysis with geochemical soil properties confirms the contrast of both geochemistry and microbial communities in the glaciofluvial outwash sites 2 and 3 vs site 1 and highlight the importance of TOC, TC and TN vs mineral oxides structuring microbial communities between these contrasting sites.
Comparison of the moraine and the glaciofluvial outwash
The shift in C and N isotopic ratios, the increase in C and N contents, the observed weathering progression, and microbial abundance, species richness and community composition together point toward a higher degree of soil ecosystem development in the glaciofluvial outwash (sites 2 and 3) than in the moraine (site 1). In addition, the microbiological and geochemical characteristics of sites 2 and 3 can also be distinguished from those of the samples from site 1 due to their higher within-site variability as is clearly highlighted by our principal coordinate ordinations (Fig. 5). We suggest that the contrasting ecosystem development pattern between site 1 vs sites 2 and 3 can largely be explained by geomorphological differences (Fig. 1). The glaciofluvial outwash is more heterogeneous and dynamic than the moraine. Hydrological dynamics lead to the formation of dynamic braided drainage pattern in the glaciofluvial floodplain, which likely explains the larger within-site variability in the two glaciofluvial outwash sites 2 and 3. All sites, in particular on the glaciofluvial outwash (sites 2 and 3), have been subjected to deposition of new material, erosion, and they have likely undergone drastic geomorphological and hydrological disturbances since deglaciation. Thus, it is important to note that the age of the soil ecosystem sampled in this study could potentially differ markedly from the age of the terrain since deglaciation. We suggest that the different patterns observed at our sites can be explained as the result of both the geomorphological setting and terrain age since deglaciation. However, our dataset does not allow us to elucidate the relative contribution of these factors.
CONCLUSIONS
In conclusion, our complementary and interdisciplinary dataset allowed us to develop a generic framework for how changes of microbial communities and geochemical variables linked to weathering lead to soil development in a High Arctic proglacial terrain. Our data overall indicated a more developed and heterogeneous soil ecosystem in the glaciofluvial outwash plain than in the moraine. Specifically we found more abundant and diversified microbial community structures, greater C and N contents as well as more advanced physical and chemical weathering (via the depletion of Ca and Mg) in the glaciofluvial outwash plain than in the moraine. Our dataset highlights the close relationship between C and N, weathering-induced geochemical changes and microbial community structures. Our results suggest functional linkages between geochemical and microbial assemblages, but also reveal that such linkages must be investigated with greater care in future studies to deepen our understanding of the habitability of recently deglaciated environments. Finally, we suggest that the effect of variation in geomorphological features on ecosystem development in proglacial environments should be studied in greater depth in the future.
SUPPLEMENTARY MATERIAL
The supplementary material for this article can be found at https://doi.org/10.1017/aog.2019.1
ACKNOWLEDGEMENTS
This work was funded by the MicroArctic Innovative Training Network grant supported by the European Commissions's Marie Sklodowska Curie Actions program under project number 675546. We thank the following colleagues from the German Research Centre for Geoscience (GFZ) in Potsdam for their help: Marina Ospald and Hartmut Liep for milling the soil samples, Anja Schleicher and Andrea Gottsche for help with the X-ray fluorescence measurements, Birgit Plessen and Sylvia Pinkerneil for C-N and isotopic analyses and Anke Saborowski, Fabian Horn and Susanne Liebner for support with archaeal sequencing processing and archaeal microbial analysis. Moreover, we thank Beat Stierli and Martin Hartmann from the Swiss Federal Research Institute WSL in Birmensdorf for support with the molecular analyses of the bacteria and fungi. LGB would also like to acknowledge the support from the Helmholtz Recruiting Initiative grant No. I-044-16-01.


 Open access