
INTRODUCTION
The trade in looted artifacts is a phenomenon of global proportions, adversely impacting community-level cultural knowledge and the scientific record and correlating with other forms of criminal activity.Footnote 1 While the trade is not new, recent conflicts in the Middle East have drawn intensified attention to endemic looting at archaeological sites in Syria and Iraq.Footnote 2 Quantifying the trade in monetary units has become an urgent research need because accurate estimates of money flows and profits hold promise for better policy instruments to counter the trade at both the source and in the marketplace.Footnote 3 The interest of journalists and policymakers has been how much revenue particular groups generate by looting and selling artifacts. Scholars, meanwhile, have focused on archaeological site damage wrought by military operations, territorial expansion, and performative destruction, in addition to looting. The high-level revenue question and the fine-grained site study leave us with a considerable research gap. One major challenge is empirical observation; as with many illegal markets, direct empirical evidence is elusive.Footnote 4 Interdictions capture an unknown fraction of illicitly exported artifacts and so must be used in conjunction with other data or certain strong assumptions in order to provide estimates of market size.Footnote 5 Site observations (“ground truthing”) can reveal information about illicit digging frequency and intensity but cannot accurately capture artifact loss through digging. These problems lead to two related questions. First, on what basis can the site-level study be scaled up to region- or trans-national-level discussions about looting and market activity? Second, how can data on one phenomenon (in our case, scientific excavation) be made commensurable with data on another (artifact sales)?
We approach this research problem at the level of a site. Prior studies of the antiquities market have used auction lots or pooled objects as the units of analysis. For our purposes—namely, studying a messy universe of artifact circulation and monetization—site-level analysis has important advantages, chief among them the availability of detailed excavation records that document the discovery and removal of artifacts from specific locations. In operationalizing our study this way, we acknowledge that the concept of “site” is a modern construct that delimits past flows of people, objects, practices, and ideas. Participants in the trade in archaeological materials, meanwhile, do not necessarily structure their work around particular sites. While some dealers and buyers specialize along lines of historical period, region, and artifact category, there is mixed evidence for site being a prioritized category in this market. We acknowledge these issues and agree that “site” should not be reified as the best or only way to approach the study of ancient societies. At the same time, the “site” as referring to a particular settlement or feature does have meaning in the study of looting because it is a practical referent for how illicit diggers organize their work.
One challenge to a site-level analysis is the great degree of heterogeneity among individual objects at a given site and between different sites from different periods of time. To this end, we rely on foundational work on archaeology and looting. Studies of archaeological looting have focused on damage to communities’ cultural heritage and loss of scientific data.Footnote 6 This literature situated close interpretive analysis of specific sites and objects in broader socio-economic patterns to explain who looted and why and with what consequences for cultural knowledge and archaeological research. Subsequent studies explored quantitative approaches to clarify the scope and value of the trade,Footnote 7 while scholars in law and criminology assessed the efficacy of legal instruments and enforcement mechanisms designed to stop it.Footnote 8 What links these developments is methodology and scale. For the most part, scholars of looting have used qualitative methods to construct small-scale studies. There is great value in this approach as it elucidates subtle variations in structures and practices that ultimately account for macro-level pattern differences. A deficit, however, is that small-scale studies do not yield data that can explain looting and profit patterns at the regional, national, or global levels.
Recent developments in remote-sensing technologies have ushered in a new age of looting studies. Images from satellites and drones have allowed scholars to measure patterns in the frequency and extent of looting, covering large swathes of topography and tracking the development of looters’ pits with sophisticated metrics.Footnote 9 Satellite and drone images do not, however, reveal what kinds of artifacts or how many were removed in the course of looting.Footnote 10 Similarly, “ground truthing,” or on-the-ground examination of looted sites, can identify patterns documenting when and where illicit digging took place.Footnote 11 This technique is of limited assistance in estimating the market value of a site—by which we mean the sale price of ancient artifacts from the site, if they were dug up and sold at an established Western dealer or auction house—because it tends to focus on site and structure damage to the exclusion of quantitative market analysis.
Our work breaks new ground by combining market data with excavation data. Our unique data set includes 41,587 artifacts sold at 33 firms, consisting of 40 unique sales locations in seven countries, and 14,160 artifacts from two different excavation sites. Firm types include auction houses, brick-and-mortar private dealers, and online outlets. Methodologically, we classify each artifact’s observable characteristics into variables and then use machine-learning versions of hedonic pricing to predict the object’s sale location, sale format, and pre-auction estimate or posted price. We selected two sites—Tell Bi’a, an Early/Middle Bronze Age site in northern Syria, and Dura Europos, a Greco-Roman site in southeastern Syria—to make an out-of-sample prediction. Both sites were subject to systematic looting during the Syrian conflict.Footnote 12 Our model offers an important step toward estimating the market value of an entire archaeological site, thereby filling a major gap in the study of the illicit trade in artifacts. In order to estimate market value, we predict prices using a machine-learning algorithm. Millions of randomized predictions drawn from computerized simulations generate our estimates.
The core insight of our work is that identifying, aggregating, and matching physical characteristics of objects makes it possible to predict what sorts of items are buried at a site and how much they would be worth on the open market. The sites we selected for this study are representative of both their time periods and types of occupation (an Early/Middle Bronze Age regional administrative center and a Roman garrison), a fact that allows us to base our predictions on the assumption that the artifacts that have so far been found in the excavated portions of the site are representative of what could be uncovered at the rest of the site. Dura Europos, which was occupied over a very limited period of time, is particularly sensitive to this, as will be noted below.
We tackle the problem of how to study a largely unobservable practice by utilizing observable data in a new way. Our dataset includes small finds, a category of commonplace objects that includes, in the case of Greco-Roman sites, tools, jewelry, military regalia, and household goods and, in the case of Bronze Age sites, figurines, clay tablets, cylinder seals, household items, tools and weapons, jewelry, and decorative items. A key advantage of our data set, in comparison with previous scholarly studies, is its heterogeneity. We show that by working with a wide range of firms and artifact types, we can construct a model that is representative of the diversity of the global antiquities trade. In turn, we generate insights into the huge, hidden market in antiquities that operates in the gray space between legal and illegal parameters.
DATA SELECTION
Two types of data were used in this analysis: objects offered for sale on the antiquities market and objects scientifically excavated and published.
Market Data
The market data consist of publicly available records of 41,587 sales of objects at a variety of international auction houses and dealers listed as members of the International Association of Dealers of Ancient Art (33 total firms). The pre-auction estimated or posted prices total $469,116,026. Data consist of all sales information available online or in online catalogues for sales since 2007. Each object was atomized into fields describing five dimensions: period/date, size, constituent materials, type, and geographic/cultural source; in addition, market data have prices, which were converted to 2016 US dollars. These are the six observable characteristics that we consistently analyzed, in addition to the firm at which each object sold and the lot size in which it sold.
Our dataset offers several advantages based on the variety of firms we cover and the object-level analysis we are able to perform. We do not rely solely on data from top-tier auction houses. Catalogues from the most prestigious firms are an accessible source of information about the antiquities trade and have been subject to extensive scholarly study about provenance, market composition, and market size.Footnote 13 As a data source, however, they present a distorted picture. Antiquities are sold by a variety of vendors and in a variety of groups, or “lots,” which sell for one collective price. Table 1 and Figure 1 show that the various combinations of vendors and sales format reveal differences in prices and object type. The table and figure group top-tier auction houses in New York and London (“large auction houses”), smaller auction houses, and private dealers. As Table 1 shows, large auction houses sell the most items overall, and they have the highest prices for items that are sold alone in their own lot. But large auction houses also sell the majority of their items through multi-item lots, unlike private dealers and other auctioneers. Large houses have the largest multi-item lots, on average, and the median price per item is actually the smallest.
Characteristics of objects sold on market, by venue and lot size
Market price distributions by venue: cumulative density functions representing price per object from the market data (N = 41,587) for various types of vendors.
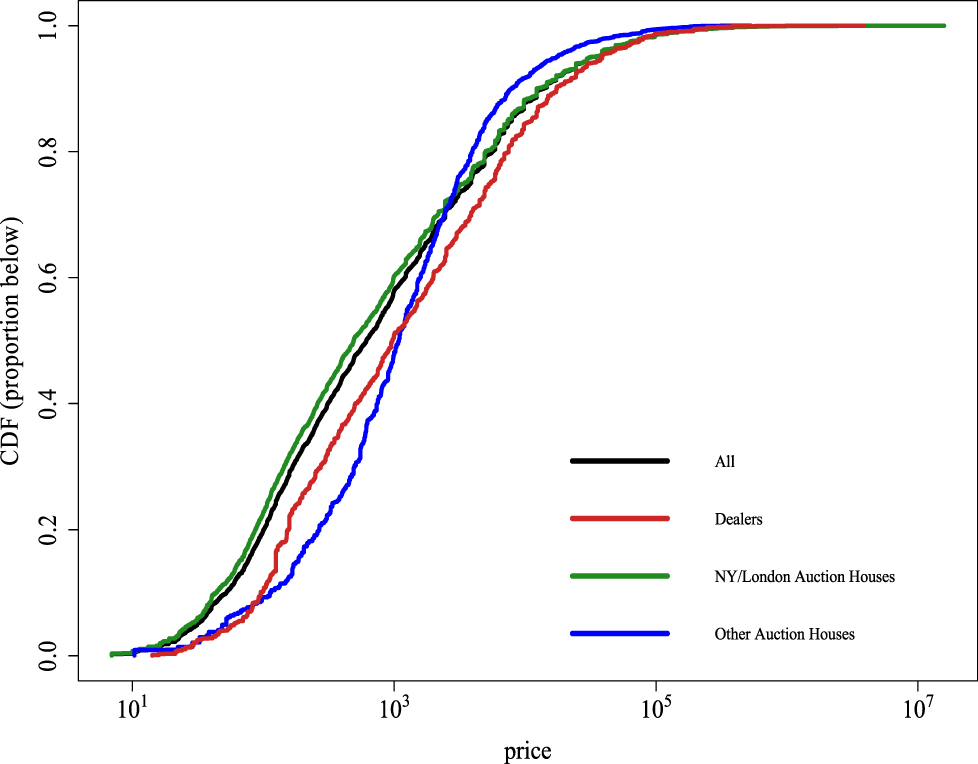
These patterns are evident in aggregate in Figure 1, which shows that large auction houses have both the least and most expensive items, as evidenced by the lower and upper tails of the distributions. Small auction houses, on the other hand, have the smallest-size lots and the lowest prices for items sold alone. Private dealers sell most items individually, with prices higher than small auctioneers and around 50 percent of large auctioneers. In addition, various types of objects sell at different rates across venues. Greek, Roman, and Bronze Age artifacts (the types most probably found at our two test sites) make up the majority of objects at large auction houses, but the minority of objects at small ones. Bronze Age objects are relatively more likely to be sold at a private dealer, compared to Roman and Greek. And across all vendors, Roman objects are relatively more likely to be sold in groups rather than by themselves.
The price differentials between single- and multi-item lots distort the perceived average price and quality of the items that pass through top-tier houses.Footnote 14 Because our analysis focuses on individual objects, not lots, our disaggregated data records the characteristics of each individual item. This is unusual in the literature, and our prediction model accounts for the lot-based sales practice of certain firms, allowing us to model outcomes more precisely. In particular, our algorithm calculates probabilities over various venue/lot-size combinations, based on the observable characteristics of each item. We can then calculate a distribution of prices for each object based on its predicted probability of being sold in a given setting.
While the data captured a wide swath of the market, sample selection is an important concern. By definition, we could not observe private sales or highest bids on items that did not meet reserve prices. Partly for this reason, we used pre-auction estimates rather than hammer prices. Overall, we believe pre-sale estimates and asking prices provide the best proxy for what market participants determine to be the ex-ante “expected” price of an object. In addition, previous research for other types of art suggests that, under reasonable assumptions, pre-sale estimates are unbiased predictors of the random final hammer price.Footnote 15 We also could not observe any prices from the lowest end of the market; many small dealers do not post prices, and we deliberately excluded eBay sales because of concerns about authenticity and misattribution as well as the difficulty in viewing data from past auctions on the site.Footnote 16 Inconsistency has also been a problem for other scholars working on antiquities auctioned on eBay.Footnote 17 More generally, a concern regarding the use of such a diverse set of sellers is that the pricing strategies adopted by auction houses may be distinct from those adopted by private dealers due to the ways in which objects are offered for sale. However, this concern is alleviated by our computational approach, which trains machine-learning algorithms separately for large auction houses, small auction houses, and private dealers.
Excavation Data
We use the database of market sales to estimate prices for artifacts excavated from two archaeological sites in Syria: Tell Bi’a and Dura Europos. The test sites present two different chapters from Syria’s ancient history and, thus, represent different artifact assemblages. Looting has been widespread throughout the country, and sites from all of the major periods have been targeted. Tell Bi’a (Early/Middle Bronze Age) and Dura Europos (Greco-Roman period) differ from each other in material profiles, yet they share a common history of wartime looting. In addition, they represent two periods that are especially valued by collectors. Figure 2 shows the total value of objects in the market database by historical time period. Bronze Age, Hellenistic, and Roman objects are especially large market segments at the firms studied here, while segments such as Chalcolithic and Islamic are small. The finding of our algorithm corroborates on-the-ground observations that pre-Bronze Age sites yield objects that are of less interest to collectors; hence, they have experienced relatively low levels of looting.Footnote 18 Thus, from a collector’s point of view, Dura Europos and Tell Bi’a represent high-value eras of Syria’s past.
Market data by time period: aggregate market value of objects in the market database (N = 41,587) by century of origin. Dates correspond to the midpoint of an object’s attributed range (for example, objects dated 400–200 bc are plotted at 300 bc or -3 on the graph). Periodization of the objects is based on sellers’ descriptions/labels.
In using these datasets for our model, we acknowledge that published excavation records have their limitations. As we highlight below, Dura Europos was excavated at a time when modern scientific excavation techniques had not fully developed, and not all aspects of the excavated structures and objects were accurately recorded. We also rely exclusively on the publications of the Yale University team, which only include the objects in their share, leaving out the material in the National Museum of Damascus. However, the Yale excavations covered approximately 40 percent of the entire site, so we are confident that our data are representative of the rest of the site. In the case of Tell Bi’a, careful and systematic excavation and recording methods allowed only 10 percent of the site to be excavated in 15 years. However, the site fits the general profile of Middle Bronze Age administrative centers in the region both in terms of its settlement pattern and artifact assemblage. As a result, the published data allow us to extend our predictions to the rest of the site.
In the case of Dura Europos, excavation data were drawn from the Yale University–French Academy team that worked at the site between 1928 and 1937, with online records totaling 12,398 objects; 11,566 of these are non-numismatic and were used for this study. After James Henry Breasted of the University of Chicago documented the wall paintings there, Franz Cumont led an excavation team in 1922–23. Cumont’s work was followed by the joint Yale University–French Academy excavations, which lasted ten seasons. Following a long hiatus, the site was excavated again from 1986 to 2011 by a Franco-Syrian team.Footnote 19 The material from the Yale University–French Academy excavations was selected for detailed study here because it is the only one of the excavations to have produced a large number of detailed publications of the excavation, and the Yale University share of the excavation is available online, meaning that one has access to a large number of objects.
There are certain drawbacks to the corpus, however. Unlike scientific excavations today, the Dura Europos excavations did not carefully record stratigraphic levels or differentiated soil layers and the artifacts contained therein. Rather, they made general notes on the find-spots for the objects, with recording accuracy improving particularly from the fifth season (1931–32) onwards.Footnote 20 Nevertheless, patterns in the distribution of artifacts in specific parts of the site or across the entire site can be established because the site was built on a grid plan and is only occupied in the Greco-Roman period. The Yale records list each object with a size, cultural attribution, chronological date, physical description, and usually a photograph.
At Tell Bi’a, excavation data were drawn from reports published by the German team that worked at the site from 1980 through 1995. These sources include annual excavation reports that appeared in the Mitteilungen der Deutschen Orient-Gesellschaft periodicals between 1982 and 1995, six special volumes in the Wissenschaftliche Veröffentlichung der Deutschen Orient-Gesellschaft series dedicated to graves; finds from the Early Bronze Age levels; written documents; city walls, houses, and temples; and seals and seal impressions. The final book in this series, which covers the architecture and small finds excavated in Palace A, was published in 2007. As a recently conducted scientific excavation, Tell Bi’a offers the advantage of a complete dataset, in which all excavated objects were meticulously recorded, photographed, and published. These data constitute 2,594 total Bronze Age objects that were collected and entered into our project database by hand.
ARCHAEOLOGICAL BACKGROUND
Dura Europos
Dura Europos, a 72-hectare site in southeastern Syria, was founded at the end of the fourth century bc by the Greek Seleucids and was taken over by the Parthians in the late second century bc. After the middle of the second century ad, the Romans controlled the site until the Sasanian Persians conquered it in ad 256. There is limited evidence for occupation before and after this general timeline.Footnote 21 As such, the site offers clear start and end dates of human inhabitation, allowing us to develop our predictive methodology on a specific subset of objects. Two more factors make Dura Europos a good case study: it is associated with object types that have high collecting interest (as shown by Figure 2), and its geomorphology offers favorable conditions for preserving a wide range of artifacts including natural fibers, wood, and leather, thereby providing a diverse dataset for analysis. However, these factors also make Dura Europos a unique case among Greco-Roman sites in Syria in terms of its unusual artifact assemblage and objects that could be excavated and placed on the market.
Coins from Dura Europos have not been considered in this analysis for several reasons, despite the fact that they are primary targets of looting. While coins are, of course, a type of archaeological artifact, when it comes to the modern antiquities market, they are treated as a different type of good in terms of how they are marketed at auction and how their value is determined. Coins are usually sold at specialized auction houses and, therefore, largely do not overlap with the auction houses that were studied here. Indeed, coins constitute only 35 of the 41,587 items in our database, most having been made into jewelry in the modern period. From the point of view of our algorithm, the main difference is that coins have idiosyncratic characteristics that are important in determining price: mint, for example, is an attribute that only coins have. The value of coins is important to our understanding of the scale of looting in Syria and will be considered by Oya Topçuoğlu and Tasha Vorderstrasse in a separate, forthcoming publication on small finds.Footnote 22
Reports indicate that heavy looting had already occurred at Dura Europos by mid-June 2013, when the on-site museum was damaged and several large-scale items were taken from the site without official permission.Footnote 23 Dura Europos came under the control of the Islamic State in Iraq and Syria (ISIS) in September 2014, at which point it had sustained “large-scale, systematic looting” that had “destroy[ed] the archaeological record over an enormous area.”Footnote 24 After an apparent pause in looting activity from autumn 2014, Dura Europos was again subject to illegal excavations at least by April 2015.Footnote 25
Tell Bi’a
Tell Bi’a (ancient Tuttul), a Bronze Age mound, is a 52-hectare site located in the Ar-Raqqa governorate in northern Syria, 800 meters north of the city of Raqqa, once the headquarters of ISIS. The site was excavated between 1980 and 1995 by a German team led by Eva Strommenger. The settlement was first occupied in the third millennium bc. This period of occupation dating to the Early Bronze Age yielded a large section of the city wall as well as the remains of a palace (Palace B), a temple (Temple C), and houses and graves, located in the southwestern quadrant of the settlement. Excavation reports also mention an as yet unexcavated palace (Palace C) and royal graves dating to the Early Bronze Age. The city reached its height during the second quarter of the second millennium bc (circa 1790–76 bc), when it functioned as one of the administrative centers of the Kingdom of Upper Mesopotamia ruled by king Samsi-Adad I. This period of occupation is best represented by a large palace (Palace A) at the center of the settlement, which was the focus of the German excavations. The building yielded large numbers of cuneiform tablets, seal impressions, and other small finds, such as ceramics, gaming boards, figurines, and clay models of houses and wagons. After its conquest and destruction in 1776 bc by King Zimri-Lim of Mari, Tell Bi’a appears to have lost its importance as a regional center. Late Bronze Age levels at the site have only yielded the remains of private houses. The site went through a revival during the Byzantine and early Islamic periods, which are represented by a sixth century ad Christian monastery and an Islamic coin hoard. However, this later inhabitation at the site is not considered in our analysis because it has not been fully published and other comparative Bronze Age sites do not all have similar reoccupation.
Satellite imagery of Tell Bi’a from as early as October 2012 shows dense looting in the form of hundreds of looters’ pits, concentrated in the southwestern quarter of the site around several Early Bronze Age structures and in the area around the Early/Middle Bronze Age palace (Palace A), where a high concentration of small finds was excavated.Footnote 26 In publicly available satellite image of the site from February 2016, provided by Google Earth/DigitalGlobe, smaller concentrations of pits are also visible in other parts of the site. In terms of its archaeology and artifact assemblage, Tell Bi’a is representative of Bronze Age administrative centers across northern Syria. A number of Bronze Age sites comparable to Tell Bi’a in terms of size and relative importance (that is, major royal capitals and administrative centers) are found within the areas that experienced the heaviest wartime looting. The analysis of excavated objects from this site as well as satellite imagery showing evidence of large-scale industrial looting can inform future analysis of these other sites, which have either been already looted or are at risk of being looted.
STUDY DESIGN
We developed an original framework using standard machine-learning tools to identify site-level market values that can form the foundation of a more comprehensive analysis of region-wide market values. Our premise was that revenues from the trade in looted artifacts are best estimated not by scaling up from disparate anecdotal stories about a single object—a common practice in media stories and some scholarly publications—but, rather, via full-site data aggregation and hedonic analysis of object characteristics. Based on our dataset, we would expect that site-level estimation would yield a more representative range of prices than that found in auction-only studies. If this is the case, then the overall expectation is that one-off high-value artifact sales are overrepresented in crude estimates. This does indeed appear to be true in our data; as discussed further below, objects valued over $1 million account for only 0.05 percent of the objects but 16 percent of the market value. One item, the famed and record-breaking Guennol Lionness, accounts for 3.4 percent of the market on its own. In fact, the majority of objects recovered from sites comprise mundane objects with modest market values,Footnote 27 and our itemized dataset contains a greater proportion of such objects than does any previous sample.
To account for this observed distribution of objects and prices, any price-prediction algorithm needs to address outsize influence of extremely valuable, but extremely rare, objects. Our analytical approach does so by using a large number of descriptive variables that optimize the fit for the vast majority of objects while sacrificing a perfect fit in the uppermost and lowermost tails. The conceptual approach differs from some previous studies of the illicit artifact trade; rather than treat a given artifact as a singular actor in the antiquities trade, we atomize the artifacts in our data set into five characteristics: time period, type, size, composite materials, and geographic origin. Breaking down artifacts based on observable characteristics is common practice in any art market, at a minimum as a way of appraising objects to calculate reserve and asking prices. It is also common practice in economic studies of the art market, which use hedonic regressions to analyze the importance of different characteristics in determining price.Footnote 28 Similarly, archaeologists classify artifacts according to period, object type, physical dimensions, composite materials, find spot, and other characteristics depending on the researcher’s needs. But while specialists in the trade and in archaeology routinely sort by sub-characteristics, studies of the antiquities trade have not done this in any systematic statistical fashion. Our database integrates both archaeological data and market data, and, as a result, we are able to apply statistical methods to the antiquities trade in a way not previously possible. We have found that hedonic pricing techniques sustain more robust calculations of valuations both within object categories and across types.
Our prediction algorithms rely on tree-based machine-learning methods, which improve on standard hedonic regression techniques by finding the optimal set of interactions between our large numbers of descriptive variables. We use two different algorithms: random forests and Bayesian additive regression trees (BART).Footnote 29 Both algorithms are discussed in more detail in Appendix 1. As part of the price prediction algorithm, we introduce a novel innovation to the standard hedonic pricing approach by simulating a firm/lot size combination for each item, using predictions based on observable characteristics. This method accounts for important, but as-yet-overlooked, aspects of market structure and segmentation. As a result of this algorithmic approach, we can supplement our market valuation estimates with sub-analyses of specific object types, allowing us to address questions about time to market, market segmentation between firms, final sale context, and aggregate values of small finds.
Market Segmentation
Before calculating site-level valuations, our variables provided enough information to predict where and how an object will be sold, and we identified some surprising aspects of market composition. Table 1 and Figures 1 and 2 highlight certain salient aspects of market segmentation. These and other market characteristics highlighted here inform the way in which we performed the valuation calculations.
Object size is another characteristic by which our market data offer new insights. Using the 41,587 market data observations, Figure 3 shows the total market value by object size (measured as the object’s largest dimension). Previous studies of the art market find that size is an important predictor for price: conditional on other characteristics, people tend to pay more for larger objects.Footnote 30 The mean object size in the raw data is 15 centimeters, with a median of 10.2 centimeters. But Figure 3 shows that objects in the range of 5–10 centimeters have the largest market share, with objects under 30 centimeters (roughly one foot) accounting for 88 percent of the objects and 71 percent of the market value. This finding is consistent with previous studies that demonstrate that the most ubiquitous items are small enough to be carried in a looter’s pocket; our data add to this picture by showing that the market value is due to sheer numbers, not to value. For example, objects under 30 centimeters are priced at about 20 percent less than the average for the whole sample and 82 percent less than objects over 30 centimeters.
Market data by size. The histogram shows the aggregate market value of all items in the market database, grouped by largest dimension in five-centimeter increments.

As for price, the data show that despite vast amounts of heterogeneity in objects’ idiosyncratic characteristics, 95 percent of them have pre-sale estimates below $32,000 (see Figure 1). In fact, only 0.05 percent of objects have estimates above $1 million. This reveals a market that is more homogeneous than might be inferred from news reports, a reassuring fact given that our set of covariates simply cannot account for every possible characteristic of each object.
Overall, the market and archaeological data together demonstrate that the market is replete with small objects with no discernible aesthetic or historic assets for collectors—for instance, incomplete and corroded pieces of metalwork, including scale armor and other pieces of military equipment. Despite this fact, the artifacts are collected by individuals, and, therefore, it is critical to consider them. Small finds such as these also have clear advantages. They are easy to smuggle; what is more, our analysis predicts that those objects that are not worth much money will likely be aggregated into large lots to achieve a high total price. These ubiquitous objects, however, have been largely overlooked by policymakers and the press, for whom unique, monumental, and very expensive artifacts are the chief concern. Our analysis reaffirms the observation made by David Ilan, Uzi Dahari, and Gideon Avni nearly 30 years ago: small finds are the engine drivers of the antiquities black market.Footnote 31
Site-Level Estimates
Aggregating over the simulated sales outcomes based on a BART model calibrated with the market data, the mean value of the objects excavated at Dura Europos is $18,088,000 with a 95 percent confidence interval of $17,445,000 to $18,765,000. At Tell Bi’a, the estimate is $4,064,000 with a 95 percent confidence interval of $3,883,000 to $4,268,000. What accounts for the difference between sites? Dura Europos is larger (72 hectares versus 52 hectares at Tell Bi’a), and a higher percentage of the site was excavated (approximately 40 percent versus less than 10 percent at Tell Bi’a) and, as a result, yielded more artifacts, as reflected in our data set, which includes 11,566 artifacts from Dura Europos versus 2,594 from Tell Bi’a. In addition, Dura Europos was excavated in the 1920s and 1930s, at a time when archaeology prioritized the recovery of artifacts over the recording of complete stratigraphic information, while Tell Bi’a was excavated some 60 years later, when excavation techniques had developed considerably. This has implications for how much of the site was excavated and the number of artifacts recovered. At Tell Bi’a, by contrast, the excavation work proceeded with slow, careful recording of stratigraphic layers. This systematic method also explains why we have more detailed documentation of the site. Finally, Dura Europos and Tell Bi’a were occupied 1,200 years apart and served different political and civic purposes; Dura Europos being a Roman garrison and Tell Bi’a being a regional administrative center. As such, they present different artifact profiles, which are of interest to different types of collectors.
How do we know whether these estimates are valid? Validating the model fit on out-of-sample market data provides support for the primary assumption underlying our methodology—namely, that the extrapolated prices for excavated objects are valid, insofar as the excavated objects share the same characteristics as items on the market, and that the unexcavated areas contain similar materials if extrapolating out to the whole site. It is possible that our excavated sample contains unique items that, were they to come to market, would be sold at high enough prices to dwarf our estimates. However, even if this were true for a handful of items, our estimates would still reflect the value of the vast majority of objects. Again, the market data provides a benchmark. Figure 3 shows that small objects comprise most of the market value; Figure 4 shows this is also predicted to be true for the excavated objects. At Dura Europos and Tell Bi’a, respectively, 50 percent of the predicted market value is attributed to objects under 13 centimeters and 7 centimeters, and upwards of 80 percent for objects under 30 centimeters.
Predicted market value of excavation data, by size. The histograms show the predicted aggregate market value of all items from Dura Europos (left) and Tel Bi’a (right), grouped by largest dimension in five-centimeter increments.
In addition, the market segmentation discussed above allows us to verify that the algorithm makes realistic predictions regarding the “where and how” of hypothetical market sales for excavated items. If antiquities were randomly dispersed and sold in random combinations, then these variables would have no predictive power in determining price. Table 1 implies that the sales venue and lot sizes are not random. Our hedonic pricing model (Step 2 in Appendix 1) tests whether this is true by using the market dataset to calibrate a prediction algorithm. The algorithm then calculates the probability that a given excavated object sells at a given firm in a lot of a given size. Figure 5 shows the results of this prediction: each line corresponds to an object in the archaeological dataset, with color indicating the estimated average price of the object across all possible venue/lot size combinations. The height of the line varies to describe the probability that the object sells at a given firm or in a given lot size. The dark black lines show what the probabilities would be if an object were to sell randomly according to the empirical distribution of objects in the market dataset.
Predicting sales venue, lot size, and price. Each line represents an object in the market database. Line height corresponds to the probability the object is sold at a given venue or in a given lot size. Venues indicate the top three auction houses individually, other auction houses collectively, and private dealers. Line color indicates average expected price, accounting for the predicted distribution of all venue/lot size combinations. For clarity, scale is nonlinear and the most expensive 1 percent of items were dropped from the figure.
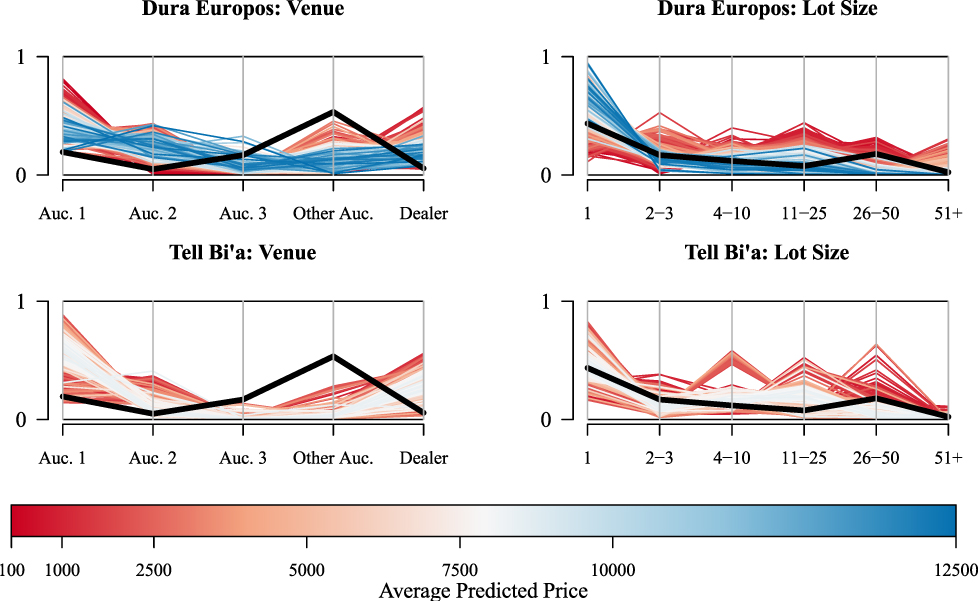
Figure 5 reveals two main points. First, Dura Europos contained the majority of higher-value items (that is, those valued in thousands of dollars rather than hundreds). Second, items are not distributed randomly according to the distribution of items in the market as a whole (if they were, all of the lines would overlap with the dark black lines). Instead, each item is more likely to sell in some contexts than in others. In particular, most items are more likely to sell at two particular top-tier auction houses or at a private dealer rather than at the other auction houses. Thus, some sellers specialize in the types of Near Eastern objects found at Dura Europos and Tell Bi’a, relative to the rest of the market. In addition, items with a high estimated value are also more likely to be sold alone or in small lots, while those with low estimated value are more likely to sell in medium- to large-sized lots, relative to the market as a whole. This reflects the convention of grouping low-value objects into large lots and selling them for a single combined price.
The predictions plotted by Figure 5 are based only on the observed characteristics of each item—in other words, those characteristics that are known at the time of excavation. Yet the figure implies that firm and lot size not only segment the market based on these characteristics but also correlate with price. Overall, Figure 5 yields lessons for future research: different items have different predicted propensities to wind up in different sale contexts, and the determinants of the final point of sale must be considered as an important factor in reconstructing looting networks and supply chains.
In emphasizing lower-valued objects that make up the majority of market value, our approach is supported by a growing literature that emphasizes small finds and homogeneous objects as the focus of scholarly inquiry. To further validate our method, other machine-learning algorithms could be used, and alternative assumptions could be made. We found that the estimates were robust to alternative sets of descriptive variables used in the hedonic pricing algorithm—for instance, when using a coarser set of variables that ignored detailed descriptions of objects’ shape, details, and surface designs.
DISCUSSION AND FUTURE DIRECTIONS
The above figures are our estimates of what the corpus of recorded, excavated artifacts from Dura Europos and Tell Bi’a would fetch on the market in 2016 dollars. To calculate the market value of looted objects from these sites, we are limited to parsimonious calculations. Nobody knows exactly what has been unearthed from looters’ pits. At Dura Europos, for example, Yale University excavated about 40 percent of the city and took about half of its excavated artifacts, giving the remaining share to museums in Damascus and Paris. When the Yale team arrived in the 1930s, there were already reports of looting at the necropolis.Footnote 32 Looting continued in the 1980s and 1990s; according to satellite data, the area within the city walls was hit hardest at this time. Clearly, any calculation of what may have been earned during the current conflict must account for this record of looting.
Our out-of-sample estimates are not, on their own, sufficient to make determinations about illicit monetary flows to market actors or non-state groups. They should be seen as an important first step. To undertake the next step, additional information is necessary: first, which areas were looted in which time periods and, second, the payment structure between looters and secondary market makers.Footnote 33 To take the first point, Dura Europos had a long history of looting prior to the outbreak of the Syrian conflict in 2011.Footnote 34 Second, the final price does not equal what the looters or their controlling middlemen will have pocketed. Prior work on the illicit artifacts market suggests that looters and middlemen pocket only a fraction of the final price. In one study, Neil Brodie found that looters earned between 0.7 percent and 1.4 percent of the final price.Footnote 35 Building on Brodie’s discussion, our data and analysis allow for further understanding of black market cash flows.
Other studies have established farm gate prices that can be compared with categories of objects in our database. In her study of southern Iraqi sites in 2007, Joanne Farchakh-Bajjaly found that “a cylinder seal or a cuneiform tablet earns $50” for a looter.Footnote 36 Based on our data, this equals 2–7 percent of the average and median prices, respectively, of all cylinder seals. From interviews with looters in northern Jordan, Jerome Rose and Delores Burke found that they are paid $15 per Roman or Byzantine bracelet, which we calculate as only 0.2–0.3 percent of the final market price.Footnote 37 (In the case of ISIS, it was widely reported that the regime extracts a cut of the projected market price on the order of 20–50 percent.Footnote 38) Additionally, there is currently insufficient evidence for differential cuts of profit among different participants in the trading network. Our analysis is a key step towards a more complete understanding of the cash flow structure.
The site-level market value estimate represents a significant advancement in the study of the circulation of archaeological artifacts in the international antiquities market. In one sense, our model is a mathematical relationship that can be used to predict prices. Policymakers and international non-governmental organizations have struggled to estimate market values, in part because they lack reliable data and robust models. Our empirical approach and model offer a solution to the problem of reliability and robustness. Moreover, the model itself has several possible functions. The first concerns the market for antiquities. Addressing the immediate problem of how to study the economic effects of archaeological looting when the details of the practice are not directly observable, we combined publicly available market and excavation data and applied tried-and-tested economic tools in a novel way. We demonstrated that it is possible to improve on previous research, which was generally object focused and had little to no explanatory power for site- or even region-wide looting observations.
To this end, our results reveal three important features of the trade in looted antiquities. First, we have added substantive findings to the emergent work on the trade in small finds. Small, commonplace, and mundane artifacts receive relatively little attention from scholars and policymakers concerned with archaeological looting, and, yet, they are massively present at auction, and their modest prices add up to a sizeable market.Footnote 39 Second, we have isolated the characteristics that make certain antiquities more desirable on the market. Objects from the Greek and Roman periods are in high demand, as are pieces made of gold, bronze, or glass and figurines. Prior to our analysis, experts suspected that these objects were favored on the market; we verify this suspicion statistically and provide clear categorical distinctions. Finally, systematic comparison between items on the market with the excavated artifacts from two sites has taught us that nearly every item, no matter how small, can find a buyer and that market participants may be dividing up significant numbers of marketable objects from just a single site. Continued refinement and application of our model will undoubtedly teach us much more about the function of archaeological sites in the global antiquities trade.
More broadly, our model offers a powerful way of thinking about excavation and market data. The site model can be used as a component of larger modeling systems for country-level or global-region political economy topics. We see our model as a first step toward a much larger research agenda, one extending into the economic development and resource conflict literatures.Footnote 40 Scholars have had little to say about artifacts as a contested, non-renewable resource, in part because artifacts’ macroeconomic indicators are poorly understood. The site-level market model offers more analytical flexibility than gross domestic product or other nation-level indicators of resource revenue. It is too early to say whether artifact deposits are a “curse” or a “blessing” for a country or whether they are correlated with the duration of civil wars.Footnote 41 What we can say is that archaeological sites present non-incidental market values as well as opportunities for looters and smugglers to participate in heterogeneous streams of illicit goods. Moreover, the model can support the work of scholars and cultural resource managers concerned about protecting archaeological sites from exploitation and damage—whether from looting, agriculture, industrialization, or climate change. The ability to quantify cultural and scientific loss presents a building block toward clearer policy objectives. The outcome of such analysis does not have to be market value; our model allows for robust predictions of object quantities and types. Archaeological artifacts can no longer be thought of as ancillary goods in global development and conflict. Machine-learning methods using systematic data have the potential to open a new horizon of analysis of the social, scientific, and market costs of looting.
APPENDIX 1
In this appendix, we explicate the steps for estimating the market value (in 2016 US dollars) of artifacts already excavated and recorded. The core of the method is a random-tree machine-learning version of the hedonic pricing techniques commonly used by economists to characterize auction prices and bidder behavior.
Step 1: Data Dictionary/Data Preparation
The nature of the antiquities trade presents two idiosyncrasies when trying to make different sources of data commensurable. The first idiosyncrasy is that multiple objects are often sold together in one “lot.” The second is that different sellers use different conventions to describe similar objects. To deal with the former problem, we used information on the numbers and details of objects sold together. In cases where multiple objects are sold together, we generated a separate observation for each object and divide the total price by the number of objects. We omitted cases where the number of objects in a lot could not be determined.
To handle the second problem, we generated a standardized corpus of descriptive terms and recoded objects’ descriptions based on this corpus. This is particularly important for price imputation; objects must be deemed “comparable” by some objective standards, while sellers maintain heterogeneous conventions for describing objects. We cannot be sure how any excavated object will eventually be described, if it is publicly sold at all; hence, we collapsed the hundreds of unique object descriptors into a set of 320 words indicating cultures, physical material, time period, and other descriptors. From this standardized corpus, each object could be described along the five main dimensions: size, time period, culture or geographic region, physical material, and type. The particular words in the corpus and the recoding strategy form part of our methodological contribution. The Data Dictionary in the supplementary materials file provides complete directions for constructing the standardized descriptive variables.
Step 2: Calibration
Next, we used a tree-based machine-learning approach to generate a predictive model of price. Tree-based classifiers are a natural choice because most of our variables are binary, which lend themselves nicely to categorization into sets of objects with the same combinations of characteristics and because we expect the optimal prediction model to have a hierarchical structure since certain characteristics will be relevant determinants of price only when other characteristics are present.Footnote 42
To leverage these characteristics of the data, we used random forests and BART to develop prediction models without imposing assumptions regarding which variables are important. Of the full market dataset, 12,154 observations had missing information on size and/or date of origin. These missing values were imputed using random forests.Footnote 43 This and every subsequent implementation of random forests used 2,500 trees with 50 variables per node, although the results are not sensitive to parameter values above 1,000 trees and 30 variables per node.
Next, to aid in the prediction of where and how an excavated item will be sold, random forests calibrated a prediction of sales venue and lot size based on each object’s observable characteristics. For this purpose, the 33 firms were split into five groups: a separate group for each of the top three auction houses, one group comprising all other auction houses, and a group comprising private dealers. Lot sizes were split into six groups: 1 item, 2–3 items, 4–10 items, 11–25 items, 26–50 items, and 51 or more items. These classifications were developed to maximize the accuracy of the prediction algorithm while maintaining a reasonable number of categorical groups. Random forests were then used to predict the probability of being sold at each of the five venue categories, based on observable characteristics. Then, within each venue category, another random forest was calibrated to predict lot size.
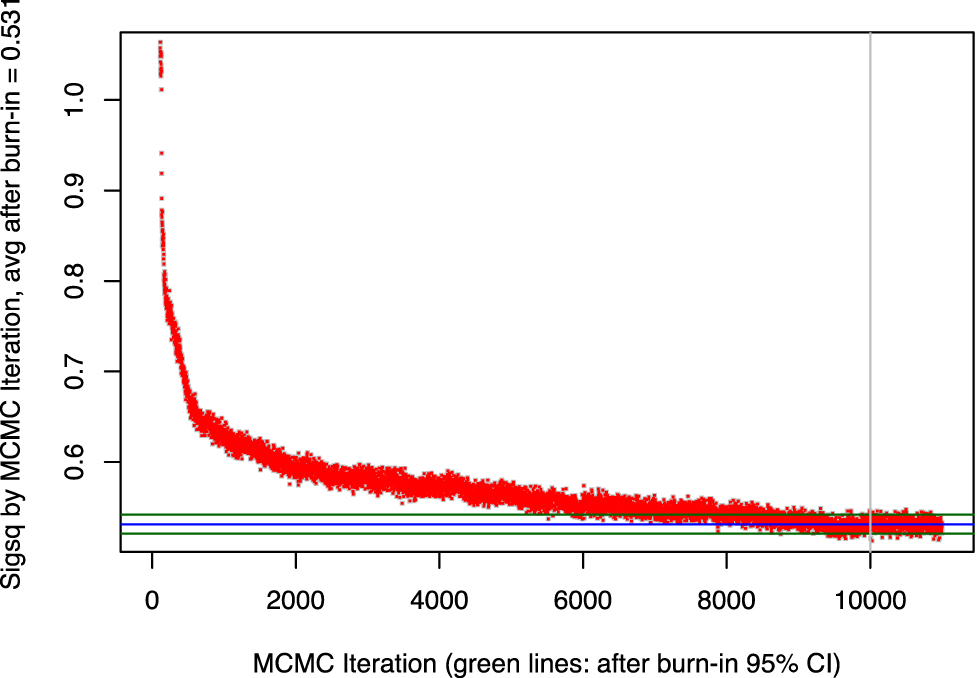
To calibrate the price prediction algorithm, we randomly split the data in half for training and testing, then used BART to predict price based on observable characteristics, venue, and lot size. The BART procedure slightly improves on random forests by using an iterative Bayesian backfitting Markov chain Monte Carlo algorithm to fit residuals.Footnote 44 Implementing the bartMachine package in R, we chose to burn in the BART process for 10,000 iterations and develop the predictive model in 1,000 additional iterations.Footnote 45 Figure 6 justifies these choices by showing that the BART errors converged to a stationary distribution after 10,000 trials. Overall, the BART procedure yielded out-of-sample pseudo-R-square values of 89.3 percent and fits 96.3 percent of the test data within 95 percent confidence bands (Figure 7).
BART convergence diagnostics. Sigma-square values for 11,000 iterations of the BART algorithm to predict log prices. Horizontal blue line represents the final average value of sigma-squared after the 10,000 burn-in iterations, and green lines show the 95 percent confidence interval.
Out-of-sample BART prediction intervals: prediction intervals for log prices of out-of-sample test data, using the calibrated BART model. Blue dots indicate objects that were fit within a 95 percent confidence interval; red Xs indicate objects that were not. Axes are on log scales.
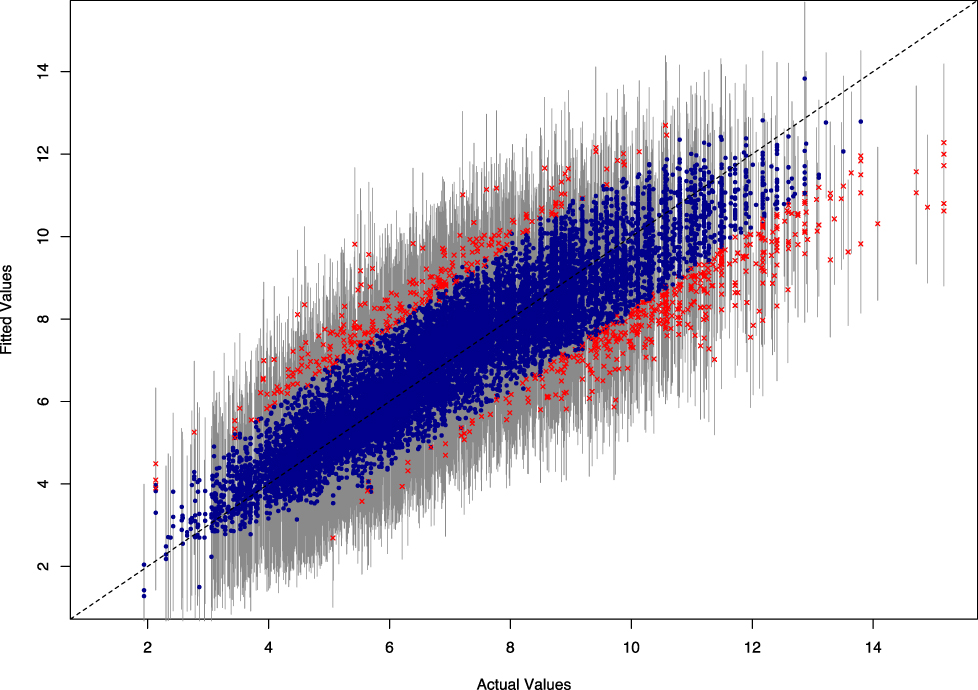
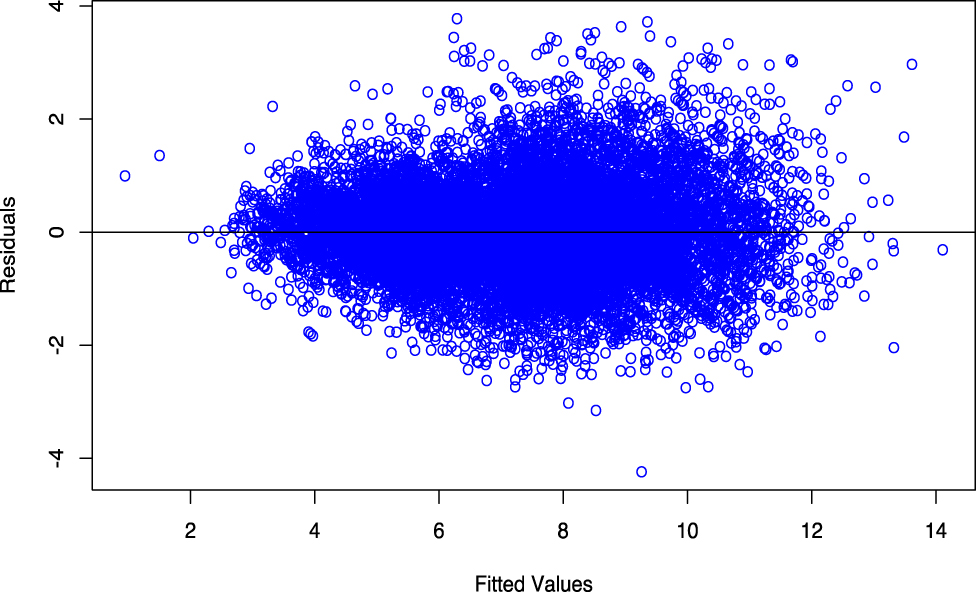
Both random forests and BART tend to underestimate the upper tail of the price distribution and overestimate the lower tail. This is to be expected since our descriptive variables cannot capture the idiosyncratic qualities that would set them apart, especially for high-value items. Similarly, the lowest-quality objects may have some sort of unique damage or may be otherwise unattractive or uncollectible in ways we cannot systematically record. Nevertheless, Figure 8 shows that even with these caveats the residuals are well behaved.
BART residuals: residual plot for log-price predictions from calibrated BART model.
Step 3: Imputation
For excavated items, sales venue and lot size must be predicted based on other observable characteristics. To account for the full distribution of possible sales outcomes, we ran Monte Carlo simulation of object sales separately for Dura Europos and Tell Bi’a. First, a venue/lot size combination was drawn for each excavated item using predicted probabilities from the random forest models calibrated in Step 2. Next, a final sale price was drawn from the posterior distribution of the conditional expected log price, using the BART model calibrated and tested on market data. The final output was the aggregate price of all objects; this procedure was iterated until the average aggregate price and the limits of the resulting 95 percent bootstrapped confidence interval all changed by less than 0.01 percent.
ACKNOWLEDGMENTS:
The authors thank L. Brody for arranging access to the Yale University Art Gallery data, and Z. Dreyfuss, M. Vincent, T. Watler, and T. Wolter for research assistance. For helpful questions and comments on the paper, we thank N. Brodie, P. Gerstenblith, M. Gibson, M. Kersel, S.D. Kominers, B. Magness-Gardiner, G. Marsh, S. Parcak, L. Rothfield, G. Stein, M. Stephens, and the journal’s anonymous peer reviewers. We are especially grateful to N. Judd and I. Hock for suggesting productive new methodological directions, and to participants in the Money, Markets, and Governance workshop in the Department of Sociology at the University of Chicago for perceptive comments and questions. Earlier versions of the paper were presented to audiences at the Neubauer Collegium, Department of Art History, and Oriental Institute at the University of Chicago; the Association for Public Policy and Management (APPAM); and the Annual Meeting of the American Institute for Conservation (AIC).
The project was supported by grants from the Antiquities Coalition, the Oriental Institute at the University of Chicago, and the University of Chicago Department of Art History.
Artifact data records, constructed for this project from excavation reports, are stored in the OCHRE database at the Oriental Institute of the University of Chicago (https://oi.uchicago.edu/research/ochre-data-service). Market data, the data dictionary, and supplementary files are available online at https://doi.org/10.1017/S0940739119000018.