


Although inconclusive, many studies support links between consumption of sugar-sweetened beverages and increases in energy intake, weight gain and obesity(Reference Bachman, Baranowski and Nicklas1–Reference Pereira3). The mechanism(s) underlying such links are unclear(Reference Bachman, Baranowski and Nicklas1, Reference Pereira3, Reference Anderson4), but it has been suggested that increased energy intake occurs because sugar-sweetened beverages induce comparatively low satiety and thus subsequent compensation in intake is less complete with than with solid foods(Reference Malik, Schulze and Hu2). However, the term ‘sugar-sweetened beverages’ comprises a wide range of products including sodas, fruit drinks and squashes and includes both carbonated and non-carbonated beverages. Some previous experimental studies that compared the effects of different beverages on satiety and intake have included both carbonated and non-carbonated beverages(Reference Holt, Sandona and Brand-Miller5–Reference DellaValle, Roe and Rolls7), but few previous studies have evaluated the potential effects of carbonation itself.
Conventionally, beverage carbonation is expressed as vol. CO2 per vol. liquid. The level of carbonation in commercial beverages varies from low (about 1 vol. CO2) in fruit drinks to medium (2–3 vol. CO2) in colas and alcohol-containing beverages to high (approximately 4·5 vol. CO2) in other drinks such as tonic water, which are consumed as mixers with alcoholic beverages(Reference Varnam and Sutherland8). Thus, the volume of dissolved CO2 may far exceed the volume of liquid. The fate of ingested dissolved CO2 is unclear. However, when 300 ml carbonated (2·5 vol. CO2) or still mineral water was consumed by women and men just after a solid–liquid meal, CO2 was liberated from the carbonated water in the stomach, where it led to increased distension and a greater retention of meal components during the postprandial lag phase(Reference Pouderoux, Friedman, Shirazi, Ringelstein and Keshavarzian9). Although there were no significant differences in the rate of total gastric emptying or in postprandial satiety, these results show that CO2 dissolved in beverages can impact on gastric function when consumed after a meal. In a study in which an electrolyte beverage with 0, 1·1, 2·3 or 3·0 vol. CO2 was provided to women and men for consumption ad libitum after exercise, intakes of the beverage decreased significantly and progressively as carbonation level increased from 1·1 to 3·0 vol.(Reference Passe, Horn and Murray10). Furthermore, when gas (air) was incorporated into a beverage preload, increasing the volume from 300 ml to 600 ml, satiety was increased and intakes at lunch 15 min later decreased significantly(Reference Rolls, Bell and Waugh11). Overall these results suggest that the release of dissolved CO2 from carbonated beverages in the stomach may influence satiety and subsequent intakes.
CO2 yields a weakly acid solution. A range of acids can decrease gastric emptying rate and the addition of acids to foodstuffs has been shown to increase satiety(Reference Hunt and Knox12–Reference Östman, Granfeldt, Persson and Björck14). Furthermore, a carbonated drink with high titratable acidity decreased food intakes when 473 ml portions were ingested 20 min before a meal(Reference Kwapong and Fedun-Jacklin15). Thus, in addition to potential effects of released CO2 on gastric volume and function, increased carbonation may influence satiety and intake by impacting on gastric acidity.
We hypothesized that the level of carbonation in a commercial soft beverage, consumed as a preload, would enhance satiety and decrease intakes in non-obese subjects and that this may be due to volume effects of liberated CO2 and/or to effects of CO2 on gastric pH. Men and women differ in eating behaviour(Reference Rolls, Fedoroff and Guthrie16) and there are reported gender differences in postprandial satiation and satiety responses(Reference Smeets, de Graaf, Stafleu, van Osch, Nievelstein and van der Grond17, Reference Mearadji, Penning, Vu, van der Schaar, van Petersen, Kamerling and Masclee18). Furthermore, although data are inconclusive, gastric emptying rates for both solids and liquids are generally found to be slower in women than in men(Reference Datz, Christian and Moore19–Reference Bennink, Peeters, Van den Maegdenbergh, Geypens, Rutgeerts, De Roo and Mortelmans22). Thus, potential gender differences were also assessed.
Experimental methods
Subjects
Healthy subjects (fifteen men, fifteen women) were recruited from the staff and student population at the University of Ulster. Inclusion criteria were: aged 20–40 years; BMI 20–29·9 kg/m2; non-smokers; liking for all the foods to be served in the study; no known food allergies or restrictions; not on a specific diet; not taking any medications known to affect appetite; for women, not taking oral contraceptives, regularly menstruating and not pregnant or lactating. At enrolment, subjects completed the Dutch Eating Behaviour Questionnaire(Reference van Strien, Frijters, Bergers and Defares23), which gives a measure of restrained, emotional and external eating, and weight and height were measured to calculate BMI. On each study day, women reported their current stage (week 1, 2, 3, 4) in the menstrual cycle. The study was approved by the Research Ethical Committee of the University of Ulster and all subjects gave written, informed consent.
Design and procedures
The present study used a randomized, within-subject cross-over design, with three beverage preload conditions. Subjects were randomly divided into six equal-sized groups counterbalanced for gender using a computerized numbered system and each group was randomly assigned to receive the three preloads in one of the six possible orders. Each group was studied on the same day of the week with 1-week intervals between cross-over. All meals were served in the metabolic suite of the university and the subjects were free to leave after each meal to continue normal activities.
The subjects were asked to fast from 22.00 hours the previous day and to refrain from strenuous activity on each study day. On arrival at 09.00 hours, compliance was confirmed and the subjects consumed the same standard breakfast, which provided 25 % estimated energy intakes that were calculated as 1·4 times estimated BMR(Reference Schofield24). Following this, subjects were instructed not to eat during the morning and to drink only non-carbonated water (2 × 500 ml bottles), which could be consumed ad libitum. At 12.00 hours, bottles were returned for assessing intakes and baseline visual analogue scales (VAS) were completed. Following this, beverage preloads (400 ml) were served in 100 ml portions at 2 min intervals and subjects were asked to drink each portion completely within the 2 min period. Subjects completed VAS after the final beverage portion and after a further 10 min, just before being served with a lunch meal to be consumed ad libitum.
Subjects completed VAS after the ad libitum lunch meal and at 45 min intervals for 225 min, until 16.30 hours, during which time they were instructed to consume only the non-carbonated water provided (2 × 500 ml). Preset timers were provided to remind the subjects to complete VAS. At 16.30 hours, bottles were returned for assessment of water intakes and subjects were given food diaries to complete (description of food or beverage, brand name if appropriate, estimated portions and leftovers) for the remainder of the day, during which they were permitted to eat and drink as they wished.
Preloads and meals
Breakfasts, which provided 25 % of each subject's estimated energy intake, consisted of ready-to-eat cereal with milk, toast with butter or margarine and preserve, served with coffee or tea (with milk and sugar if desired). Subjects made breakfast choices before the commencement of the study and the same breakfast, both in terms of foods and amounts, was consumed on each occasion.
The preloads were bottled beverages based on a commercial formulation and supplied by Maine Soft Drinks Ltd. (Ballymoney, UK), who were commissioned to produce beverages with three levels of carbonation: none; medium; high. On receipt, the CO2 contents of the beverages were measured (see later) and found to be 338, 494 and 728 mg CO2 per 100 ml, respectively, which are equivalent to 1·7, 2·5 and 3·7 vol. CO2 per vol. liquid, respectively. Although the level of CO2 at the lowest level was higher than expected, there was little effervescence when poured. The beverages are thus referred to as low, medium and high carbonation. Beverage ingredients were water, orange juice, sucrose, citric acid and ascorbic acid and each 400 ml preload provided 639 kJ energy, 0·4 g protein and 39·5 g carbohydrate (supplier's data). Beverages were supplied in 730 ml bottles and stored at 4°C until required. On each study day, the 100 ml portions of the beverages were poured, kept at 4°C and served within 10 min.
The complete two-course lunch meal for ad libitum consumption was provided on a tray. Subjects were instructed to eat until comfortably full. The first course was cottage pie, which consisted of lean minced beef, onion and carrot in gravy covered with mashed potato and topped with cheese, served hot. The cottage pie was made in bulk in a catering kitchen, according to a standardized recipe and served in 1200 g portions. The second course was canned peaches (200 g) and canned pears (200 g) served with a separate bowl of cream (100 g). The only beverage supplied was bottled non-carbonated water (2 × 500 ml; Ballygowan Ltd., Newcastle West, Ireland). The total energy and nutrient content of the meal, which was calculated using manufacturers' data where available or data from food tables(25), was 8944 kJ, 103·8 g protein, 135·2 g fat, 136·0 g carbohydrate and 12·1 g dietary fibre.
Visual analogue scale assessments
Satiety and hedonic and sensory factors were assessed using VAS by the pen and paper method(Reference Hill and Blundell26). Each scale consisted of a plain 100 mm horizontal line preceded by a question and with anchors at each end. Subjects were asked to put a single vertical mark at the appropriate point to describe their feelings. The questions and left and right anchors were: ‘How hungry do you feel?’ (hunger), ‘not hungry at all’, ‘as hungry as I have ever felt’; ‘How full do you feel?’ (fullness), ‘not full at all’, ‘as full as I have ever felt’; ‘How strong is your desire to eat?’ (desire-to-eat), ‘very weak’, ‘very strong’; ‘How much food do you think you could eat?’ (prospective consumption), ‘nothing at all’, ‘a large amount’; ‘How thirsty are you?’ (thirst), ‘not thirsty at all’, ‘as thirsty as I have ever felt’; ‘How comfortable do you feel?’ (comfort), ‘not comfortable at all’, ‘as comfortable as I have ever felt’. Immediately after the preload, subjects also completed VAS with the questions and anchors: ‘What do you think about the total amount of the beverage you have just consumed?’ (size), ‘extremely small’, ‘extremely large’; ‘How effervescent (fizzy) was the beverage?’ (effervescence), ‘not effervescent at all’, ‘extremely effervescent’; ‘How sweet was the beverage?’ (sweetness), ‘not sweet at all’, ‘extremely sweet’; ‘How strong was the flavour of the beverage?’ (flavour), ‘not strong at all’, ‘extremely strong’; ‘Overall, how pleasant was the beverage?’ (pleasantness), ‘not at all pleasant’, ‘extremely pleasant’.
Intake assessments
After the ad libitum lunch meal, individual leftovers were weighed and intakes were calculated by difference. Data from the food diaries for the rest of the day were converted to weights using label information or from standard portion sizes(27). Energy, macronutrient and fibre intakes from the lunch meal consumed ad libitum and from the food diaries were calculated using a dietary analysis program (Wisp version 2.0; Tinuviel Software, Warrington, UK). The amount of water in food and drink was calculated from food table data(25) using Microsoft® Excel (version 2000; Microsoft Corporation).
Laboratory evaluations
Prior to all analyses, bottles were stored at 4°C, poured in the same way as the preload servings and analysed within 10 min. The CO2 contents of the beverages were measured in duplicate using the Association of Official Analytical Chemists method for wines(Reference Caputi and Walker28). Beverage pH was measured using a pH meter (Corning M20; Corning, Sudbury, UK). Buffering capacities were measured by monitoring pH changes, as duplicate 100 ml samples of the three beverages were titrated with 2m-HCl to pH 2 and with 2m-NaOH to pH 10.
Statistical analysis
Data were analysed using SAS version 8.0 (SAS Institute Inc., Cary, NC, USA). Analysis of variance was performed with a mixed effect model for a three period cross-over design, which compared the three conditions (low, medium and high carbonation)(Reference Jones and Kenward29). The model contained condition, gender, period and carry-over, a random subject effect and a random error. The fixed effects were condition, gender, period and carry-over. The condition effect refers to differences in the mean responses of the variables (VAS and timings, the weight of food and drink, and energy, macronutrient, fibre and water intakes) between the three conditions, while the period effect refers to differences in the mean responses due to systematic differences between the condition periods. Analysis showed that the effects of carry-over and period were non-significant. Thus, assuming no carry-over, an F ratio test was conducted for comparisons of significant effects of each variable between conditions(Reference Jones and Kenward29). To compare specific conditions, linear contrasts were used to examine differences between means. Although there were significant differences between gender, the gender by condition interactions were all non-significant. Results were considered significant at P < 0·05 and values are reported as means and standard deviations with ranges where appropriate.
Results
Subjects
All subjects completed the study and subject characteristics are presented in Table 1. From the Dutch Eating Behaviour Questionnaire(Reference van Strien, Frijters, Bergers and Defares23), subjects scored the following: for restrained eating 2·08 (sd 0·86) (1·00–3·78); emotional eating 1·98 (sd 0·67) (1·17–3·75); external eating, 3·29 (sd 0·68) (1·92–4·25). There are no accepted cut-off points for these factors but Green and Blundell considered that a score >3 indicated restrained eaters(Reference Green and Blundell30). Therefore, on this basis, four subjects scored >3 but < 4 for restrained eating. The reported weeks of the women's menstrual cycle, which were 2·50 (sd 1·05) (1–4), 2·35 (sd 1·18) (1–4) and 2·60 (sd 1·09) (1–4), respectively, for the low, medium and high carbonation conditions, were not significantly different. There were no significant differences in ad libitum water intake between meals.
(Mean values, ranges and standard deviations)
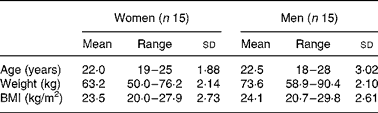
* For details of subjects and procedures, see Experimental methods.
Hedonic and sensory ratings of the preloads
All subjects completely consumed the preloads. The three beverages did not differ significantly in reported sweetness, flavour or pleasantness and there were no significant differences between women and men for these sensory and hedonic responses (Table 2). Overall, there were no significant differences between the three beverages for size ratings. However, compared with the men, the women rated the beverages to be significantly larger. There were significant differences between the three beverages in reported effervescence, which increased from low, to medium, to high carbonation. Overall, the men found the beverages to be significantly more effervescent than the women (Table 2).
(Mean values and standard deviations)
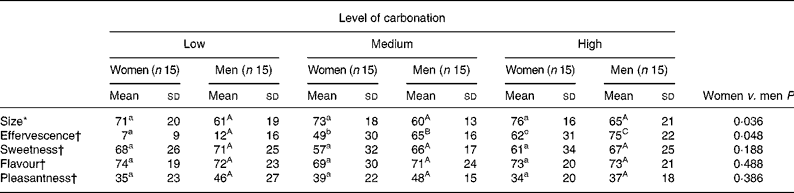
a, b, c, A, B, C Mean values within a row with unlike superscripts were significantly different (P < 0·05); lower case for women; upper case for men (F ratio test).
* Anchors for size were: on the left (0) ‘extremely small’; on the right (100) ‘extremely large’.
† Anchors for effervescence, sweetness, flavour and pleasantness were: on the left (0) ‘not ___ at all’; on the right (100) ‘extremely ___’.
‡ For details of subjects and procedures, see Experimental methods.
Satiety, thirst and comfort ratings
Compared with baseline, consumption of the preloads led to significant changes in perceived hunger, fullness, desire-to-eat and thirst in the period before the lunch for both men and women (Figs. 1 and 2). There were significant differences between preloads and the medium and high carbonation preloads led to consistently and significantly lower hunger and desire-to-eat scores, and higher fullness scores, than the low carbonation preload. There were no significant differences between preloads for thirst ratings (Figs. 1 and 2). Ratings of prospective consumption followed the same pattern as desire-to-eat, and comfort ratings did not differ significantly from baseline or between preloads (data not shown). There were no significant differences between the three beverages for ratings of hunger, fullness, desire-to-eat, prospective consumption, comfort or thirst from after the ad libitum lunch meal for 225 min (data not shown).
Mean visual analogue scale ratings of (a) hunger, (b) fullness, (c) desire-to-eat and (d) thirst from before the carbonated beverage preload until 18 min post consumption for women (n 15). ○, low carbonation; □, medium carbonation; △, high carbonation; AP, after preload; BL, before lunch. * Significantly different from baseline (P < 0·05; F ratio tests). † Significantly different from low carbonation (P < 0·05; F ratio tests). For details of subjects and procedures, see Experimental methods.

Mean visual analogue scale ratings of (a) hunger, (b) fullness, (c) desire-to-eat and (d) thirst from before the carbonated beverage preload until 18 min post consumption for men (n 15). ○, low carbonation; □, medium carbonation; △, high carbonation; AP, after preload; BL, before lunch. * Significantly different from baseline (P < 0·05; F ratio tests). † Significantly different from low carbonation (P < 0·05; F ratio tests). For details of subjects and procedures, see Experimental methods.

Intakes at lunch and for the rest of the day
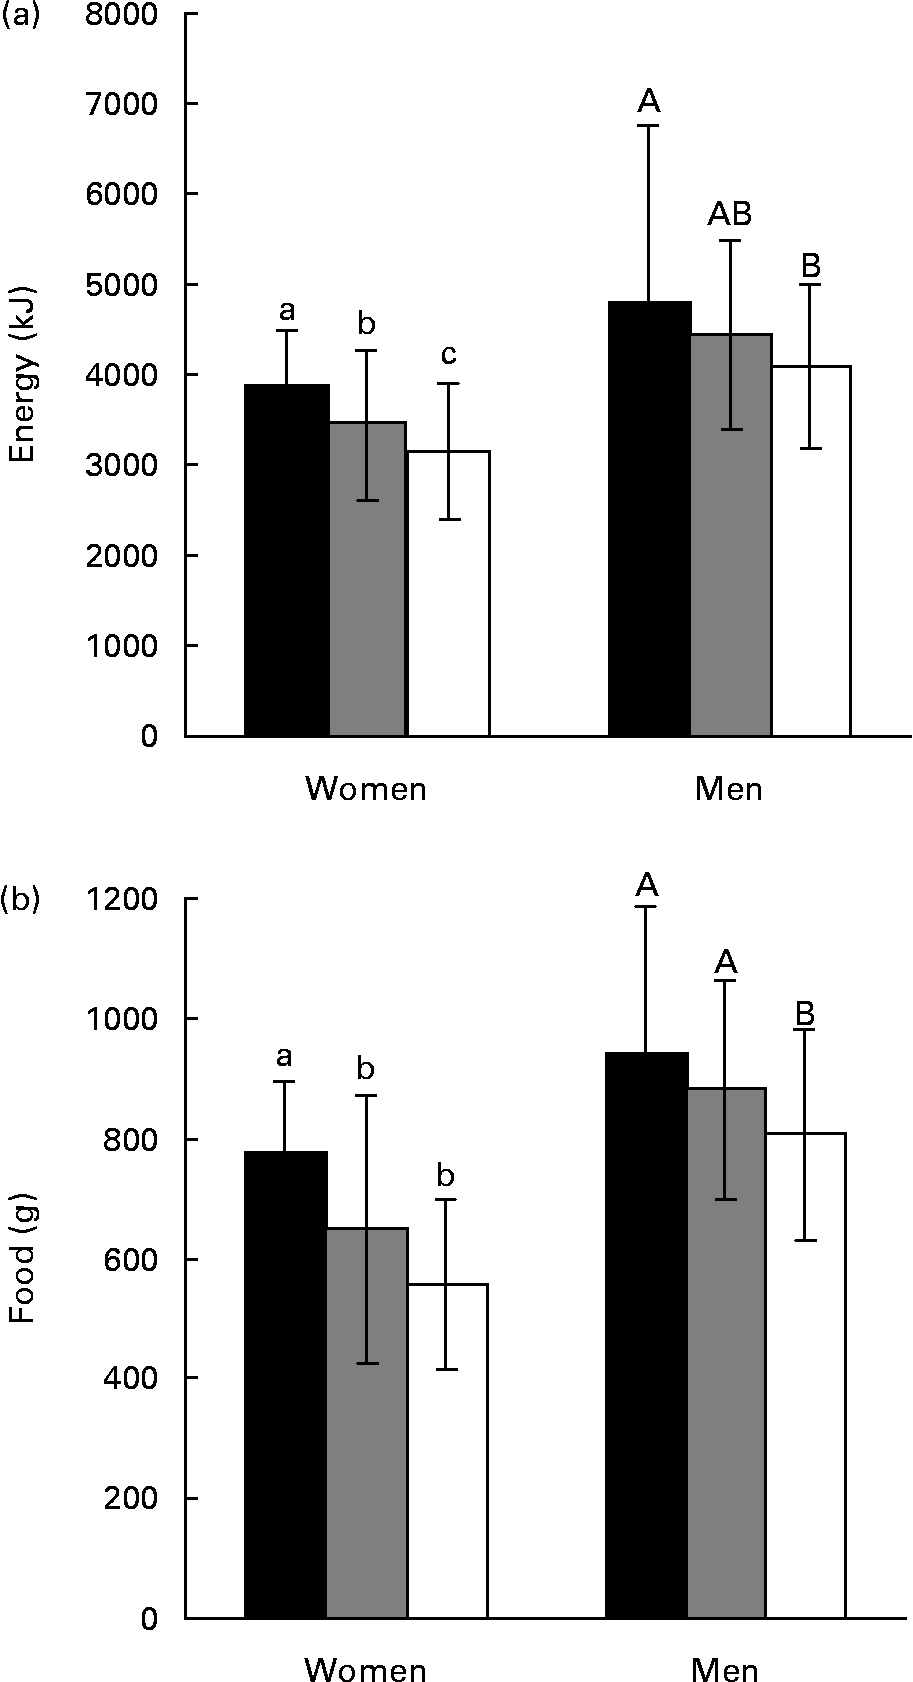
No subjects completely consumed either course of the ad libitum lunch meal. Overall, there were significant differences between preload carbonation level (P = 0·027) and between women and men (P = 0·039) for intakes of total energy and weight of food at the ad libitum lunch. Furthermore, intakes of total energy and weight of food decreased consistently with increasing level of carbonation for both women and men (Fig. 3). Compared with the low carbonation preload, energy intakes following the high carbonation preload were 739 kJ (19 %) lower in women and 710 kJ (15 %) lower in men, and food intakes were lower by 221 g (28 %) in women and 131 g (14 %) in men. There were similar, significant differences between preload carbonation levels and between women and men for intakes of carbohydrate, fat and protein (weight and as % energy), weight of water and weight of fibre (data not shown). There were no significant differences between men and women or beverage preload condition for intakes of beverages (non-carbonated water) at lunch, or between beverage preload condition for reported intakes for the rest of the day (data not shown).
Intakes of energy and weight of food at a lunch consumed ad libitum, 10 min after a beverage preload with low (■), medium ( ) or high (□) carbonation. Values are means and standard deviations. Columns not sharing a common superscript letter are significantly different (P < 0·05; F ratio tests); lower case for women; upper case for men. For details of subjects and procedures, see Experimental methods.
Laboratory evaluations
The pH values for the beverages with low, medium and high carbonation were 3·37, 3·30 and 3·25, respectively. The titration curves were very similar and 100 ml aliquots of the beverages with low, medium and high carbonation required, respectively, 205, 201 and 181 mmol HCl to bring to pH 2, and 84, 83 and 84 mmol NaOH to bring to pH 10.
Discussion
Compared with the beverage with low carbonation, consumption of the beverages with medium and high carbonation led to significantly higher satiety up to the lunch meal 10 min later, when intakes of food and energy were significantly lower. Overall, satiety ratings increased consistently as carbonation increased from low (1·7 vol.), to medium (2·5 vol.), to high (3·7 vol.) and intakes at the lunch meal consumed ad libitum decreased from high, to medium, to low carbonation. Although this is the first study to report effects of dissolved CO2 on short-term satiety and intakes, a previous study with women and men showed that intakes of a carbonated electrolyte beverage, consumed ad libitum following exercise, decreased significantly and progressively as carbonation increased from 1·1 to 3·0 vol.(Reference Passe, Horn and Murray10). No gender differences were reported. Other workers, who compared the effects of carbonated (2·5 vol.) or still water on satiety and gastric function in women and men, found that satiety was not significantly affected and that gender had no significant effects on gastric emptying, but that carbonated water increased digesta retention in the proximal stomach(Reference Pouderoux, Friedman, Shirazi, Ringelstein and Keshavarzian9). In the latter study, the water was drunk shortly after a solid and liquid meal and thus the results are not directly comparable with the present study or to previous reports, which have shown that the rate of gastric emptying of solids and liquids is slower in women than men(Reference Datz, Christian and Moore19–Reference Bennink, Peeters, Van den Maegdenbergh, Geypens, Rutgeerts, De Roo and Mortelmans22). However, taken together, the results from the present study and the two previous studies(Reference Pouderoux, Friedman, Shirazi, Ringelstein and Keshavarzian9, Reference Passe, Horn and Murray10) suggest that carbonated water can impact on gastric function and increase satiety and that this may be due to increased gastric distension resulting from the liberation of CO2 in the stomach.
Furthermore, these results indicate that CO2 dissolved in beverages can exert effects on satiety and intake similar to that found for gas (air) incorporated into beverages(Reference Rolls, Bell and Waugh11). In the latter study, beverage preload volume was increased from 300 ml to 600 ml by the incorporation of air. In the present study, the 400 ml beverages with low, medium and high carbonation contained about 680, 1000 and 1480 ml dissolved CO2, respectively. The beverages were consumed under conditions similar to those used for analysis and thus these volumes of dissolved CO2 were imbibed. Although we do not know the amounts of CO2 lost due to effervescence in the mouth before swallowing or subsequently by eructation, the results suggest that a substantial proportion of CO2 reached the stomach and persisted there.
The only sensory or hedonic factor that differed significantly between the beverages was effervescence and this reflected the levels of CO2 present, with subjects rating effervescence very low for the beverage with low carbonation. This indicates that, despite the substantial level of CO2 in the beverage with low carbonation, it was relatively flat. Comfort ratings did not differ significantly from baseline or between beverages, suggesting that the differences in pre-lunch satiety and lunch intakes cannot be attributed to bloating or nausea. Furthermore, the responses to the three beverages for sweetness, flavour, size, pleasantness and thirst were not significantly different, indicating that these factors did not play a role in the observed effects on satiety and intake.
Previous sensory studies that evaluated the effects of carbonation level on sweetness and flavour have yielded conflicting results. Two studies with model sucrose-based systems found that the level of carbonation had no significant effects on perceived sweetness(Reference Cometto-Muniz, Garcia-Medina, Calvino and Noriega31, Reference Yau and McDaniel32), while a third study, which combined sucrose and other basic taste stimuli, found that carbonation decreased sweetness perception but had little effect on overall taste intensities(Reference Cowart33). In these three previous studies the test beverages were expectorated after tasting. However, in a further study where beverages comprising sucrose, glucose, electrolytes and flavours were consumed ad libitum, sweetness and overall flavour decreased as carbonation level increased(Reference Passe, Horn and Murray10). Thus, it appears that the relationship between sensory attributes and carbonation is complex and may vary depending on beverage formulation and testing conditions.
Some previous studies that have compared the effects of a range of carbonated and non-carbonated beverages on satiety and subsequent intakes have also assessed effects on thirst. One study showed significantly lower thirst ratings for women following sparkling water or orange juice, compared with regular cola, but there were no significant differences for men(Reference Almiron-Roig and Drewnowski6). A further study with women found that thirst ratings were significantly lower following diet cola compared with orange juice or milk(Reference DellaValle, Roe and Rolls7). However, in both studies the beverages were consumed with meals and differed in sensory and nutrient characteristics and these factors may have influenced responses. The absence of significant differences in effects on thirst between men and women or between beverage carbonation levels in the present study indicates that, under the conditions tested, level of carbonation had no effects on the ability of beverages to quench thirst.
Increased acidity in foods and beverages has been linked to delayed gastric emptying and to increased satiety(Reference Hunt and Knox12–Reference Kwapong and Fedun-Jacklin15, Reference Lin, Doty, Reed and Meyer34). However, CO2 produces a very weak acid in solution and the differences in acidity between the beverages in the present study were very small in comparison with the differences tested in previous studies(Reference Hunt and Knox12–Reference Kwapong and Fedun-Jacklin15, Reference Lin, Doty, Reed and Meyer34). This further suggests that the effects observed are attributable primarily to the impact of liberated CO2 on gastric distension.
Although the preload design used here does not reflect usual eating patterns, the 400 ml beverages are within the range of regular portion sizes for carbonated beverages in the UK (330–500 ml) and USA (355–496 ml; 12–16 fluid ounces)(27, 35). Thus, the short-term effects observed may be of practical relevance to some eating occasions. Furthermore, it is interesting to note that the differences in lunch energy intakes between the beverages with low and high carbonation, which were 739 kJ and 710 kJ for men and women, respectively, were similar to the energy provided by the beverage preload (639 kJ). This indicates that the effects of higher carbonation may compensate for the energy provided by a beverage preload. Overall, this suggests that it may be appropriate to discriminate between carbonation levels when assessing the potential associations between the consumption of sugar-sweetened beverages and energy intake, weight gain and obesity. However, further work is required to assess whether these effects persist when the time interval between the beverage and the next meal is extended and to compare the effects of dissolved CO2 with those of energy-yielding ingredients such as sugars, which are major components of many carbonated beverages.
Acknowledgements
This study was funded by a postgraduate award from the Department of Employment and Learning, Northern Ireland (S. A. M.) and by the Northern Ireland Centre for Food and Health, University of Ulster. There were no personal or financial conflicts of interest. A preliminary report of the study was given at the meeting of The Nutrition Society, Dublin, July 2004 (Proc Nutr Soc 63, 84A).



