

In 2020, women, particularly Democratic women, ran for and won elected office at higher rates than ever before. Over 600 women filed to run for a seat in the U.S. Congress, and the 117th Congress (2021–22) featured at least 141 female members, breaking the previous record of 127 set in 2019. Burrell (Reference Burrell2014, 249) argues that the “gendered nature of campaigns . . . has declined to near invisibility” (see also Brooks Reference Brooks2013; Dolan Reference Dolan2014; Hayes and Lawless Reference Hayes and Lawless2016). However, female candidates continue to perceive that they face an unequal road to elected office, perceptions that influence the decisions they make, both as candidates and as officeholders. For example, discussing the issue of raising campaign funds, Congresswoman Rashida Tlaib explained, “Women work it. We work twice as hard. At some point that may change, but we have to work twice as hard” (Zernike Reference Zernike2018). Congresswoman Tlaib's comments reflect an important puzzle: even as more and more women run for and gain elected office, are their career trajectories still influenced by the reality, or even just the perception, that persistent structural impediments disproportionally affect women?
In this article, we identify some of the most important impediments and explore the effects they might have on the careers of female politicians. First, we discuss several factors that may deter many women from running for office: women are more likely than men to feel that family commitments prevent them from devoting themselves to politics full-time (Burns, Schlozman, and Verba Reference Burns, Schlozman and Verba2001); women often have lower levels of self-confidence (Fox and Lawless Reference Fox and Lawless2011) and are more risk averse (Kanthak and Woon Reference Kanthak and Woon2015), and political recruiters tend to focus their efforts on getting men to run for office (Sanbonmatsu Reference Sanbonmatsu2006). We argue that these realities lead, on average, women to wait until later in life to run for office—especially high-ranking offices like the U.S. Congress—than men.
Once women decide to run for office, they face electoral impediments that burden women more than men (Hayes and Lawless Reference Hayes and Lawless2016). Even if this electoral environment is becoming less treacherous, women continue to perceive it to be more difficult and act accordingly (Hayes and Lawless Reference Hayes and Lawless2016; Lazarus and Steigerwalt Reference Lazarus and Steigerwalt2018). For example, Fulton and Dhima (Reference Fulton and Dhima2020) argue that women may win at similar rates as men, but only because of the “performance premium” that female candidates achieve compared with their male counterparts. To our knowledge, no study has yet examined how those decreased electoral prospects—or the pervasive perception of a more difficult road to reelection—affect women's overall careers. We posit that women are more likely to both lose reelection races and strategically retire than men are. As a result of both trends, we predict that women's careers in public office are significantly shorter than those of their male counterparts.
We empirically test these propositions by examining the careers of members of the U.S. House of Representatives who served between 1976 and 2018. First, we find that, on average, women are older when they first reach the House of Representatives than men are. Second, we find that women in the House of Representatives have careers that are as much as 40% shorter than men, on average. Together, these findings indicate that women's congressional careers are likely subject to different and more intense pressures than men's careers are. We propose that family responsibilities, risk aversion, and disproportionately difficult election races all influence how and when candidates run for elected office and how long they hold on to those offices.
Most notably, we find that these patterns of female members entering office later and leaving earlier than their male colleagues continue even as the number of women in Congress grows larger. The broader implication of our findings is that the presence of more women in the electoral arena is a necessary but not sufficient condition to undo women's persistent underrepresentation in Congress. Because women's careers are shorter, even an equal number of male and female candidates would likely not lead to equality in representation. Our findings instead suggest that equal representation requires removal of the barriers that lead women to delay running for office and serve comparatively shorter tenures once they arrive.
GENDERED ELECTORAL ENVIRONMENTS BEFORE RUNNING FOR OFFICE
The 117th Congress featured a record number of women in both the Democratic and Republican Party coalitions. These gains herald a new era for women in elected office and suggest that entrenched gender biases may be receding. However, even though gender differences in election experiences may be attenuating over time (see, e.g., Brooks Reference Brooks2013; Burrell Reference Burrell2014; Dolan Reference Dolan2014; Hayes and Lawless Reference Hayes and Lawless2016), other studies suggest that the core concerns remain—female candidates must work harder, and they must be better overall candidates than their male counterparts to succeed at similar rates (see, e.g., Fulton and Dhima Reference Fulton and Dhima2020; Lazarus and Steigerwalt Reference Lazarus and Steigerwalt2018). Women must also overcome concerns held even by members of their own party about their electability (Bateson Reference Bateson2020). One strong possibility is that the “performance premium” that female candidates routinely display does not negate the underlying impediments they continue to face in the electoral arena. Another is that women's persistent perception of a difficult electoral terrain (see, e.g., Brooks Reference Brooks2013; Hayes and Lawless Reference Hayes and Lawless2016; Lazarus and Steigerwalt Reference Lazarus and Steigerwalt2018) continues to exert an outsized influence on women's electoral calculations. We explore this conundrum in the context of congressional careers.
Many forces influence any individual's probability of running for office, and a number of these may disproportionately discourage women from running. We argue that these factors not only result in fewer women running for office, but also have the effect of delaying entry into politics among women who do decide to run.
First, previous studies and contemporaneous accounts suggest that political recruiters tend to overlook women when seeking candidates to run in elections. Even as more and more women run for office, party leaders and other recruiting agents view women as less qualified than men overall (Crowder-Meyer Reference Crowder-Meyer2013; Lawless and Fox Reference Lawless and Fox2010; Sanbonmatsu Reference Sanbonmatsu2006; Carrol and Sanbonmatsu Reference Carroll and Sanbonmatsu2013). Bateson (Reference Bateson2020) further identifies the idea of “strategic discrimination”: when party leaders and voters minimize the ability of certain candidates—notably, women and people of color—to successfully win election because of the potential objections of others. People also tend to know and recruit people within their social and political networks, and those networks have high levels of homophily. Since most recruiters are men, they primarily focus their recruitment efforts on other men. As a result, women are less likely to be contacted by recruiters. For example, prominent Georgia Republican political analyst Julianne Thompson noted, “There's no denying the fact that there's been a good ol’ boy network in Georgia, that has held women back, not just Republican women, but has held women back when it comes to political office” (Moore and Boyd Reference Moore and Boyd2020). This recruitment deficit is compounded by the fact that while men often seek office on their own, women tend not to run unless they are asked to do so by a recruiting agent or given a vote of confidence by some external party (Carroll and Sanbonmatsu Reference Carroll and Sanbonmatsu2013).
In recent years, efforts to recruit and support female candidates have ramped up, as a variety of organizations have devoted considerable time, effort, and money to the cause of boosting women's representation in Congress and elsewhere (Kreitzer and Osborn Reference Kreitzer and Osborn2018). These efforts, however, differ substantially in terms of party (Crowder-Meyer Reference Crowder-Meyer2013). As Kreitzer and Osborn (Reference Kreitzer and Osborn2018) highlight, not only do more groups recruit Democratic and abortion-rights-supporting candidates, but also the distribution of such groups across the United States is quite unequal; most states do not have a single group that focuses on supporting Republican or anti-abortion-rights candidates. Crucial Democratic-aligned groups also formed much earlier than their Republican counterparts by several decades (see Kreitzer and Osborn Reference Kreitzer and Osborn2018, Figure 2), and this pattern continues today. Republican groups focused on electing women candidates continue to fall well short of their Democratic counterparts in terms of fundraising (see, e.g., Cooperman Reference Cooperman2020). The National Republican Congressional Committee (NRCC) attempted to address this issue by appointing Representative Elise Stefanik as the first female head of recruitment in the organization's history for the 2018 election cycle. Shortly after the 2018 election, Stefanik broke from the NRCC to form a leadership PAC specifically focused on recruiting female Republican candidates (Becker Reference Becker2020; Pathe Reference Pathe2018). The number of Republican women serving in the House jumped from 13 in 2019 to 30 in 2021, a clear improvement, though still well behind the 89 Democratic female members of the 117th Congress. Nonetheless, even with these greatly increased training, recruitment, and fundraising efforts, women still represent less than 40% of the House Democratic caucus and, overall, substantially less than 30% of the candidate field in most election years (Burrell Reference Burrell2014).
Finally, recruitment barriers are exacerbated by concerns about support for one's potential candidacy. Butler and Preece (Reference Butler and Preece2016) discover that even women who are recruited believe they will not receive similar levels of party and financial support as potential male candidates. As a result, politically minded women who are interested in running for office both fear they will be and often are left to their own devices to find entry into the political world rather than being approached by someone. This process—which involves networking, fundraising, and navigating the bureaucratic requirements of participating in politics—can be time-consuming for candidates, and even more so without the aid of a party recruiter.
Second, women take on a disproportionate share of family responsibilities, which may prevent or delay a run for office (Fox and Lawless Reference Fox and Lawless2011). Women spend more time raising their children and doing other household chores than men (Ridgeway Reference Ridgeway2011); the impact of these continued disparities on working women has been illuminated during the COVID-19 pandemic (Bateman and Ross Reference Bateman and Ross2020). This uneven division of family responsibilities in the home influences people's ability to enter politics. When women examine their electoral environment and decide whether or not to run for office, they are more likely than men to consider their families (Burns, Schlozman, and Verba Reference Burns, Schlozman and Verba2001; Fox and Lawless Reference Fox and Lawless2011). And, during campaigns, the media and even voters sometimes negatively evaluate women for being away from their families to pursue their careers in Congress (Lazarus and Steigerwalt Reference Lazarus and Steigerwalt2018). We posit that women's disproportionate share of household responsibilities makes them more likely than men to wait until their children are more mature or even fully grown before running for office.
Finally, there is a measurable gender gap in self-confidence. Across a variety of professions and areas of life, women evaluate their abilities and talents more harshly than men evaluate theirs (Beloff Reference Beloff1992; Kling et al. Reference Kling, Hyde, Showers and Buswell1999; Wigfield, Eccles, and Pintrich Reference Wigfield, Eccles, Pintrich, Berliner and Calfee1996). As early as high school, female students rate their own abilities lower than men rate themselves, even when there are no objective differences in performance (Pajares Reference Pajares2002; Wigfield, Eccles, and Pintrich Reference Wigfield, Eccles, Pintrich, Berliner and Calfee1996). This “self-efficacy” gap persists into adulthood, even among high-level professionals, and directly leads to women earning lower salaries and receiving fewer benefits at work (Bowles, Babcock, and McGinn Reference Bowles, Babcock and McGinn2005; Bylsma and Major Reference Bylsma and Major1992; see Fox and Lawless Reference Fox and Lawless2011 for a review of this literature).
In the political arena, women's decreased self-efficacy leads them to be less confident in their ability to understand politics than men (Gidengil, Giles, and Thomas Reference Gidengil, Giles and Thomas2008) and less likely to believe they are qualified to run for office than men (Hayes and Lawless Reference Hayes and Lawless2016; Lawless and Fox Reference Lawless and Fox2010). This gap exists even when men and women have comparable credentials, backgrounds, and/or experiences (Fox and Lawless Reference Fox and Lawless2011). As a result, women and men who have comparable objective qualifications do not run for office at the same rates—women tend not to run unless they have better objective qualifications than men do and are more likely to run in races where they are likely to win (Fulton Reference Fulton2012; Pearson and McGhee Reference Pearson and McGhee2013). Both of these tendencies—waiting to bolster objective qualifications and being more discerning about choosing which races to enter—may delay women's entry into the political arena.
As a result of all three factors, women are more hesitant to run for office than men are. For men, a decision to run for office is highly coupled with their level of political ambition (Schlesinger Reference Schlesinger1966). For most women, however, a desire to run is simply not enough: women will generally only pursue elected office if they perceive that they have a high likelihood of winning election (Fulton et al. Reference Fulton, Maestas, Maisel and Stone2006; Hayes and Lawless Reference Hayes and Lawless2016; Lawless and Fox Reference Lawless and Fox2010; Pearson and McGhee Reference Pearson and McGhee2013). Importantly, this is not just true for (potential) candidates contemplating their first run for elected office. Women who hold lower-level offices are similarly less likely to run for a higher office than their male counterparts (Fulton Reference Fulton2010; Thomsen Reference Thomsen2014). Empirically, this means that women do not come to politics—and particularly high offices such as the House of Representatives—until later in life than men do. Our first hypothesis is thus that female House members are, on average, older when they first assume office than male House members.
GENDERED ELECTORAL ENVIRONMENTS WHILE RUNNING FOR OFFICE
Once a candidate makes the decision to run, men and women face very different electoral environments. While female candidates do not face many of the overt biases of days past, the electoral arena continues to put hurdles in women's path to office that men do not have to face, and, perhaps more important, women continue to perceive that their path to office is simply harder than that faced by their male counterparts (Hayes and Lawless Reference Hayes and Lawless2016). As Lazarus and Steigerwalt (Reference Lazarus and Steigerwalt2018) document, female candidates even today still face, to some degree, three important sets of roadblocks: biased media coverage, voters’ gender-based stereotypes, and more and higher-quality challengers in both primary and general elections.
First, female candidates must contend with differential media treatment, though the extent has lessened over time. Studies by Bystrom et al. (Reference Bystrom, Banwart, Kaid and Robertston2004), Smith (Reference Smith1997), Palmer and Simon (Reference Palmer and Simon2006), and Kahn (1994) find that the press gives women less coverage of their policy views and is more likely to broadcast women's family status, clothing choices, or other frivolous news items. This gendered coverage places women “apart from the norm” (Falk Reference Falk2008; Skenazy Reference Skenazy2008; Thomas Reference Thomas1997). More recent studies suggest these particular biases are lessening, especially in terms of coverage equity (see, e.g., Burrell Reference Burrell2014; Hayes and Lawless Reference Hayes and Lawless2016; Sapiro et al. Reference Sapiro, Walsh, Strach and Hennings2011), although areas for improvement remain. For example, Bystrom and Hennings's (Reference Bystrom, Hennings and Armstrong2013) analysis of media coverage of 2012 Senate candidates reports no discernible gender differences in coverage of candidates’ families or appearance, but it also finds that female candidates in mixed-gender races were less likely to be the emphasis of news stories than their male opponents. They also find that races with two female candidates received less coverage overall than mixed-gender races.
Van der Pas and Aaldering (Reference Van der Pas and Aaldering2020) continue to find that the media are more likely to focus on women's “character issues” or negative stories connected to their candidacies. Similarly, analyses of Twitter-focused coverage of the 2020 election again find significant gender differences in the content of coverage of female and male candidates (Di Meco Reference Di Meco2019); an important question is whether such disparities are more apparent today in presidential races than those down-ballot (see, e.g., Bystrom Reference Bystrom, Bystrom and Burrell2019). Collectively, these trends hamper voters from receiving adequate information to make qualified decisions about candidates (Meeks Reference Meeks2013).
Second, studies continue to find evidence of gendered voter biases, though again, the content and degree of these biases has shifted over time. For example, studies find that voters prefer to support candidates with “masculine” traits and “masculine” policy expertise over candidates who display more “feminine” trait characteristics (see, e.g. Dolan Reference Dolan2010; Lawless Reference Lawless2004; Koenig et al. Reference Koenig, Eagly, Mitchell and Ristikari2011; Rosenwasser and Dean Reference Rosenwasser and Dean1989; Rosenwasser and Seale Reference Rosenwasser and Seale1988; Sanbonmatsu Reference Sanbonmatsu2002). While some more recent studies suggest a lessening of these gendered candidate perceptions (see Brooks Reference Brooks2013; Dolan Reference Dolan2014), others, such as Bauer (Reference Bauer2020), find that stereotype activation exists, but only in response to trait-based, but not issue-based, feminine messages. Voters are also much more likely to care about the competence of female candidates than male candidates (see, e.g., Ditonto Reference Ditonto2017; Ditonto, Hamilton, and Redlawsk Reference Ditonto, Hamilton and Redlawsk2014) and to evaluate female candidates more harshly with respect to qualifications (Bauer Reference Bauer2019). Similarly, Bateson (Reference Bateson2020) identifies an important paradox that may fuel perceived voter biases, even as more and more Americans report that they will vote for female candidates: the idea of “strategic discrimination,” whereby voters fear that others will vote against a female candidate and so strategically withhold support. Thus, while overt voter biases are difficult to find, studies continue to identify more subtle ways in which female candidates are hampered at the voting booth.
Finally, even as women win office at similar rates as men (Burrell Reference Burrell2014), women generally face more and stronger electoral opposition. Prior studies suggest that women face more primary and general election challengers (Lawless and Pearson Reference Lawless and Pearson2008; Palmer and Simon Reference Palmer and Simon2005, Reference Palmer and Simon2006), though at least one study reports no gender differences (Burrell Reference Burrell2014). The evidence is stronger, however, that women running for office face stronger opponents than men do, on average. Women's opponents are more likely to be politically experienced and better funded than the opponents faced by men (Berch Reference Berch2004; Milyo and Schosberg Reference Milyo and Schosberg2000; Niven 1998; Palmer and Simon Reference Palmer and Simon2005). Once again, this reality holds for female incumbents as well as challengers (Milyo and Schosberg Reference Milyo and Schosberg2000; Palmer and Simon Reference Palmer and Simon2005), with Milyo and Schosberg (Reference Milyo and Schosberg2000, 44) noting the “irrational tendency [of] challengers to overestimate their likely success against female incumbents.” Indeed, in 2016, outside groups spent nearly twice as much to defeat female incumbents as they did male incumbents (Balcerzak Reference Balcerzak2017).Footnote 1
Female officeholders therefore perceive (correctly) that they must constantly prove themselves, both to their constituents and to their colleagues, in order to stave off both primary and general election challengers. Lazarus and Steigerwalt (Reference Lazarus and Steigerwalt2018) term this phenomenon “gendered vulnerability” and argue that women in elected office respond strategically by adopting a highly constituent-oriented legislative strategy. Most strikingly, Lazarus and Steigerwalt find that these perceptions of vulnerability apply even to female members who have consistently won reelection with high margins, have seniority, and/or hold leadership positions.
We argue, expanding on Lazarus and Steigerwalt's theory, that this perception of gendered vulnerability also influences female officeholders’ career choices. Every time an elected official considers whether to run for reelection, he or she must weigh the costs and benefits of doing so. We propose that that the calculations for women are distinct from those for men. Similar to the way that child care responsibilities and self-confidence levels may differentially influence when, if ever, men and women first gain office, we argue that both the perception and the reality of women's gendered electoral vulnerability results in them having shorter congressional careers than their male counterparts.
We propose that gendered vulnerability influences women's career decisions through two mechanisms. First and most directly, we argue that women are more likely than men to lose when they run for reelection. Every reelection bid, no matter whom the incumbent, is a form of lottery in which the incumbent wins with a given probability. If female officeholders are more likely to lose any given race than men are, this suggests that female officeholders are more likely, on average, to “lose” one of those lotteries earlier in their career than male members. Thus, we predict that women who leave office because of reelection loss will have shorter careers than men who leave because of reelection loss.
However, members of Congress who lose reelection are not the only ones who leave the chamber because of electoral concerns. Members who retire often do so because they are electorally vulnerable and predict that they probably will not win their next election. The notion of “strategic” retirements builds on Black's (Reference Black1972) formulation of candidate entry as an expected utility problem: the factors dominating the decision to run for reelection include the cost of running, the potential benefit to be gained by winning, and (importantly for our purposes) the probability of realizing that benefit with a victory. The implication is that potential candidates, particularly those who are electorally vulnerable, may calculate that the costs of running outweigh the expected benefit. Previous studies have found that electorally vulnerable members are much more likely to retire than safe members (Carson Reference Carson2005; Cox and Katz Reference Cox and Katz2002; Groseclose and Krehbiel Reference Groseclose and Krehbiel1994; Hall and Van Houweling Reference Hall and Houweling1995; Hibbing Reference Hibbing1982; Moore and Hibbing Reference Moore and Hibbing1998; Stone, Maisel, and Maestas Reference Stone, Maisel and Maestas2004; Stone et al. Reference Stone, Fulton, Maestas and Maisel2010).
We connect the previous findings concerning the effect of electoral vulnerability on retirement decisions to Lazarus and Steigerwalt's (Reference Lazarus and Steigerwalt2018) idea of gendered vulnerability. If women's electoral prospects are systematically worse than men's, or if women perceive them to be systematically worse because of their gendered vulnerability, then at any given time, women should be more likely to retire than men. As a result, similar to those who lose reelection, we predict that women who voluntarily retire should have shorter careers than men who voluntarily retire.
One important caveat is that not all voluntary departures from Congress are created equal. Some departing members of Congress leave politics altogether, while others seek another political office. Unlike pure retirements, instances of “progressive ambition”Footnote 2 (Schlesinger Reference Schlesinger1966) typically are not related to politicians’ prospects of winning reelection. Those who seek another office typically do not do it as a “plan B” when they think they are going to lose their current seat, but rather because they seek the benefits offered by the new office. In contrast with pure retirements, the probability of a member seeking another office is unrelated to how vulnerable the member is in their current seat (Abramson, Aldrich, and Rohde Reference Abramson, Aldrich and Rohde1987; Brace Reference Brace1984; Keiweit and Zeng Reference Keiwiet and Zeng1993; Lazarus Reference Lazarus2006).Footnote 3 Instead, seeking another office is much more strongly influenced by factors related to the member's likelihood of winning the target office (Rohde Reference Rohde1979). We suggest that, in contrast with pure retirements, the unbalanced electoral field that women face does not induce them to seek out other offices at a higher rate than men do. Therefore, we expect that among members who display progressive ambition, there will be no difference between the career lengths of women and men.Footnote 4
TESTING GENDER DIFFERENCES IN CAREER LENGTH
To investigate these hypotheses, we examined every member of the House of Representatives who served in the chamber since 1976, up though the freshman class of the 116th Congress (2019–20). Members’ age upon reaching the chamber and the length of their careers were obtained from the Library of Congress's Biographical Directory of the United States Congress.Footnote 5 We utilize two dependent variables: how old members were as freshmen and how long each member of Congress served. We also account for how they departed the chamber: every member is coded as losing a bid for reelection (whether in a general or primary election); voluntarily leaving the chamber to seek another political office (“progressive ambition”); or voluntarily leaving the chamber and not seeking another political office (“retirement”). We exclude from our career length analysis members who died while in office and those who retired in the face of a criminal conviction. We also exclude members who served into the 116th (2019–20) Congress, as their congressional careers were still ongoing when we conducted the analysis.
Ages of House Freshmen
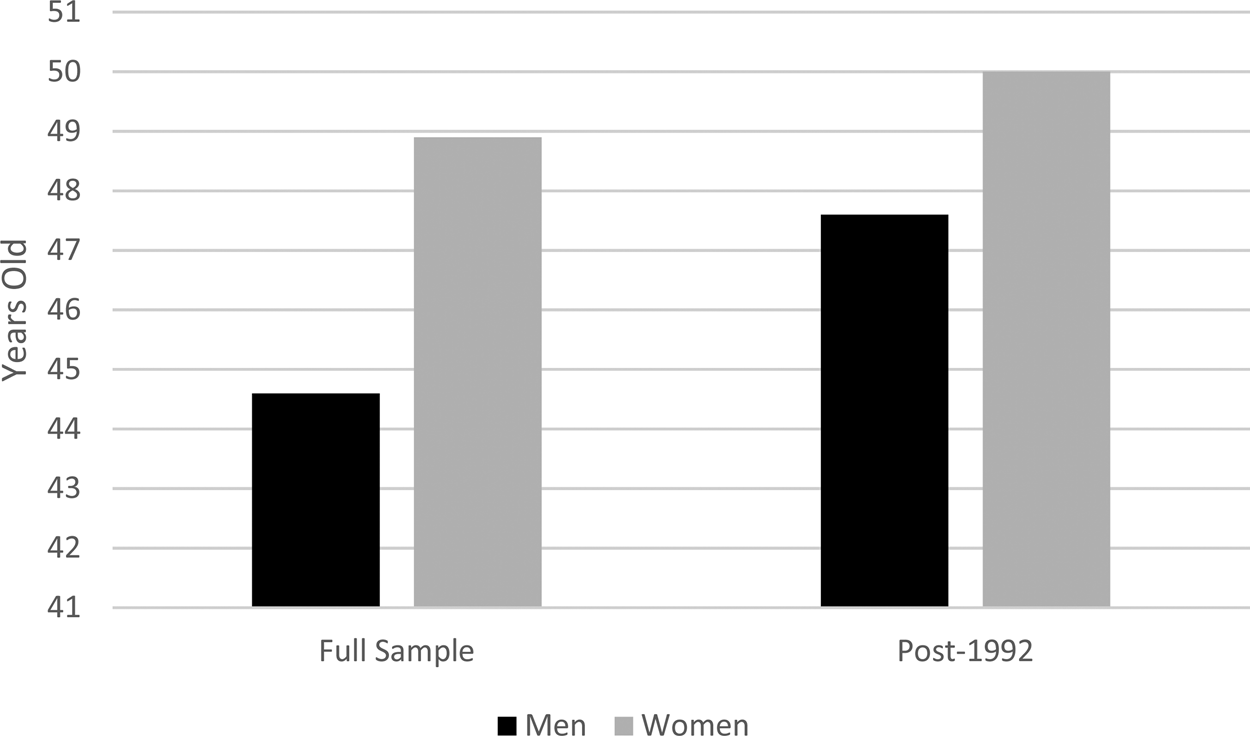
We begin by testing our first hypothesis, that women enter office at a later age than men. Figure 1 displays the average age of male and female House freshmen. Looking first at the full sample, the median age of female freshmen is 48.9 years, while the median age of male freshmen is more than four years younger, at 44.6 (p < .001). Over more than four decades, women are, on average, over four years older when they reach the House of Representatives. However, the full sample may not provide the most direct comparison, as very few women served in Congress prior to 1992's “Year of the Woman” and the subsequent 103rd Congress (1993–94). The right side of Figure 1 therefore shows the gender difference only for House members who entered the chamber in 1993 or later. In this subsample, there is still a significant gender difference in freshmen's age, albeit somewhat smaller. Both groups of freshmen see a rise in their average age: women to 50 years, and men to 47.6. The gender difference in entry age shrinks to 2.4 years, but remains statistically significant (p < .001).
House Freshmen Mean Age, by Gender.
We test the robustness of this finding in two ways. First, we further probe whether the gendered age gap among House freshmen may be time-bound. It is possible that as time has passed, women have felt the constraints described earlier less acutely, leading to more equal ages of male and female freshmen. Figure 2 shows the average age of men and women in each freshmen class between the 103rd and 116th Congresses; the dashed line indicates women's average age, and the solid line men's. In the 14 freshmen classes displayed, women were older in 12, with the exceptions of the 110th and 116th Congresses. Indeed, the 116th Congress is unusual in that it saw significant drops in the age of both male and female freshmen. The 116th Congress may be the harbinger of a more permanent change whereby House freshmen are younger, and men and women are roughly equal in age to one another. For now, however, the evidence suggests that the gender-related age gap in House freshmen is not limited to earlier eras.
Age at Election, 103rd-116th Congress.

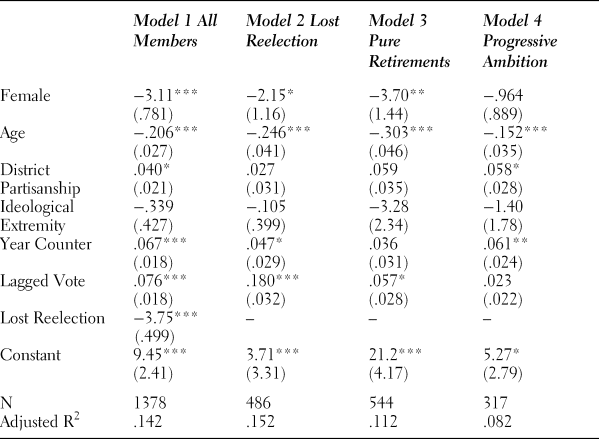
Second, we estimate two ordinary least squares (OLS) regressions in which the dependent variable is the Age of each House freshman; the first estimation includes the full sample, while the second includes only the post1992 subsample. The primary independent variable in both regressions is a dummy variable coded 1 if the member is Female, and 0 if the member is male. Control variables include the Year the member entered the House, a dummy variable coded 1 if the member is a Democrat and 0 if the member is a Republican, and a measure of District Partisanship—the share of the two-party vote received by the candidate of the House member's party in the most recent presidential election.
Results are presented in Table 1. In both regressions, Female is positive and significant. The full sample model predicts that, holding all else equal, female freshmen are approximately three years older than male freshmen; the post-1992 sample indicates that women are two years older. Of the control variables, only Year is significant in both models. The coefficient is positive, indicating that over time all freshmen are getting older—although the rate of that increase is changing. The coefficient is nearly two orders of magnitude greater in the post-1992 regression, indicating the rate at which freshmen are getting older is much greater in more recent years. District Partisanship is positive and significant in the full sample—indicating that freshmen in more partisan districts tend to be older. However, this variable is not significant in the post-1992 sample, implying that this trend is limited to earlier years. Also of note is the fact that Democrat is not significant in either model—there does not appear to be any significant difference in the ages of Democratic and Republican freshmen.
OLS Estimates of House Member Age at First Election, 1976–2018.
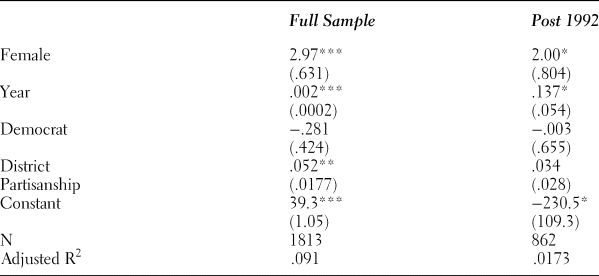
*p < .05, **p < .01, ***p < .001
Finally, might any differences among members simply be a function of partisanship or party polarization (see, e.g., Brooks Reference Brooks2013; Dolan Reference Dolan2014)? To test this alternative hypothesis, we split the sample by party, comparing the ages of female Democratic freshman with male Democratic freshmen, and female Republicans with male Republicans. For both parties, results are virtually identical to the bivariate results presented in Figure 1.Footnote 6 Therefore, party does not appear to have an independent influence on the gender gap in House freshmen's ages.
House Members’ Career Lengths
We have shown that women enter office later than their male counterparts. But do women also serve for shorter tenures once they arrive? To investigate the length of House members’ tenure in office, we examine the career of every House member who served since 1976 and subsequently left office prior to the start of the 116th Congress, noting how long each member of Congress served, as well as how they departed the chamber. As a reminder, we exclude from our analysis members who died while in office, and those who retired in the face of a criminal conviction. We also exclude members who served in the 116th (2019–20) Congress, as their congressional careers were still ongoing when we conducted our analysis.
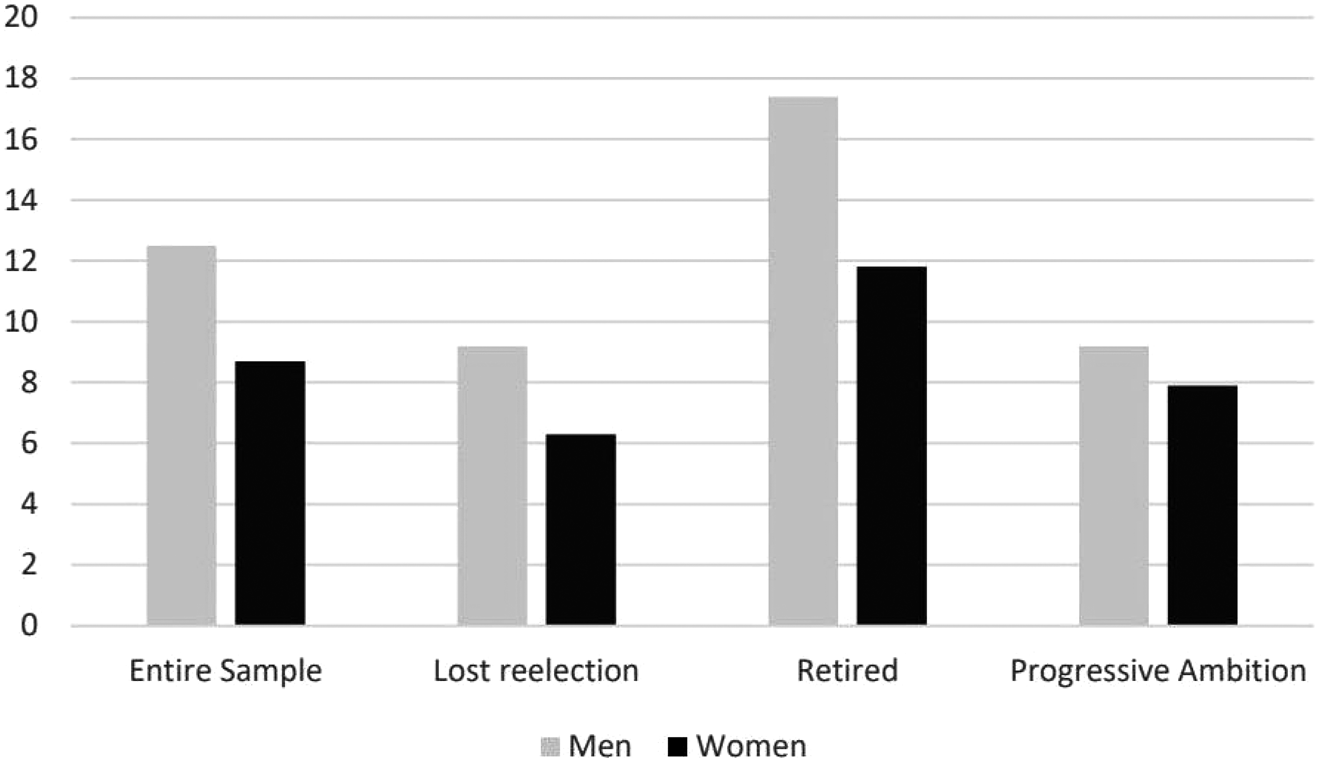
Figure 3 presents the bivariate relationship between gender and tenure for House members in our data set; the four sets of results indicate the mean length of service for men and women in the full data set, as well as the mean length for those in each category of departure. Over the entire data set, men serve an average of 12.5 years in the House of Representatives, while women serve only 8.7 years. The difference is statistically significant (p < .000), and substantively significant as well: men serve an average of 3.8 years longer than women—nearly two full terms. Looking at the different modes of departure, the gender difference in tenure is similarly pronounced among House members who lose reelection and retire. Men who lose reelection serve an average of 9.2 years, 46% longer than women's 6.3 years (p < .009). Men who voluntarily retire serve an average of 17.4 years, 47% longer than women's 11.8 years (p < .000). On the other hand, the difference in term length among men and women who leave the chamber via progressive ambition is much narrower: men's average of 9.2 years is only 16% longer than women's 7.9 years, and the difference is not statistically significant at conventional levels (p < .062).Footnote 7 These initial bivariate results thus conform to our hypotheses: the gender difference in career length is significant among members of Congress who leave the chamber via retirement and those who leave via electoral loss, but not among those who leave via progressive ambition.
Gender and Career Length.
To further explore this phenomenon, we conduct multivariate tests of our hypotheses. Our dependent variable is members’ Tenure in the House, measured as the number of (continuous) years the member served in the chamber. To test the hypotheses derived earlier, we estimate four models, once again using OLS. The first model includes the complete data set, the second model includes only those members who lost a reelection contest, the third model reflects only those who retired from office, and the fourth model only includes those who departed via progressive ambition. Our primary independent variable is a dummy variable coded 1 if the member is Female, and 0 if the member is male.
Additionally, we include a set of control variables to account for other factors that might plausibly influence how long a member serves in the House. Age at Election reflects the member's age, in years, at the beginning of their first term in the House. Members who are older when first elected to the House of Representatives should have shorter overall tenures; therefore, we expect Age at Election to be negatively related to career length. To address the possibility that members in safer seats will serve longer, we include two measures of seat safety: first, District Partisanship is the percentage of the presidential vote won by the presidential candidate of the member's party. Members in such districts should have longer careers overall. Second, Lagged Vote captures the percentage of the vote won by the incumbent in his or her last reelection race. A high value of Lagged Vote indicates electoral safety and should also be positively related to career length. Ideological Extremity is coded as the absolute value of the member's first-dimension DW-NOMINATE score. Ideologically extreme members tend to do worse at the polls than more moderate members (Canes-Wrone, Minozzi, and Reveley 2002; Carson et al. Reference Carson, Koger, Lebo and Young2010), so we expect these members to have shorter careers, on average. Year Counter is simply the number of years which have passed since the first in our data set, 1976. This atheoretical variable accounts for the possibility that congressional careers are growing longer or shorter over time. Finally, Lost Reelection (Model 1 only) is a dummy variable coded 1 for members who left the chamber because they lost reelection, and 0 otherwise. We include this variable in Model 1 as members who lose reelection see their careers cut short, relative to members who choose to leave the chamber on their own.
Table 2 presents the results for the four models. Notably, the coefficient on Female follows the pattern predicted by the hypotheses discussed earlier. In Model 1, which encompasses all members, the coefficient is negative and significant. Female is likewise negative and significant in Models 2 and 3, which estimate the models for members who lost reelection and those who retired from the chamber, respectively. Only in Model 4, which estimates the model for members who departed via progressive ambition, is Female not statistically significant. These results are consistent with the notion that female members’ careers are being cut short by women's disproportionately difficult electoral environments. The magnitude of the gender differences in career length is roughly consistent with what we found in the bivariate analysis. Among all members in our data set, Model 1 estimates that women serve an average of 3.11 fewer years than men do. But breaking members down by mode of departure reveals some heterogeneity in the gender gap. Among those who lost reelection, women serve an average of 2.15 fewer years than men, whereas, among those who voluntarily retire, women serve 3.7 fewer years. And, once again, the gender difference among those displaying progressive ambition is statistically insignificant.
OLS Estimates of House Member Career Lengths, 1976–2018
*p < .05, **p < .01, ***p < .001
Overall, female House members’ careers are shorter, and the effect is limited to those members who leave the chamber because of electoral concerns either directly (electoral loss) or indirectly (retirement). Among those who leave the chamber via progressive ambition—a decision largely independent of electoral concerns (see, e.g., Abramson, Aldrich, and Rohde Reference Abramson, Aldrich and Rohde1987; Brace Reference Brace1984; Keiweit and Zeng Reference Keiwiet and Zeng1993; Lazarus Reference Lazarus2006)—there is no gender gap in tenure length. We argue that this pattern is most directly explained by the proposition that women's harsh electoral environments—or, just as importantly, their continued perceptions of a gendered electoral vulnerability—significantly curtail the length of time they spend in office.
Turning to the control variables, most influence career length in the manner predicted. Age at Election is negative and significant in all four models, indicating that older members tend to have shorter careers. In the full sample, each additional year in age when a member is first elected is associated with a career that is shorter by about 0.2 years. District Partisanship is positive and significant in all four models, indicating that members in safe districts enjoy longer careers. Lagged Vote is positive and significant in three of the four models, indicating that traditionally electorally vulnerable members are more likely, on average, to have their careers cut short. Interestingly, the one model in which Lagged Vote is not significant is Model 4, which focuses on progressive ambition. This finding is consistent with prior studies of progressive ambition that show electoral pressure is not a significant factor in the decision of members of Congress to seek other offices. Lost Reelection is negative and significant in Model 1, confirming the finding from Figure 2 that House members who lose reelection serve shorter careers. Ideological Extremity is negative as predicted, but not significant in any of the four models. Thus, it does not appear that ideologues pay a price for their legislative stances, at least in terms of how long they stay in office. Finally, the year counter is positive and significant in three of the models, including Model 1, indicating that congressional careers are increasing over time.
House Member Career Lengths, Pre- and Post-1992
Our analysis so far reveals important gender differences in career lengths, but are these results simply a function of time? Beginning in 1993, the number of women in Congress has consistently grown. Were career lengths of women elected in the 2000s affected by the same forces as those elected in the 1970s or 1980s? In this section, we investigate whether gender influences House member career lengths similarly in the pre- and post-1992 periods.
Figure 4 presents the bivariate relationships between gender and career length in the two periods. Broadly, there is not much difference between the two samples: in the pre-1992 period, men serve an average of 13.1 years and women serve 9.7, while in the post-1992 period, men serve 11.9 and women serve 8.3 years. The gender differences in each time period are both statistically significant (p < .010 and p < .000, respectively) and substantively comparable in magnitude (men's careers are 35% longer pre-1992 and 43% longer post-1992).
Gender and Career Length, pre- and post-1992.
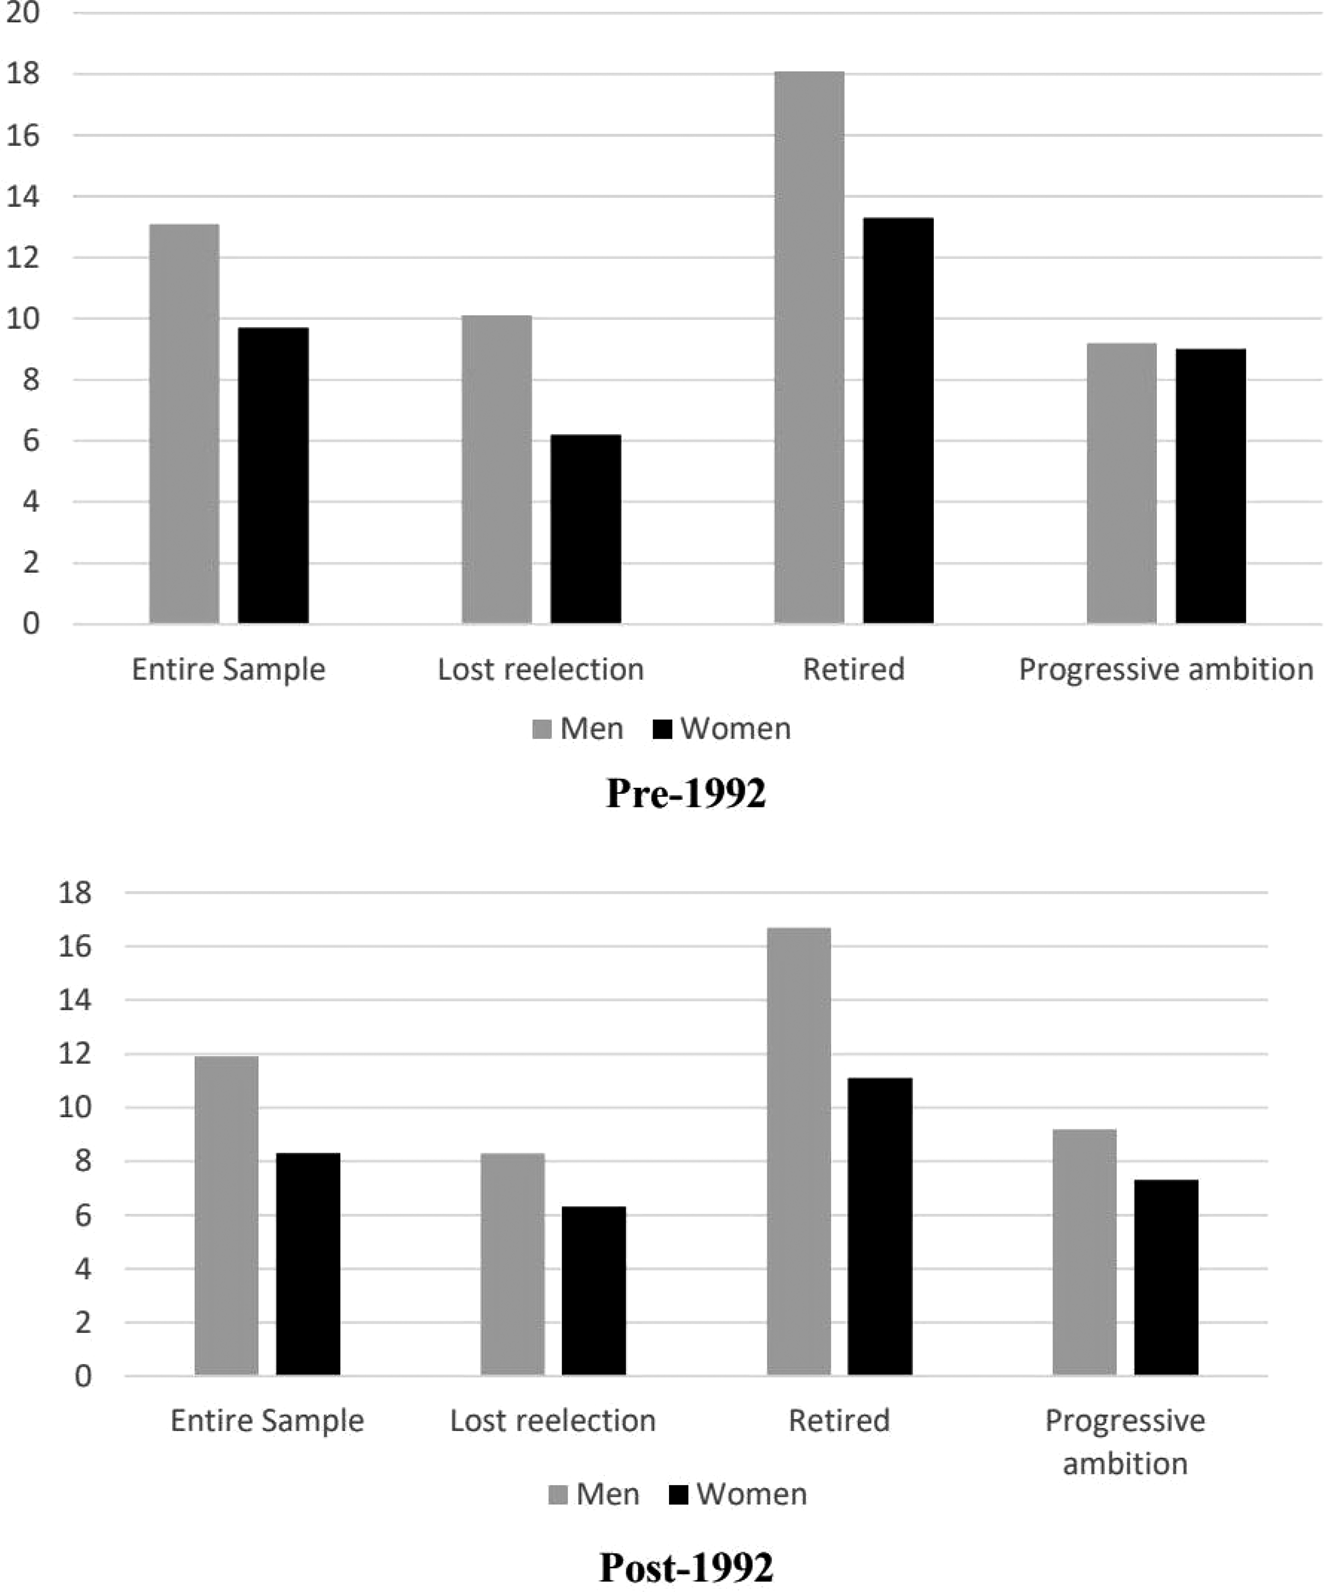
When we examine how members left office, the story remains the same, with one exception: those expressing progressive ambition. For members who lose reelection and for members who retire voluntarily, the gender difference is substantively significant for both the pre- and post-1992 time periods. These differences are not always statistically significant at conventional levels (p-values for these categories are p < .053 for pre-1992 retirees and p < .03 for pre-1992 electoral losses, and p < .08 and p < .001, respectively, for post-1992), largely due to the fact that the categories now each only contain a handful of women and the standard errors increase substantially. However, while the pre-1992 time period strongly conforms to our predictions in that there is no gender difference among members displaying progressive ambition, in the post-1992 period, the difference between men and women is substantively meaningful at 1.9 years (despite, once again, not being statistically significant). Nonetheless, the gender difference in the progressive ambition category is still smaller in magnitude (men have 26% longer careers) than the differences in the lost reelection category (32% longer) or the retired category (50% longer).
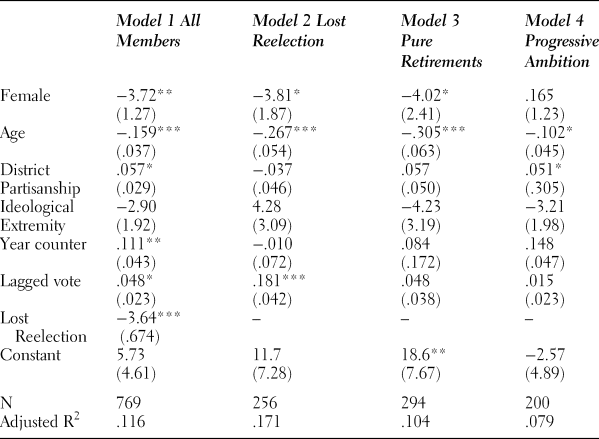
We further investigate potential differences between the pre-1992 and post-1992 time periods by reestimating the models from Table 2, but separately for the two time periods. The results, presented in Tables 3a and 3b, confirm our core hypothesis: Female is negative and significant in Model 1 in both time periods, suggesting that women's careers are shorter overall than those of men. However, once again subcategory differences emerge in Models 2–4. Among members who retire, Female is negative and significant across both time periods, and among members who display progressive ambition, Female is not significant in both. Conversely, for members who lose reelection, Female is negative and significant in the earlier time period, but negative and insignificant in the later time period. Once again, this result is most likely because the number of women is small, inflating the standard errors. Overall, the implication of these findings is that even as more and more women successfully enter Congress, the broader forces that influence their career decisions—or, just as important, their perceptions of these forces and their potential impact on their reelection chances—remain.
OLS Estimates of House Member Career Lengths, Pre-1992 Only
*p < .05, **p < .01, ***p < .001
OLS Estimates of House Member Career Lengths, Post-1992 Only
*p < .05, **p < .01, ***p < .001
House Member Career Lengths by Party
In this final section, we examine potential partisan differences in the gender gap in the length of Congress members’ careers. Do Republican men have longer congressional careers than Republican women, and/or do Democratic men have longer careers than Democratic women? We do not have strong theoretical predictions about what the gender gap should look like across the two parties. We posit, however, three possible outcomes for the analysis, each with an associated causal mechanism. First, we might find that the observed gender gaps among Democrats and Republicans are roughly equivalent to one another. If this is the case, it would indicate that the electoral forces which disadvantage women in the electoral arena do so roughly equally across women of both parties.
Second, we might find that the gender gap is more pronounced among Republican House members than among Democratic House members. If this is the case, it may indicate that the electoral forces which disadvantage women are more damaging to Republican women than Democratic women. Democrats may embrace fewer gender-based stereotypes than Republicans, or be less likely to have those stereotypes influence candidate evaluations (Dolan Reference Dolan2014; Dolan and Sanbonmatsu Reference Dolan and Sanbonmatsu2009). According to this line of thinking, Democratic voters are more likely to embrace female Democratic candidates, and Democratic political elites are more willing to embrace and encourage the careers of female Democratic politicians. To the extent that this happens much more strongly in the Democratic Party than in the Republican Party, we would expect Democratic women's careers to be roughly equivalent in length to Democratic men's careers.
The third possibility is that the gender gap in career length is more pronounced among Democrats than among Republicans. If the gender gap is larger for Democrats, one potential explanation may be that Republican voters and (perhaps more importantly) political elites harbor more and stronger gender-based biases and stereotypes than Democrats do. These biases may cause them to target Democratic women in general election contests more vigorously than Democratic challengers target Republican women in general elections. To the extent that these efforts are successful, we would find that the careers of Democratic women suffer, but the careers of Republican women do not, leading to pronounced gender differences in career length among Democrats, but not among Republicans. An alternative explanation is that the need to maintain a minimum level of female descriptive representation in the Republican Party leads the party to direct resources toward the (relatively few) Republican female incumbents and their reelection efforts (see, e.g., Valdini Reference Valdini2019). Given the heightened diversity of the Democratic coalition, such efforts are both more cost-prohibitive and less overtly necessary. Valdini's (Reference Valdini2019) conceptualization of an “inclusion calculus” suggests that extra efforts may be taken by the Republican Party to protect Republican women in the House against defeat, protecting their career lengths relative to their Democratic counterparts.Footnote 8
Our analysis supports the third scenario: gender differences in House member career length are much larger and more consistently present among Democrats than Republicans. Figure 5 displays the bivariate relationships between gender and career length, but this time separately for each party. The top panel shows Democrats, and the bottom panel shows Republicans. Overall, Democratic men serve an average of 13.8 years, or 66% longer than Democratic women's average of 8.3 years (p < .000). For Republicans, the difference is much smaller: Republican men serve an average of 11.3 years, which is only 1.9 years, or 20% longer, than Republican women's average of 9.4 years (p < .047).
Gender and Career Length, by Party.
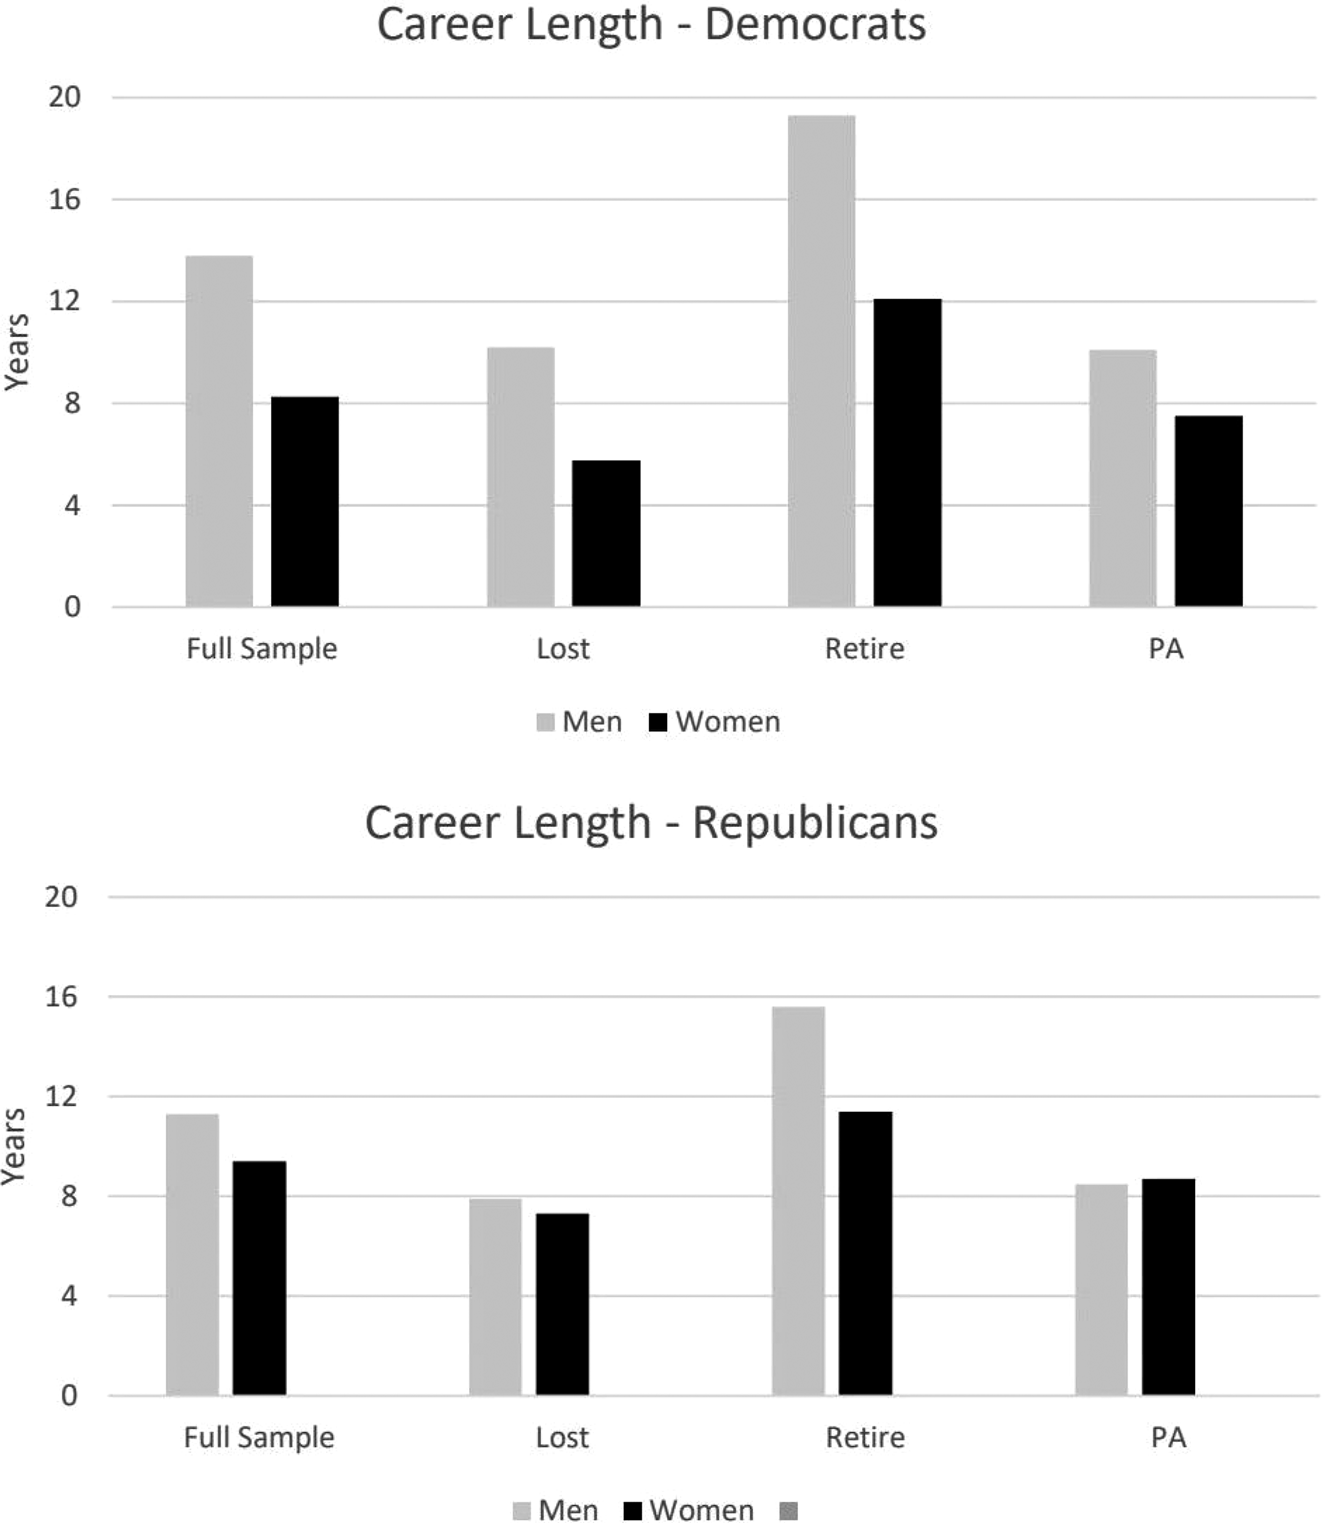
Regarding how members left the chamber, we find that, among Democrats, this gender difference persists throughout all three modes of departure. For those who lose a reelection race, men (mean = 10.2 years) serve 77% more time in the House than women (mean = 5.7 years; p < .003); among those who retire, men (mean = 19.3 years) serve 60% longer than women (mean = 12.1 years; p < .000); and men who seek other office (mean = 10.1 years) serve 25% longer than women who seek other office (mean = 7.5 years, p < .014). These findings are somewhat consistent with the hypotheses we derived earlier. The gender gap in career length continues to be much smaller for those who displayed progressive ambition than it is among those who retired and lost reelection bids, despite the fact that in the Democratic subsample, it is statistically significant.
On the other hand, the gender gap among Republicans is almost exclusively limited to those who voluntarily retire: retiring Republican men stay in the House an average of 15.1 years, 36% longer than Republican women's 11.4 years (p < .015). Careers for Republicans men who lost reelection are only 0.6 years longer than losing Republican women's careers; the difference is not statistically significant (p < .357). Among Republicans seeking another political office, women actually have slightly longer tenures (by 0.2 years) than men, but, once again, the difference is not significant (p < .521).
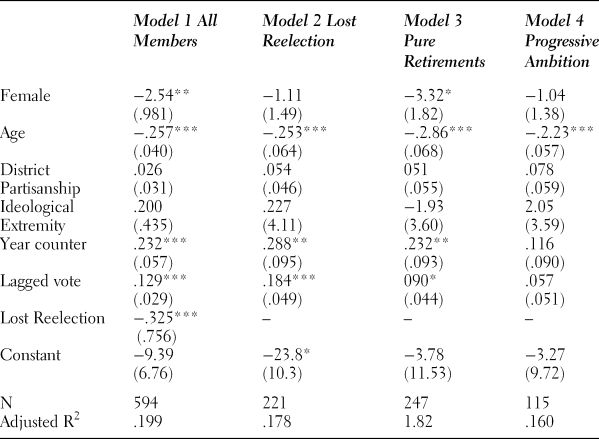
Thus, the general pattern we observe is that while Democratic men serve substantially longer careers in the House of Representatives than Democratic women no matter how they depart the chamber, the difference among Republicans is much smaller overall, and it is limited to those who leave by retiring. To determine whether these findings hold once alternative explanations are taken into account, we again replicate the original models from Table 2, but this time, we do so separately for Democrats and Republicans. The results, presented in Tables 4a and 4b, are very similar to the results of the bivariate analysis displayed in Figure 5.
OLS Estimates of House Member Career Lengths, Democrats Only
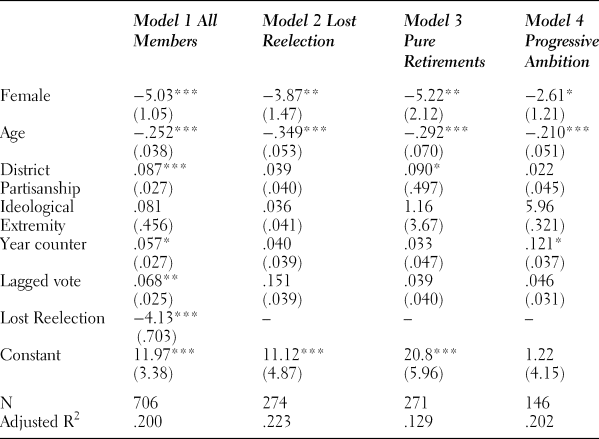
*p < .05, **p < .01, ***p < .001
Among Democrats (Table 4a), Female is negative and significant in all four models. Thus, even after controlling for additional factors, Democratic women serve significantly shorter terms than Democratic men (although the magnitude of the difference changes from group to group). Alternatively, Female is not significant in any of the Republican models (Table 4b), despite being negative in the three models (Models 1, 2, and 3) in which it is predicted to be negative. These results may be at least in part due to dividing the data into small categories with small numbers of women. However, they also reinforce the fact that the gender gap in career length is much more pronounced among Democrats than among Republicans.
OLS Estimates of House Member Career Lengths, Republicans Only
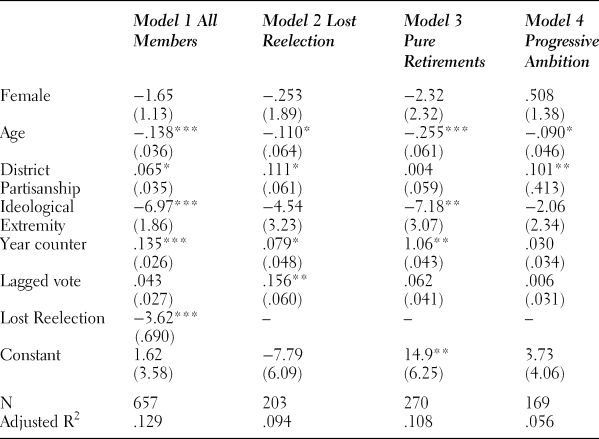
*p < 05, **p < .01, ***p < 001
One explanation for this finding is that Republican candidates, donors, and other elites target Democratic women to a much greater extent than Democratic political actors target Republican women. Another possibility is that the relative paucity of Republican women means they receive more institutional and party support once in office than their Democratic counterparts, whether simply because of their smaller numbers or due to the party's interests in maintaining a minimum level of coalitional diversity (see, e.g., Valdini Reference Valdini2019). As our analysis does not test these potential competing explanations, this finding deserves greater future study to understand its causes and implications for women serving in each party.
Finally, throughout the by-party analyses, a consistent pattern emerges: on average, Democratic men stay in Congress longer than Republican men, while Democratic women have shorter stays than Republican women. For example, among those who lose reelection, Democratic men serve an average of 2.2 year longer than Republican men (10.2 years versus 8 years), while Republican women serve an average of 2.1 years longer than Democratic women (7.8 years versus 5.7 years). A complete accounting of why gender differences in career length are so much more pronounced among Democrats than Republicans must account for this discrepancy: just as Democratic women serve disproportionately short terms, Democratic men serve disproportionately long terms, even when compared with their Republican male counterparts. This finding may reflect Democrats’ stronger position toward government service, Republican desires to elect nonpoliticians to office, or a tendency among Republican politicians to abide by self-imposed term limits. Fully elucidating career patterns among all four party/gender groups is another important avenue for future research.
CONCLUSION
The 2020 elections again led to numerous headlines trumpeting the gains women made in their quests for elected office. More women of both parties than ever before entered the House of Representatives in 2021, and, notably, almost every House district which flipped blue to red was won by a female or minority Republican candidate. But do these gains signal that the electoral playing field is now more equal for female and male candidates? And, just as importantly, do women perceive an equal electoral environment and act accordingly?
We argue that women continue to confront a different electoral world than men, and that these differences lead women to both enter Congress later and serve shorter amounts of time than men. A wealth of previous studies highlight a number of factors that may delay or deter women from running for office, including a disproportionate amount of family responsibilities, lower self-confidence, and the failure of political parties to recruit women for office. These factors likely explain why we find that women enter the House of Representatives at older ages than men. Additionally, even after women successfully enter the political arena, we propose that gendered electoral forces lead female members of the House to prematurely end their careers, whether because of election loss or strategic retirement. Empirically, we find that women serve in the House for shorter periods of time in general than men, and that clear gender disparities in tenure length appear when we examine how members left office. Members who depart the chamber via electoral loss and retirement display a significant gender gap in career length, but the gap is much smaller and, in some cases, statistically insignificant for members departing via progressive ambition.
We also find that these patterns exist even when we look only at women who have served since 1992's Year of the Woman. Even as the number of women grows, and party elites and voters become more accustomed to female members of Congress, women continue to enter office later and serve for shorter periods than men. Taken together, our findings suggest support for Lazarus and Steigerwalt's (Reference Lazarus and Steigerwalt2018) proposition that female members of Congress perceive they are vulnerable in a manner not felt by their male counterparts (see also Dittmar Reference Dittmar2019). First, women are older when they first reach Congress. Women may be waiting until their children are grown, they believe they have accrued the “necessary” experience, and/or they finally receive party backing. Second, women serve fewer terms once they arrive in Congress. This result comports with previous findings that women face more primary and general election challengers, as well as stronger challengers, and thus the increased possibility of losing reelection. Women thus take longer to get to Congress, and then their time there is relatively limited.
Our findings, coupled with those by previous scholars about women representatives’ “performance premium,” highlight the continued issues facing women in the political arena: even as the numbers of women in the electoral arena grow, substantial institutional impediments stand in their way. The most obvious implication of our findings is that they point to an explanation why, even as each election seemingly brings on a new “Year of the Woman,” the level of women's representation in Congress remains relatively low. At least 117 women served in the U.S. House of Representatives as of 2021, bringing the percentage of women in the chamber up to 27% from the previous record of 23%. While 2021 marked the first time that more than one-quarter of members of the House are women, the rate of progress overall is slow. When women arrive late to elected office, and then routinely serve shorter tenures than their male counterparts, the additive effect is fewer women serving at any one time.
More broadly, our findings also have significant representational implications. Perhaps most obviously, women's shorter careers can hinder their efforts to accrue the seniority and expertise necessary for achieving real policy influence in Congress. This pattern contributes to an underrepresentation of women in the upper echelon of both formal and informal chamber leadership. While Nancy Pelosi made history as the first female Speaker of the House, only 5 of 21 standing committees were chaired by women during the 116th Congress; 10 committees have never had a female chair, and most female chairs served only for a single Congress. Studies consistently find that committee chairs achieve greater legislative success than rank-and-file members and that this success grows as the length of their chair tenure increases (see, e.g., Volden and Wiseman Reference Volden, Wiseman, Dodd and Oppenheimer2016). The dearth of women in such leadership positions decreases female members’ ability to shepherd their bills, and those of their sisters, through the legislative process effectively.
The relative lack of female representation in the House of Representatives also has important policy ramifications: women tend to focus their legislative activities on different policy issues than men do—in particular, on so-called “woman's issues” (see, e.g., Dolan Reference Dolan1997; Frederick Reference Frederick2010; Reingold Reference Reingold2000; Swers Reference Swers2002, Reference Swers2005; Wolbrecht Reference Wolbrecht and Rosenthal2002)—and are more liberal than men are (see, e.g., Frederick Reference Frederick2010; Rocca, Sanchez, and Uscinski Reference Rocca, Sanchez and Uscinski2008; Swers Reference Swers2002). An article about the increasing number of women serving in the Georgia General Assembly highlighted a new series of bills that accompanied these gains, covering topics from “tampon taxes” to nursing rooms on Capitol grounds (Prabhu Reference Prabhu2019). Similarly, in 2019, Nevada became the first majority-female legislature, leading to a prioritization of issues ranging from domestic violence to maternal mortality to gender pay equity (Cheung Reference Cheung2020; Wax-Thibodeaux Reference Wax-Thibodeaux2019). Women's shorter careers therefore contribute to the chamber being less focused on women's issues and its outputs more conservative than they otherwise would be.
Finally, our research points to the need for further investigation into the career lengths of men and women by political party. We find that Democratic women have significantly shorter careers than Democratic men, but the gender difference in career length is much smaller among Republicans. One possible explanation is that the Republican Party may be more active in targeting Democratic women during general elections than Democrats are in targeting Republican women; another possibility is that Republican women receive more aid come reelection due to their relative dearth in the party. However, these theoretical arguments for the differences between career lengths by party are preliminary and warrant further investigation.
While the numbers of women in elected office continue to increase, long-standing institutional hurdles remain, and this harms women's ability to both attain and retain elected office. Our empirical results, as well as evidence from recent elections, point to some potential bright spots. For example, the entering age for women (and men) dropped notably for the 116th Congress, and any gender gap was negligible. Time will tell whether this reflects a long-term shift in the calculations women make when running for office or simply an aberration in long-standing patterns. The past two election cycles have also seen an uptick in groups explicitly supporting Republican women candidates, though it is still too early to discern the long-term effect these groups will have. As both of these examples highlight, a real solution means confronting the concerns scholars have repeatedly identified about the impediments female candidates face, including gendered media coverage, voter stereotypes, and intraparty challenges. It also means confronting more systemic and social-based issues, such as women's disproportionate share of child-rearing and household duties, as well as societal double standards concerning how women should properly act and positions they should pursue. For example, the Federal Election Commission's ruling that campaign funds can be used to pay for child care is a significant breakthrough, more fundamental changes such as this are needed (Pinsker Reference Pinsker2019). Many of these forces potentially stymie the ability of women to achieve success in other arenas as well, including business and academia, and their effects have been magnified during the COVID-19 pandemic (Bateman and Ross Reference Bateman and Ross2020). Thus, while the increase in the number of women running for office in recent years is an important step, real progress will come when women no longer experience nor perceive that gender is a deciding factor in how candidates are treated in the electoral arena and in elected office.


 Open access