


1. Introduction
Turbulence is a highly nonlinear phenomenon. Nevertheless, there is ample agreement that some of the processes sustaining wall turbulence can be faithfully represented by linearising the equations of motion about an appropriate reference flow state, i.e. base flow (Malkus Reference Malkus1956; Reynolds & Tiederman Reference Reynolds and Tiederman1967; Hussain & Reynolds Reference Hussain and Reynolds1970; Landahl Reference Landahl1975; Butler & Farrell Reference Butler and Farrell1993; Jiménez Reference Jiménez2013). One of these processes is the transfer of kinetic energy from the mean flow to the fluctuating velocities. The different mechanisms originate from linear stability theory and constitute the foundations of many control and modelling strategies (e.g. Kim & Bewley Reference Kim and Bewley2006; Schmid & Henningson Reference Schmid and Henningson2012; McKeon Reference McKeon2017; Rowley & Dawson Reference Rowley and Dawson2017; Zare, Georgiou & Jovanović Reference Zare, Georgiou and Jovanović2020; Jovanović Reference Jovanović2021). As such, establishing the relevance of a particular theory is consequential to comprehend, model and control the structure of wall-bounded turbulence by linear methods (e.g. Kim & Lim Reference Kim and Lim2000; Högberg, Bewley & Henningson Reference Högberg, Bewley and Henningson2003; Del Álamo & Jiménez Reference Del Álamo and Jiménez2006; Hwang & Cossu Reference Hwang and Cossu2010c; Zare, Jovanović & Georgiou Reference Zare, Jovanović and Georgiou2017; Morra et al. Reference Morra, Semeraro, Henningson and Cossu2019; Towne, Lozano-Durán & Yang Reference Towne, Lozano-Durán and Yang2020). Despite the ubiquity of linear theories, their significance in wall turbulence remains outstanding. One of the main limitations to assess the role of a concrete linear process in the flow has been the lack of conclusive cause-and-effect assessment of the mechanisms in question. In the present work, we devise a collection of numerical experiments of turbulent flows over a flat wall, in which the Navier–Stokes equations are minimally altered to suppress the causal link entailing the energy transfer from the mean flow to the fluctuating velocities via various linear mechanisms.
Before diving into the intricacies of the different linear mechanisms, one may ask why we should insist on describing this energy transfer using linear theories if turbulence is undoubtedly a nonlinear phenomenon. One reason is that the energy source for fluctuations in wall turbulence is controlled by spatial changes in the mean velocity (i.e. mean shear) (Batchelor & Proudman Reference Batchelor and Proudman1954; Brown & Roshko Reference Brown and Roshko1974; Jiménez Reference Jiménez2013). When the flow is decomposed into a base flow ( $\boldsymbol {U}$) and fluctuations ( $\boldsymbol {u}'$), the equations of motion naturally reduce to a system comprising a linear term and nonlinear term,
 \begin{equation} \frac{\partial\boldsymbol{u}'}{\partial t} =\underbrace{\mathcal{L}(\boldsymbol{U})\boldsymbol{u}'}_{\substack{\textit{linear}\\ \textit{processes}}} + \underbrace{\boldsymbol{N}(\boldsymbol{u}')}_{\substack{\textit{nonlinear}\\ \textit{processes}}}. \end{equation}
If  $\boldsymbol {U}$ is chosen such that the volume integral of $\boldsymbol {u}'\boldsymbol {\cdot } \boldsymbol {N}$ vanishes (see §§ 2.2 and 6.1), the linear term in (1.1) is the sole source of energy for $\boldsymbol {u}'$, which explains the unceasing surge of interest in linear theories. Note that constructing (1.1) does not require invoking linearisation about $\boldsymbol {U}$ nor assuming that $\boldsymbol {u}'$ is small. We can always partition the flow into $\boldsymbol {U} + \boldsymbol {u}'$ for an arbitrary $\boldsymbol {U}$, write (1.1), refer to the linear mechanisms supported by $\mathcal {L}(\boldsymbol {U})$, and inquire their relevance in sustaining turbulence. Hence, we do not challenge here the validity of a particular linearisation. Instead, the question raised is whether the linear mechanisms supported by $\boldsymbol {U}$ (i.e. $\mathcal {L}(\boldsymbol {U})$) are useful in explaining the dynamics of $\boldsymbol {u}'$. It is clear that there exists a myriad of different flow partitions $\boldsymbol {U} + \boldsymbol {u}'$, but not all of them are meaningful to explain the dynamics of the flow. If $\boldsymbol {U}$ is chosen wisely, it has been demonstrated in many occasions that numerous features of the energy-containing scales can be elucidated from the linear dynamics in (1.1) (e.g. Reed, Saric & Arnal Reference Reed, Saric and Arnal1996; Cambon & Scott Reference Cambon and Scott1999; Schmid Reference Schmid2007; Farrell & Ioannou Reference Farrell and Ioannou2012; McKeon Reference McKeon2017). This is the case for strongly inhomogeneous environments, such as wall turbulence with large-scale pressure or body forces imposed (e.g. in the streamwise direction), and geophysical flows, in which rotation and stratification impose strong constraints on the flow (Farrell & Ioannou Reference Farrell, Ioannou, Galperin and Read2019). An additional, less glamorous, motivation for arbitrarily partitioning the flow into $\boldsymbol {U} + \boldsymbol {u}'$ (thus enabling the use of linear theories) is a matter of practicality: our current framework to analyse linear systems is well beyond the tools to understand nonlinear equations. Hence, inasmuch the linear equations meaningfully represent the physics of the problem, linear tools greatly aid the analysis and facilitate the development of prediction and control strategies.
The rationale behind the formulation and validation of a linear theory for the energy transfer between flow structures comprises four elements: (i) the existence in wall turbulence of recurrent fluid motions (or coherent structures) involved in a self-sustaining process, (ii) the selection of a base flow which (iii) enables the prediction of these coherent motions via linear theory, and (iv) a cause-and-effect framework to evaluate the presence of the linear mechanism in actual nonlinear turbulence. These four points are discussed below.
1.1. Coherent structures and self-sustaining wall turbulence
Since the experiments by Klebanoff, Tidstrom & Sargent (Reference Klebanoff, Tidstrom and Sargent1962), Kline et al. (Reference Kline, Reynolds, Schraub and Runstadler1967) and Kim, Kline & Reynolds (Reference Kim, Kline and Reynolds1971), it was realised that despite the conspicuous disorder of wall turbulence, the flow in the vicinity of walls can be apprehended as a collection of recurrent patterns, usually referred to as coherent structures (Richardson Reference Richardson1922). Of particular interest are those structures carrying most of the kinetic energy and momentum, further categorised as streaks (regions of high and low velocity aligned with the mean flow direction) and rolls/vortices (regions of rotating fluid) (Robinson Reference Robinson1991; Panton Reference Panton2001; Adrian Reference Adrian2007; Smits, McKeon & Marusic Reference Smits, McKeon and Marusic2011; Jiménez Reference Jiménez2012, Reference Jiménez2018).
Close to the wall in the so-called buffer layer, the current consensus is that these energy-containing structures are involved in a quasi-periodic self-sustaining process and that their space–time structure plays a crucial role in the maintenance of shear-driven turbulence (e.g. Kim et al. Reference Kim, Kline and Reynolds1971; Jiménez & Moin Reference Jiménez and Moin1991; Butler & Farrell Reference Butler and Farrell1993; Hamilton, Kim & Waleffe Reference Hamilton, Kim and Waleffe1995; Waleffe Reference Waleffe1997; Jiménez & Pinelli Reference Jiménez and Pinelli1999; Schoppa & Hussain Reference Schoppa and Hussain2002; Farrell & Ioannou Reference Farrell and Ioannou2012; Jiménez Reference Jiménez2012; Constantinou et al. Reference Constantinou, Lozano-Durán, Nikolaidis, Farrell, Ioannou and Jiménez2014; Farrell et al. Reference Farrell, Ioannou, Jiménez, Constantinou, Lozano-Durán and Nikolaidis2016; Farrell, Gayme & Ioannou Reference Farrell, Gayme and Ioannou2017a). The self-sustaining process is based on the emergence of streaks from wall-normal ejections of fluid (Landahl Reference Landahl1975) followed by the meandering and breakdown of the newborn streaks (Swearingen & Blackwelder Reference Swearingen and Blackwelder1987; Hall & Smith Reference Hall and Smith1991; Waleffe Reference Waleffe1995, Reference Waleffe1997; Schoppa & Hussain Reference Schoppa and Hussain2002; Kawahara et al. Reference Kawahara, Jiménez, Uhlmann and Pinelli2003). The cycle is restarted by the generation of new vortices from the perturbations created by the disrupted streaks. The interwoven relation between vortices and streaks was demonstrated by Jiménez & Pinelli (Reference Jiménez and Pinelli1999), who showed that damping out either of them inevitably interrupts the turbulence cycle. A similar but more disorganised scenario is hypothesised to occur for the larger energy-containing structures further away from the wall within the logarithmic layer (e.g. Flores & Jiménez Reference Flores and Jiménez2010; Hwang & Cossu Reference Hwang and Cossu2011; Cossu & Hwang Reference Cossu and Hwang2017; Lozano-Durán, Bae & Encinar Reference Lozano-Durán, Bae and Encinar2019), although the focus of the present work is on the buffer layer (i.e. low Reynolds numbers). Linear theories have been instrumental in unfolding and explaining various stages of the self-sustaining process, and the existence of coherent structures has aided the selection of particular base flows to linearise the equations of motion.
The self-sustaining nature of wall turbulence has also been investigated from the viewpoint of dynamical-systems theory. In this framework, the spatio-temporal structure of turbulence is thought of as a low-dimensional manifold around which the dynamical system spends a substantial fraction of time (Jiménez Reference Jiménez1987). According to the dynamical-systems perspective, the simplest description of turbulence is then given by a collection of ‘invariant solutions’ (equilibrium states and periodic orbits) embedded in a high-dimensional turbulent attractor (Kawahara, Uhlmann & van Veen Reference Kawahara, Uhlmann and van Veen2012). The first dynamical-system investigations of turbulence in shear flows began with the discovery of nonlinear equilibrium states, referred to as ‘exact coherent structures’, of Couette flow (Nagata Reference Nagata1990). Since then, there have been multiple descriptions of such equilibrium states in shear flows in channels and pipes, often involving unstable travelling waves (e.g. Kawahara & Kida Reference Kawahara and Kida2001; Waleffe Reference Waleffe2001; Faisst & Eckhardt Reference Faisst and Eckhardt2003; Wedin & Kerswell Reference Wedin and Kerswell2004; Gibson, Halcrow & Cvitanović Reference Gibson, Halcrow and Cvitanović2009; van Veen & Kawahara Reference van Veen and Kawahara2011; Kreilos & Eckhardt Reference Kreilos and Eckhardt2012; Park & Graham Reference Park and Graham2015; Hwang, Willis & Cossu Reference Hwang, Willis and Cossu2016). Particularly relevant for the study of self-sustaining processes is the discovery of time-periodic solutions by Kawahara & Kida (Reference Kawahara and Kida2001) and later by others (e.g. Toh & Itano Reference Toh and Itano2003; Viswanath Reference Viswanath2007; Gibson, Halcrow & Cvitanović Reference Gibson, Halcrow and Cvitanović2008; Kawahara et al. Reference Kawahara, Uhlmann and van Veen2012; Willis, Cvitanović & Avila Reference Willis, Cvitanović and Avila2013). These time-periodic solutions were first found for plane Couette flow and exhibited a full regeneration cycle comprising the formation and breakdown of streamwise vortices and low-velocity streaks. The dynamical-system approach has also provided the grounds to conceive turbulence as a superposition of invariant solutions and their manifolds, which would constitute the skeleton of flow trajectories in turbulence (Auerbach et al. Reference Auerbach, Cvitanović, Eckmann, Gunaratne and Procaccia1987; Cvitanović Reference Cvitanović1991). Thus, the simplicity provided by invariant solutions facilitates the inspection for linear processes at a given stage in the self-sustaining cycle. However, while realistic turbulence does share similarities with these exact coherent structures, the latter have been restricted to very low Reynolds numbers. The actual dynamics of wall turbulence are significantly more complex and chaotic, and the relationship of realistic high-Reynolds-number turbulent flows with the exact-coherent-states interpretation remains unsettled. In the present work, we show that turbulence statistics might be recovered by ensemble averaging a collection of solutions in the spirit of Cvitanović (Reference Cvitanović1991), although in our case these solutions are not exact coherent structures.
Another theoretical nonlinear framework to describe self-sustaining processes and transition to turbulence has been proposed by Hall & Smith (Reference Hall and Smith1988) and Hall & Smith (Reference Hall and Smith1991) in terms of vortex–wave interactions (VWI). The approach has been shown to be the equivalent high-Reynolds-number representation of the exact coherent structures discussed above (Wang, Gibson & Waleffe Reference Wang, Gibson and Waleffe2007; Hall & Sherwin Reference Hall and Sherwin2010). Vortex–wave interactions theory involves an intricately delicate balance between a neutrally stable wave, a roll and a streak. According to VWI, a neutrally stable wave drives a streamwise-uniform roll by forcing the critical layer of the streamwise-averaged mean flow. The roll produces streaks through the lift-up effect by interacting with a neutrally stable mean flow (averaged in streamwise and spanwise directions). Finally, the streaks generate a spanwise-varying base flow that supports the neutrally stable wave, closing the cycle. Subsequent developments of the VWI theory include extensions to multiscale motions consistent with the logarithmic layer (Hall Reference Hall2018). Other descriptions of self-sustaining turbulence in the vein of vortex–wave interactions are the studies by Deguchi, Hall & Walton (Reference Deguchi, Hall and Walton2013) and Deguchi & Hall (Reference Deguchi and Hall2015), the high-Reynolds-number theory by Ozcakir et al. (Reference Ozcakir, Tanveer, Hall and Overman2016); Ozcakir, Hall & Tanveer (Reference Ozcakir, Hall and Tanveer2019), and the semi-analytic model by Chini et al. (Reference Chini, Montemuro, White and Klewicki2017) and Montemuro et al. (Reference Montemuro, White, Klewicki and Chini2020); the latter devoted to the formation and maintenance of uniform momentum zones and interlaced vortical fissures studied by asymptotic analysis. While the theories above could provide a plausible explanation for how turbulence self-sustains, we are still lacking direct cause-and-effect evidence regarding whether one or a combination of the abovementioned mechanisms are actually at work in realistic turbulent flows.
1.2. Base flow
As shown in (1.1), formulating a linear theory entails the partition of the flow into two components: a base flow  $\boldsymbol {U}$ (which might be space- and/or time-dependent), and fluctuations (or perturbations) $\boldsymbol {u}'$ about that base flow. In the fluid-stability community, it is customary to use as base flow a solution of the Navier–Stokes equations and rigorously linearise the equations about that state. The resulting analysis is then valid for small-amplitude perturbations. On the other hand, the turbulence community has commonly used as base flow a mean velocity defined by some averaging procedure (which is not a solution of the Navier–Stokes equations) and then loosely rely on the linear stability theory to analyse the response of perturbations (which are generally not small in amplitude) under the assumption of frozen-in-time base flow. This is obviously far from rigorous and some authors have found questionable the use of linear stability theory by the turbulence community (further discussed in § 6.5). Here, we overcome this hindrance by considering a cause-and-effect analysis on the full nonlinear system in (1.1). First, we refer to base flow $\boldsymbol {U}$ as any arbitrary reference flow state to separate the flow into $\boldsymbol {U} + \boldsymbol {u}'$. Second, as discussed above for (1.1), we can always partition the equations for $\boldsymbol {u}'$ into a linear and nonlinear component and inquire the necessity of the linear mechanisms in $\mathcal {L}(\boldsymbol {U})$ to sustain the flow. The usefulness of the base flow $\boldsymbol {U}$ is measured by to what extent the dynamics of $\boldsymbol {u}'$ are explained by the linear mechanisms supported by $\boldsymbol {U}$, which circumvents the problem of linearisation. Even if the classic hydrodynamic linear-stability-theory is not rigorously applicable to our base flows, we still employ the terminology ‘instability’ to refer to the linear growth provided by $\mathcal {L}(\boldsymbol {U})$.
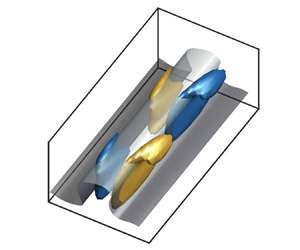
We now turn our attention to how to choose  $\boldsymbol {U}$ when the flow is turbulent. Historically, the existence of coherent structures in wall turbulence has motivated the selection of particular base flows, such that the linear dynamics supported by these base flows is the seed for the inception of new coherent structures consistent with observations in real turbulence. The resulting distorted flow might be used again as a base flow, which describes the generation of new coherent structures and so forth. In this manner, the ultimate cause maintaining turbulence is conceptualised as the energy transfer from the base flow to the fluctuating flow, as sketched in figure 1. The selection of the base flow stands as the most important decision to formulate linear theory for sustaining turbulent fluctuations, as the physical mechanisms ascribed to the linear component of (1.1) depend crucially on this choice.
Schematic of the energy transfer from the base flow  $\boldsymbol {U} = U(y,z,t)\hat {\boldsymbol {x}}$ to the fluctuating velocities $\boldsymbol {u}'$. The energy transfer (red arrow) from $\boldsymbol {U}$ to $\boldsymbol {u}'$ can be investigated via the linear dynamics of the governing equation of $\boldsymbol {u}'$. The cycle is closed by the nonlinear feedback from $\boldsymbol {u}'$ back to $\boldsymbol {U}$ (grey arrow).

Hereafter, we consider the turbulent flow over a flat plate where  $x$,
$x$,  $y$ and $z$ are the streamwise, wall-normal and spanwise directions, respectively; see figure 1. Common choices for the base flow are the average of the streamwise velocity $u$ over homogeneous directions ( $x$ and $z$) and time ( $t$), denoted by $\langle u \rangle _{xzt}$, or only over $x$ or $z$ in some small (minimal) domain, denoted by $\langle u \rangle _{x}$ and $\langle u \rangle _{z}$, respectively. The notation $\langle u \rangle _{i,j,\ldots }$ denotes averaging over the coordinates $i,j,\ldots$, and it is formally introduced in § 2. In turbulent boundary layers and channels, the $y$-dependent base flow $\langle u \rangle _{xzt}$ has been successful in predicting the formation of streaks, a process sometimes referred to as primary instability (or, more generally, primary linear process). The resulting streaky flow (now represented by $\langle u \rangle _{x}$) can be utilised as the new base flow to generate the subsequent vortices or, more generally, disorganised fluctuations. This process is usually referred to as secondary instability (or, here, as secondary linear process). We next survey the main linear theories associated with these two sets of linear processes.
1.3. Linear theories of self-sustaining wall turbulence
Several linear mechanisms have been proposed as plausible scenarios to rationalise the transfer of energy from the large-scale mean flow to the fluctuating velocities. We discuss below the linear processes ascribed to two of the most widely used base flows, namely, the  $y$-dependent streakless mean velocity profile $\langle u \rangle _{xzt}$, and the $y-z$-dependent time-varying streaky base flow $\langle u \rangle _{x}$. The predictions by the two base flows should not be considered contradictory but rather complementary, as the former might be thought as the cause of the latter and vice versa.
In the primary linear process, it is generally agreed that the linear dynamics about  $\langle u \rangle _{xzt}$ is able to explain the formation of the streaks $U_{{streak}}=\langle u \rangle _{x} - \langle u \rangle _{xzt}$. The process involves the redistribution of fluid near the wall by streamwise vortices leading to the formation of streaks through the lift-up mechanism (Landahl Reference Landahl1975; Lee, Kim & Moin Reference Lee, Kim and Moin1990; Butler & Farrell Reference Butler and Farrell1993; Farrell & Ioannou Reference Farrell and Ioannou1993a; Kim & Lim Reference Kim and Lim2000; Jiménez Reference Jiménez2012). In this case, the base flow, while being exponentially stable, supports the growth of perturbations for a period of time due to the non-normality of the linear operator about that very base flow; a process referred to as non-modal transient growth (e.g. Farrell Reference Farrell1988; Gustavsson Reference Gustavsson1991; Butler & Farrell Reference Butler and Farrell1993; Trefethen et al. Reference Trefethen, Trefethen, Reddy and Driscoll1993; Farrell & Ioannou Reference Farrell and Ioannou1996; Del Álamo & Jiménez Reference Del Álamo and Jiménez2006; Schmid Reference Schmid2007; Cossu, Pujals & Depardon Reference Cossu, Pujals and Depardon2009). Other studies suggest that the generation of streaks is due to the structure-forming properties of the linearised Navier–Stokes operator, independent of any organised vortices (Chernyshenko & Baig Reference Chernyshenko and Baig2005), or due to the interaction of the background free-stream turbulence and the roll-streak structures (Farrell, Ioannou & Nikolaidis Reference Farrell, Ioannou and Nikolaidis2017b), but the non-modal nature of the linear operator is still crucially invoked. Input–output analysis of the linearised Navier–Stokes equations has also been successful in characterising the non-modal response of the base flow $\langle u \rangle _{xzt}$ (Farrell & Ioannou Reference Farrell and Ioannou1993b; Jovanović & Bamieh Reference Jovanović and Bamieh2005; Hwang & Cossu Reference Hwang and Cossu2010a; Zare et al. Reference Zare, Jovanović and Georgiou2017; Ahmadi et al. Reference Ahmadi, Valmorbida, Gayme and Papachristodoulou2019; Jovanović Reference Jovanović2021). The input–output approach combines the linearised Navier–Stokes equations with harmonic or stochastic forcing (white or coloured in time) to qualitatively predict structural features of turbulent shear flows. Similarly, resolvent analysis (McKeon & Sharma Reference McKeon and Sharma2010; McKeon Reference McKeon2017) provides pairs of response and nonlinear-forcing modes consistent with the linear Navier–Stokes operator with respect to the base flow $\langle u \rangle _{xzt}$ and enables the identification of the most amplified energetic motions in wall turbulent flows. A key aspect of the latter energy transfer is the formation of critical layers or regions where the wave velocity is equal to the base flow (see also Moarref et al. Reference Moarref, Sharma, Tropp and McKeon2013). Both input–output and resolvent analysis formulate the problem in the frequency domain, and the sustained response of the perturbations should be understood through a persistent forcing in time. These amplification mechanisms can be classified as resonant or pseudoresonant, depending on whether the amplification of perturbations is associated with modal instabilities or non-normality of the operator, respectively. Interestingly, the flow structures responsible for the energy transfer obtained in the frequency domain are remarkably similar to the structures identified with non-normal transient growth posed as an initial value problem (Hwang & Cossu Reference Hwang and Cossu2010b; Symon et al. Reference Symon, Rosenberg, Dawson and McKeon2018), i.e. the genesis of streaks from cross-flow perturbation via a lift-up mechanism. In the present work, we favour the time-domain formulation over the frequency-domain approach as the former is easily understood as a sequence of events, which facilitates the cause-and-effect analysis of self-sustaining turbulence pursued here.
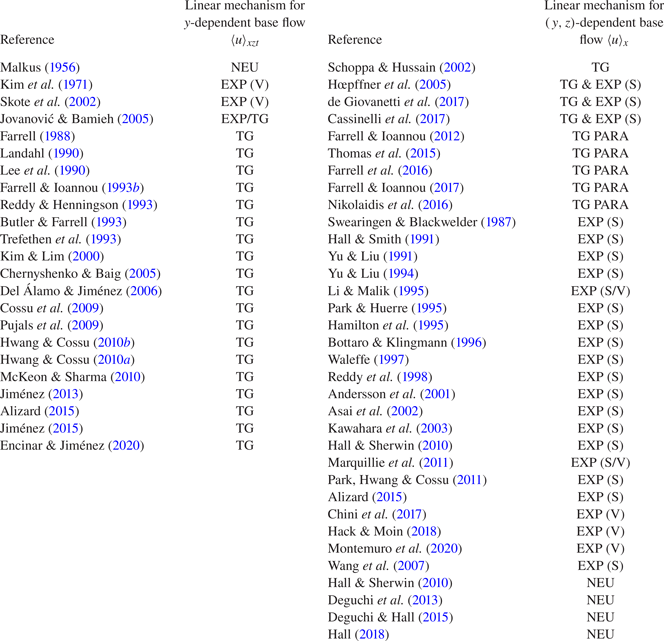
The scenarios described in the paragraph above pertain to the study of  $y$-dependent base flows and, as such, are concerned with primary linear processes. The summary of studies in the left column of table 1 shows that, except for a handful of studies performed under very particular conditions, most investigations advocate for transient growth as the main cause for the genesis of the streamwise streaks via energy transfer from $\langle u \rangle _{xzt}$ to $U_{{streak}}$. Indeed, the few works which do not support the transient growth are from the 1950s or performed in a different context, such as laminar–turbulent transition. There is hardly any controversy regarding the formation of the streaks, and here we focus on the linear mechanisms underpinned by $\langle u \rangle _{x}$ once the streak is formed, i.e. secondary linear processes.
Proposed linear mechanisms responsible for the energy transfer from the base flow to fluctuations for: left columns,  $y$-dependent base flows (primary linear process); right columns, $(y,z)$-dependent base flows (secondary linear process). Mechanisms are abbreviated as: EXP, exponential instability; TG, transient growth; TG PARA, transient growth assisted by parametric instability; NEU, modally neutral. For EXP, V and S refer to varicose and sinuous instabilities, respectively. The work by Hack & Moin (Reference Hack and Moin2018) considered a $(x,y,z)$-dependent base flow, but it was included in the right columns as it is devoted to the study of secondary instability. The label TG for studies formulated in the frequency domain should be understood as pseudoresonant amplification of perturbations due to non-normality of the linear operator. Swearingen & Blackwelder (Reference Swearingen and Blackwelder1987), Yu & Liu (Reference Yu and Liu1991, Reference Yu and Liu1994), Hall & Smith (Reference Hall and Smith1991), Bottaro & Klingmann (Reference Bottaro and Klingmann1996), Li & Malik (Reference Li and Malik1995) and Park & Huerre (Reference Park and Huerre1995) study the secondary instability in Taylor–Görtler vortices. Asai, Minagawa & Nishioka (Reference Asai, Minagawa and Nishioka2002), Bottaro & Klingmann (Reference Bottaro and Klingmann1996), Park & Huerre (Reference Park and Huerre1995), Reddy & Henningson (Reference Reddy and Henningson1993), Hœpffner, Brandt & Henningdon (Reference Hœpffner, Brandt and Henningdon2005), Jovanović & Bamieh (Reference Jovanović and Bamieh2005) and Wang et al. (Reference Wang, Gibson and Waleffe2007) investigate laminar-to-turbulent transition and suggest that the mechanism might be at play in the turbulent regime. The works by Kim et al. (Reference Kim, Kline and Reynolds1971), Swearingen & Blackwelder (Reference Swearingen and Blackwelder1987), Bottaro & Klingmann (Reference Bottaro and Klingmann1996) and Asai et al. (Reference Asai, Minagawa and Nishioka2002) are laboratory experiments, whereas the remainder are numerical investigations. Farrell & Ioannou (Reference Farrell and Ioannou2012), Thomas et al. (Reference Thomas, Farrell, Ioannou and Gayme2015), Farrell et al. (Reference Farrell, Ioannou, Jiménez, Constantinou, Lozano-Durán and Nikolaidis2016) and Nikolaidis et al. (Reference Nikolaidis, Farrell, Ioannou, Gayme, Lozano-Durán and Jiménez2016) are carried out in the context of restricted nonlinear Navier–Stokes. Additionally, some works focus on the buffer layer, logarithmic layer or outer layer. The table highlights one or two linear mechanisms from each reference, but many works acknowledge the presence of other mechanisms which are not mentioned in the table. The reader is referred to each particular work for details.
Motivated by the streamwise-elongated structure of the streaks, we take our base flow  $\boldsymbol {U}$ to consist of the instantaneous streamwise-averaged velocity $U(y,z,t) = \langle u \rangle _{x}$ in the streamwise direction of a minimal channel domain (see § 2) with zero wall-normal and spanwise flow, i.e. $\boldsymbol {U} = (U,0,0)$. Our choice is supported by previous studies in the literature, and most of the works reported in table 1 (right column) conducted their analysis by linearising the equations of motion about $U(y,z,t)$. Yet, other alternative base flows might be also justified a priori, and one of the goals here is to investigate whether $U(y,z,t)$ is a meaningful choice to describe the energy transfer from the large scales to the fluctuating flow.
The linear mechanisms supported by  $U(y,z,t)$ can be categorised into three groups: (i) modal instability of the mean streamwise flow, (ii) non-modal transient growth, and (iii) non-modal transient growth assisted by parametric instability of the time-varying base flow. Other classifications are possible, and ours is motivated by the terminology adopted in previous works. Table 1 (right columns) compiles the literature in favour of one or other mechanism. The table, while not an exhaustive compilation of existing works on the topic, hints at a lack of consensus on which is the prevailing linear mechanism responsible for the energy transfer from the streaky mean flow to the fluctuations, or if any, it implies that the dominant idea is that exponential instability is the one responsible. We show in this work that the latter is not the case; modal instabilities of the mean streamwise flow are not crucial for self-sustaining turbulence. Next, we briefly describe mechanisms (i), (ii) and (iii).
In mechanism (i), it is hypothesised that the energy is transferred from the mean flow  $U(y,z,t)$ to the fluctuating flow through modal instability in the form of strong inflectional variations in the spanwise direction (Hamilton et al. Reference Hamilton, Kim and Waleffe1995; Waleffe Reference Waleffe1997; Karp & Cohen Reference Karp and Cohen2017) or wall-normal direction (Chini et al. Reference Chini, Montemuro, White and Klewicki2017; Montemuro et al. Reference Montemuro, White, Klewicki and Chini2020), corrugated vortex sheets (Kawahara et al. Reference Kawahara, Jiménez, Uhlmann and Pinelli2003), or intense localised patches of low-momentum fluid (Andersson et al. Reference Andersson, Brandt, Bottaro and Henningson2001; Hack & Moin Reference Hack and Moin2018). These exponential instabilities are markedly robust at all times (Lozano-Durán, Karp & Constantinou Reference Lozano-Durán, Karp and Constantinou2018) and, therefore, their excitation has been proposed to be the mechanism that replenishes the perturbation energy of the turbulent flow (Hamilton et al. Reference Hamilton, Kim and Waleffe1995; Waleffe Reference Waleffe1997; Andersson et al. Reference Andersson, Brandt, Bottaro and Henningson2001; Kawahara et al. Reference Kawahara, Jiménez, Uhlmann and Pinelli2003; Marquillie et al. Reference Marquillie, Ehrenstein and Laval2011; Hack & Zaki Reference Hack and Zaki2014; Hack & Moin Reference Hack and Moin2018). Other studies have speculated that the streaky base flow $U(y,z,t)$ might originate from the primary Taylor–Görtler instability. In this case, the varying wall shear induced by large-scale structures gives rise to sufficient streamline curvature in $x$ to trigger the instability (Brown & Thomas Reference Brown and Thomas1977; Phillips, Wu & Lumley Reference Phillips, Wu and Lumley1996; Saric, Reed & White Reference Saric, Reed and White2003). Consequently, it has also been hypothesised that the following secondary exponential instability of the Taylor–Görtler base flow is the mechanism to generate turbulence fluctuations (Swearingen & Blackwelder Reference Swearingen and Blackwelder1987; Yu & Liu Reference Yu and Liu1991, Reference Yu and Liu1994; Hall & Smith Reference Hall and Smith1991; Li & Malik Reference Li and Malik1995; Park & Huerre Reference Park and Huerre1995; Bottaro & Klingmann Reference Bottaro and Klingmann1996; Karp & Hack Reference Karp and Hack2018). Exponential instabilities above are commonly classified according to their symmetries as varicose and sinuous. The varicose instability (symmetric in the streamwise and wall-normal velocities) is commonly associated with inflection points in the base flow along the wall-normal direction, while the sinuous instability (symmetric in the spanwise velocity) relates to inflection points in the spanwise directions (Park & Huerre Reference Park and Huerre1995; Schmid & Henningson Reference Schmid and Henningson2012). In all of the scenarios above, the exponential instability of the streak is thought to be central to the maintenance of wall turbulence. Additionally, the modal character of the base flow also plays a key role in the VWI theory, but in this case it is not necessary for base flows to be unstable for nonlinear states to develop. Instead, it is postulated that the regeneration cycle is supported by the interaction of a roll with the neutrally stable mean streamwise flow (Hall & Smith Reference Hall and Smith1991; Deguchi et al. Reference Deguchi, Hall and Walton2013; Hall Reference Hall2018).
Mechanism (ii), transient growth, involves the redistribution of energy from the streak to the fluctuations via transient algebraic amplification. The transient growth scenario of the streaky base flow  $U(y,z,t)$ (not to be confused with the transient growth of $\langle u \rangle _{xzt}(y)$ discussed above) gained popularity since the work by Schoppa & Hussain (Reference Schoppa and Hussain2002), who argued that transient growth may be the most relevant mechanism not only for streak formation but also for their eventual breakdown. Schoppa & Hussain (Reference Schoppa and Hussain2002) showed that most streaks detected in actual wall-turbulence simulations are indeed exponentially stable for the set of wavenumbers considered. Hence, the loss of stability of the streaks would be better explained by the transient growth of perturbations that would lead to vorticity sheet formation and nonlinear saturation. The findings by Schoppa & Hussain (Reference Schoppa and Hussain2002) have long been criticised, and the absence of unstable streaks can be also interpreted as an indication that instability is important, as the unstable streaks break fast and are harder to observe. Other criticism argues that, far from the wall, streaks might not provide a reservoir of energy large enough to sustain the flow fluctuations (Jiménez Reference Jiménez2018). Some authors have further argued that distinguishing between streak transient growth and streak modal instability would be virtually impossible, as both emerge almost concurrently during the streak breakdown (Hœpffner et al. Reference Hœpffner, Brandt and Henningdon2005; Cassinelli et al. Reference Cassinelli, de Giovanetti and Hwang2017; de Giovanetti et al. Reference de Giovanetti, Sung and Hwang2017), and, hence, both are driving mechanisms of self-sustaining turbulence.
Finally, mechanism (iii), transient growth assisted by parametric instability, has been advanced in recent years by Farrell, Ioannou & coworkers (Farrell & Ioannou Reference Farrell and Ioannou1999, Reference Farrell and Ioannou2017, Reference Farrell and Ioannou2012; Farrell et al. Reference Farrell, Ioannou, Jiménez, Constantinou, Lozano-Durán and Nikolaidis2016, Reference Farrell, Gayme and Ioannou2017a; Nikolaidis et al. Reference Nikolaidis, Farrell, Ioannou, Gayme, Lozano-Durán and Jiménez2016; Bretheim, Meneveau & Gayme Reference Bretheim, Meneveau and Gayme2018). They adopted the perspective of statistical state dynamics (SSD) to develop a tractable theory for the maintenance of wall turbulence. Within the SSD framework, the perturbations are maintained by an essentially time-dependent, parametric instability of the base flow. The concept of ‘parametric instability’ refers here to perturbation growth that is inherently caused by the time dependence of the base flow  $U$. The self-sustaining mechanism proposed by SSD still relies on the highly non-normal streamwise roll and streak structure. However, it differs from other mechanisms above in that it requires the time variations of $U$ for the growth of perturbations to be supported. Furthermore, it implies that mechanisms based on critical layers (e.g. Hall & Smith Reference Hall and Smith1988, Reference Hall and Smith1991; Hall & Sherwin Reference Hall and Sherwin2010) and modal or non-modal growth processes alone (e.g. Waleffe Reference Waleffe1997; Schoppa & Hussain Reference Schoppa and Hussain2002) are not responsible for most of the energy transfer from $U$ to $\boldsymbol {u}'$, as they ignore both the intrinsic time dependence of the base flow or the non-normal aspect of the linear dynamics.
1.4. Cause-and-effect of linear mechanisms
The scenarios (i), (ii) and (iii), although consistent with the observed turbulence structure (Robinson Reference Robinson1991; Panton Reference Panton2001; Jiménez Reference Jiménez2018), are rooted in simplified theoretical arguments. It remains to establish whether self-sustaining turbulence follows predominantly one of the abovementioned mechanisms, or a combination of them. One major obstacle to assess linear theories arises from the lack of tools in turbulence research that resolve the cause-and-effect dilemma and unambiguously attributes a set of observed dynamics to well-defined causes. This brings to attention the issue of causal inference, which is a central theme in many scientific disciplines but is barely discussed in turbulence research with the exception of a handful of works (Tissot et al. Reference Tissot, Lozano-Durán, Jiménez, Cordier and Noack2014; Liang & Lozano-Durán Reference Liang and Lozano-Durán2017; Bae, Encinar & Lozano-Durán Reference Bae, Encinar and Lozano-Durán2018a; Lozano-Durán et al. Reference Lozano-Durán, Bae and Encinar2019). It is via cause-and-effect relationships that we gain understanding of a given phenomenon, namely, that we are able to shape the course of events by deliberate actions or policies (Pearl Reference Pearl2009). It is for that reason that causal thinking is so pervasive. Typically, causality is inferred from a priori analysis of frozen flow snapshots or, at most, by time correlation between pairs of signals extracted from the flow. However, elucidating causality, which inherently occurs over the course of time, is challenging using a frozen-analysis approach, and time correlations lack the directionality and asymmetry required to guarantee causation (i.e. correlation does not imply causation) (Beebee, Hitchcock & Menzies Reference Beebee, Hitchcock and Menzies2012). Recently, Lozano-Durán et al. (Reference Lozano-Durán, Bae and Encinar2019) introduced a probabilistic measure of causality to study self-sustaining wall turbulence based on the Shannon entropy that relies on a non-intrusive framework for causal inference. In the present work, we provide a complementary ‘intrusive’ viewpoint.
Here, we evaluate the contribution of different linear mechanisms via direct numerical simulation of channel flows with constrained energy extraction from the streamwise-averaged mean flow. To that end, we modify the Navier–Stokes equations to suppress the causal link for a targeted linear mechanism, while maintaining a fully nonlinear system. This approach falls within the category of ‘instantiated’ causality, i.e. intrusively perturbing a system (cause) and observing the consequences (effect) (Pearl Reference Pearl2009). In our case, altering the system has the benefit of providing a clear cause-and-effect assessment of the importance of each linear mechanism implicated in sustaining the flow. These ‘conceptual numerical experiments’ have been long practised in turbulence research and many notorious examples can be found in the literature. However, the connection between conceptual numerical experiments and causality has been loose. In the present work, we aim to promote the formalisation and systematic use of cause-and-effect analysis to solve new and long-standing unsettled problems in fluid mechanics.
The study is organised as follows: § 2 contains the numerical details of the turbulent channel flow simulations. The statistics of interest for wall turbulence are reviewed in § 3. In § 4 we briefly outline the linear theories of self-sustaining wall turbulence and evaluate a priori their potential relevance for sustaining the flow. In § 5 we discuss the discovery of cause-and-effect relationships by interventions in the system. The actual relevance of different linear mechanisms from a cause-and-effect perspective is investigated in § 6. The section is further subdivided into subsections devoted to the cause-and-effect of exponential instabilities and transient growth with and without parametric instability. Finally, we conclude in § 7.
2. Minimal turbulent channel flows units
2.1. Numerical experiments
To investigate the role of different linear mechanisms, we perform direct numerical simulations of incompressible turbulent channel flows driven by a constant mean pressure gradient. Hereafter, the streamwise, wall-normal and spanwise directions of the channel are denoted by  $x$,
$x$,  $y$ and $z$, respectively, the corresponding flow velocity components by $u$,
$u$,  $v$,
$v$,  $w$, and pressure by $p$. The density of the fluid is $\rho$, the kinematic viscosity of the fluid is $\nu$, and the channel height is $h$. The wall is located at $y=0$, where no-slip boundary conditions apply, whereas free stress and no penetration conditions are imposed at $y=h$. The streamwise and spanwise directions are periodic.
The simulations are characterised by the friction Reynolds number,  ${Re}_{\tau }$, defined as the ratio of the channel height to the viscous length scale $\delta _v = \nu /u_{\tau }$, where $u_{\tau }$ is the characteristic velocity based on the mean skin friction at the wall $u_{\tau }^2 \equiv \nu \langle \partial u(x,0,z,t)/ \partial y\rangle _{xzt}$. Here, the Reynolds number is ${Re}_{\tau } = h/\delta _v \approx 180$. The streamwise, wall-normal and spanwise sizes of the computational domain are $L_x^+ \approx 337$, $L_y^+ \approx 186$ and $L_z^+ \approx 168$, respectively, where the superscript $+$ denotes quantities scaled by $\nu$ and $u_{\tau }$. Jiménez & Moin (Reference Jiménez and Moin1991) showed these ‘minimal channels’ contain an elementary turbulent flow unit comprised of a single streamwise streak and a pair of staggered quasi-streamwise vortices, that reproduce the dynamics of the flow in larger domains. Hence, the current numerical experiment isolates the few, most relevant, coherent structures involved in self-sustaining turbulence in the buffer layer. It also provides an ideal testbed for studying linear mechanisms, as it enables the identification of a meaningful base flow for these elementary coherent structures. In appendix A we assess the sensitivity of the key results presented in this study to changes in the domain extent ( $L_x$ and $L_z$). We find that our conclusions still hold when the size of the computational domain is doubled in each direction.
We integrate the incompressible Navier–Stokes equations
 \begin{gather} \frac{\partial\boldsymbol{u}}{\partial t} = - \boldsymbol{u} \boldsymbol{\cdot} \boldsymbol{\nabla} \boldsymbol{u} - \frac{1}{\rho}\boldsymbol{\nabla} p + \nu \nabla^2 \boldsymbol{u} + \boldsymbol{f}, \end{gather}
 \begin{gather}\boldsymbol{\nabla} \boldsymbol{\cdot} \boldsymbol{u} = 0, \end{gather}
with  $\boldsymbol {u} {\stackrel {\textrm {def}}{=}} (u,v,w)$ and $\boldsymbol {f} = (u_{\tau }^2/h,0,0)$.
The simulations are performed with a staggered, second-order, finite differences scheme (Orlandi Reference Orlandi2000) and a fractional-step method (Kim & Moin Reference Kim and Moin1985) with a third-order Runge–Kutta time-advancing scheme (Wray Reference Wray1990). The solution is advanced in time using a constant time step chosen appropriately so that the Courant–Friedrichs–Lewy condition is below 0.5. The code has been presented in previous studies on turbulent channel flows (Lozano-Durán & Bae Reference Lozano-Durán and Bae2016; Bae et al. Reference Bae, Lozano-Durán, Bose and Moin2018b, Reference Bae, Lozano-Durán, Bose and Moin2019). In addition, we performed various numerical experiments (summarised in the second column of table 2) in which we time advance two sets of equations: one for the base flow  $\boldsymbol {U}$ and one for the fluctuations $\boldsymbol {u}'$. In this manner, we are able to independently control the dynamics of $\boldsymbol {U}$ and $\boldsymbol {u}'$. We discuss in detail these additional experiments in § 6.
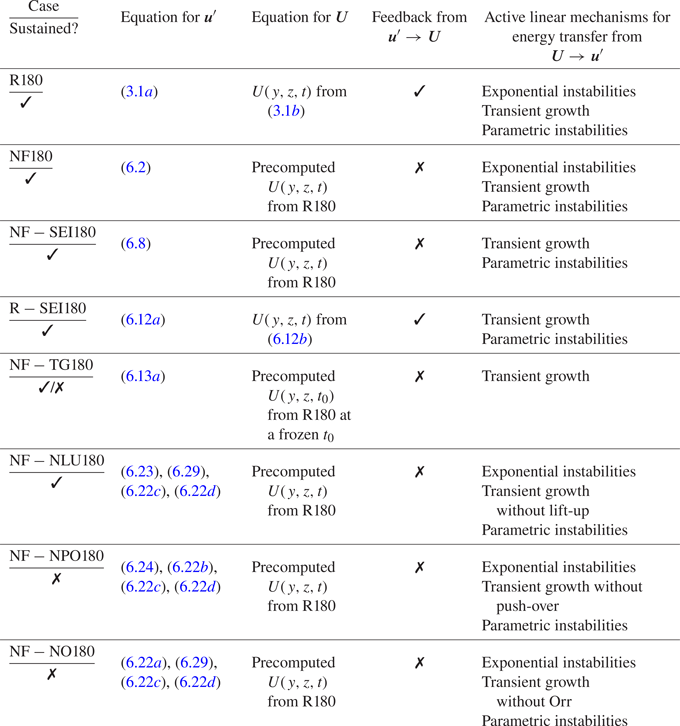
List of cases of turbulent channel flows with and without constrained linear mechanisms. The friction Reynolds number is  ${Re}_{\tau } \approx 180$ for all cases. The cases are labelled following the nomenclature: R, regular wall turbulence with feedback $\boldsymbol {U}\rightarrow \boldsymbol {u}'$ allowed; NF, no-feedback from $\boldsymbol {U}\rightarrow \boldsymbol {u}'$ allowed; SEI, suppressed exponential instabilities; TG, only transient growth without exponential nor parametric instabilities; NLU, no linear lift-up of the streak; NPO, no linear push-over of the streak; NO, no linear Orr of the streak.
The streamwise and spanwise grid resolutions are  $\Delta x^+\approx 6.5$ and $\Delta z^+\approx 3.3$, respectively, and the minimum and maximum wall-normal resolutions are $\Delta y_{{min}}^+\approx 0.2$ and $\Delta y_{{max}}^+\approx 6.1$. The corresponding number of grid points in $x$,
$x$,  $y$ and $z$ are $64 \times 90 \times 64$, respectively. All the simulations presented here were run for at least $300h/u_{\tau }$ units of time after transients. This time period is orders of magnitude longer than the typical lifetime of individual energy-containing eddies (Lozano-Durán & Jiménez Reference Lozano-Durán and Jiménez2014), and allows us to collect meaningful statistics of the self-sustaining cycle.
2.2. Base flow
We partition the flow into fluctuating velocities  $\boldsymbol {u}' {\stackrel {\textrm {def}}{=}} (u', v', w')$ and base flow $\boldsymbol {U}$, defined as the time-varying mean streamwise velocity $\boldsymbol {U} {\stackrel {\textrm {def}}{=}} (U, 0, 0)$, where
 \begin{equation} U(y, z, t) {\stackrel{\textrm{def}}{=}} \langle u \rangle_x = \frac{1}{L_x} \int_{0}^{L_x} u(x,y,z,t) \,\mathrm{d}\kern0.05em x, \end{equation}
such that  $u' {\stackrel {\textrm {def}}{=}} u - U$, $v' {\stackrel {\textrm {def}}{=}} v$ and $w' {\stackrel {\textrm {def}}{=}} w$. Hereafter, $\langle \boldsymbol {\cdot } \rangle _{i,j,k,\ldots }$ denotes averaging over the directions (or time) $i$,
$i$,  $j$,
$j$,  $k$,…, for example,
 \begin{equation} \langle u \rangle_{xzt} = \frac{1}{L_x L_z T_s} \int_{0}^{L_x}\int_{0}^{L_z}\int_{0}^{T_s} u(x,y,z,t) \, \mathrm{d}t\,\mathrm{d}z\,\mathrm{d}\kern0.05em x, \end{equation}
where  $T_s$ is a time horizon long enough to remove any time fluctuations. Figure 2 illustrates this flow decomposition and figure 3 depicts three typical snapshots of the base flow defined in (2.2). Note that because we are using a minimal box for the channel, only a single energy-containing eddy fits in the domain. Hence, $U$ computed in minimal boxes is a meaningful base flow ‘felt’ by individual flow structures. This would not be the case in larger domains in which the effect of the multiple structures present in the flow cancels out and does not contribute to $U$.
$U$.
Decomposition of the instantaneous flow into a streamwise mean base flow and fluctuations. Instantaneous isosurface of streamwise velocity for (a) the total flow  $u$, (b) the streak base flow $U$ and (c) the absolute value of the fluctuations $|u'|$. The values of the isosurfaces are 0.6 (a,b) and 0.1 (c) of the maximum streamwise velocity. Shading represents the distance to the wall from dark ( $y=0$) to light ( $y=h$). The arrow in panel (a) indicates the mean flow direction. Results for case R180.

Examples of base flow, defined as  $U(y,z,t) {\stackrel {\textrm {def}}{=}} \langle u \rangle _x$, for a turbulent channel flow at ${Re}_{\tau }\approx 180$ (case R180 from § 3). The examples are representative instances with (a,b) strong streak activity and (c) quiescent times with weak streak activity. The shading represents the value of the streamwise velocity in wall units.

We have not included in the base flow (2.2) the contributions from the streamwise averages of  $v$ and $w$ components, $V {\stackrel {\textrm {def}}{=}} \langle v \rangle _x$ and $W {\stackrel {\textrm {def}}{=}} \langle w \rangle _x$, as these are not traditionally included in the study of stability of the streaky flow. Indeed, the vast majority of studies reported in table 1 do not account for $V$ and $W$ in their analysis. The results obtained using $(U,0,0)$ as a base flow were repeated for a base flow consisting of $(U,V,W)$, and a concise overview of the findings can be found in appendix B. In summary, the conclusions drawn for base flows $(U,0,0)$ or $(U,V,W)$ are similar and, thus, we focus on the former for simplicity.
The equation of motion for the base flow  $\boldsymbol {U}=(U,0,0)$ is obtained by averaging the Navier–Stokes equations (2.1) in the streamwise direction,
 \begin{gather} \frac{\partial \boldsymbol{U}}{\partial t} + \boldsymbol{U} \boldsymbol{\cdot} \boldsymbol{\nabla} \boldsymbol{U} = -\mathcal{D}\langle \boldsymbol{u}' \boldsymbol{\cdot} \boldsymbol{\nabla} \boldsymbol{u}' \rangle_x - \frac{\mathcal{D}}{\rho}\boldsymbol{\nabla} \langle p \rangle_x + \nu \nabla^2 \boldsymbol{U} + \boldsymbol{f}, \end{gather}
 \begin{gather}\boldsymbol{\nabla} \boldsymbol{\cdot} \boldsymbol{U} = 0, \end{gather}
where the operator  $\mathcal {D}$ sets the $y$- and $z$-components of the nonlinear terms and pressure to zero for consistency with $\boldsymbol {U} = (U,0,0)$ (see appendix B). Subtracting (2.4) from (2.1) we get that the fluctuating flow $\boldsymbol {u}'$ is governed by
 \begin{equation} \frac{\partial\boldsymbol{u}'}{\partial t} = \underbrace{\mathcal{L}(U)\boldsymbol{u}'}_{\substack{\textit{linear}\\ \textit{processes}}} + \underbrace{\boldsymbol{N}(\boldsymbol{u}')}_{\substack{\textit{nonlinear}\\ \textit{processes}}}, \end{equation}
where  $\mathcal {L}(U)$ is the linearised Navier–Stokes operator for the fluctuating state vector about the instantaneous $\boldsymbol {U}$ (see figure 2b) such that
 \begin{equation} \mathcal{L}(U)\boldsymbol{u}' = \mathcal{P}\left[ -\boldsymbol{U}\boldsymbol{\cdot} \boldsymbol{\nabla} \boldsymbol{u}' - \boldsymbol{u}' \boldsymbol{\cdot} \boldsymbol{\nabla} \boldsymbol{U} + \nu \nabla^2 \boldsymbol{u}' \right]. \end{equation}
The operator  $\mathcal {P}$ accounts for the kinematic divergence-free condition, $\boldsymbol {\nabla } \boldsymbol {\cdot } \boldsymbol {u}' = 0$. Conversely, $\boldsymbol {N}(\boldsymbol {u}')$ collectively denotes the nonlinear terms, which are quadratic with respect to fluctuating flow fields,
 \begin{equation} \boldsymbol{N}(\boldsymbol{u}') = \mathcal{P}\left[ -\boldsymbol{u}' \boldsymbol{\cdot} \boldsymbol{\nabla} \boldsymbol{u}' +\mathcal{D}\langle \boldsymbol{u}' \boldsymbol{\cdot} \boldsymbol{\nabla} \boldsymbol{u}' \rangle_x \right]. \end{equation}
We are interested in the dynamics of  $\boldsymbol {u}'$ governed by (2.5). Note that the flow partition $\boldsymbol {U} + \boldsymbol {u}'$ as defined in (2.2) implies that the energy injection into the velocity fluctuations is ascribed to linear processes from $\mathcal {L}(U)$, since the term $\boldsymbol {N}(\boldsymbol {u}')$ is only responsible for redistributing the energy in space and scales among the fluctuations, i.e. the domain integral of $\boldsymbol {u}'\boldsymbol {\cdot }\boldsymbol {N}$ vanishes identically and, thus,
 \begin{equation} \frac{\partial }{\partial t} \left\langle E \right\rangle_{xyz} = \left\langle \boldsymbol{u}' \boldsymbol{\cdot} \mathcal{L}(U)\boldsymbol{u}'\right\rangle_{xyz}, \end{equation}
where  $E {\stackrel {\textrm {def}}{=}} |\boldsymbol {u}'|^2/2$ is the fluctuating turbulent kinetic energy.
In the rest of the paper, in addition to solutions of the Navier–Stokes equations (2.1), we modify (2.6) to preclude the energy transfer from  $\boldsymbol {U}$ to $\boldsymbol {u}'$ for targeted linear mechanisms. The simulations carried out are summarised in table 2, which includes the active linear mechanisms for energy transfer from $\boldsymbol {U}$ to $\boldsymbol {u}'$ and whether the cases are capable of sustaining turbulent fluctuations. The details on how the equations of motion are modified for each case are discussed in the remainder of the paper.
3. Regular wall turbulence
First, we solve the Navier–Stokes equations without any modification, so that all mechanisms for energy transfers from the base flow to the fluctuations are naturally allowed. We refer to this case as the ‘regular channel’ (R180). We provide an overview of the self-sustaining state of the flow and one-point statistics for R180. The results are used as a reference solution in forthcoming sections. The governing equations for the regular channel flow are (2.4) and (2.5):
 \begin{gather} \frac{\partial\boldsymbol{u}'}{\partial t} = \mathcal{L}(U)\boldsymbol{u}'+ \boldsymbol{N}(\boldsymbol{u}'), \end{gather}
 \begin{gather}\frac{\partial \boldsymbol{U}}{\partial t} = -\boldsymbol{U} \boldsymbol{\cdot} \boldsymbol{\nabla} \boldsymbol{U} -\mathcal{D}\langle \boldsymbol{u}' \boldsymbol{\cdot} \boldsymbol{\nabla} \boldsymbol{u}' \rangle_x - \frac{\mathcal{D}}{\rho}\boldsymbol{\nabla} \langle p \rangle_x + \nu \nabla^2 \boldsymbol{U} + \boldsymbol{f}, \quad \boldsymbol{\nabla} \boldsymbol{\cdot} \boldsymbol{U} = 0. \end{gather}
 The history of the domain-averaged turbulent kinetic energy,  $\langle E \rangle _{xyz}$, is shown in figure 4(a). The evolution of $\langle E \rangle _{xyz}$ reveals the widely documented intermittent behaviour of the turbulent kinetic energy: relatively low turbulent kinetic energy states followed by occasional spikes usually ascribed to the regeneration and bursting stages of the self-sustaining cycle. As an example, figure 5 contains the streamwise velocity at three instants with different degrees of turbulence activity. If we interpret bursts events as moments of intense turbulent kinetic energy, the time autocorrelation of $\langle E \rangle _{xyz}$ allows us to define a characteristic burst duration ( $T_b$), and the period between two consecutive bursts ( $T_p$). Figure 4(b) shows that $T_b \approx h/u_{\tau }$ measured as the time for zero correlation, while $T_p \approx 4h/u_{\tau }$ given by the time distance between two consecutive maxima. Later on, we compare this burst period $T_b$ with the characteristic time scales for energy injection into $\boldsymbol {u}'$.
(a) The history of the domain-averaged turbulent kinetic energy of the fluctuations  $\langle E \rangle _{xyz}$. Note that only $30 h/u_{\tau }$ units of time are shown in the panel but the simulation was carried out for more than $300 h/u_{\tau }$. (b) The time autocorrelation of $\langle E \rangle _{xyz}$. The vertical dotted and dash–dotted lines are $t=h/u_{\tau }\approx T_b$ (burst duration) and $t=4.3h/u_{\tau } \approx T_p$ (time between bursts), respectively. Results for regular channel flow R180.

Instantaneous isosurface of the streamwise velocity  $u$ at different times for R180. The value of the isosurface is 0.65 of the maximum streamwise velocity. Shading represents the distance to the wall from dark ( $y=0$) to light ( $y=h$). The arrow indicates the mean flow direction.
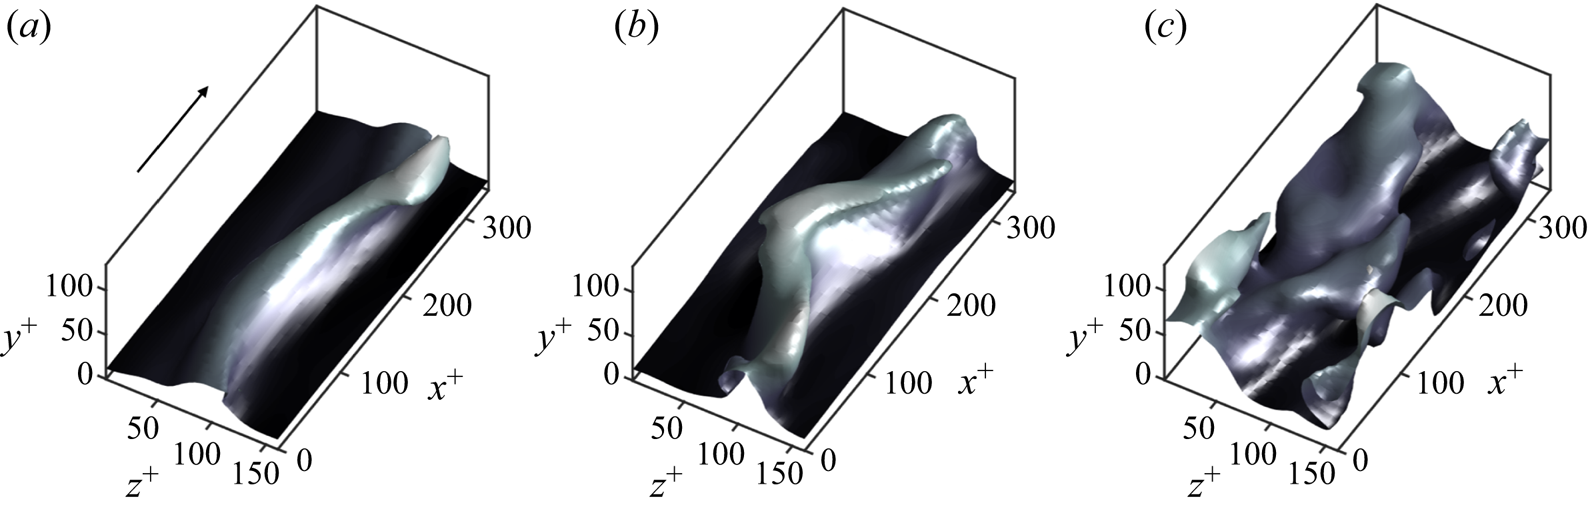
A useful representation of the high-dimensional dynamics of the solution is obtained by projecting the instantaneous flow trajectory onto the two-dimensional space defined by the domain-averaged production and dissipation rates
 \begin{gather} \langle P \rangle_{xyz} {\stackrel{\textrm{def}}{=}} \left\langle -u'v'\frac{\partial U}{\partial y} -u'w'\frac{\partial U}{\partial z} \right\rangle_{xyz}, \end{gather}
 \begin{gather}\langle D \rangle_{xyz} {\stackrel{\textrm{def}}{=}} \left\langle -2\nu \mathcal{S}:\mathcal{S} \right\rangle_{xyz}, \end{gather}
where  $\mathcal {S}$ is the rate of strain tensor for the fluctuating velocities, and the colon denotes double inner product. The statistically stationary state of the system requires $\langle P \rangle _{xyzt} =- \langle D \rangle _{xyzt}$. The results, plotted in figure 6(a), show that the projected solution revolts around $\langle P \rangle _{xyzt} = -\langle D \rangle _{xyzt}$ and is characterised by excursions into the high dissipation and high production regions, consistent with previous works (e.g. Jiménez et al. Reference Jiménez, Kawahara, Simens, Nagata and Shiba2005; Kawahara et al. Reference Kawahara, Uhlmann and van Veen2012).
(a) Projection of the flow trajectory for R180 onto the average production rate  $\langle P \rangle _{xyz}$ and dissipation rate $\langle D \rangle _{xyz}$ plane. The arrows indicate the time direction of the trajectory, which on average rotates counterclockwise. The red dashed line is $\langle P \rangle _{xyz} = -\langle D \rangle _{xyz}$ and the red circle $\langle P \rangle _{xyzt} = -\langle D \rangle _{xyzt}$. The trajectory projected covers $15 h/u_{\tau }$ units of time. (b) Streamwise mean velocity profile and (c) streamwise, (d) wall-normal and (e) spanwise root-mean-squared fluctuating velocities as a function of the wall-normal distance for R180 and equivalent non-minimal channel L180 with $L_x^+ \times L_z^+= 2312 \times 1156$ ( $L_x \times L_z \approx 12.5h \times 6.3h$).

The mean velocity profile and root-mean-squared (r.m.s.) fluctuating velocities for the regular channel are shown in figure 6(b–e). The results are compiled for the statistical steady state after initial transients. These have also been reported in the literature, with the worth noting difference that here the streamwise fluctuating velocity is defined as  $u' = u - \langle u \rangle _x$, while in previous studies it is common to choose $u''=u - \langle u \rangle _{xzt}$ instead. Figure 6(b–e) also contain the one-point statistics for a non-minimal channel flow with $L_x^+ \times L_z^+= 2312 \times 1156$ ( $L_x \times L_z \approx 12.5h \times 6.3h$) denoted by L180. The mean profile and cross-flow fluctuations in larger unconstrained domains are essentially captured in the minimal box, while $u'$ is underpredicted. The missing $u'$ is due to larger-scale motions that do not participate in the buffer layer self-sustaining cycle (Jiménez & Moin Reference Jiménez and Moin1991; Flores & Jiménez Reference Flores and Jiménez2010). A large amount of $u'$ is recovered when the minimal channel domain is enlarged in the streamwise direction and appendix A shows that our conclusions still hold when the minimal channel streamwise length is doubled.
4. Linear theories of self-sustaining wall turbulence: a priori non-causal analysis
The expected scenario of the full self-sustaining cycle in wall turbulence is the linear amplification of  $\boldsymbol {u}'$ induced by the operator $\mathcal {L}(U)$ followed by nonlinear saturation of $\boldsymbol {u}'$, scattering and generation of new disturbances by $\boldsymbol {N}$. We focus here on the linear component of (2.5),
 \begin{equation} \frac{\partial\boldsymbol{u}'_{{linear}}}{\partial t} = \mathcal{L}(U)\boldsymbol{u}'_{{linear}}. \end{equation}
The most general solution to (4.1) is given by the Peano–Baker series (see § 4.3), which accounts simultaneously for exponential growth, non-modal transient growth and non-modal transient growth assisted by parametric instability. However, we dissect (4.1) and revisit separately the different linear mechanisms that can transfer energy from the base flow to the fluctuating velocities. The plausibility of each mechanism in  $\mathcal {L}(U)$ as a contender to transfer energy from $\boldsymbol {U}$ to $\boldsymbol {u}'$ is investigated in a non-intrusive manner by interrogating the data from R180. This constitutes a non-causal analysis, as we are neglecting the nonlinear terms in (4.1), whereas the actual system (2.5) is nonlinear. This is not a minor point as the nonlinear term $\boldsymbol {N}$ can immediately counteract the linear growth by $\mathcal {L}(U)\boldsymbol {u}'$. Thus, this section only provides an assessment on the plausibility of different linear growths. The actual relevance of the linear mechanisms is assessed in the cause-and-effect analysis in § 6.
4.1. Energy transfer via exponential instability
The first mechanism considered is modal instability of the instantaneous base flow. At any given time, the exponential instabilities are obtained by eigendecomposition of the matrix representation of the linear operator  $\mathcal {L}(U)$ in (2.5),
 \begin{equation} \mathcal{L}(U) = \mathcal{Q} \varLambda \mathcal{Q}^{-1}, \end{equation}
where  $\mathcal {Q}$ consists of the eigenvectors organised in columns, $\mathcal {Q}^{-1}$ is the inverse of $\mathcal {Q}$, and $\varLambda$ is the diagonal matrix of associated eigenvalues, $\lambda _j + i\omega _j$, with $\lambda _j, \omega _j \in \mathbb {R}$. Equation (4.1) admits solutions of the form $\boldsymbol {u}'_{{linear}} \sim \boldsymbol {c} \exp {[(\lambda _j + \textrm {i}\omega _j)t]}$, with $\boldsymbol {c}$ a constant. Hence, we say that the base flow is unstable if any of the growth rates $\lambda _j$ is positive. More details on the stability analysis are provided in appendix C along with the validation of our implementation in appendix D. Figure 7 shows a representative example of the streamwise velocity for an unstable eigenmode. The predominant eigenmode has typically a sinuous structure of positive and negative patches of velocity flanking the velocity streak side by side, which may lead to its subsequent meandering and eventual breakdown. Varicose-type modes are also observed but they are less frequent.
Representative exponential instability of the streak. (a) Instantaneous isosurface of the base flow  $U$. The value of the isosurface is $0.6$ of the maximum and the shading represents the distance to the wall. (b) Isosurface of the instantaneous streamwise velocity for the eigenmode associated with the most unstable eigenvalue $\lambda _{max} h/u_{\tau } \approx 3$. The flow structure of the eigenmode is consistent with a sinuous instability. The values of the isosurface are $-0.5$ (dark) and $0.5$ (light) of the maximum streamwise velocity.

Figure 8(a) shows the probability density functions of the growth rate of the four least stable eigenvalues of  $\mathcal {L}(U)$. On average, the operator $\mathcal {L}(U)$ contains two to three unstable eigenmodes at any given instant. Denoting the Fourier streamwise wavenumber as $k_x$, the most unstable eigenmode usually corresponds to $k_x=2{\rm \pi} /L_x$, although occasionally modes with $k_x=2{\rm \pi} /(2L_x)$ become the most unstable. The sensitivity of our results to $L_x$ is further discussed in appendix A. The history of the maximum growth rate supported by $\mathcal {L}(U)$, denoted by $\lambda _1 = \lambda _{{max}}$, is shown in figure 8(b). The flow is exponentially unstable ( $\lambda _{{max}}>0$) more than 90 % of the time. The average e-folding time for an exponentially unstable perturbation is roughly $h/u_{\tau }$, which is comparable to the bursting duration $T_b$.
(a) Probability density functions of the growth rate of the four least stable eigenvalues of  $\mathcal {L}(U)$, $\lambda _1>\lambda _2>\lambda _3>\lambda _4$. (b) The time series of the most unstable eigenvalue $\lambda _{max}=\lambda _1$ of $\mathcal {L}(U)$. (c) The time series of the ratio of $\lambda _{max}/ \lambda _U$, where $\lambda _U$ is the growth rate of the base flow given by (4.3). The horizontal dashed and dotted lines are $\lambda _{max}/ \lambda _U=1$ and $\lambda _{max}/ \lambda _U=10$, respectively. Results for regular channel R180.

The ansatz underlying modal instability is that the spatial structure of the base flow remains constant in time. Therefore, we expect the above linear instability to manifest in the flow only when  $\lambda _{{max}}$ is much larger than the time rate of change of the base flow $U$, defined as
 \begin{equation} \lambda_U {\stackrel{\textrm{def}}{=}} \left\langle \frac{1}{2} \frac{|\mathrm{d} E_U /\mathrm{d}t|}{E_U} \right\rangle_{yz}, \end{equation}
where  $E_U {\stackrel {\textrm {def}}{=}} U^2/2$ is the energy of the base flow. The ratio $\lambda _{{max}}/\lambda _U$ for $\lambda _{{max}}>0$, shown in figure 8(c), is approximately 5 on average and occasionally achieves values of 20, i.e. the time changes of $U$ might be 5 to 20 times slower than the e-folding time of the most unstable eigenmode. The growth of the modal instabilities is not overwhelmingly faster than the changes on the base flow. However, considering that the exponential growth of disturbances is supported for a non-negligible fraction of the flow history (roughly 90 % of the time as shown before), modal instability of $\mathcal {L}(U)$ still stands as a potential mechanism sustaining the fluctuations. Note that the argument above does not imply that exponential instabilities are necessarily relevant for the flow when $\lambda _{{max}}/\lambda _U$ is large, but only that they could manifest based on their characteristic time scales. In fact, we show in § 6.2 that exponential instabilities are not a requisite to sustain turbulence.
4.2. Energy transfer via transient growth
The second linear mechanism considered is the non-modal transient growth of the fluctuations. The linear dynamics of (4.1) can be formally written as
 \begin{equation} \boldsymbol{u}'_{{linear}}(t+T) = \varPhi_{t \rightarrow t+T}\, \boldsymbol{u}'_{{linear}}(t). \end{equation}
The propagator  $\varPhi _{t \rightarrow t+T}$ maps the fluctuating flow from time $t$ to time $t+T$ and represents the cumulative effect of the linear operator $\mathcal {L}(U)$ during the period from $t$ to $t+T$. If the base flow remains constant for $t\in [t_0, t_0+T]$, then the propagator simplifies to
 \begin{equation} \varPhi_{t_0 \rightarrow t_0+T} = \exp \left( \mathcal{L}_0\,T \right), \end{equation}
where  $\mathcal {L}_0$ denotes $\mathcal {L}(U(y, z, t_0))$.
Equation (4.4) accounts for both the modal and non-modal growth of  $\boldsymbol {u}'$ for $t\in [t_0, t_0+T]$. The exponential growth of the fluctuating velocities was already quantified in § 4.1. Here we are concerned with the transient growth of $\boldsymbol {u}'$ supported by $\mathcal {L}_0$. To that end, we exclude from the analysis any growth of fluctuations due to the modal instabilities of $\mathcal {L}_0$. This is achieved by the modified operator $\tilde {\mathcal {L}}_0$,
 \begin{equation} \tilde{\mathcal{L}}_0 {\stackrel{\textrm{def}}{=}} \mathcal{Q} \tilde{\varLambda} \mathcal{Q}^{-1}, \end{equation}
where  $\tilde {\varLambda }$ is the stabilised counterpart of $\varLambda$ in (4.2) obtained by setting the real part ( $\lambda _j$) of all unstable eigenvalues of $\varLambda$ equal to $-\lambda _j$, while their phase speed and eigenmode structure are left unchanged. We assessed that the transient growth properties of $\tilde {\mathcal {L}}_0$ are mostly insensitive to the amount of stabilisation introduced in $\varLambda$ when $\lambda _j>0$ are replaced by $-a\lambda _j$ with $a\in [1/10,10]$. The potential effectiveness of transient growth due to a base flow $U(y,z,t_0)$ is then characterised by the energy gain $G$ over some time period $T$, defined as
 \begin{equation} G(t_0, T, \boldsymbol{u}'_{0}) {\stackrel{\textrm{def}}{=}} \frac{\left\langle \boldsymbol{u}'_T \boldsymbol{\cdot}\boldsymbol{u}_T' \right\rangle_{xyz}}{\left\langle \boldsymbol{u}'_0\boldsymbol{\cdot}\boldsymbol{u}_0' \right\rangle_{xyz}}, \end{equation}
where  $\boldsymbol {u}'_{T} {\stackrel {\textrm {def}}{=}} \boldsymbol {u}'_{{linear}}(x,y,z,t_0+T)$, $\boldsymbol {u}'_0 {\stackrel {\textrm {def}}{=}} \boldsymbol {u}'_{{linear}}(x,y,z,t_0)$ and $T$ is the time horizon for which the gain $G$ is computed.
The energy, being a bilinear form, can be expressed as an inner product, e.g.
 \begin{equation} \left(\boldsymbol{u}', \boldsymbol{u}'\right) {\stackrel{\textrm{def}}{=}} \left\langle \boldsymbol{u}'\boldsymbol{\cdot}\boldsymbol{u}' \right\rangle_{xyz}. \end{equation}
Using the definition (4.8) and the form of the propagator (4.5) for the frozen linear operator  $\tilde {\mathcal {L}}_0$, the energy gain is rewritten as
 \begin{equation} G\left(t_0, T, \boldsymbol{u}'_0\right) = \frac{\left(\boldsymbol{u}'_T , \boldsymbol{u}'_T \right)}{\left( \boldsymbol{u}'_0, \boldsymbol{u}'_0 \right)} = \frac{\left( {e}^{\tilde{\mathcal{L}}_0 T} \boldsymbol{u}'_0 , {e}^{\tilde{\mathcal{L}}_0 T}\boldsymbol{u}'_0 \right)} {\left(\boldsymbol{u}'_0 , \boldsymbol{u}'_0 \right)} = \frac{\left( \boldsymbol{u}'_0 , {e}^{\tilde{\mathcal{L}}_0^{{\dagger}ger} T} {e}^{\tilde{\mathcal{L}}_0 T}\boldsymbol{u}'_0 \right)}{\left( \boldsymbol{u}'_0 , \boldsymbol{u}'_0 \right)}. \end{equation}
In the last equality, dagger  ${\dagger}ger$ denotes the adjoint operator. Note that, for $T \rightarrow \infty$, the energy gain (4.9) tends to $0$, since the operator $\tilde {\mathcal {L}}_0$ is exponentially stable. The maximum gain over all initial conditions $\boldsymbol {u}'_0$, denoted by $G_{max}(t_0,T) = \mathrm {sup}_{\boldsymbol {u}'_0}(G)$, is given by the square of the largest singular value of the stabilised linear propagator $\tilde {\varPhi }_0$ (Butler & Farrell Reference Butler and Farrell1993; Farrell & Ioannou Reference Farrell and Ioannou1996),
 \begin{align} \tilde{\varPhi}_{t_0 \rightarrow t_0+T} & = \exp(\tilde{\mathcal{L}}_0 T), \end{align}
 \begin{align} & = \mathcal{M} \varSigma \mathcal{N}^{{\dagger}ger}, \end{align}
where  $\varSigma$ is a diagonal matrix, whose positive entries $\sigma _j$ are the singular values of $\exp (\tilde {\mathcal {L}}_0 T)$ and the columns of $\mathcal {M}$ and of $\mathcal {N}$ are the output modes (or left-singular vectors) and input modes (or right-singular vectors) of $\exp (\tilde {\mathcal {L}}_0 T)$, respectively.
The maximum gain  $G_{max}$ for R180 as a function of the optimisation time $T$ is shown in figure 9(a). The values of $G_{max}$ also depend on $t_0$; figure 9(a) features the mean and the standard deviation of $G_{max}$ for more than 1000 uncorrelated instants $t_0$. Figure 9(a) reveals that non-normality alone is potentially able to produce fluctuation energy growth of the order of $G_{max} \approx 100$. On average, the time horizon for maximum gain is attained at $T_{max} \approx 0.35 h/u_{\tau }$. Thus, the maximum non-normal energy gain is obtained at a similar time scale as the bursting time, $T_p$ (see § 3). For an elapsed time of $T_{max}$, the auto-correlation of the base flow,
 \begin{equation} C_{UU} {\stackrel{\textrm{def}}{=}} \left\langle \left[U(y,z,t)-\langle U \rangle_{t}\right]\left[U(y,z,t+T)-\langle U \rangle_{t}\right] \right\rangle_{yzt}, \end{equation}
has a value of 0.7, as shown in figure 9(a), which is reasonably high to justify the ‘frozen-base-flow’ assumption underlying the calculation of  $G$. The probability density function (p.d.f.) of $G_{max}$ at $T_{max}$ (figure 9b) shows that $U(y,z,t_0)$ at certain times can support gains as high as 300.
Energy transfer via transient growth with frozen-in-time base flow. (a) The ensemble average of the maximum energy gain  $G_{max}(t_0,T)$ (black solid line, see (4.13)) over different initial instances $t_0$, as a function of the time horizon $T$. Shaded regions denote $\pm$ half standard deviation of $G_{max}(t_0, T)$ for a given $T$. The vertical dashed line denotes $T_{{max}} = 0.35 h/ u_{\tau }$. The blue dotted line is the auto-correlation of $U$,
$U$,  $C_{UU}$ and its values appear on the right vertical axis. (b) Probability density function of gains $G_{max}(t_0,T_{{max}})$. Results for regular channel R180.

The results here support the hypothesis of transient growth of the ‘frozen’ mean streamwise flow  $U(y,z,t_0)$ as a tenable candidate to sustain wall turbulence. It is worth noting that the maximum gain $G_{max}$ obtained with a streaky base flow $U(y,z,t_0)$ is considerably larger than the limited gains of around 10 reported in previous studies focused in the buffer layer (Del Álamo & Jiménez Reference Del Álamo and Jiménez2006; Cossu et al. Reference Cossu, Pujals and Depardon2009; Pujals et al. Reference Pujals, García-Villalba, Cossu and Depardon2009). In latter works, the base flow selected was $\langle u \rangle _{xzt}$, which lacks any spanwise $z$-structure and, hence, supports much lower gains compared to $U(y,z,t_0)$.
Figure 10 provides an example of the input and output modes associated with the maximum optimal gain for one selected instant  $t_0$. The flow displays a sinuous backwards-leaning perturbation (input mode) that is being tilted forward by the mean shear over the time $T$ (output mode). The process is reminiscent of the linear Orr/lift-up mechanism driven by continuity and wall-normal transport of momentum characteristic of the bursting process and streak formation (Orr Reference Orr1907; Ellingsen & Palm Reference Ellingsen and Palm1975; Kim & Lim Reference Kim and Lim2000; Jiménez Reference Jiménez2013; Encinar & Jiménez Reference Encinar and Jiménez2020). Unlike the studies that used the base flow $\langle u\rangle _{xzt}$, our choice of a spanwise-varying base flow $U(y,z,t)=\langle u \rangle _{x}$ limits both the spanwise extent and location of the input and output modes, which are controlled by the spanwise location of the streak.
Representative sinuous input and output modes associated with the transient growth of the streak. Isosurfaces of (a,c) the input and (b,d) the output wall-normal velocity mode associated with the largest singular value of  $\tilde {\varPhi }_{t_0 \rightarrow t_0+T}$ from (4.9) at $T= 0.35h/u_{\tau }$. The isosurface are $-0.5$ (dark) and $0.5$ (light) of the maximum wall-normal velocity. The gain is $G_{{max}}=136$. The coloured contours at $x=L_x$ are 0.2, 0.4, 0.6 and 0.7 of the maximum velocity of the base flow. The result is for the regular channel R180.

4.3. Energy transfer via transient growth with time-varying base flow
In the previous section we have considered frozen-in-time base flows. We now relax this assumption such that the (stabilised) linear operator is time dependent  $\tilde {\mathcal {L}}(U(y,z,t))$. The propagator $\tilde {\varPhi }^t_{t_0 \rightarrow t_0+T}$ (now with superscript $t$), is given by the Peano–Baker series (Rugh Reference Rugh1996),
 \begin{equation} \tilde{\varPhi}_{t_0 \rightarrow t_0+T}^t =\mathcal{I}+\int_{t_0}^{t_0+T}{\tilde{\mathcal{L}}}(t_{1})\,\mathrm{d}t_{1} +\int_{t_0}^{t_0+T}{\tilde{\mathcal{L}}}(t_{1})\int_{t_0}^{{t_{1}}}{\tilde{\mathcal{L}}}(t_2)\, \mathrm{d} t_{2}\,\mathrm{d} t_{1} + \cdots, \end{equation}
where  $\mathcal {I}$ is the identity matrix and we have simplified the notation to $\tilde {\mathcal {L}}(t) = \tilde {\mathcal {L}}(U(y,z,t))$. The propagator $\tilde {\varPhi }^t_{t_0 \rightarrow t_0+T}$ represents the cumulative effect of $U(y,z,t)$ from $t_0$ to $t_0+T$ accounting for time variations in the base flow. The energy gain of (4.13) is
 \begin{equation} G^t(t_0,T, \boldsymbol{u}'_0) = \frac{( \boldsymbol{u}'_0 , (\tilde{\varPhi}_{t_0 \rightarrow t_0+T}^t)^{{\dagger}ger} (\tilde{\varPhi}_{t_0 \rightarrow t_0+T}^t) \boldsymbol{u}'_0)} {( \boldsymbol{u}'_0 , \boldsymbol{u}'_0)}. \end{equation}
In contrast with the frozen-base-flow propagator  $\tilde {\varPhi }_{t_0 \rightarrow t_0+T}$ in (4.9), the time variations of the operator $\tilde {\mathcal {L}}(U)$ can either weaken or enhance the energy transfer from $\boldsymbol {U}$ to $\boldsymbol {u}'$. Another difference is that the $G^t$ now admits a finite value at $T\rightarrow \infty$, despite that $\tilde {\mathcal {L}}(U)$ is modally stable at all instances. One potential route to enhance the gain for short times and/or achieve finite gains for long times is the parametric instability of the streak discussed in the introduction (Farrell & Ioannou Reference Farrell and Ioannou2012). However, it is shown below that none of these effects seem to be at play.
To evaluate the transient growth with time-varying base flows, we reconstruct the propagator without exponential instabilities  $\tilde {\varPhi }^t_{t_0 \rightarrow t_0+T}$ for case R180. In virtue of the property $\tilde {\varPhi }_{t_0 \rightarrow t_0+T}^t = \tilde {\varPhi }_{t_1 \rightarrow t_0+T}^t \tilde {\varPhi }_{t_0 \rightarrow t_1}^t$ for $t_0\le t_1 \le t_0+T$, the propagator is numerically computed by the ordered product of exponentials under the assumption of small $\Delta t$ as
 \begin{equation} \tilde{\varPhi}_{t_0 \rightarrow t_0+T}^t \approx \exp \left[\tilde{\mathcal{L}}(t_0+(n-1)\Delta t)\Delta t \right]\cdots \exp\left[ \tilde{\mathcal{L}}(t_0+\Delta t) \Delta t \right] \exp\left[ \tilde{\mathcal{L}}(t_0) \Delta t \right], \end{equation}
where  $T = n\Delta t$, with $n$ a positive integer. We saved the time history of $U(y,z,t)$ from R180 at all time steps and used it to compute $\tilde {\varPhi }_{t_0 \rightarrow t_0+T}^t$ via (4.15). We take $\Delta t^+ \approx 0.05$, which is the time step used to integrate the equations of motion. The maximum gain supported by $\tilde {\varPhi }_{t_0 \rightarrow t_0+T}^t$ is compared with its frozen-base-flow counterpart $\tilde {\varPhi }_{t_0 \rightarrow t_0+T}$ in figure 11. The results reveal that energy growth with time-varying base flows is almost identical to the energy growth under the frozen-base-flow assumption up to $T \approx T_{{max}}=0.35 h/u_{\tau }$, which also corresponds to the time for maximum gain for $\tilde {\varPhi }^t_{t_0 \rightarrow t_0+T}$. For longer times $T > T_{{max}}$, the gain with time-varying base flows is depleted with respect to that of the frozen base flow, and tends to zero for $T \rightarrow \infty$ (not shown). The results show that accounting for time variations of the base flow has a negligible effect on energy transfer for short times, but gains for frozen base flows are over estimated for long times otherwise.
Energy transfer via transient growth with time-varying base flow. (a) The ensemble average of the maximum energy gain  $G^t_{max}(t_0,T)$ (black solid line, see (4.13)) and $G_{max}(t_0,T)$ (red dashed line, see (4.11)) over different initial instances $t_0$, as a function of the time horizon $T$. Shaded regions denote $\pm$ half-standard deviation of $G^t_{max}(t_0, T)$ for a given $T$. The vertical dashed line denotes $T_{{max}} = 0.35 h/ u_{\tau }$. (b) Probability density function of gains for $G^t_{max}(t_0,T_{{max}})$ (black solid line) and $G_{max}(t_0,T_{{max}})$ (red dashed line). Results for regular channel R180.

The propagator  $\tilde {\varPhi }^t_{t_0 \rightarrow t_0+T}$ can also be analysed in terms of input and output modes. The input and output modes for the time-varying base flow are again a backwards-leaning perturbation (input mode) that is being tilted forward by the mean shear (output mode), very similar to the example shown in figure 10, but not shown here for brevity.
5. Cause-and-effect discovery with interventions
The analysis above was performed a priori by interrogating the data from R180 in a non-intrusive manner. This provides a valuable insight about the energy injection into the fluctuations, but hinders our ability to faithfully assess cause-and-effect links between linear mechanisms and their actual impact on the fully nonlinear system.
The most intuitive definition of causality relies on interventions: manipulation of the causing variable leads to changes in the effect (Pearl Reference Pearl2009; Eichler Reference Eichler2013). More precisely, to describe the causal effect that a process  $A$ (e.g. exponential growth of instability) exerts on another process $B$ (e.g. growth of turbulent kinetic energy), we consider the intervention in the governing equations of the system that sets $A$ to a modified value $A_i$ and observe the post-intervention consequences. How to identify the intervention $A_i$ that best unveils the causality from $A$ to $B$ is not trivial and relies on our knowledge of the system and shrewdness to modify it (Eberhardt & Scheines Reference Eberhardt and Scheines2007; Hyttinen, Eberhardt & Hoyer Reference Hyttinen, Eberhardt and Hoyer2013). When we do not have any prior knowledge of how $A$ might affect $B$, we need to resort to randomised interventions for discovering causal relationships (Fisher Reference Fisher1936). In following sections the reader will notice that many of the conclusions drawn on ( $A$ causes $B$) are often framed as a result of a negation, which is justified by the duality: ( $A$ causes $B$)
$B$)  $\equiv$ (no $B$ implies no $A$). Thus, we can assess the causality from $A$ to $B$ using either of the two hypotheses.
As turbulence is a high-dimensional chaotic system, we are concerned with the statistical alterations in the system after the intervention rather than changes in individual events. The probability distribution of the process  $B$ for the non-intervened system is measured by $\mathbb {P}(B)$. The causal effect of $A$ on $B$ can be quantified by any functional of the post-intervention distribution $\mathbb {P}( B | A = A_i)$, where $\mathbb {P}(\cdot | A = A_i)$ is the probability of the intervened system. The most commonly used measure of the statistical effect of $A$ on $B$ is the mean causal effect defined as the average increase or decrease in value caused by the intervention.
In the next section we follow this approach to assess the relevance of different linear mechanisms on the energy transfer from the base flow  $\boldsymbol {U}$ to the fluctuations $\boldsymbol {u}'$. The starting point is the R180 system (3.1), which is sensibly modified to suppress a targeted linear mechanism.
6. Linear theories of self-sustaining wall turbulence: cause-and-effect analysis
6.1. Wall turbulence without explicit feedback from  $ {u}'$ to ${U}$


In previous sections, we have acted as if
 \begin{equation} \frac{\partial\boldsymbol{u}'}{\partial t} = \mathcal{L}(U)\boldsymbol{u}'+ \boldsymbol{N}(\boldsymbol{u}') \end{equation}
is linear in the term  $\mathcal {L}(U)\boldsymbol {u}'$. This is obviously not true because $U(y,z,t)$ depends on $\boldsymbol {u}'$ via the nonlinear feedback term $-\langle \boldsymbol {u}' \boldsymbol {\cdot } \boldsymbol {\nabla } \boldsymbol {u}' \rangle _x$ (see the base flow evolution equation (3.1b)).
Prior to investigating the cause-and-effect links of linear mechanisms in  $\mathcal {L}(U)$, we derive a surrogate system in which the energy injection is strictly linear by preventing the explicit feedback from $\boldsymbol {u}'$ to $\boldsymbol {U}$. To achieve this, we proceed as follows.
(i) We perform a simulation of R180 for
$600 h/u_{\tau }$ units of time (after transients) with a constant time step.(ii) We store the base flow at all time steps. We denote the time series of this base flow as
$U_0 = U(y,z,t)$ from case R180.(iii) We time integrate the system
(6.2)\begin{gather} \frac{\partial\boldsymbol{u}'}{\partial t} = \mathcal{L}(U_0)\boldsymbol{u}'+ \boldsymbol{N}(\boldsymbol{u}'), \end{gather}(6.3)\begin{gather}U_0 = U(y,z,t) \ \text{from case R180}. \end{gather}


Equation (6.2) is initialised from a random, incompressible velocity field and it is integrated for  $600 h/u_{\tau }$ units of time using the same time step as in R180. Equation (6.2) is akin to the Navier–Stokes equations, in which the equation of motion of $\boldsymbol {U}$ is replaced by $\boldsymbol {U} = (U_0, 0, 0)$. We refer to this case as ‘channel flow with no-feedback’ or NF180 for short. Note that the base flow $U_0$ has no explicit feedback from $\boldsymbol {u}'$ in (6.2), although it has been implicitly ‘shaped’ by the velocity fluctuations of R180 and, as such, it contains dynamic information of actual wall turbulence. The key difference in (6.2) is that the term $\mathcal {L}(U_0)\boldsymbol {u}'$ is now strictly linear while preserving both the modal and non-modal properties of $\mathcal {L}(U)$ in R180.
The flow sustained in NF180 is turbulent as revealed by the history of the turbulent kinetic energy in figure 12(a). Moreover, the footprint of the flow trajectory projected onto the  $\langle P\rangle _{xyz}$– $\langle D\rangle _{xyz}$ plane in figure 12(b) also exhibits a similar behaviour to R180: the flow is organised around $\langle P \rangle _{xyz} = -\langle D \rangle _{xyz}$ with excursions into the high/low dissipation and production regions with predominantly counterclockwise motions. This assessment is merely qualitative and some differences are expected between the $\langle P\rangle _{xyz}$– $\langle D\rangle _{xyz}$ trajectories in R180 and NF180.
(a) The history of the domain-averaged turbulent kinetic energy of the fluctuations  $\langle E \rangle _{xyz}$. Note that only $30 h/u_{\tau }$ units of time are shown in the panel but the simulation was carried out for $600 h/u_{\tau }$. (b) Projection of the flow trajectory onto the average production rate $\langle P \rangle _{xyz}$ and dissipation rate $\langle D \rangle _{xyz}$ plane. The arrows indicate the time direction of the trajectory, which on average rotates counterclockwise. The red dashed line is $\langle P \rangle _{xyz} = -\langle D \rangle _{xyz}$ and the red circle $\langle P \rangle _{xyzt} = -\langle D \rangle _{xyzt}$. The trajectory projected covers $15 h/u_{\tau }$ units of time. The results are for NF180.

The mean turbulence intensities for NF180 are shown in figure 13. Statistics are collected once the system reaches the statistically steady state. The mean velocity profile is omitted as it is identical to that of R180 in figure 6(b). For comparison, figure 13 includes the one-point statistics for R180 (previously shown in figure 6c–e). The main consequence of precluding the nonlinear feedback from  $\boldsymbol {u}'$ to $\boldsymbol {U}$ is an increase of the level of the turbulence intensities, i.e. the feedback mechanism counteracts the growth of fluctuating velocities in R180. Despite these differences, we can still argue that the turbulence intensities in NF180 are alike those in R180 by noting that the friction velocity $u_{\tau }$ is no longer the appropriate scaling velocity for NF180. The traditional argument for $u_{\tau }$ as the relevant velocity scale for the energy-containing eddies is that the turbulence intensities equilibrate to comply with the mean integrated momentum balance,
 \begin{equation} -\!\langle u v \rangle \approx u_{\tau}^2 (1- y/h), \end{equation}
after viscous effects are neglected (Townsend Reference Townsend1976; Tuerke & Jiménez Reference Tuerke and Jiménez2013). As a result,  $u_{\tau } \approx \sqrt {-\langle u v \rangle /(1-y/h)}$ stands as the characteristic velocity for all wall-normal distances. However, we have altered the momentum equation for case NF180, which renders the balance in (6.4) invalid. A more general argument was made by Lozano-Durán & Bae (Reference Lozano-Durán and Bae2019) by which the characteristic velocity of the energy-containing eddies, $u_{\star }$, is controlled by the characteristic production rate of turbulent kinetic energy, $P_{\star } \sim u_{\star }^2/t_{\star }$, where $t_{\star }$ is the time scale to extract energy from the mean shear
 \begin{equation} t_{\star} \sim \frac{1}{\sqrt{ (\partial U/\partial y)^2+ (\partial U/\partial z)^2}}. \end{equation}
Taking as characteristic production rate
 \begin{equation} P_{\star} \sim \sqrt{ \left(u'v'\frac{\partial U}{\partial y}\right)^2 + \left(u'w'\frac{\partial U}{\partial z}\right)^2 }, \end{equation}
a characteristic velocity scale is constructed as
 \begin{equation} u_{\star}(y) {\stackrel{\textrm{def}}{=}} \sqrt{ \frac{\left\langle P_{\star} t_{\star} \right\rangle_{xzt}}{1-y/h}}, \end{equation}
which generalizes the concept of friction velocity. The factor  $1/\sqrt {1-y/h}$ is introduced for convenience in analogy with $u_{\tau }$ in (6.4) so that $u_{\star }$ reduces to $u_{\tau }$ for the regular wall turbulence.
(a) Streamwise, (b) wall-normal and (c) spanwise mean root-mean-squared fluctuating velocities as a function of the wall-normal distance for case R180 normalised by  $u_{\tau }$, case NF180 normalised by $u_{\tau }$ and NF180 normalised by $u_{\star }$.

Figure 13 shows that the turbulence intensities, when scaled with  $u_{\star }$, resemble those of R180, at least for $y>0.1h$ where viscous effects are negligible. This suggests that the underlying flow dynamics of NF180 is of a similar nature as the regular channel case R180 under the proper scaling. Thus, hereafter we utilise NF180 as the reference case for comparisons as we have shown that it exhibits similar dynamics to regular wall turbulence while being truly linear in $\tilde {\mathcal {L}}(U)\boldsymbol {u}'$. Occasionally, we allow back the feedback $\boldsymbol {u}'\rightarrow \boldsymbol {U}$.
6.2. Wall turbulence without exponential instability of the streaks
We modify the operator  $\mathcal {L}(U_0)$ so that all the unstable eigenmodes are rendered stable at all times. We refer to this case as the ‘non-feedback channel with suppressed exponential instabilities’ (NF-SEI180) and we inquire whether turbulence is sustained under those conditions. The approach is implemented by replacing $\mathcal {L}(U_0)$ at each time instance by its exponentially stable counterpart $\tilde {\mathcal {L}}(U_0)$, introduced in (4.6). The governing equations for the channel with suppressed exponential instabilities are
 \begin{gather} \frac{\partial\boldsymbol{u}'}{\partial t} = \tilde{\mathcal{L}}(U_0)\boldsymbol{u}'+ \boldsymbol{N}(\boldsymbol{u}'), \end{gather}
 \begin{gather}U_0 = U(y,z,t) \ \text{from case R180}. \end{gather}
 The stable counterpart of  $\mathcal {L}(U_0)$ given by $\tilde {\mathcal {L}}(U_0)$ guarantees an exponentially stable wall turbulence with respect to the base flow at all times, while leaving other linear mechanisms almost intact. Note that the analysis § 4.1 was performed a priori using data from R180, while in the present case the nonlinear dynamical system (6.8) is actually integrated in time. The simulation was initialised using a flow field from R180, from which the unstable and neutral modes are projected out, and integrated in time for $300h/u_{\tau }$ after transients. It was assessed that initialising the equation with a random velocity field yields exactly the same conclusions.
It is useful to note that the stabilisation of  $\mathcal {L}(U_0)$ in (6.8) can be interpreted as the addition of a forcing term to the right-hand side of (6.8) by considering the approximation to $\tilde {\mathcal {L}}(U_0)$,
 \begin{equation} \hat{\mathcal{L}}(U_0) = \mathcal{L}(U_0) - \sum_{j=1}^n 2 \lambda_j \boldsymbol{\mathcal{U}}_j \boldsymbol{\mathcal{U}}^{{\dagger}ger}_j \approx \tilde{\mathcal{L}}(U_0), \end{equation}
where  $\boldsymbol {\mathcal {U}}_j$ is the eigenmode of $\mathcal {L}(U_0)$ associated with eigenvalue $\lambda _j>0$, and $n$ is the total number of unstable eigenvalues. The factor 2 on the right-hand side of (6.10) transforms $\lambda _j>0$ for $\mathcal {L}(U_0)$ into $-\lambda _j$ for $\hat {\mathcal {L}}(U_0)$ in analogy with the stabilised operator $\tilde {\mathcal {L}}$; see (4.6). Equation (6.10) is approximate, as $\mathcal {L}(U_0)$ is highly non-normal. However, we confirmed that the largest eigenvalues and eigenmodes of $\hat {\mathcal {L}}(U_0)$ and $\tilde {\mathcal {L}}(U_0)$ are almost identical most of the time (see discussion in appendix E). In virtue of (6.10), the modification of $\mathcal {L}(U_0)$ in (6.10) is easily interpretable: stabilising $\mathcal {L}(U_0)$ is equivalent to introducing a linear drag term, $-\mathcal {F}\boldsymbol {u}'$, in which the drag coefficient depends on the base flow $U(y,z,t)$, i.e.
 \begin{equation} \mathcal{F}(U) =\sum_{j=1}^{n} 2 \lambda_j \boldsymbol{\mathcal{U}}_j \boldsymbol{\mathcal{U}}^{{\dagger}ger}_j, \end{equation}
that counteracts the growth of the unstable modes at a rate proportional to the growth rate of the mode itself.
The results of integrating (6.8) are presented in figures 14 and 15. The probability density functions of  $\lambda _j$ and a segment of the time series of the maximum modal growth rate of $\tilde {\mathcal {L}}(U_0)$ are shown in figure 14, which confirms that the system is successfully stabilised.
(a) Probability density functions of the growth rate of the four least stable eigenvalues of  $\tilde {\mathcal {L}}(U_0)$, $\lambda _1>\lambda _2>\lambda _3>\lambda _4$. (b) The history of the most unstable eigenvalue $\lambda _{max}$ of $\tilde {\mathcal {L}}(U_0)$. Results are for the channel with suppressed modal instabilities NF-SEI180.

(a) The history of the domain-averaged turbulent kinetic energy of the fluctuations  $\langle E \rangle _{xyz}$. Note that only $30 h/u_{\tau }$ units of time are shown in the panel, but the simulation was carried out for more than $300 h/u_{\tau }$. (b) Projection of the flow trajectory onto the average production rate $\langle P \rangle _{xyz}$ and dissipation rate $\langle D \rangle _{xyz}$ plane. The arrows indicate the time direction of the trajectory, which on average rotates counterclockwise. The red dashed line is $\langle P \rangle _{xyz} = -\langle D \rangle _{xyz}$ and the red circle $\langle P \rangle _{xyzt} = -\langle D \rangle _{xyzt}$. The trajectory projected covers $15 h/u_{\tau }$ units of time. Results are for the channel with suppressed modal instabilities NF-SEI180.

Figure 15(a) shows the history of the turbulent kinetic energy for NF-SEI180 after initial transients. The result verifies that turbulence persists when  $\mathcal {L}(U_0)$ is replaced by its modally stable counterpart $\tilde {\mathcal {L}}(U_0)$. The patterns of the flow trajectories projected onto the production–dissipation plane (figure 15b) exhibits features similar to those discussed above for R180 and NF180.
The turbulence intensities for NF-SEI180 are presented in figure 16 and compared with those for NF180. The mean profile is the same as R180 (not shown). Notably, the channel flow without exponential instabilities is capable of sustaining turbulence. The new flow equilibrates at a state with fluctuations depleted by roughly 10–20 %. The outcome demonstrates that, even if the linear instabilities of the streak manifest in the flow, they are not required for maintaining wall turbulence.
(a) Streamwise, (b) wall-normal and (c) spanwise root-mean-squared fluctuating velocities as a function of the wall-normal distance for the non-feedback channel NF180 and the non-feedback channel with suppressed exponential instabilities NF-SEI180.

It is worth emphasising that, according to the post-processing analysis in § 4, modal instabilities stand as a viable mechanism to explain the energy transfer from  $\boldsymbol {U}$ to $\boldsymbol {u}'$. Yet, we have demonstrated here that turbulence remains almost unchanged in their absence. This illustrates very vividly the risks of evaluating linear (and other) theories a priori without accounting for the cause-and-effect relations in the actual flow.
6.2.1. Case with explicit feedback from ${u}'$ to ${U}$ allowed


It was shown above that turbulence is sustained despite the absence of exponential instabilities. This was demonstrated for NF-SEI180, in which the nonlinear feedback from  $\boldsymbol {u}'$ to $\boldsymbol {U}$ was excluded. We have seen in § 6.1 that inhibiting the feedback from $\boldsymbol {u}'$ to $\boldsymbol {U}$ actually enhances the turbulence intensities with respect to $u_{\tau }$. This may cast doubts on whether the ‘weaker’ fluctuations from R180 can be sustained when modal instabilities are also cancelled out. To clarify this point, we resolve a channel with suppressed exponential instabilities in which the feedback from $\boldsymbol {u}'$ to $\boldsymbol {U}$ is allowed. The equations of motion in this case are
 \begin{gather} \frac{\partial\boldsymbol{u}'}{\partial t} = \tilde{\mathcal{L}}(U)\boldsymbol{u}'+ \boldsymbol{N}(\boldsymbol{u}'), \end{gather}
 \begin{gather}\frac{\partial \boldsymbol{U}}{\partial t} = -\boldsymbol{U} \boldsymbol{\cdot} \boldsymbol{\nabla} \boldsymbol{U} -\mathcal{D}\langle \boldsymbol{u}' \boldsymbol{\cdot} \boldsymbol{\nabla} \boldsymbol{u}' \rangle_x - \frac{\mathcal{D}}{\rho}\boldsymbol{\nabla} \langle p \rangle_x + \nu \nabla^2 \boldsymbol{U} + \boldsymbol{f}, \quad \boldsymbol{\nabla} \boldsymbol{\cdot} \boldsymbol{U} = 0. \end{gather}
We refer to this case as ‘regular channel with suppressed exponential instabilities’ or R-SEI180. Note that the only difference of (6.12) from the original Navier–Stokes equations (2.1) is the modally stable  $\tilde {\mathcal {L}}(U)$ instead of $\mathcal {L}(U)$. The base flow $\boldsymbol {U}$ is now dynamically coupled to $\boldsymbol {u}'$ via the nonlinear term $-\mathcal {D}\langle \boldsymbol {u}' \boldsymbol {\cdot } \boldsymbol {\nabla } \boldsymbol {u}' \rangle _x$ in (6.12b). A similar experiment was done by Farrell & Ioannou (Reference Farrell and Ioannou2012) for Couette flow at low Reynolds numbers. We initialise simulations of (6.12) from a flow field of R180 after projecting out the unstable and neutral modes from this initial condition. It was checked that using random velocities as the initial condition yields the same results.
The history of  $\lambda _{max}$ for $\tilde {\mathcal {L}}(U)$, shown in figure 17(a), confirms that modal instabilities are successfully removed. Figure 17(b) contains the evolution of the turbulent kinetic energy and shows that turbulence persists under the stabilised linear dynamics of (6.12a). The flow trajectories projected onto the production–dissipation plane (figure 17c) also exhibit similar features to those discussed above for R180 and NF-SEI180.
(a) The history of the most unstable eigenvalue  $\lambda _{max}$ of $\tilde {\mathcal {L}}(U)$. (b) The history of the turbulent kinetic energy of the fluctuation energy $E = \tfrac1{2}|\boldsymbol{u}'|^2$ averaged over the channel domain. Note that only $30 h/u_{\tau }$ units of time are shown in panels (a,b), but the simulation was carried out for more than $300 h/u_{\tau }$. (c) Projection of the flow trajectory onto the average production rate $\langle P \rangle _{xyz}$ and dissipation rate $\langle D \rangle _{xyz}$ plane. The arrows indicate the time direction of the trajectory, which on average rotates counterclockwise. The red dashed line is $\langle P \rangle _{xyz} = -\langle D \rangle _{xyz}$ and the red circle $\langle P \rangle _{xyzt} = -\langle D \rangle _{xyzt}$. The trajectory projected covers $15 h/u_{\tau }$ units of time. Results for channel with suppressed modal instabilities but with feedback from $\boldsymbol {u}'$ to $\boldsymbol {U}$ allowed (R-SEI180).

The mean velocity profiles and turbulence intensities for R-SEI180 and R180 are shown in figure 18. The results are consistent with the trends reported in figure 16 for NF-SEI180 and NF180: turbulence without modal instabilities is sustained despite allowing the feedback from  $\boldsymbol {u}'$ to $\boldsymbol {U}$. As in NF-SEI180, the resulting velocity fluctuations are depleted by roughly 10 %. Figure 19 portrays snapshots of the streamwise velocity at three different instants for the R-SEI180 simulation. As in R180 (cf. figure 5), the spatial organisation of the streak cycles through different stages of elongated straight motion, meandering and breakdown, although the first two states (figure 19a,b) occur more frequently than in R180. Indeed, if we consider the common definition for the streamwise velocity fluctuation $u''=u - \langle u \rangle _{xzt}$, which contains part of the streaky flow, the new flow in R-SEI180 attains an augmented streak intensity as clearly depicted in figure 18(b). The outcome is consistent with the occasional inhibition of the streak meandering or breakdown via exponential instability, which enhances $u''$, whereas wall-normal ( $v''=v'$) and spanwise ( $w''=v'$) turbulence intensities are diminished due to a lack of vortices succeeding the collapse of the streak (namely, mechanism (i) discussed in the introduction). This behaviour was also observed in many drag reduction investigations (Jung, Mangiavacchi & Akhavan Reference Jung, Mangiavacchi and Akhavan1992; Laadhari, Skandaji & Morel Reference Laadhari, Skandaji and Morel1994; Choi & Clayton Reference Choi and Clayton2001; Ricco & Quadrio Reference Ricco and Quadrio2008).
(a) Streamwise mean velocity profile, and (b,c) streamwise, (d) wall-normal and (e) spanwise mean root-mean-squared fluctuating velocities as a function of the wall-normal distance for the regular channel (R180) and the channel with suppressed exponential instabilities but with the feedback from  $\boldsymbol {u}'$ to $\boldsymbol {U}$ allowed (R-SEI180). Note that the streamwise fluctuating velocity in panel (b) is defined as $u'' = u - \langle u \rangle _{xzt}$, while in panel (c) is defined as $u'=u-U$.

Instantaneous isosurface of the streamwise velocity at different times for R-SEI180. The value of the isosurface is 0.65 of the maximum streamwise velocity. Shading represents the distance to the wall from dark ( $y=0$) to light ( $y=h$). The arrow indicates the mean flow direction.

As a final comment, Lozano-Durán et al. (Reference Lozano-Durán, Karp and Constantinou2018) showed in a preliminary work that turbulence was not sustained when  $\mathcal {L}(U)$ was stabilised by $\mathcal {L}(U)-\mu \mathcal {I}$, where $\mu >0$ is a damping parameter and $\mathcal {I}$ is the identity operator. However, it can be shown that introducing the linear drag $-\mu \boldsymbol {u}'$ reduces the gains supported by $\mathcal {L}(U)$ by a factor of $\exp (- 2 \mu T)$, with $T$ the optimisation time. Hence, stabilising $\mathcal {L}(U)$ via a linear drag term $-\mu \boldsymbol {u}'$ also disrupts the transient growth mechanism severely and this was the cause for the lack of sustained turbulence in Lozano-Durán et al. (Reference Lozano-Durán, Karp and Constantinou2018). Conversely, we have shown that $\tilde {\mathcal {L}}(U)$ is physically interpretable as the stabilisation of $\mathcal {L}(U)$ via a linear forcing directed toward modal instabilities ( $\tilde {\mathcal {L}}(U)\boldsymbol {u}' \approx \mathcal {L}(U)\boldsymbol {u}'-\mathcal {F}\boldsymbol {u}'$, see (6.11)). This entails a much gentler modification which leaves almost intact the transient growth mechanisms of $\mathcal {L}(U)$, as opposed to $\mathcal {L}(U)-\mu \mathcal {I}$.
6.3. Wall turbulence exclusively supported by transient growth
The effect of non-modal transient growth as the main source for energy injection from  $\boldsymbol {U}$ into $\boldsymbol {u}'$ is now assessed by ‘freezing’ the base flow $U(y,z,t_i)$ at the instant $t_i$. In order to steer clear of the potential effect of exponential instabilities, the numerical experiment here is performed using the stabilised linear operator $\tilde {\mathcal {L}}(U(y,z,t_i))$. For a given $U(y,z,t_i)$, we refer to this case as ‘channel flow with modally stable, frozen-in-time base flow’, or NF-TG180 $_i$, with $i$ an index indicating the case number. Let us denote the flow for NF-TG180 $_i$ as $\boldsymbol {u}_{\{i\}}$ (and similarly for other flow quantities). The governing equations for NF-TG180 $_i$ are
 \begin{gather} \frac{\partial\boldsymbol{u}'_{\{i\}}}{\partial t} = \tilde{\mathcal{L}}_{\{i\}}\,\boldsymbol{u}'_{\{i\}}+ \boldsymbol{N}(\boldsymbol{u}'_{\{i\}}), \end{gather}
 \begin{gather}U_{\{i\}} = U(y,z,t_i) \ \text{from case R180}, \end{gather}
where  $\tilde {\mathcal {L}}_{\{i\}} = \tilde {\mathcal {L}}(U(y,z,t_i))$. The set-up in (6.13) disposes of energy transfers that are due to both modal and parametric instabilities, while allowing the transient growth of fluctuations. For a given $t_i$, the simulation is initialised from NF-SEI180 at $t=t_i$ (projecting out neutral and unstable modes), and continued for $t>t_i$. We performed more than 500 simulations using different frozen base flows $U(y,z,t_i)$ extracted from R180.
The evolution of the turbulent kinetic energy is shown in figure 20(a) for ten cases NF-TG180 $_i$,
$_i$,  $i=1,\ldots ,10$. After freezing the base flow at $t_i$, most of the cases remain turbulent, while some others decay before $40 h/u_{\tau }$. Turbulence was sustained in 80 % of the NF-TG180 $_i$ simulations. In the cases for which turbulence persists, the projection of the flow trajectory onto the $\langle P \rangle _{xyz}$– $\langle D \rangle _{xyz}$ plane is reminiscent of the self-sustaining cycle for R180; an example is shown in figure 20(b). Since $\tilde {\mathcal {L}}_{\{i\}}$ is modally stable, a necessary ingredient to sustain turbulence in NF-TG180 $_i$ is the scattering and generation of new disturbances by $\boldsymbol {N}(\boldsymbol {u}'_{\{i\}})$. Indeed, we verify in appendix F that the system (6.13) decays when the nonlinear term $\boldsymbol {N}(\boldsymbol {u}'_{\{i\}})$ is discarded.
(a) The history of the domain-averaged turbulent kinetic energy of the fluctuations  $\langle E \rangle _{xyz}$. Different colours denote various cases of NF-TG180 $_i$ for $i=1,\ldots ,10$. The time $t_i$ is the instant at which the mean flow is frozen-in-time. (b) Projection of the flow trajectory onto the average production rate $\langle P_{\{5\}} \rangle _{xyz}$ and dissipation rate $\langle D_{\{5\}} \rangle _{xyz}$ plane for NF-TG180 $_5$. The arrows indicate the time direction of the trajectory, which on average rotates counterclockwise. The dashed line is $\langle P_{\{5\}} \rangle _{xyz} = -\langle D_{\{5\}} \rangle _{xyz}$ and the circle $\langle P_{\{5\}} \rangle _{xyzt} = -\langle D_{\{5\}} \rangle _{xyzt}$. The trajectory projected covers $15 h/u_{\tau }$ units of time. (c) Mean velocity profile, and (d) root-mean-squared streamwise, (e) wall-normal and (f) spanwise fluctuating velocities for ten cases NF-TG180 $_i$,
$_i$,  $i=1,\ldots ,10$. The black dashed lines show same results for NF-SEI180.

The one-point statistics for each NF-TG180 $_i$ vary for different $U(y,z,t_i)$. To illustrate the differences among cases, figure 20(c–f) contain the mean velocity profiles and fluctuating velocities for NF-TG180 $_i$,
$_i$,  $i=1,\ldots ,10$. Note that this is only a small sample; the total number of cases simulated is above 500. In some occasions, $U(y,z,t_i)$ is such that the system equilibrates in a state of intensified turbulence with respect to NF-SEI180 (i.e. $\langle E \rangle _{xyzt}$ for NF-TG180 $_i$ larger than for NF-SEI180), while other base flows result in weakened turbulence. Figure 21 shows instances of the streamwise velocity for representative cases with intensified (a–c) and weakened (d–f) turbulent states. The intensified turbulence features a highly disorganised state akin to a broken streak, whereas the weakened turbulence resembles the quiescent stages of wall turbulence with a well-formed persistent streak.
Examples of base flows (a,d) and instantaneous isosurfaces of the streamwise velocity at different times (b,c,e,f). Panels (a–c) are for NF-TG180 $_5$, which is representative of a state with enhanced turbulence intensities. Panels (d,e,f) are for NF-TG180 $_{10}$, which is representative of a state with weakened turbulence. In panels (b,c,e,f), the value of the isosurfaces is 0.65 of the maximum streamwise velocity and shading represent the distance to the wall located at $y=0$. The arrow indicates the mean flow direction.

Figure 22 shows the average turbulent kinetic energy of a given case NF-TG180 $_i$ as a function of the maximum gain $G_{\{i\},max}$ at $T=T_{max}$. The results reveal that turbulence is not maintained when $G_{\{i\},max} \lessapprox 50$, although this critical gain might be Reynolds number dependent. The trend also suggests that the level of the turbulence intensities for NF-TG180 $_i$ increases with the amount of transient growth supported by each $U(y,z,t_i)$ and scales approximately as
 \begin{equation} \langle E_{\{i\}} \rangle_{xyzt} \sim G_{\{i\},max}. \end{equation}
We attempt to explain this observation by invoking the severe assumption that  $\boldsymbol {N}(\boldsymbol {u}'_{\{i\}})$ acts as a time-varying forcing whose net effect is independent of $\boldsymbol {u}'_{\{i\}}$, i.e. $\boldsymbol {N}(\boldsymbol {u}'_{\{i\}}) \approx \boldsymbol {\mathcal {N}}_{\{i\}}(t)$ (see, for instance, Farrell & Ioannou Reference Farrell and Ioannou1993b; Zare et al. Reference Zare, Georgiou and Jovanović2020; Jovanović Reference Jovanović2021). Under those conditions, the solution to (6.13a) is obtained via the Green's function as
 \begin{equation} \boldsymbol{u}'_{\{i\}}(t) \approx \tilde{\varPhi}_{\{i\}}(t-t_i)\boldsymbol{u}'_{\{i\}}(t_i) + \int_{t_i}^t \tilde{\varPhi}_{\{i\}}(t-\tau) \boldsymbol{\mathcal{N}}_{\{i\}}(\tau)\,\mathrm{d}\tau, \end{equation}
with  $\tilde {\varPhi }_{\{i\}}(t) = \exp [ \tilde {\mathcal {L}}_{\{i\}}(t)]$. The turbulent kinetic energy of (6.15), after transients, is
 \begin{equation} \langle E_{\{i\}} \rangle_{xyzt} = \tfrac{1}{2} \left\langle \left( \int_{t_i}^t \tilde{\varPhi}_{\{i\}}(t-\tau) \boldsymbol{\mathcal{N}}_{\{i\}}(\tau)\, \mathrm{d}\tau,\ \int_{t_i}^t \tilde{\varPhi}_{\{i\}}(t-\tau) \boldsymbol{\mathcal{N}}_{\{i\}}(\tau) \mathrm{d}\tau \right) \right\rangle_t. \end{equation}
After considering the singular-value decomposition on  $\tilde {\varPhi }_{\{i\}}= M_{\{i\}} \varSigma _{\{i\}} N_{\{i\}}^{{\dagger}ger }$ then
 \begin{equation} \langle E_{\{i\}} \rangle_{xyzt} \sim \sigma_{\{i\},max}^2 \sim G_{\{i\},max}, \end{equation}
which establishes a link between the level of turbulent kinetic energy and the non-normal energy gain provided by the linear dynamics as anticipated by figure 22. Nonetheless, the scatter of the data in figure 22 is still large and the relation between  $\langle E_{\{i\}} \rangle _{xyzt}$ and $G_{\{i\},max}$ is not perfectly linear. This is not surprising as the actual mechanism regulating the intensity of turbulence does not depend exclusively on $G_{\{i\},max}$ but also on the replenishment of fluctuations given by the projection of $\boldsymbol {N}(\boldsymbol {u}'_{\{i\}})$ onto $\tilde {\varPhi }_{\{i\}}$.
Mean turbulent kinetic energy conditioned to the maximum gain  $G_{{\{i\}},{max}}$ at $T=T_{{max}}$ compiled over NF-TG180 $_{i}$. The red solid line represents the mean value; the shaded area denotes $\pm$ one standard deviation.

To evaluate the compound result of NF-TG180 $_i$, we define the ensemble average of a quantity $\phi _{\{i\}}$ over cases NF-TG180 $_i$ as
 \begin{equation} \langle \phi_{\{i\}} \rangle_e = \sum_{i=1}^N \frac{\phi_{\{i\}}}{N}, \end{equation}
where  ${1,\ldots ,N}$ is the collection of cases NF-TG180 $_i$ which remain turbulent. The ensemble average of the mean and r.m.s. fluctuating velocities are presented in figure 23. The results are compared with those from NF-SEI180, which is similar to NF-TG180 $_i$ but with time varying $U$. The outcome is striking: the ensemble averages over NF-TG180 $_i$ cases (black solid lines) coincide almost perfectly with the one-point statistics for NF-SEI180 (dashed red lines). Given that the current set-up is composed of ‘static’ base flows, $\partial U/\partial t$ ( $=0$) does not play any role in the flow dynamics of NF-TG180 $_i$. Thus, we conclude that energy transfer via parametric instabilities (intimately related to $\partial U/\partial t$) is not required to sustain the flow. Time variations of $U$ are only necessary to sample the phase space of ‘regular’ turbulence with different non-normal gains so that the ensemble of NF-TG180 $_i$ results in nominal wall turbulence statistics.
(a) Mean velocity profile, (b) root-mean-squared streamwise, (c) wall-normal and (d) spanwise fluctuating velocities. The black solid line is the ensemble average of turbulent cases NF-TG180 $_{i}$, namely, $\langle \langle u_{\{i\}} \rangle _{xzt} \rangle _e$, $\langle \langle u'^2_{\{i\}} \rangle _{xzt}^{1/2} \rangle _e$, $\langle \langle v'^2_{\{i\}} \rangle _{xzt}^{1/2} \rangle _e$ and $\langle \langle w'^2_{\{i\}} \rangle _{xzt}^{1/2} \rangle _e$; the shaded region denotes $\pm$ one standard deviation with respect to the ensemble average operator $\langle \boldsymbol {\cdot } \rangle _e$; the red dashed line is $\langle u'^2 \rangle _{xzt}^{1/2}$, $\langle v'^2 \rangle _{xzt}^{1/2}$ and $\langle w'^2 \rangle _{xzt}^{1/2}$ for NF-SEI180.

The wall-normal behaviour of the turbulence intensities for NF-TG180 $_i$ are determined by the fluctuation energy balance
 \begin{equation} \left\langle \boldsymbol{u}'_{\{i\}} \boldsymbol{\cdot} \tilde{\mathcal{L}}_{\{i\}}\boldsymbol{u}'_{\{i\}} + \boldsymbol{u}'_{\{i\}} \boldsymbol{\cdot} \boldsymbol{N}(\boldsymbol{u}'_{\{i\}}) \right\rangle_{xzt} = 0. \end{equation}
Similarly, the average turbulent kinetic energy for NF-SEI180 is dictated by the balance
 \begin{equation} \left\langle \boldsymbol{u}' \boldsymbol{\cdot} \tilde{\mathcal{L}}(U) \boldsymbol{u}' + \boldsymbol{u}' \boldsymbol{\cdot} \boldsymbol{N}(\boldsymbol{u}') \right\rangle_{xzt}= 0, \end{equation}
where  $\tilde {\mathcal {L}}(U)$ and $\boldsymbol {u}'$ are now the linear operator and velocity vector, respectively, for case NF-SEI180. The excellent agreement between NF-SEI180 and the ensemble average over NF-TG180 $_{i}$ suggests that
 \begin{equation} \left\langle \boldsymbol{u}'_{\{i\}} \boldsymbol{\cdot} \tilde{\mathcal{L}}_{\{i\}} \boldsymbol{u}'_{\{i\}} \right\rangle_{xzte} \approx \left\langle \boldsymbol{u}' \boldsymbol{\cdot} \tilde{\mathcal{L}} \boldsymbol{u}' \right\rangle_{xzt}. \end{equation}
An interpretation of (6.21) (and of figure 23) is that the collection of linear transient growth events due to frozen  $U(y,z,t_i)$ at different instances $t_i$ provides an accurate representation of the actual time-varying energy transfer from $\boldsymbol {U}$ to $\boldsymbol {u}'$ in NF-SEI180. From a dynamical-systems viewpoint: the sampling of the phase-space under the time varying $U$ is statistically equivalent to an ensemble average of solutions in equilibrium with frozen instances of $U$. This is an indication that the nonlinear dynamics supported by $\boldsymbol {N}$ are in quasi-equilibrium with $\mathcal {L}(U)$, i.e. the way the energy is input into the system changes slowly in time. The latter argument can be posed in terms of the time scales of the base flow $T_U$ and turbulent kinetic energy $T_E$. Defining $T_U$ as the time at which the auto-correlation of $U$ (see (4.12)) decays to 0.5 (similarly for $T_E$ from the auto-correlation of $E$), the ratio $T_U/T_E$ is found to be roughly 10. Therefore, changes in the base flow are ten times slower than changes in the turbulent kinetic energy, which is consistent with the discussion above.
As a final note, in a preliminary work Lozano-Durán et al. (Reference Lozano-Durán, Nikolaidis, Constantinou and Karp2020) noticed that turbulent channel flows decayed when freezing the base flow, which may initially seem inconsistent with the present results. However, a main difference is that in the present work we are imposing the base flow from actual wall turbulence (R180), while Lozano-Durán et al. (Reference Lozano-Durán, Nikolaidis, Constantinou and Karp2020) imposed a base flow from modified turbulence. The statistical sample used in the present work is also far larger than that used by Lozano-Durán et al. (Reference Lozano-Durán, Nikolaidis, Constantinou and Karp2020).
6.4. Distilling the transient growth mechanisms
We have shown above that transient growth is the simplest linear model to explain self-sustaining turbulence. In this section we further dissect the relevance of different transient growth mechanisms and the implications for the streaky structure of the base flow. We turn our attention back to (6.2), which can be written as
 \begin{gather} \frac{\partial u'}{\partial t} = -U_0\frac{\partial u'}{\partial x} -v'\frac{\partial U_0}{\partial y} - w'\frac{\partial U_0}{\partial z} - \frac{1}{\rho}\frac{\partial p'}{\partial x} + \nu\nabla^2 u' + N_{u'}, \end{gather}
 \begin{gather}\frac{\partial v'}{\partial t} = -U_0\frac{\partial v'}{\partial x} -\frac{1}{\rho}\frac{\partial p'}{\partial y} + \nu\nabla^2 v' + N_{v'}, \end{gather}
 \begin{gather}\frac{\partial w'}{\partial t} = -U_0\frac{\partial w'}{\partial x} -\frac{1}{\rho}\frac{\partial p'}{\partial z} + \nu\nabla^2 w' + N_{w'}, \end{gather}
 \begin{gather}0 = \frac{\partial u'}{\partial x} + \frac{\partial v'}{\partial y}+\frac{\partial w'}{\partial z}, \end{gather}
where we have explicitly expanded the linear components, and  $N_{u'}, N_{v'}$ and $N_{w'}$ stand for the remaining nonlinear terms. The base flow is $U_0 = U(y,z,t)$ from case R180 and no feedback from $\boldsymbol {u}'$ to $U$ is allowed. Equations (6.22) allow for exponential and parametric instabilities, but we have shown that these are inconsequential for sustaining the flow. Hence, we admit the possibility of both instabilities for the sake of reducing the computational cost of solving (6.22).
We define the streak flow by  $U_{{streak}} = U_0(y,z,t) - \langle u \rangle _{xz}$, and proceed to examine three transient growth mechanisms:
(i) linear lift-up of the streak by
$-v' \partial U_{{streak}}/\partial y$ in (6.22a);(ii) linear push-over of the streak by
$-w'\partial U_{{streak}}/\partial z$ in (6.22a); and(iii) linear Orr of the streak by
$-\partial p'/\partial y$ in (6.22b) and continuity in (6.22d).


In mechanisms (i) and (ii), velocities perpendicular to the base shear  $(0, \partial U_0/\partial y, \partial U_0/\partial z)$ extract energy from the latter to energise the streamwise perturbations, which persist after transients (Ellingsen & Palm Reference Ellingsen and Palm1975). For perturbations in the form of $v'$, the active linear term for energy transfer is $-v' \partial U_{{streak}}/\partial y$, which is referred to as the lift-up effect. For perturbations in the form of $w'$, the energy is transferred through $-w'\partial U_{{streak}}/\partial z$. We label the latter as ‘push-over effect’ to make a clear distinction from the lift-up mechanism, as one relies on spanwise shear of the base flow and the other on the wall-normal shear. The terminology varicose and sinuous is commonly used to refer to the perturbations from mechanism (i) and mechanism (ii), respectively. In mechanism (iii), velocities perpendicular to the base shear are amplified when backwards-leaning perturbations are tilted forward until they are roughly normal to the base shear, and are damped as they continue to be tilted past that point. Mechanisms (i) and (ii) occur concurrently with mechanism (iii), but the amplification in the latter is guided by continuity. In mechanism (iii), the pressure inhibits the cross-shear velocities when the structures are strongly tilted, and releases the inhibition when they are closer to vertical (Orr Reference Orr1907; Jiménez Reference Jiménez2013; Chagelishvili et al. Reference Chagelishvili, Hau, Khujadze and Oberlack2016).
We perform three additional experiments each aiming to suppress one of the linear mechanisms discussed above. In the first experiment, we modify (6.22a) to suppress the linear lift-up of the streak,
while the equations for  $v'$,
$v'$,  $w'$ and continuity remain intact. We labelled this case as NF-NFU180 (no feedback and no lift-up). The second experiment consists of a channel without linear push-over mechanism of the streak,
which is referred to as NF-NPO180 (no feedback and no push-over). Again the equations for  $v'$,
$v'$,  $w'$ and continuity remain the same. We might note here that both modal and non-modal growth share the physical source of the fluctuation amplification: $w \partial U/\partial z$ for sinuous motions and $v\partial U/\partial y$ for varicose motions. Hence, by modifying the latter terms we are also interfering with the modal growth of the system, although, as argued above, we do not worry about this in this section.
In the third experiment, we modify the linear dynamics of  $v'$ to constrain mechanism (iii). The equation dictating the linear Orr is given by
 \begin{equation} \frac{\partial v'_{{linear}}}{\partial t} + U_0 \frac{\partial v'_{{linear}}}{\partial x} = -\frac{1}{\rho}\frac{\partial p'_{{linear}}}{\partial y}, \end{equation}
where we have neglected the viscous effects. As seen in (6.25), the Orr amplification of  $v'_{{linear}}$ is controlled by $p'_{{linear}}$, which is the only source term on the right-hand side of the equation. The linear pressure can be easily obtained by solving
 \begin{equation} \frac{1}{\rho}\nabla^2 p'_{{linear}} = -2 \frac{\partial U_0}{\partial y} \frac{\partial v'}{\partial x} - 2\frac{\partial U_0}{\partial z} \frac{\partial w'}{\partial x}. \end{equation}
If we focus on the linear pressure induced by the streak then
 \begin{equation} \frac{1}{\rho}\nabla^2 p'^{s}_{{linear}} = -2 \frac{\partial U_{streak}}{\partial y} \frac{\partial v'}{\partial x} - 2\frac{\partial U_{streak}}{\partial z} \frac{\partial w'}{\partial x}. \end{equation}
We inhibit the linear Orr mechanism of the streak by introducing a forcing term  $f_{{Orr}}$ on the right-hand side of the $v'$ equation to counteract the gradient of the linear pressure:
 \begin{equation} f_{{Orr}} = -\frac{1}{\rho}\frac{\partial p'^{s}_{{linear}} }{\partial y}. \end{equation}
Then, the system (6.22a)–(6.22d) is modified by replacing (6.22b) by
 \begin{equation} \frac{\partial v'}{\partial t} = -U_0\frac{\partial v'}{\partial x} -\frac{1}{\rho}\frac{\partial p'}{\partial y} + \nu\nabla^2 v' + N_{v'} - f_{{Orr}}. \end{equation}
We refer to this case as NF-NO180 (no feedback and no Orr).
The three cases are initialised using flow fields from NF180. Different initial conditions were tested and the subsequent evolution of the flow was similar regardless of the details of the initial velocity. The evolution of the turbulent kinetic energy for one initialisation is shown in figure 24(a). The case without streak lift-up (NF-NLU180) is the only one sustained. The r.m.s. velocity fluctuations after transients for NF-NLU180 are shown in figure 24(b). Interestingly, blocking the streak lift-up enhances  $u'$ close to the wall, implying that the wall-normal variations of the streak provide a stabilising effect. Conversely, the cases without streak push-over (NF-NPO180) or Orr mechanisms (NF-NO180) decay in less than $5 u_{\tau }/h$. Therefore, we conclude that both streak push-over and the Orr amplification are essential transient growth mechanisms for sustaining the fluctuations. Three more cases analogous to NF-NLU180, NF-NPO180 and NF-NO180 were conducted by allowing the feedback of the fluctuations back into the base flow. The conclusions drawn for these cases are similar to the ones presented above, and they are not included here for the sake of brevity.
(a) The history of the domain-averaged turbulent kinetic energy of the fluctuations  $\langle E \rangle _{xyz}$ for NF-NLU180; NF-NPO180; and NF-NO180. The time $t=0$ is the instant at which the simulations are started. (b) The root-mean-squared streamwise (black), wall-normal (blue) and spanwise (dark orange) fluctuating velocities for NF-NLU180 and NF180.

The necessity of push-over ( $-w'\partial U_{streak}/\partial z$) points at the spanwise variations of $U_{streak}$ (equivalent to spanwise variations of $U_0$) as a key structural feature to sustain turbulence. To test this claim, we resort to the cases NF-TG180 $_{i}$ presented in § 6.3 and inspect their mean turbulent kinetic energy conditioned to the marker for the spanwise-shear strength
 \begin{equation} \varGamma_{\{i\}} = \left\langle \left( \frac{\partial U_{streak}(y,z,t_i)}{\partial z} \right)^2 \right\rangle_{yzt}^{1/2}. \end{equation}
The results, shown in figure 25(a), corroborate the hypothesis that the average kinetic energy of the flow depends on the strength of  $\partial U_{streak}(y,z,t_i)/\partial z$. Additionally, frozen base flows with $\varGamma _{\{i\}}$ below the critical value of $\varGamma _{\{i\},c}^+ \approx 0.03$ are too feeble to maintain turbulence. This is further supported by figure 25(b), which shows that the maximum gain of the base flow also increases with $\varGamma _{\{i\}}$. A visual impression of base flows that are either able or unable to sustain turbulence can be gained from the examples shown in figure 26. The message conveyed by figure 26 agrees with the discussion above: base flows capable of sustaining turbulence are accompanied by strong spanwise variations, $\partial U_{streak}/\partial z$, while base flows unable to maintain turbulence have milder $\partial U_{streak}/\partial z$.
(a) Mean turbulent kinetic energy and (b) maximum gain  $G_{{\{i\}},{max}}$ at $T=T_{{max}}$ conditioned to the marker for the spanwise-shear strength $\varGamma _{\{i\}} = \langle ( \partial U_0(y,z,t_i)/\partial z )^2 \rangle _{yzt}^{1/2}$ compiled over NF-TG180 $_{i}$. The red solid line represents the mean value; the shaded area denotes $\pm$ one standard deviation.

Examples of base flows able to support turbulence (a–c) and unable to support turbulence (d–f) from cases NF-TG180 $_{i}$ discussed in § 6.3. Visual inspection of the base flows suggests that spanwise variations of $U$ are crucial to sustain turbulence.

6.5. Relation with previous studies on secondary linear process
Among the studies in table 1 regarding the secondary linear process, those labelled as TG, TG & EXP, and TG PARA advocate for the algebraic transient growth of the perturbations as a central linear mechanism to energise the velocity fluctuations. The work by Farrell, Ioannou and co-workers complemented the transient growth picture with parametric growth of the perturbations resulting from the time variability of the base flow. In their view, the growth of fluctuations is a concatenation of transient growth events that occur as the base flow varies. We have shown here that time changes in the base flow are needed to recover regular turbulence statistics; however, these time changes do not enhance the energy transfer from the base flow to the fluctuations and, thus, they are not strictly necessary to sustain the flow. The works labelled as TG & EXP deemed both transient growth and modal growth relevant for sustaining wall turbulence, as they are intimately entangled in the equations of motion. On the contrary, Schoppa & Hussain (Reference Schoppa and Hussain2002) argued that modal instability was irrelevant to streak breakdown, and that transient growth driven by the streak profile was the dominant process. The mechanism in Schoppa & Hussain (Reference Schoppa and Hussain2002) was referred to as STG (streak transient growth, i.e. secondary linear process) to make a clear distinction with the more traditional transient growth supported by  $\langle u \rangle _{xzt}$ (i.e. primary linear process). In this sense, our conclusions are more aligned with Schoppa & Hussain (Reference Schoppa and Hussain2002), and transient growth is identified here to overcome other linear mechanisms. Schoppa & Hussain (Reference Schoppa and Hussain2002) also analysed the physical process at play during transient growth in terms of vortex dynamics. They formulated the problem in the streak-vortex-line coordinate system, that procures a clear interpretation of the perturbation vorticity generation. They found that $w'$ perturbations of moderately low amplitude lead to the generation of new vortices and sustained near-wall turbulence via the ‘shearing’ mechanism. The latter results are also consistent with our analysis in § 6.4, where we showed that the push-over mechanism (represented by $-w' \partial U_{{streak}} /\partial z$) drives the generation of perturbations. Schoppa & Hussain (Reference Schoppa and Hussain2002) traced back the source of fluctuations to $\partial \langle u \rangle _{xzt} /\partial n$, where $n$ is the direction normal to the base flow vortex lines and includes contributions of both $\partial \langle u \rangle _{x} /\partial y$ and $\partial \langle u \rangle _{x} /\partial z$. Here, we have further demonstrated that the spanwise shear $\partial \langle u \rangle _{x} /\partial z \equiv \partial U_{{streak}} /\partial z$ dominates over $\partial U_{{streak}} /\partial y$.
Despite our main conclusions being consistent with Schoppa & Hussain (Reference Schoppa and Hussain2002), the causal analysis followed in the present study is fundamentally different from that adopted in previous works. This is an important point, as our approach allows us to tackle the criticism raised by the community on transient growth as the prevailing mechanism for the secondary linear process. In the remainder of this section, we survey previous criticisms and discuss how our contributions overcome existing deficiencies. First, it is pertinent to clarify that transient growth due to high non-normality of the linearised Navier–Stokes operator is an intrinsic feature of the equations of motion. Transient growth represents the transport of momentum normal to the base shear, which is a necessary requirement for mixing of the flow and, hence, for turbulence. Therefore, the debate in the community is not about the ubiquity of transient growth in turbulence, but about the necessity of additional sorts of instabilities to sustain the fluctuations (as shown in table 1).
The scepticism on the ability of transient growth alone to fuel the generation of  $\boldsymbol {u}'$ has materialised in the following forms.
(i) Jiménez (Reference Jiménez2018) pointed out that the absence of unstable streaks reported by Schoppa & Hussain (Reference Schoppa and Hussain2002) can be interpreted as an indication that the instability is important. Quoting Jiménez (Reference Jiménez2018): One may think of the low probability of finding upright pencils on a shaking table. Unstable flow patterns would not be found precisely because instability destroys them.’
(ii) Jiménez (Reference Jiménez2018) also argued that transient growth as envisioned by Schoppa & Hussain (Reference Schoppa and Hussain2002) is a property of the streak itself, implying that the energy of
$\boldsymbol {u}'$ is drawn from the energy of $U_{{streak}}$. The premise is reasonable close to the wall, where $|\boldsymbol{u}'|^2/2$ is a small fraction of streak energy $U^2_{streak}/2$, but it becomes problematic farther from the wall, where both energies are comparable. If the transverse velocities had to obtain their energy from the streak, one would expect a negative correlation between the two energies, but the opposite seems to be true. Instead, Jiménez (Reference Jiménez2018) suggested that the actual source of energy for $\boldsymbol {u}'$ would come from $\langle u \rangle _{xzt}$, which is also part of the base flow in Schoppa & Hussain (Reference Schoppa and Hussain2002).(iii) Other authors have reasoned, as mentioned above, that it is essentially impossible to distinguish between streak transient growth and streak modal instability, as both processes can be traced back to the same source term in the linearised Navier–Stokes equations, namely,
$-w' \partial \langle u \rangle _{x} /\partial z - v' \partial \langle u \rangle _{x} /\partial y$ (Hœpffner et al. Reference Hœpffner, Brandt and Henningdon2005; Cassinelli et al. Reference Cassinelli, de Giovanetti and Hwang2017; de Giovanetti et al. Reference de Giovanetti, Sung and Hwang2017). Consequently, both transient growth and modal instability occur concurrently during streak breakdown and both should be considered responsible for replenishing $\boldsymbol {u}'$.(iv) Another criticism comes from the effect of time-varying base flows. Schoppa & Hussain (Reference Schoppa and Hussain2002) investigated the effect of unfrozen streaks on modal instabilities and transient growth. They showed that unfrozen (freely diffusing) streaks are still able to support transient growth with amplifications of the order of 10, whereas the initially unstable base flow provided only a factor of 2. However, the analysis was performed on freely decaying streaks, while streaks in actual wall turbulence are subjected to periods of both growth and decay. Precluding the growth phase of the streaks might have important consequences for the growth of perturbations. For example, Farrell & Ioannou (Reference Farrell and Ioannou2012) have shown that a potential route to enhance the gain for short times and/or achieve finite gains for long times is the parametric instability of the streak discussed in the introduction (Farrell & Ioannou Reference Farrell and Ioannou1999, Reference Farrell and Ioannou2012; Farrell et al. Reference Farrell, Ioannou, Jiménez, Constantinou, Lozano-Durán and Nikolaidis2016). In contrast with the freely diffusing base flow, alternating periods of growth and decay in the base flow can enhance the energy transfer from
$\boldsymbol {U}$ to $\boldsymbol {u}'$ and should be taken into consideration.(v) Finally, some authors have criticised or at least found questionable the use of linear stability theory to analyse time-varying base flows and base flows defined by an average (for example,
$\langle u \rangle _x$) rather than by a solution of the Navier–Stokes equations. Most of the successful and well-established results from linear stability theory have been derived in the case of laminar-to-turbulence transition with small perturbations, where the underlying assumptions are rigorously satisfied. This is obviously not the case for turbulent flows (see the discussion in Hussain Reference Hussain1983, Reference Hussain1986). One conceptual objection is the fact that stability analysis of ‘frozen’ turbulent profiles would be appropriate only if the time scales of the actual time-varying mean flow were much smaller than those of the instabilities. However, some authors have pointed out that time changes in the turbulent mean flow could be of the same order as those of the instability wave. Thus, the instabilities do not ‘see’ this mean flow and their evolution departs noticeably from that predicted from linear stability theory. Another recurrent objection is granting the status of ‘perturbations’ (assumed to be small, e.g. ${<}0.1\,\%$), to the turbulent fluctuations, $\boldsymbol {u}'$ (which might reach values above $10\,\%$ of the mean flow, especially close to the wall). Hence, the evolution of these (not-so-small) $\boldsymbol {u}'$ ‘perturbations’ is subjected to non-negligible contributions from nonlinear interactions, which might invalidate the predictions from linear stability theory.


We have addressed the criticism discussed above by formulating the problem within a cause-and-effect framework. Whilst there is no such thing as a methodology free from limitations, we have argued that cause-and-effect analysis entails a substantial leap in the study of turbulence compared to non-causal analysis by post-processing of data. Following the same order used to introduce the criticism above, we address each as follows.
(i) We have contributed to settle the debate regarding the role played by modal instabilities by showing that these are not necessary to sustain wall turbulence. This was achieved by completely precluding the possibility of exponential growth from the linear Navier–Stokes operator at all times (see § 6.2).
(ii) We have shown that inhibiting the effect of
$\partial U_{{streak}}/ \partial z$ interrupts the self-sustaining cycle. Hence, the extraction of energy from the streak $\partial U_{{streak}}/ \partial z$ is a necessary condition to maintain $\boldsymbol {u}'$. Note that we do not imply that $\partial \langle u \rangle _{xzt}/ \partial y$ is inconsequential to sustaining turbulence, but that the spanwise variations of the streak are also an active participant in the self-sustaining cycle of turbulence (see § 6.4).(iii) Despite the fact that modal and non-modal growth of the fluctuations originate from the same physical term in the Navier–Stokes equations, we have established a clear distinction between both mechanisms by manipulating the linear Navier–Stokes operator. We have shown that it is possible to block modal instabilities, while maintaining the transient growth mechanism almost intact (see § 6.3).
(iv) Both post-processing analysis § 4 and cause-and-effect analysis in § 6 comprise time-varying base flows which evolve in a realistic manner, as they are extracted from actual direct numerical simulation data. As such, the evolution of the base flow experiences periods of both growth and decay consistent with actual wall turbulence, which allows for an accurate estimation of the linear mechanism assisting the growth of
$\boldsymbol {u}'$.(v) The validity of linear theories for fully developed turbulence is more subtle, and we have commented on this topic in § 1. Paraphrasing the argument given in the introduction, expressing the fluctuation equation in the form of (1.1) does not require invoking linearisation about
$\boldsymbol {U}$ nor assuming that $\boldsymbol {u}'$ is small. If the volume integral of $\boldsymbol {u}'\boldsymbol {\cdot } \boldsymbol {N}(\boldsymbol {u}')$ is zero then the only way of sustaining $\boldsymbol {u}'$ is through the energy injection from $\boldsymbol {u}' \boldsymbol {\cdot } \mathcal {L}(\boldsymbol {U})\boldsymbol {u}'$. Thus, for a partition of the flow $\boldsymbol {U} + \boldsymbol {u}'$, we can always refer to the linear mechanisms supported by $\mathcal {L}(\boldsymbol {U})$ and assess their relevance in sustaining turbulence regardless of how ‘good’ the linearisation is. This is because our cause-and-effect analysis is conducted for the fully nonlinear equations, instead of only for the linear component. Thus, when we inquire about the validity of a particular linearisation we are indeed asking about the usefulness of the partition $\boldsymbol {U} + \boldsymbol {u}'$ in explaining the dynamics of $\boldsymbol {u}'$ via the linear mechanisms supported by $\boldsymbol {U}$, which circumvents the problem of linearisation.


We close this section by discussing some discrepancies with Schoppa & Hussain (Reference Schoppa and Hussain2002). The stability analysis conducted in § 4.1 reveals that our base flow  $U(y,z)$ is modally unstable 90 % of the time. On the contrary, Schoppa & Hussain (Reference Schoppa and Hussain2002) found that most streaks have intensities that are too low to be modally unstable. It is unclear what is the root of such a difference – it might be related to the synthetic base flow used in Schoppa & Hussain (Reference Schoppa and Hussain2002), while here we used instantaneous base flow from direct numerical simulations, which are more corrugated and prone to modal instabilities. Other possible explanations are the criteria used by Schoppa & Hussain (Reference Schoppa and Hussain2002) to quantify unstable streaks via a vorticity-based inclination angle, or the use of a minimal turbulent channel in the present study. A second difference of our work with Schoppa & Hussain (Reference Schoppa and Hussain2002) comes from the value of the gains provided by transient growth. In § 4.2 we have shown that our gains are of the order of 100, while the gains reported in Schoppa & Hussain (Reference Schoppa and Hussain2002) are of the order of 10. The cause for this discrepancy is related to the perturbation chosen by Schoppa & Hussain (Reference Schoppa and Hussain2002), which differs substantially from ours. Schoppa & Hussain (Reference Schoppa and Hussain2002) used a physics-motivated perturbation in $w'$. In our case, we are considering optimal perturbations, which lead to much higher amplifications.
7. Conclusions
We have investigated the processes responsible for the energy transfer in wall turbulence from the streamwise-averaged mean flow  $U(y,z,t)$ to the fluctuating flow $\boldsymbol {u}'(x,y,z,t)$. This energy transfer is the backbone of self-sustaining wall turbulence and a subject of heated debates. It has long been hypothesised that the mechanism by which the energy is transferred from $U$ to $\boldsymbol {u}'$ can be captured by the linearised Navier–Stokes equations and various linear theories stand as tenable candidates to rationalise this process. The most prominent theories are exponential instabilities of the base flow, nonlinear interactions facilitated via neutral modes, non-modal transient growth and non-modal transient growth supported by parametric instability, among others (see table 1). To date, a conclusive study regarding the role played by each linear mechanism has been elusive due to the lack of methodologies designed to unveil causal inference in the flow.
In the present work, we have used cause-and-effect analysis based on interventions to assess the role played by different linear mechanisms in sustaining turbulence. The approach is rooted on the concept that manipulation of the causing variable leads to changes in the effect. To that end, we sensibly modified the Navier–Stokes equations of a turbulent channel flow to preclude one or various linear mechanisms participating in the energy transfer from  $U$ to $\boldsymbol {u}'$. We devised a set of numerical experiments tailored for minimal turbulent channel units at $Re_{\tau }\approx 180$ in which the feedback from $\boldsymbol {u}' \rightarrow U$ is blocked to isolate the energy transfer from $U \rightarrow \boldsymbol {u}'$. The active linear mechanisms for each numerical experiment and its consequences are summarised in table 2. In the first set of the experiments, the linear Navier–Stokes operator is modified to render any exponential instabilities of the streaks stable, thus precluding the energy transfer from $U \rightarrow \boldsymbol {u}'$ via exponential growth or interaction with neutral modes. In the second set of experiments, we simulated turbulent channel flows with prescribed, frozen-in-time, exponentially stable base flows, such that both parametric instabilities as well as exponential instabilities are suppressed. The last set of experiments is devoted to further pinpoint the process for energy transfer via transient growth by constraining the linear Orr, lift-up or push-over mechanisms, the latter being analogous to the lift-up effect but in the spanwise direction.
The main contribution of this work is to establish that transient growth alone is capable of sustaining wall turbulence with realistic mean velocity and turbulence intensities in the absence of exponential instabilities, neutral modes and parametric instabilities. We have further shown that transient growth originates mostly from the Orr/push-over mechanisms due to spanwise variations of  $U$. Our results are obtained for the fully nonlinear Navier–Stokes equations in which the scattering of fluctuations by the nonlinear term is required in combination with transient growth. Exponential instabilities also manifest in the flow, but they are only responsible for approximately 10 % of the turbulent fluctuating velocities, and more importantly, turbulence persists when they are inhibited. We have also shown that turbulence persists when disposing of parametric instabilities by using exponentially stable frozen-in-time base flows. In these cases, the statistics of the resulting turbulence depend on the particular frozen base flow selected. However, the ensemble average of cases with different frozen-in-time base flows reproduces the statistics of actual (time-varying- $U$) turbulence with striking accuracy. This was justified by showing that the way the energy is input from $U$ into the system changes slowly compared to the nonlinear dynamics of $\boldsymbol {u}'$. In summary, turbulence statistics are essentially explained by a collection of linear transient growth processes in conjunction with nonlinear scattering. The evidence that the ensemble average over multiple solutions (§ 6.3) offers a simplified but complete representation of the system also resembles the dynamical-system viewpoint that a large enough set of (invariant) solutions and their manifolds constitute the skeleton of flow trajectories in turbulence (Auerbach et al. Reference Auerbach, Cvitanović, Eckmann, Gunaratne and Procaccia1987; Cvitanović Reference Cvitanović1991).
The outcome of this study is consistent with Schoppa & Hussain (Reference Schoppa and Hussain2002). However, as inferred from the literature review in table 1, the transient growth scenario was far from being widely accepted. The possibility of turbulence exclusively supported by transient growth has been long hypothesised (Trefethen et al. Reference Trefethen, Trefethen, Reddy and Driscoll1993), but its relevance has never been persuasively shown in the full Navier–Stokes equations using cause-and-effect analysis. To the best of our knowledge, our results are the most conclusive demonstration of transient growth (via Orr/push-over) as a key driving mechanism of self-sustaining turbulence. It is important to emphasise that our conclusions do not imply that other mechanisms are not active in wall turbulence. Indeed, we have shown that modal instabilities do manifest in the flow, and to some extent this and other mechanisms have been observed by previous investigators. We have also shown that time variations of  $U$ are necessary to sample the perturbation phase-space and recover the nominal turbulence statistics. The picture promoted here is that the linear energy transfer via transient growth overwhelms other competing mechanisms and, as such, is able to explain most of the flow statistics. This simplifies the conceptual model of wall turbulence and unravels the linear processes that should be targeted in turbulence modelling and control.
Our conclusions regarding the dynamics of wall turbulence were drawn using direct numerical simulations of the Navier–Stokes equations at low Reynolds numbers representative of the buffer layer. It remains to establish whether similar conclusions apply to higher  $Re_{\tau }$. The analysis was also performed in channels computed using minimal flow units, chosen as simplified representations of naturally occurring wall turbulence. Yet, we have shown that our results are qualitatively similar when the domain size is doubled. We expect that the approach presented here paves the way for future investigations at high-Reynolds-numbers turbulence obtained in larger unconstrained domains, in addition to extensions to different flow configurations in which the role of linear mechanisms remains unsettled.
Acknowledgements
We thank J. Bae, G. Chini, B. Farrell, Y. Hwang, P. Hall, F. Hussain, P. Ioannou and J. Jiménez for insightful discussions and comments.
Funding
This work was supported by the Coturb project of the European Research Council (ERC-2014.AdG-669505) during the 2019 Coturb Turbulence Summer Workshop at the Universidad Politécnica de Madrid. M.-A.N. acknowledges the support of the Hellenic Foundation for Research and Innovation, and the General Secretariat for Research and Technology (grant number 1718/14518). A.L.-D. acknowledges the support of the NASA Transformative Aeronautics Concepts Program (grant number NNX15AU93A) and the Office of Naval Research (grant number N000141712310). N.C.C. was supported by the Australian Research Council (grant number CE170100023). M.K. was supported by the Air Force Office of Scientific Research under grant FA9550-16-1-0319 and the Office of Naval Research under grant N00014-17-1-2341.
Declaration of interests
The authors report no conflict of interest.
Appendix A. Sensitivity to the size of the computational domain
The minimum size of the computational domain required to sustain turbulence in channels at low Reynolds number was extensively studied by Jiménez & Moin (Reference Jiménez and Moin1991). The streamwise and spanwise lengths of our simulations were selected to comply with these minimum requirements. We verified that decreasing the streamwise ( $L_x$) and spanwise ( $L_z$) extends of our domain any further in the current set-up leads to laminarisation of the flow. In this appendix we focus on the sensitivity of our results to increasing $L_x$ and $L_z$. The former is potentially the most critical length as the base flow is defined by taking the streamwise average of $u$. We have also seen that the most unstable instabilities occur for the wavenumber $k_x=2{\rm \pi} /L_x$, which is the harmonic excitation and, hence, might be susceptible to changes in $L_x$. Therefore, we centre our attention on $L_x$ and the role of subharmonic instabilities. Some comments are made at the end of the appendix on the sensitivity to $L_z$.
Prior to conducting the sensitivity analysis for  $L_x$, we can anticipate that the subharmonic instabilities associated with $k_x=2{\rm \pi} /(n L_x)$ with $n>1$ are probably of little relevance for sustaining the flow. The most obvious reason is that wavenumbers equal or smaller than $k_x={\rm \pi} /L_x$ are not accommodated in the domain (they simply do not fit in $x$) and subharmonic instabilities cannot manifest in the flow. Given that our simulations show that turbulence is sustained with a realistic mean profile and fluctuating velocities for the chosen $L_x$, the importance of the (non-existent) subharmonic instabilities must be minor. To ascertain that this is the case, we (i) perform an a priori analysis of the stability of $U(y,z,t)$ assuming that instabilities from $k_x={\rm \pi} /L_x$ are realisable, and (ii) conduct additional simulations by doubling the streamwise domain.
We study the stability of  $U(y,z,t)$ from case R180, similar to the analysis in § 4.1. In this occasion, we focus on the growth rates for perturbations with streamwise wavenumbers $k_x={\rm \pi} /L_x$ and $k_x=2{\rm \pi} /L_x$ denoted by $\lambda _{max}^{k_x={\rm \pi} /L_x}$ and $\lambda _{max}^{k_x=2{\rm \pi} /L_x}$, respectively. It is important to remark that $\lambda _{max}^{k_x={\rm \pi} /L_x}$ is the hypothetical growth rate of exponential instabilities with wavenumber $k_x={\rm \pi} /L_x$ if they were allowed to manifest in the flow (which they are not). The p.d.f. of the ratio $\lambda _{max}^{k_x=2{\rm \pi} /L_x} / \lambda _{max}^{k_x={\rm \pi} /L_x}$ for a given base flow at time $t_i$, $U(y,z,t_i)$, is plotted in figure 27(a), and shows that the harmonic instability (which are realisable in the simulation) prevails over the (hypothetical) subharmonic instability. The data also reveal that $\lambda _{max}^{k_x=2{\rm \pi} /L_x}>\lambda _{max}^{k_x={\rm \pi} /L_x}$ approximately 80 % of the time. The result proves that the base flows for case R180 are more receptive to harmonic instabilities than they are to subharmonic instabilities.
The probability density function of the ratio of the largest growth rates  $\lambda _{max}^{k_x=2{\rm \pi} /L_x} /\lambda _{max}^{k_x={\rm \pi} /L_x}$ of a given base flow at time $t_i$, $U(y,z,t_i)$ for (a) case R180 and (b) case R-2Lx-180.

The second analysis consists of an actual simulation with streamwise domain length equal to  $2L_x^+ \approx 673$ ( $2L_x \approx 3.66h$), such that the instabilities associated with $k_x={\rm \pi} /L_x$ are now allowed in the flow (note that $L_x$ and $L_z$ signify the domain size of R180). We label this case as R-2Lx-180, which is analogous to R180 but with doubled streamwise domain length. Figure 28 illustrates the flow decomposition into base flow and fluctuations for R-2Lx-180 and figure 29 depicts three examples of base flows. Consistently, the base flows for R-2Lx-180 are defined as $U(y,z,t) = \langle u \rangle _x = 1/2L_x \int _{0}^{2L_x} u\,\mathrm {d}\kern0.05em x$.
Decomposition of the instantaneous flow into a streamwise mean base flow and fluctuations for case R-2Lx-180. Instantaneous isosurface of streamwise velocity for (a) the total flow  $u$, (b) the streak base flow $U$ and (c) the absolute value of the fluctuations $|u'|$. The values of the isosurfaces are 0.6 (a,b) and 0.1 (c) of the maximum streamwise velocity. Shading represents the distance to the wall from dark ( $y=0$) to light ( $y=h$). The arrow in panel (a) indicates the mean flow direction.

Examples of base flow  $U(y,z,t)$ for case R-2Lx-180. The shading denotes the value of the streamwise velocity in wall units.

Figure 30 shows the r.m.s. fluctuating velocities for R-2Lx-180 compared with the minimal channel flow R180. The main effect of enlarging the domain in  $x$ is an increase in $u'$, which comes from the larger scales accommodated by the computational box. The energy in $u'$ is now closer to the nominal value in non-minimal domains, but we have argued in § 3 that this additional energy is not strictly required to sustain turbulence.
(a) Streamwise, (b) wall-normal and (c) spanwise root-mean-squared fluctuating velocities as a function of the wall-normal distance for R-2Lx-180 (black solid line) and equivalent non-minimal channel (L180) with  $6.7L_x^+ \times 6.7L_z^+ = 2312 \times 1156$ ( $\approx 12.5h \times 6.3h$) (black dashed line), where $L_x$ and $L_z$ signify the channel domain for R180. Case R180 is represented by dotted lines.

The stability analysis of  $U(y,z,t)$ for R-2Lx-180 and wavenumbers $k_x = {\rm \pi}/L_x$ and $k_x = 2{\rm \pi} /L_x$ is included in figure 27(b). The outcome is similar to R180: $\lambda _{max}^{k_x=2{\rm \pi} /L_x}$ prevails over $\lambda _{max}^{k_x={\rm \pi} /L_x}$ most of the time, and this is true even if now the streamwise domain is $2L_x$. This suggests that the most unstable wavelength should be around the length of the minimal channel.
To complete the analysis and build confidence in the results presented in the paper, we perform two simulations with constrained linear dynamics using R-2Lx-180 as a baseline. In the first case, a selected base flow from R-2Lx-180 is frozen-in-time and the exponential instabilities are removed. We denote this case as NF-TG-2Lx-180 $_{\{1\}}$ (similar to cases NF-TG180 $_{\{i\}}$ in § 6.3). In the second case, the linear push-over mechanism is cancelled out (similar to case NF-NPO180 in § 6.4). The cases are initialised from R-2Lx-180, although it was assessed that the conclusions are independent of the initial condition. The evolution of the turbulence kinetic energy for both cases is shown in figure 31. For NF-TG-2Lx-180 $_{\{1\}}$, turbulence is maintained despite the lack of exponential and parametric instabilities. For the particular base flow chosen in NF-TG-2Lx-180 $_{\{1\}}$, the turbulent kinetic energy is on average larger than that for R-2Lx-180, although other base flows (not shown) exhibit a lower value. Conversely, the turbulent kinetic energy decays for NF-NPO-2Lx-180, where the linear push-over is suppressed. Therefore, the main conclusions drawn from simulations with a streamwise domain equal to $2L_x$ are consistent with those discussed in the paper with streamwise domain $L_x$.
The history of the domain-averaged turbulent kinetic energy of the fluctuations  $\langle E \rangle _{xyz}$ for the case with frozen base flow without exponential instabilities (NF-TG-2Lx-180 $_{1}$), channel without linear push-over (NF-NPO-2Lx-180) and regular channel flow (R-2Lx-180). The vertical axis is linear in panel (a) and logarithmic in panel (b).

Finally, we carried out simulations analogous to those described above doubling the spanwise length of the domain. Our conclusions remain unchanged. This is not unexpected as enlarging  $L_z$ mostly translates into an increment on the number of coherent structures contained in the domain along the $z$ direction. The new channel is not minimal as it contains more than one elementary flow unit, but the characteristics of the base flow are barely affected.
Appendix B. Results for base flow $(U,V,W)$

For completeness, we repeat the analysis in § 6 using this time the streamwise-averaged  $v$ and $w$ as part of our base flow, i.e.
 \begin{equation} \boldsymbol{U} {\stackrel{\textrm{def}}{=}} (U,V,W) = ( \langle u \rangle_x, \langle v \rangle_x, \langle w \rangle_x). \end{equation}
Consequently, the perturbations are now defined as  $u' = u - U$, $v' = v - V$ and $w' = w - W$. We carried out simulations analogous to those discussed in table 2. The conclusions drawn using $(U,V,W)$ as the base flow are similar to those using $(U,0,0)$. Here we report some of the key results.
The new equation for  $\boldsymbol {U}$ is obtained by replacing the operator $\mathcal {D}$ used to set the $y$- and $z$-components, namely,
 \begin{equation} \mathcal{D} = \begin{bmatrix} 1 & 0 & 0\\ 0 & 0 & 0\\ 0 & 0 & 0 \end{bmatrix}, \end{equation}
by the identity operator  $\mathcal {D} = \mathcal {I}$ such that
 \begin{gather} \frac{\partial \boldsymbol{U}}{\partial t} + \boldsymbol{U} \boldsymbol{\cdot} \boldsymbol{\nabla} \boldsymbol{U} = -\langle \boldsymbol{u}' \boldsymbol{\cdot} \boldsymbol{\nabla} \boldsymbol{u}' \rangle_x - \frac{1}{\rho}\boldsymbol{\nabla} \langle p \rangle_x + \nu \nabla^2 \boldsymbol{U} + \boldsymbol{f}, \end{gather}
 \begin{gather}\boldsymbol{\nabla} \boldsymbol{\cdot} \boldsymbol{U} = 0. \end{gather}
The equation for the new fluctuating velocity vector is
 \begin{gather} \frac{\partial\boldsymbol{u}'}{\partial t} = \mathcal{L}(\boldsymbol{U})\boldsymbol{u}' + \boldsymbol{N}(\boldsymbol{u}'), \end{gather}
 \begin{gather}\mathcal{L}(\boldsymbol{U})\boldsymbol{u}' = \mathcal{P}\left[ -\boldsymbol{U}\boldsymbol{\cdot} \boldsymbol{\nabla} \boldsymbol{u}' - \boldsymbol{u}' \boldsymbol{\cdot} \boldsymbol{\nabla} \boldsymbol{U} + \nu \nabla^2 \boldsymbol{u}' \right], \end{gather}
 \begin{gather}\boldsymbol{N}(\boldsymbol{u}') = \mathcal{P}\left[ -\boldsymbol{u}' \boldsymbol{\cdot} \boldsymbol{\nabla} \boldsymbol{u}' + \langle \boldsymbol{u}' \boldsymbol{\cdot} \boldsymbol{\nabla} \boldsymbol{u}' \rangle_x \right]. \end{gather}
First, we remove the explicit feedback from  $\boldsymbol {u}'$ to $(U,V,W)$ and refer to this case as $\widetilde {\mathrm {NF}}$180 (analogous to NF180). Figure 32 shows that the effect of blocking the feedback from $\boldsymbol {u}'$ to $(U,V,W)$ is to enhance the fluctuating velocities, similarly to NF180. The results exhibit an improved collapse when the velocities are scaled by $u_{\star }$, which is more representative of characteristic flow velocity.
(a) Streamwise, (b) wall-normal and (c) spanwise mean root-mean-squared fluctuating velocities as a function of the wall-normal distance for case R180 normalised by  $u_{\tau }$, case $\widetilde {\mathrm {NF}}$180 normalised by $u_{\tau }$ and $\widetilde {\mathrm {NF}}$180 normalised by $u_{\star }$.

In the second experiment, we remove the exponential instability of the streaks and label the case as  $\widetilde {\mathrm {NF}}$-SEI180 (analogous to NF-SE180). The results, included in figure 33 (red dashed lines), show that turbulence is maintained in the absence of exponential instabilities. When comparing $\widetilde {\mathrm {NF}}$-SEI180 with $\widetilde {\mathrm {NF}}$180, the former exhibits a mildly reduced level of fluctuating velocities (similar to the observation from NF-SEI180 compared to NF180).
(a) Mean velocity profile, (b) root-mean-squared streamwise, (c) wall-normal and (d) spanwise fluctuating velocities: the black solid line is the ensemble average of turbulent cases  $\widetilde {\mathrm {NF}}$-TG180 $_{i}$, namely, $\langle \langle u_{\{i\}} \rangle _{xzt} \rangle _e$, $\langle \langle u'^2_{\{i\}} \rangle _{xzt}^{1/2} \rangle _e$, $\langle \langle v'^2_{\{i\}} \rangle _{xzt}^{1/2} \rangle _e$ and $\langle \langle w'^2_{\{i\}} \rangle _{xzt}^{1/2} \rangle _e$; the shaded region denotes $\pm$ one standard deviation with respect to the ensemble average operator $\langle \boldsymbol {\cdot } \rangle _e$; the red dashed line is $\langle u'^2 \rangle _{xzt}^{1/2}$, $\langle v'^2 \rangle _{xzt}^{1/2}$, and $\langle w'^2 \rangle _{xzt}^{1/2}$ for $\widetilde {\mathrm {NF}}$-SEI180.

Finally, we perform simulations freezing the base flow in addition to removing the exponential instabilities as in § 6.3. The cases are denoted as  $\widetilde {\mathrm {NF}}$-TG180 $_{i}$ (analogous to NF-TG180 $_{i}$). Turbulence is sustained in 90 % of the cases. From figure 33 we conclude that the discussion in § 6.3 is broadly applicable to the base flow $(U,V,W)$: wall turbulence exclusively supported by transient growth is sustained and able to produce realistic flow statistics.
Appendix C. Details of the stability analysis
In this appendix we describe the linear stability analysis of a base flow,  $U(y, z, t)$, which is inhomogeneous in two spatial directions (e.g., Karp & Cohen Reference Karp and Cohen2014). At given time $t=t_0$, we assume the following velocity field:
 \begin{equation} \boldsymbol{u}=\left(U(y,z,t_0),0,0\right)+\varepsilon\boldsymbol{u}',\quad 0<\varepsilon\ll 1. \end{equation}
Here the base flow  $U$ is assumed parallel, steady and streamwise independent, and $\boldsymbol {u}'$ is the disturbance. Substituting (C1) into the incompressible Navier–Stokes equations (2.1), neglecting terms of order $\varepsilon ^2$ and higher, and gathering the terms at order $\varepsilon$, we obtain the linearised equations for the disturbances:
 \begin{gather} \frac{\partial u'}{\partial x}+\frac{\partial v'}{\partial y}+\frac{\partial w'}{\partial z} =0, \end{gather}
 \begin{gather}\frac{\partial u'}{\partial t} + U\frac{\partial u'}{\partial x}+v'\frac{\partial U}{\partial y} + w'\frac{\partial U}{\partial z} = -\frac{1}{\rho}\frac{\partial p'}{\partial x} + \nu\nabla^2 u', \end{gather}
 \begin{gather}\frac{\partial v'}{\partial t} + U\frac{\partial v'}{\partial x} = -\frac{1}{\rho}\frac{\partial p'}{\partial y} + \nu\nabla^2 v', \end{gather}
 \begin{gather}\frac{\partial w'}{\partial t} + U\frac{\partial w'}{\partial x} = -\frac{1}{\rho}\frac{\partial p'}{\partial z} + \nu\nabla^2 w'. \end{gather}
The boundary conditions are no slip at the wall and free slip for  $u'$ and $w'$ and impermeability for $v'$ at the top. Homogeneity in $x$ and $t$ allows us to assume that all flow fields for the disturbances take the form, e.g.
 \begin{equation} u'=\hat{u}'(y, z)\exp({(\lambda+\textrm{i}\omega)t + \textrm{i} k_x x}), \end{equation}
where  $k_x$ is the streamwise wavenumber, and $\lambda +\textrm {i}\omega$ is the temporal complex eigenvalue. (Similarly for $v'$,
$v'$,  $w'$ and $p'$.)
Substituting (C3) into the linearised equations (C2), they can be rearranged as a generalized eigenvalue problem,
 \begin{equation} \begin{pmatrix} \boldsymbol{\mathsf{D}}_{\boldsymbol{\mathsf{x}}} & \boldsymbol{\mathsf{D}}_{\boldsymbol{\mathsf{y}}} & \boldsymbol{\mathsf{D}}_{\boldsymbol{\mathsf{z}}} & \boldsymbol{\mathsf{O}}\\ \boldsymbol{\mathsf{C}} & \boldsymbol{\mathsf{U}}_{\boldsymbol{\mathsf{y}}} & \boldsymbol{\mathsf{U}}_{\boldsymbol{\mathsf{z}}} & \boldsymbol{\mathsf{D}}_{\boldsymbol{\mathsf{x}}}\\ \boldsymbol{\mathsf{O}} & \boldsymbol{\mathsf{C}} & \boldsymbol{\mathsf{O}} & \boldsymbol{\mathsf{D}}_{\boldsymbol{\mathsf{y}}}\\ \boldsymbol{\mathsf{O}} & \boldsymbol{\mathsf{O}} & \boldsymbol{\mathsf{C}} & \boldsymbol{\mathsf{D}}_{\boldsymbol{\mathsf{z}}} \end{pmatrix} \begin{pmatrix} \begin{array}{c} \tilde{u}'\\ \tilde{v}'\\ \tilde{w}'\\ \tilde{p}' \end{array} \end{pmatrix} = (\lambda+\textrm{i}\omega) \begin{pmatrix}\boldsymbol{\mathsf{O}} & \boldsymbol{\mathsf{O}} & \boldsymbol{\mathsf{O}} & \boldsymbol{\mathsf{O}}\\ -\boldsymbol{\mathsf{I}} & \boldsymbol{\mathsf{O}} & \boldsymbol{\mathsf{O}} & \boldsymbol{\mathsf{O}}\\ \boldsymbol{\mathsf{O}} & -\boldsymbol{\mathsf{I}} & \boldsymbol{\mathsf{O}} & \boldsymbol{\mathsf{O}}\\ \boldsymbol{\mathsf{O}} & \boldsymbol{\mathsf{O}} & -\boldsymbol{\mathsf{I}} & \boldsymbol{\mathsf{O}} \end{pmatrix} \begin{pmatrix}\tilde{u}'\\ \tilde{v}'\\ \tilde{w}'\\ \tilde{p}' \end{pmatrix}. \end{equation}
Here,  $\boldsymbol{\mathsf{I}}$ is the identity matrix, $\boldsymbol{\mathsf{O}}$ is a zero matrix, $\tilde {u}'$ is a one-dimensional representation of a two-dimensional vector
 \begin{equation} \tilde{u}' {\stackrel{\textrm{def}}{=}} \left(\hat{u}'(y_1,z_1), \ldots, \hat{u}'(y_1,z_{N_z}), \cdots, \hat{u}'(y_{N_y},z_1), \ldots, \hat{u}'(y_{N_y},z_{N_z})\right)^{\mathrm{T}}, \end{equation}
and similarly for  $\tilde {v}'$, $\tilde {w}'$ and $\tilde {p}'$. Furthermore, the matrices $\boldsymbol{\mathsf{C}}$, $\boldsymbol{\mathsf{U}}_{\boldsymbol{\mathsf{y}}}$, $\boldsymbol{\mathsf{U}}_{\boldsymbol{\mathsf{z}}}$, $\boldsymbol{\mathsf{D}}_{\boldsymbol{\mathsf{x}}}$, $\boldsymbol{\mathsf{D}}_{\boldsymbol{\mathsf{y}}}$ and $\boldsymbol{\mathsf{D}}_{\boldsymbol{\mathsf{z}}}$ are given by
 \begin{gather} \boldsymbol{\mathsf{C}} = \textrm{i} k_x \text{diag}\left(\boldsymbol{\mathsf{U}}\right) - \nu\left(\bar{\boldsymbol{\mathsf{I}}}_{\boldsymbol{\mathsf{z}}}\otimes\bar{\boldsymbol{\mathsf{D}}}^2_{\boldsymbol{\mathsf{y}}} + \bar{\boldsymbol{\mathsf{D}}}^2_{\boldsymbol{\mathsf{z}}}\otimes\bar{\boldsymbol{\mathsf{I}}}_{\boldsymbol{\mathsf{y}}} - k_x^2\bar{\boldsymbol{\mathsf{I}}}_{\boldsymbol{\mathsf{z}}}\otimes\bar{\boldsymbol{\mathsf{I}}}_{\boldsymbol{\mathsf{y}}}\right), \end{gather}
 \begin{gather}\boldsymbol{\mathsf{U}}_{\boldsymbol{\mathsf{y}}} =\text{diag}\left\{\left( \bar{\boldsymbol{\mathsf{I}}}_{\boldsymbol{\mathsf{z}}}\otimes\bar{\boldsymbol{\mathsf{D}}}_{\boldsymbol{\mathsf{y}}}\right)\boldsymbol{\mathsf{U}}\right\}, \end{gather}
 \begin{gather}\boldsymbol{\mathsf{U}}_{\boldsymbol{\mathsf{z}}} =\text{diag}\left\{\left( \bar{\boldsymbol{\mathsf{D}}}_{\boldsymbol{\mathsf{z}}}\otimes\bar{\boldsymbol{\mathsf{I}}}_{\boldsymbol{\mathsf{y}}}\right)\boldsymbol{\mathsf{U}}\right\}, \end{gather}
 \begin{gather}\boldsymbol{\mathsf{D}}_{\boldsymbol{\mathsf{x}}} =\textrm{i} k_x \bar{\boldsymbol{\mathsf{I}}}_{\boldsymbol{\mathsf{z}}}\otimes\bar{\boldsymbol{\mathsf{I}}}_{\boldsymbol{\mathsf{y}}}, \end{gather}
 \begin{gather}\boldsymbol{\mathsf{D}}_{\boldsymbol{\mathsf{y}}} =\bar{\boldsymbol{\mathsf{I}}}_{\boldsymbol{\mathsf{z}}}\otimes\bar{\boldsymbol{\mathsf{D}}}_{\boldsymbol{\mathsf{y}}}, \end{gather}
 \begin{gather}\boldsymbol{\mathsf{D}}_{\boldsymbol{\mathsf{z}}} =\bar{\boldsymbol{\mathsf{D}}}_{\boldsymbol{\mathsf{z}}}\otimes\bar{\boldsymbol{\mathsf{I}}}_{\boldsymbol{\mathsf{y}}}, \end{gather}
where  $\otimes$ is the Kronecker product and $\boldsymbol{\mathsf{U}}$ is the one-dimensional representation of $U$ (similarly to $\tilde {u}'$). The matrices $\bar {\boldsymbol{\mathsf{I}}}_{\boldsymbol{\mathsf{y}}}$ and $\bar {\boldsymbol{\mathsf{I}}}_{\boldsymbol{\mathsf{z}}}$ are the identity matrices of dimensions $N_y\times N_y$ and $N_z\times N_z$, respectively, and $\bar {\boldsymbol{\mathsf{D}}}_{\boldsymbol{\mathsf{y}}}$ and $\bar {\boldsymbol{\mathsf{D}}}_{\boldsymbol{\mathsf{z}}}$ are the matrices that represent differentiation in $y$ and $z$ directions, respectively. The eigenvalue problem is solved numerically for all streamwise wavenumbers $k_x$ on-the-fly during the simulations.
Appendix D. Validation of eigenvalue calculation
The eigenvalue calculation described in appendix C was numerically implemented in the code which solves the equations of motion such that, at a given time  $t$, the eigenvalues of $\mathcal {L}(U(y,z,t))$ are computed on-the-fly. To verify the implementation, a second independent solver was used, which takes as input the base flows $U(y,z,t)$ stored from the simulation. The second algorithm solves the eigenvalues problem in the $y$-vorticity–Laplacian of $v$ formulation discretised with first-order finite differences in a collocated grid. We have referred to the real part of the eigenvalues computed by the first solver as $\lambda _j$. Let us denote the eigenvalues computed by the second solver as $\breve {\lambda }_j$. Figure 34 shows the history of the real part of the two most unstable eigenvalues $\lambda _1$ and $\lambda _2$, and $\breve {\lambda }_1$ and $\breve {\lambda }_2$. On average, the error $|\lambda _j - \breve {\lambda }_j|/|\lambda _j|$ for all unstable eigenvalues is of the order of 0.1 %. These small differences are expected, as the numerical details of the two solvers differ. Yet, the errors are small enough to provide confidence in the calculation of the modal instabilities. An additional validation is presented in appendix F.
The history of the real part of the two most unstable eigenvalues (a)  $\lambda _1$, $\breve {\lambda }_1$ and (b) $\lambda _2$, $\breve {\lambda }_2$ of $\mathcal {L}(U)$ computed on-the-fly by the solver which integrates the equations of motion for the fluctuating velocities ( $-\circ -$) and computed a posteriori by a second independent solver ( $-\times -$, red).

Appendix E. Approximate calculation of $\tilde {\mathcal {L}}(U)$ using linear forcing

The exponential instabilities in  $\mathcal {L}(U)$ were rigorously removed to obtain $\tilde {\mathcal {L}}(U)$ via eigendecomposition (see 4.2). This approach might obscure the interpretation of $\tilde {\mathcal {L}}(U)$ and, at the same time, it entails a rather costly procedure. In this appendix we present an alternative approach to suppress exponential instabilities, which aids the interpretation of the stabilisation of $\mathcal {L}(U)$ and is computationally more affordable.
In general, the operator  $\mathcal {L}$ is stabilised by subtracting the eigenspaces that correspond to eigenvalues with positive real part $\lambda _j>0$, $j=1,\ldots ,N$,
 \begin{equation} \tilde{\mathcal{L}} = \mathcal{L} - \sum_{j=1}^N a \lambda_j\, \boldsymbol{\mathcal{U}}_j \boldsymbol{\mathcal{V}}^{{\dagger}ger}_j, \end{equation}
where  $a$ is a real coefficient $a>1$, $\boldsymbol {\mathcal {U}}_j$ is the $j$-th eigenmode of $\mathcal {L}$ and $\boldsymbol {\mathcal {V}}_j$ is the $j$-th eigenmode of the adjoint operator $\mathcal {L}^{{\dagger}ger }$, appropriately normalised so that $\boldsymbol {\mathcal {V}}_i^{{\dagger}ger } \boldsymbol {\mathcal {U}}_j = \delta _{ij}$. Hence, the approach to project out the manifolds associated with a particular eigenvector from an operator whose eigenbasis is not orthogonal involves the biorthogonal eigenbasis of its adjoint operator.
If  $\mathcal {L}$ was normal, its eigenvectors and those of its adjoint would coincide. Therefore, stabilisation would be simplified as
 \begin{equation} \hat{\mathcal{L}} = \mathcal{L} - \sum_{j=1}^N a \lambda_j\, \boldsymbol{\mathcal{U}}_j \boldsymbol{\mathcal{U}}^{{\dagger}ger}_j \end{equation}
for  $\lambda _j>0$, $j=1,\ldots ,N$. Under the assumption that the most unstable eigenspace of $\mathcal {L}$ can be suppressed considering $\mathcal {L}$ as normal, then we can use the approximation
 \begin{equation} \tilde{\mathcal{L}}(U) \approx \widehat{\mathcal{L}}(U) = \mathcal{L}(U) - \sum_{j=1}^N 2 \lambda_j \boldsymbol{\mathcal{U}}_j \boldsymbol{\mathcal{U}}^{{\dagger}ger}_j, \end{equation}
where we have chosen  $a=2$. It is well known that the operator $\mathcal {L}$ from the Navier–Stokes equations is highly non-normal and an approximation like (E3) is not guaranteed to stabilise $\mathcal {L}$. Nonetheless, we show here that it works reasonably well. Figure 35 compares the real part of the three most unstable eigenvalues of the properly stabilised $\tilde {\mathcal {L}}(U)$ (denoted by $\lambda _i$) and those of $\widehat {\mathcal {L}}(U)$ (denoted by $\hat \lambda _i$). The approximate method $\widehat {\mathcal {L}}(U)$ succeeds in stabilising $\mathcal {L}(U)$ with the largest eigenvalues (now stable) obtained within to more than 0.1 % accuracy when compared to $\tilde {\mathcal {L}}(U)$.
The history of the real part of the three most unstable eigenvalues (a)  $\lambda _1$, $\hat \lambda _1$, (b) $\lambda _2$, $\hat \lambda _2$, (c) $\lambda _3$, $\hat \lambda _3$ of $\tilde {\mathcal {L}}(U)$ ( $-\circ -$) and $\hat {\mathcal {L}}(U)$ ( $-\times -$, red).

In addition to providing an intuitive interpretation of the stabilisation, the approximate approach is also included here given its easier implementation using the power method. The power method solves the linearised Navier–Stokes equations rescaling the velocity field amplitude at each time step to track the most unstable mode. The process can be repeated iteratively to obtain approximations of the first, second, third, $\ldots$ most unstable modes and eigenvalues. The advantage of the power method is that it does not require constructing $\mathcal {L}$ explicitly nor performing the eigendecomposition of the operator, which might be beneficial in those cases where computing $\mathcal {L}(U)$ is numerically impractical. We repeated cases NF-SEI180 and R-SEI180 using $\hat {\mathcal {L}}(U)$ and tested that our conclusions remain the same.
Appendix F. Linear analysis of channel flow with modally stable base flow
We consider the governing equations for the linear channel flow with modally stable frozen base flow
 \begin{gather} \frac{\partial\boldsymbol{u}'}{\partial t} = \tilde{\mathcal{L}}(U)\boldsymbol{u}', \end{gather}
 \begin{gather}\boldsymbol{U} = (U(y,z,t_0),0,0) \ \text{from case R180}, \end{gather}
where we have disposed of the nonlinear term  $\boldsymbol {N}(\boldsymbol {u}')$. We repeat the simulations in § 6.3 using the same set-up. As an example, the evolution of the turbulent kinetic energy for ten cases is shown in figure 36(a). Given that $\tilde {\mathcal {L}}(U)$ is modally stable, the turbulent kinetic energy decays without exception. We verified that this was the case for all the simulations considered in § 6.3 once $\boldsymbol {N}(\boldsymbol {u}')$ is set to zero. Conversely, if we consider the system
 \begin{gather} \frac{\partial\boldsymbol{u}'}{\partial t} = \mathcal{L}(U)\,\boldsymbol{u}', \end{gather}
 \begin{gather}\boldsymbol{U} = (U(y,z,t_0),0,0) \ \text{from case R180}, \end{gather}
in which modal instabilities are allowed, the turbulent kinetic energy grows exponentially as seen in figure 36(b) given that the ten cases considered are all such that  $\mathcal {L}(U)$ is modally unstable. It was also verified that the growth rate obtained by integrating (F2) coincides with the growth rate $\lambda _1$ of the most unstable mode as predicted by the eigenvalue analysis of $\mathcal {L}(U)$. The present appendix serves as validation of the successful suppression of modal instabilities in $\mathcal {L}(U)$, and complements the results in figure 14 and the analysis in appendix D.


Finally, we consider the governing equations for the linear channel flow with modally stable time-varying base flow
 \begin{gather} \frac{\partial\boldsymbol{u}'}{\partial t} = \tilde{\mathcal{L}}(U)\boldsymbol{u}', \end{gather}
 \begin{gather}\boldsymbol{U} = (U(y,z,t),0,0) \ \text{from case R180}, \end{gather}
where base flow is now allowed to change in time. The system (F3) is supported by transient growth potentially assisted by parametric instabilities. Thus, turbulence could survive even if  $\tilde {\mathcal {L}}(U)$ is modally stable at all instances. However, we found that this is not the case and (F3) is unable to sustain turbulence: $\boldsymbol {u}'$ decays after a few eddy turnover times.


