

1. Introduction
Snow stability tests are a very effective and widely used tool for assessing snowpack stability and hence for gaining valuable information from the field in terms of avalanche danger by both recreationists and professionals. The quickest and easiest snow stability test is the snow compression test – commonly referred to as compression test (CT), and first introduced by Jamieson and Johnston (Reference Jamieson and Johnston1997). It is a mechanical test where an isolated column of snow is manually loaded by tapping on it with progressively increasing load to induce failure in possible weak snow layers. Based on when, where and how a fracture initiates, an indication of the snowpack's stability is gained. However, to include stability test results into operational procedures for avalanche warning, quantitative information about test results as well as information on their reproducibility is needed (Techel and others, Reference Techel, Winkler, Walcher, van Herwijnen and Schweizer2020).
Previous force measurements in snow have shown that the transmission of force is greatly influenced by snow hardness. By measuring the stress (force per area) in snow induced by the load of skiers and snow mobiles, Thumlert and Jamieson (Reference Thumlert, Exner, Jamieson and Bellaire2014) discovered stresses to be lower when measured in relatively hard snow due to lateral bridging effects. Also, the compaction of snow was found to be relevant for the transmission of force or stress in snow. In Thumlert and others (Reference Thumlert and Jamieson2013), stress measurements decreased below an uncompacted snowpack, compared to measurements below a compacted snowpack at equal depth. The damping of stress during the process of snow compaction can be attributed to the absorption of energy during plastic deformation of snow that is especially pronounced when untouched snow is loaded (Schweizer and others, Reference Schweizer, Schneebeli, Fierz and Föhn1995; Kronthaler and others, Reference Kronthaler, Steffl, Reiweger and Mitterer2018). Indeed, when modeling the deformation of snow, Mishra and Mahajan (Reference Mishra and Mahajan2004) divided deformation into an elastic and a creep part, the latter including the compressibility of snow.
Moreover, force transmission within snow is damped with increasing distance between impact point and measurement device. When skiers penetrate the snowpack, they cause the snow height to decrease and, thereby, stresses at the measurement device to increase (Thumlert and others, Reference Thumlert and Jamieson2013); i.e. the more snow between a weak layer and a skier, the smaller the stress that actually affects the weak layer. Indeed, Schweizer and others (Reference Schweizer, Schneebeli, Fierz and Föhn1995) discovered that a skier's impact measured with a load cell within the snowpack decreased with increasing snow depth. The same was observed by Exner and Jamieson (Reference Exner and Jamieson2008) for stresses measured below a standing skier. Also, models for stress transmission in the snowpack support a decrease of surface-induced stress with increasing snow depth (e.g. Föhn, Reference Föhn1987; Monti and others, Reference Monti, Gaume, van Herwijnen and Schweizer2016). However, it has to be kept in mind that – contrary to a CT – these findings dealt with uncut snow samples.
To our knowledge, force measurements during tap tests such as the CT or the extended column test (ECT) (Simenhois and Birkeland, Reference Simenhois and Birkeland2006) have not been performed previously. Existing force measurements in snow covered another scale: when measuring stress below a standing, weighting or jumping skier (e.g. Camponovo and Schweizer, Reference Camponovo and Schweizer1997; Schweizer and Camponovo, Reference Schweizer and Camponovo2001), the loading is not comparable to the taps of a CT. What is more, neither Camponovo and Schweizer (Reference Camponovo and Schweizer1997), nor Schweizer and Camponovo (Reference Schweizer and Camponovo2001), isolated a block while performing their measurements in snow. Their results are therefore not directly transferable to a CT.
Without snow, there is documentation about force measurements during CT-like tap tests directly on a load cell (Sedon, Reference Sedon2021). Results from 69 different test persons show that mean forces of different loading steps do differ between different persons. Nevertheless, the open question of how the snowpack is going to affect these differences remains.
For a better understanding of the influence of different snowpacks on stress levels during a CT, and to understand how person-caused differences in tap forces interact with the snowpack, we performed several measurements. In the field, we measure the forces for different persons performing a CT at two burial depths of the force sensor. Additionally, we collected data on snow penetration and compaction, snow density and snow hardness, i.e. resistance of the Snow Micro Penetrometer (SMP) (Schneebeli and Johnson, Reference Schneebeli and Johnson1998; Johnson and Schneebeli, Reference Johnson and Schneebeli1999; Schneebeli and others, Reference Schneebeli, Pielmeier and Johnson1999). Under no-snow conditions, we directly measured the tapping forces of 62 persons, each tapping onto two measurement devices for comparison.
2. Methods
2.1. The Snow Compression Test
When performing a compression test (CT) as introduced by Jamieson and Johnston (Reference Jamieson and Johnston1997), a block of 30 cm × 30 cm is isolated for progressive loading (see Fig. 1). The block should be maximally 1–1.2 m high (American Avalanche Association, 2016), depending on the location of the suspected weak layers. A shovel is placed on the top of the column and loaded consecutively with ten taps out of the wrist, ten taps out of the elbow and ten taps out of the shoulder. A possible weak layer within the snowpack can be deduced by a slope parallel fracture of the column. The number of taps needed to induce the fracture, as well as the characteristics of the fracture plane are an indicator of snowpack stability. Fracture planes can be classified as Sudden Planer, Resistant Planer, Sudden Collapse, Progressive Compression and Non-planar Break (American Avalanche Association, 2016). Generally, lower tap numbers and smoother fracture planes suggest lower stability.
CT block with measurement plate, ready to be loaded. Picture: Weissfluhjoch, March 2022.

2.2. Force measurement devices
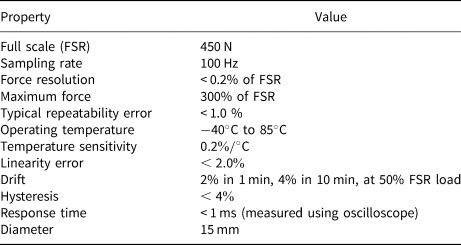
For our measurements within snow, we chose a capacitive pressure pad by SingleTact (see data sheet in the appendix, Table 1). The sensor was calibrated and covers forces up to 450 N. The setup measures at a sampling frequency of 100 Hz.
The head of the sensor had a diameter of 15 mm, which, compared to the snow column's area of 30 cm × 30 cm, was rather small. Thus, we developed a device that measures forces over a larger area and induces them into the sensor's head. Since the area of a CT column is 30 cm × 30 cm wide, we additionally placed a thin panel of the very same size on the measuring device.
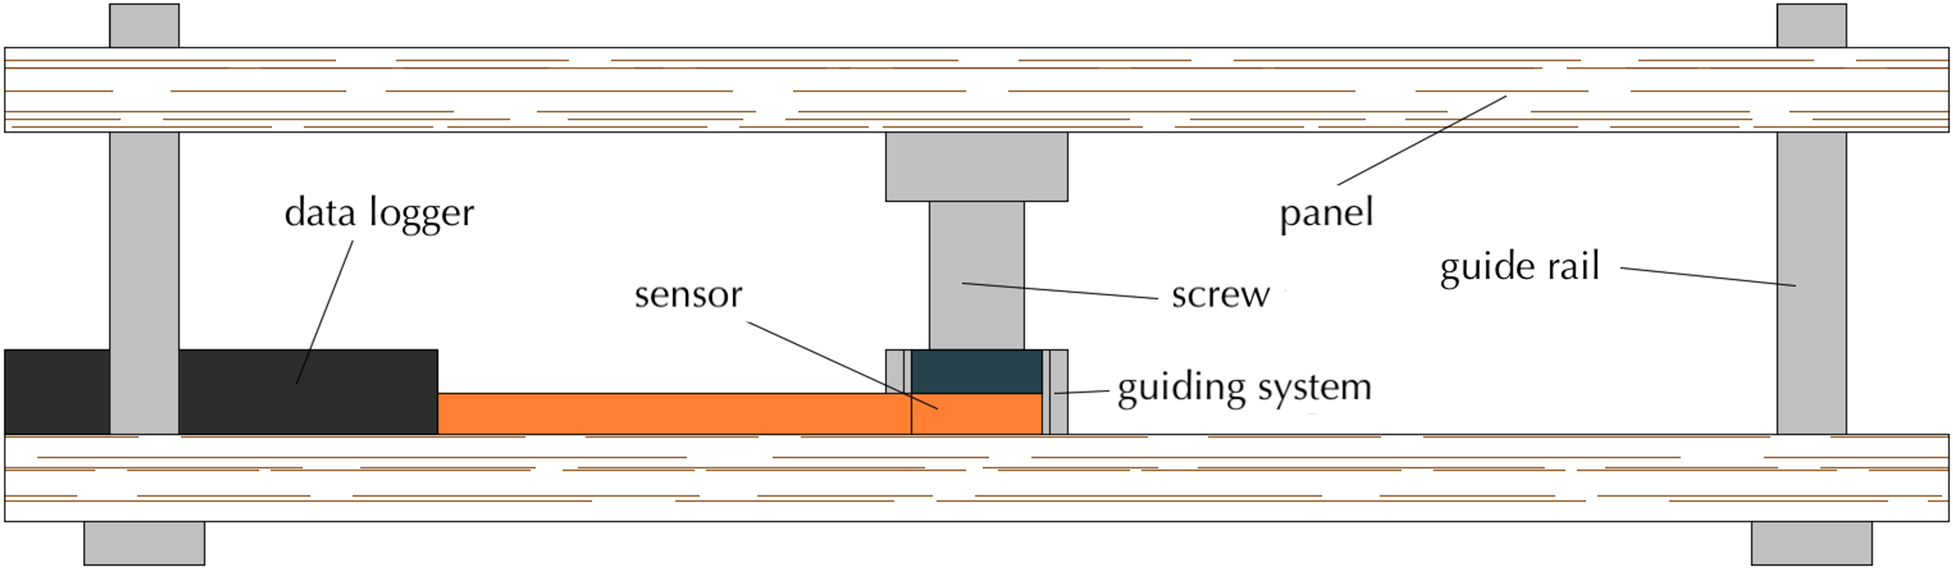
The measurement device was made of two panels, one above the other. The sensor was fixed on the lower panel (see Fig. 2). Along four screws functioning as guide rails, the upper panel could move up and down freely. Right above the sensor's head, on the upper panel, a fifth screw was fixed with its flattened head facing downwards to induce the force onto the sensor. An additional guiding system positioned the screw's head exactly above the sensor's head.
Schematic drawing of the measurement device.

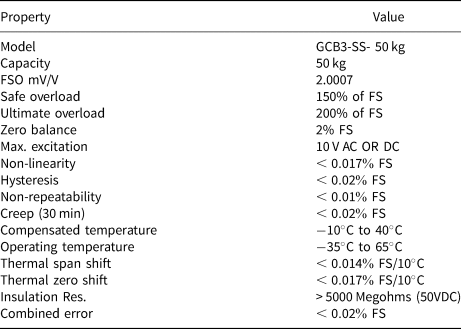
Moreover, for the measurements without snow, we also tested each person with a second measurement device, where the blade of an avalanche shovel was mounted onto an off center type load cell, see Figure 3. The load cell was made by Load Cell Central and covers forces up to 500 N (see data sheet in the appendix, Table 2). The data were logged with a data logger at 50 kHz.
Our second measuring device where a shovel blade is mounted onto a load cell.

2.3. Field measurements with snow
In total, we conducted 116 compression tests, at eight different locations, with 13 persons, and at two different snow depths. The locations were Oberbozen in South-Tyrol (IT), Loosbühelalm in Salzburg (AT), Krautgartenscharte and Sauofen in Styria (AT), Sohlenalm in Lower Austria (AT), Breitspitzbahn and Weiberhimmel in Tyrol (AT) and Weissfluhjoch in Grisons (CH), and the measurements were performed in Winter 2021 and 2022.
For better reproducibility, every person performed the CT at least twice at each depth, 20 and 50 cm. Generally, we pursued the following procedure: Once the CT column was isolated, we used the saw to make a horizontal cut at 20 or 50 cm, accordingly. The part of the column above the cut was lifted with a shovel. We placed the measurement device in the middle of the column, lowered the shovel and finally withdrew it carefully to let the upper part of the column rest on the measurement device.
Moreover, we collected data on the snow properties. We recorded the changes of the snow height during a CT. Furthermore, to detect changes in terms of snow hardness, for the measurements at the Weissfluhjoch, we recorded the penetration resistance of the snowpack before and after the CT with an SMP. The measurements before the CT were performed in close proximity to the CT column, the measurements after the CT, directly in the column. Of course, for the latter, the tip of the SMP could not penetrate further than the measurement device. Similarly, before each CT, with a resolution of 3 cm, we registered a density profile in proximity of the CT column for the upper 20 cm of the snowpack.
2.4. Force measurements without snow
When measuring forces directly without snow, we placed the measurement device on a table during a conference of the European Avalanche Warning Services (EAWS) in Davos, Switzerland, in June 2022. We then let 62 persons, most of them professional avalanche forcasters, simulate a CT. Moreover, at the EAWS conference we also tested every person a second time with the second measurement device (with the shovel blade, see Fig. 3 and Table 2). The people performing the CT wore gloves for field-similar conditions. In addition, we collected data on the participants’ body features, i.e. body height, shoulder height, arm length and body weight.
2.4.1. Influence of the sampling frequency and measurement setup
In order to assess the suitability of our sampling frequency, we studied previous works of stress measurements within snow. Thumlert and others (Reference Thumlert and Jamieson2013) measured dynamic stresses below skiers and snow mobiles with a frequency of 8 and 11 Hz. They compared their values of dynamic stress measurements to a higher reference frequency as well as to static measurements by Camponovo and Schweizer (Reference Camponovo and Schweizer1997) for reference. Comparing with those previous studies, our sampling frequency of 100 Hz deems adequate for measurements within snow.
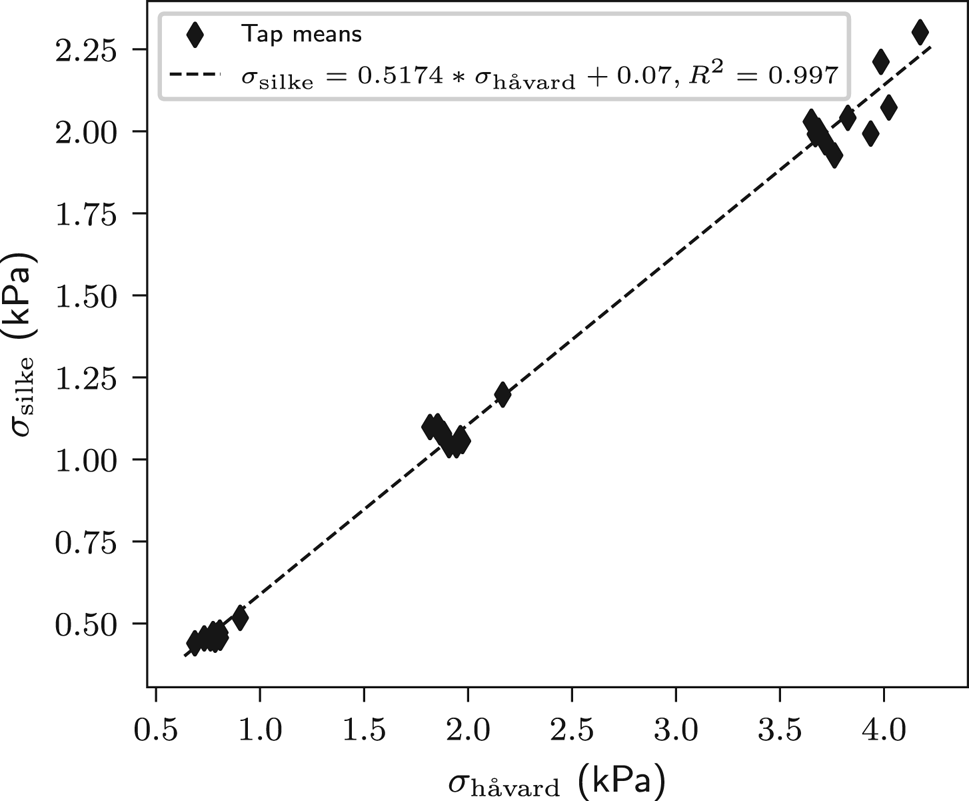
To assess the influence of the sampling frequency for no-snow conditions and without damping, we compared the measurements with both measurement devices taken at the EAWS conference in Davos. We then calculated a linear regression between both tap-averages (average of every tap among all persons performing the CT on the distinct measuring device). Results show that the average tap forces measured with our primary device (sampling frequency 100 Hz) were about half of the tap averages measured with the second device (sampling frequency 50 kHz, the device and its properties are shown in Fig. 3 and Table 2). Still with R 2 = 0.997 the coefficient of determination suggests that both data are consistent (see Fig. 4) and the offset is systematic. We therefore conclude that for comparing the influence of different test persons and different snow conditions, our measurement frequency of 100 Hz satisfies the needs of our study.
Comparison of average stress levels for taps collected with the first (σ silke) and second (σ håvard measurement device for the same persons on the same day at the EAWS conference 2022 in Davos.

Moreover, the measurement setup used for the field measurements has a potential that the measured values are distorted by plate-parallel forces. We are aware that this poses a possible source of not quantified error. Nevertheless, the comparison of our measurements with the measurements with the second measurement device (Fig. 4) leaves us optimistic that although the absolute values of the forces we measure are biased in a systematic way, the relative differences are still meaningful.
2.5. Data analysis
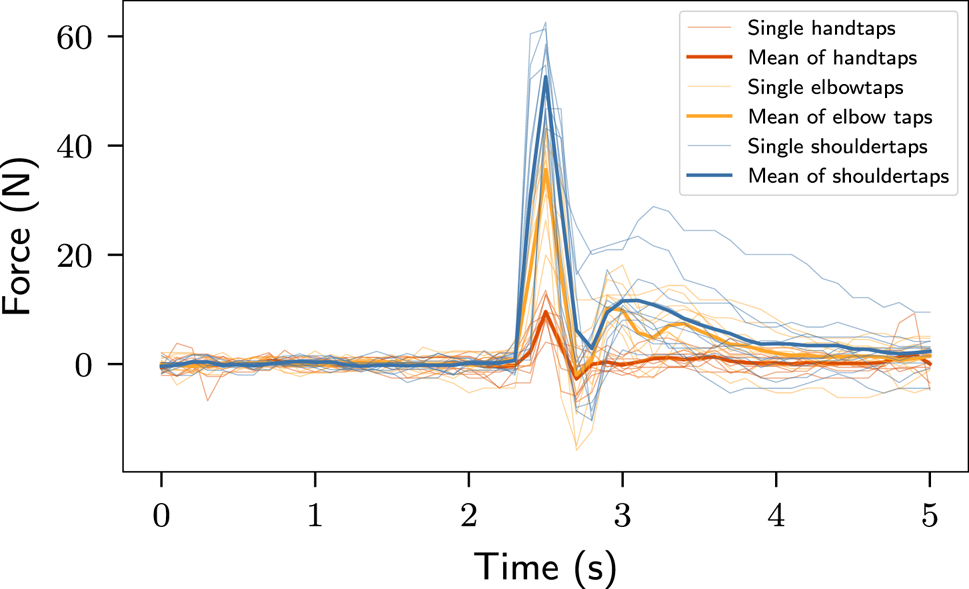
We defined the highest measured force of each tap (i.e. the highest point of the force peak) as tap force (see Fig. 5). After extracting the tap forces from the data, for better comparability with literature, they were transformed into a stress level by dividing each tap force by the area of a CT, i.e. by 30 cm × 30 cm.
Exemplary force curves of the different taps of a CT performed in the field. The highest tip of each curve was extracted as tap force for further analysis.

2.5.1. Summary statistics
For each tap at 20 cm, 50 cm depth and without snow, we calculated the total median and its interquartile range and estimated a linear regression for each loading step (scipy.stats.linregress, Virtanen (Reference Virtanen2020)) among medians.
2.5.2. Influence of the snowpack
For each loading step, we performed a linear regression of the average stress levels as a function of the initial average density of the upper 20 cm and the cumulative hardness, respectively. The initial average density is the density before performing a CT, averaged over height (20 cm). The initial cumulative hardness corresponds to the sum of SMP resistances over 20 or 50 cm depth, measured before the CTs.
Moreover, we illustrated stress levels as a function of effective depth. The effective depth is the final distance between measuring device and shovel after each loading step. For the measurements without snow, we introduced an artificial effective depth of d eff = 0.5 cm taking into account the thickness of the glove.
Finally, to show the compaction of snow during a CT, we compared the SMP resistance of the snowpack before and after a CT by calculating the horizontal average and standard deviation among 11 SMP profiles (snow resistance) before, and ten profiles after the CTs.
2.5.3. Influence of different persons
To learn how different persons affect the stress levels of a CT, for each loading step, we performed a linear regression of the average stress levels (average of each loading step) as a function of the body features, such as shoulder height, height, weight or arm length.
3. Results and discussion
3.1. Influence of the snowpack
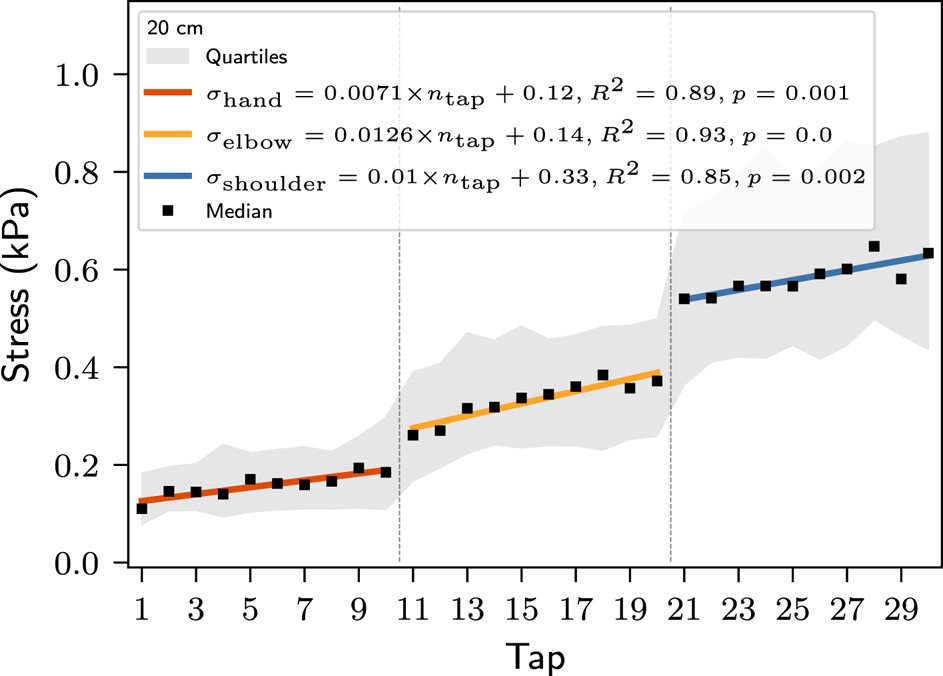
The median stresses for different tap numbers at a depth of 20 cm are shown in Figure 6. The gray shading indicates the interquartile ranges of the measured stresses. There is a pronounced difference in stress levels between hand taps (red), elbow taps (yellow) and shoulder taps (blue). Moreover, we see a statistically significant stress increase from tap to tap even within the single loading steps. A similar picture is found for stress levels at a depth of 50 cm, see Figure 7.
Median stress levels and their interquartile ranges for the measurements at 20 cm depth.

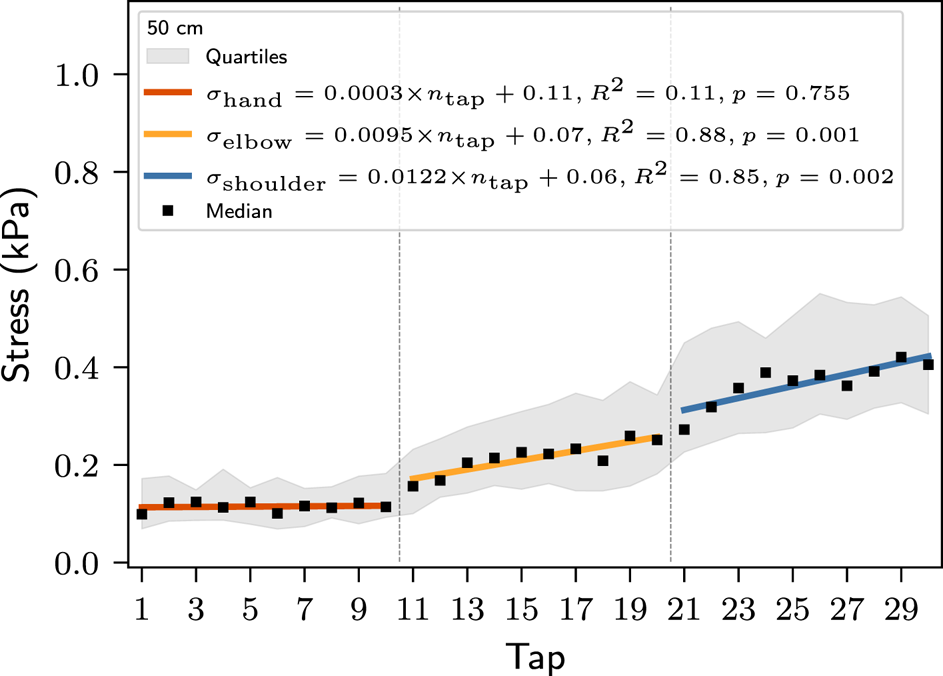
Median stress levels and their interquartile ranges for the measurements at 50 cm depth.

Apart from persons tapping slightly harder at the end of the loading step (see also section Influence of different persons), the rising trend of the stresses in the snow can be explained by a gradually increasing compaction of snow with progressing tap number. During the first taps, the snow is deformed plastically, absorbing a lot of energy (e.g. Kronthaler and others, Reference Kronthaler, Steffl, Reiweger and Mitterer2018; Schweizer and others, Reference Schweizer, Schneebeli, Fierz and Föhn1995). But with each new tap, the plastic deformation decreases and the already compacted snow transmits stress more easily (Thumlert and others, Reference Thumlert and Jamieson2013). In addition, the distance between the impact point and the measurement device or weak layer decreases. This leaves less snow to be plastically deformed, causing measured stresses to rise (Camponovo and Schweizer, Reference Camponovo and Schweizer1997; Exner and Jamieson, Reference Exner and Jamieson2008). Considering a CT, this indicates that the tenfold repetition of the taps with the same loading step is appropriate, as the stress that actually reaches the weak layer does increase from tap to tap and might therefore induce a fracture that could not have been induced beforehand. This has to be seen in addition to the findings of Boone (Reference Boone2018), who states that once a tap surpasses the strength of the weak layer (plastic deformation of the weak layer begins), each new tap until failure contributes with some energy towards the failure of the weak layer, with the final tap being critical for the final failure.
It can be seen that the measured stresses are slightly lower for a snow depth of 50 cm compared to the shallower depth of 20 cm. As the snow block for the compression test is free-standing, the decrease of stress with increasing snow depth cannot be attributed to bridging effects. We assume that a loss of energy due to plastic deformation in the snow block above the measurement device is the reason for the decrease of stress with increasing snow depth.
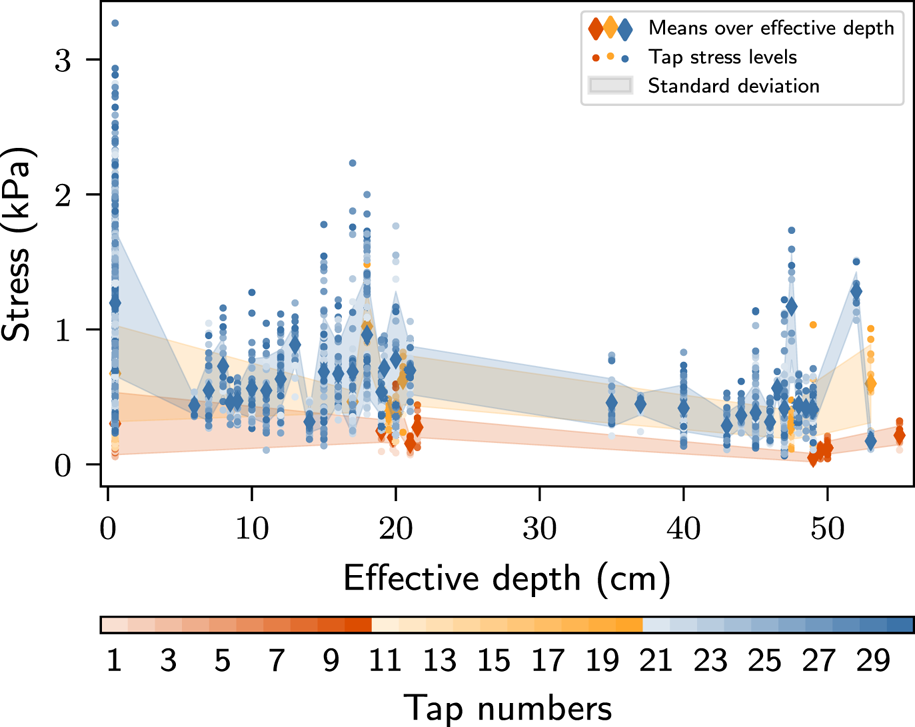
As the snow height above the measurement device decreased with increasing number of taps during the compression test, we measured the effective depth, i.e. the snow height above the measurement device. The means of the stresses slightly decrease with increasing effective depth, see Figure 8. Although we observed an overall decrease in stress with increasing effective depth, the data show a lot of scatter. We attribute the scatter to the two competing effects of stress decrease due to plastic deformation, i.e. snow compaction, versus stress increase due to closer proximity to the measurement device after compaction. Thus, depending on the snowpack, the influence of effective depth might be overruled by snow compaction, leading to scattering of the data.
Average stress levels and their standard deviation as a function of effective depth.

Our SMP measurements before and after a compression test showed that the average snow hardness increased due to compaction, see Figure 9. In our measurements, snow compaction mainly took place in the upper 10 cm of the CT block. However, even though it is likely that most of the compaction takes place in the upper part of the CT column, how far the compaction extends into the snowpack, depends on how hard the uppermost layers are. Indeed, measured in cm that were compacted during a CT, we generally observed greater compaction for measurement sites with softer surface layers, compared to those test sides with harder crusts at the top.
Average SMP resistance and standard deviation of all CTs at Weissfluhjoch before (11 profiles) and after (ten profiles) the CT as a function of snow depth.

3.2. Influence of different persons
The stress levels for different taps without snow at the EAWS conference are shown in Figure 10. As expected (Sedon, Reference Sedon2021), stress levels vary between different persons. Still, especially for hand taps, stress levels scatter closely around a specific value. Lower stress levels for the very first and higher stress levels for the very last tap of the respective loading step cause a rising trend within distinct loading steps, although not statistically significant (p > 0.05). We attribute this rising trend under no-snow conditions to people tapping with less force at the very first, and with greater force at the very last tap of each step; in between, forces are more or less the same.
Stress levels for the different taps by different people under no-snow conditions.

Data scattering is lower for measurements with snow than without, see Figures 6, 7 and 10, even though different people as well as different snowpack conditions were involved. Moreover, the scattering decreased with increasing snow depth and for lower tap numbers. Apparently, differences are smoothed out by the overlying layers of snow.
3.3. Influence of persons’ body features
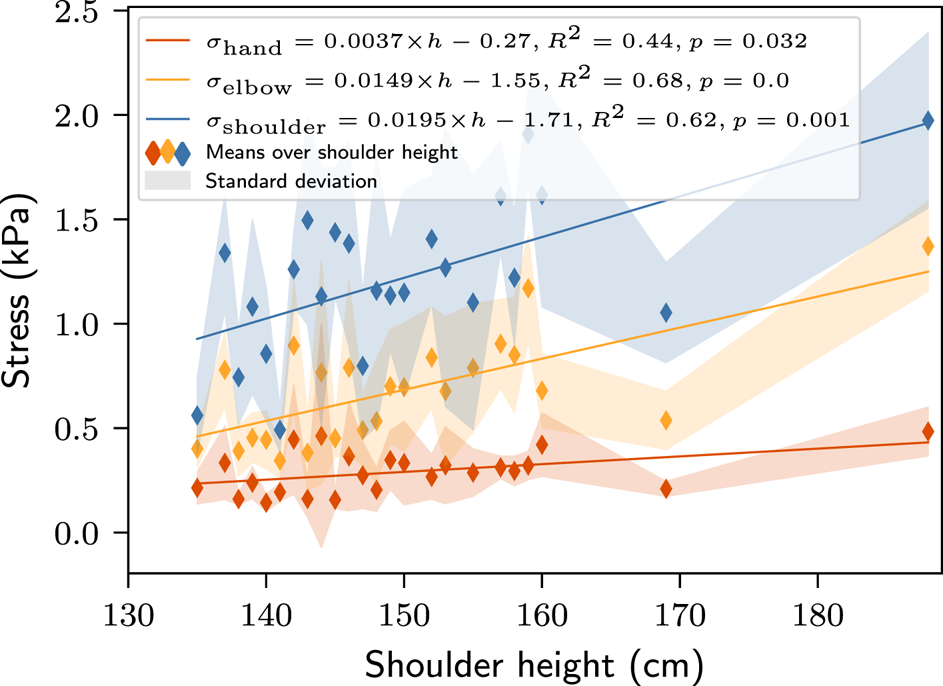
The influence of persons’ shoulder height on the stress levels measured without snow is illustrated in Figure 11. We saw less scattering for lower loading steps, and, as expected (keeping in mind the second law of Newton, F = m × a), average stress levels rise with greater shoulder height, especially for taps from the elbow and shoulder. Generally, heavy and tall persons with long arms hit the hardest. As expected, we found a statistically significant correlation between distinct body features, e.g. height and weight, suggesting that it might be possible to normalize CT results with the help of e.g. a person's height. However, as the influence of different persons seems to be smoothed out by the snow cover (Figs 6, 7, 10), we feel that CT results are quite reproducible, even for persons with different body features.
Average stresses measured under no-snow conditions as a function of shoulder height. Stress levels rise with increasing shoulder height at a statistically significant level (p < 0.05).

4. Conclusion and outlook
We performed force measurements during compression tests to assess the reproducibility with respect to different test persons as well as different snow conditions. We could show that the differences between different test persons was surprisingly narrow, especially for unstable conditions, i.e. low loading steps and weak layers within the snowpack. We think this to be very relevant information, especially at the interface of science and operational practice, as we have shown that CT results seem to be fairly similar between different people, especially when the snowpack is quite unstable. This facilitates the communication of test results between people and across avalanches forecast regions. It also shows that, at least for low loading steps, a standardized interpretation of CT test results is legitimate. What is more, it is likely that these conclusions about the CT also apply to the ECT, as the ECT has the same loading steps as the CT.
Moreover, indoor measurements without snow only showed a statistically insignificant rise in measured stress from tap to tap within distinct loading steps. This strongly suggests that the statistically significant increase of measured stresses from tap to tap within distinct loading steps that was measured in the field instead was caused by increased penetration and compaction of the snowpack during the test. This stress increase between single taps underlines the importance of being concise in performing every single tap of a loading step.
For the future, it would be interesting to investigate the influence of very different snow conditions on measured stresses, such as very loose powder snow at the top or deep persistent weak layers close to the ground. Also the natural variability of the snowpack could be compared to the variability of test results due to different test persons.
Acknowledgements
We thank Friedrich Zott, Christian Simeon and Tiziano Di Pietro for their great help and creative ideas regarding the development of the measurement device. A big thanks goes also to Moritz Altenbach for his patience with the SMP measurements. Last but not least, we thank our friends and the EAWS participants who all volunteered as test persons. Without you this research would not have been possible.
Appendix
Technical details of the capacitive pressure pad by SingleTact

Technical details of the load cell Load Cell Central of the second measuring device


 Open access