


Introduction
Currently, there are 514 unique herbicide-resistant weed biotypes globally (Heap Reference Heap2022). As the number of herbicide-resistant weeds increases, the number of effective herbicides decreases (Gaines et al. Reference Gaines, Busi and Küpper2021). For herbicides to remain effective, herbicide-resistant weeds must be identified and managed before the resistance trait(s) become fixed within a weed population (Squires et al. Reference Squires, Coleman, Broster, Preston, Boutsalis, Owen, Jalaludin and Walsh2021). Dose–response assays are a proven technique used to confirm herbicide-resistant weed species (Burgos Reference Burgos2015). Despite being a proven and accepted technique, dose–response assays require weeks to months to complete and lack the expedience needed by farmers to know if a weed is herbicide-resistant (Burgos Reference Burgos2015; Burgos et al. Reference Burgos, Tranel, Streibig, Davis, Shaner, Norsworthy and Ritz2013). Dose–response assays also require significant labor, materials, and space to conduct. Additional assays have been developed/tested to reduce costs and increase time efficiency compared with dose–response assays. However, some of these assays/techniques have limitations as well.
Herbicide-impregnated agar-based seedling assays have been created to confirm herbicide resistance (Boutsalis Reference Boutsalis2001; Shaner et al. Reference Shaner, Nadler-Hassar, Henry and Koger2005). Putative herbicide-resistant plants must be grown to produce seed; ultimately, the time to procure results is similar to whole-plant dose–response assays. Molecular sequencing assays have proved to be successful in confirming the evolution of herbicide-resistant weeds (Bettini et al. Reference Bettini, McNally, Sevignac, Darmency, Gasquez and Dron1987; Patzoldt and Tranel Reference Patzoldt and Tranel2002). The molecular assays can provide results concerning whether the weed is herbicide resistant or not on the magnitude of hours to days (Burgos et al. Reference Burgos, Tranel, Streibig, Davis, Shaner, Norsworthy and Ritz2013; Jones et al. Reference Jones, Andres, Contreras, Dunne, Cahoon, Jennings, Leon and Everman2022a; Squires et al. Reference Squires, Coleman, Broster, Preston, Boutsalis, Owen, Jalaludin and Walsh2021). One downfall of molecular assays for confirming herbicide resistance is monogenic traits are easier to detect than polygenic traits (Burgos et al. Reference Burgos, Tranel, Streibig, Davis, Shaner, Norsworthy and Ritz2013; Giacomini et al. Reference Giacomini, Gaines, Beffa and Tranel2018). The ability to detect a monogenic (i.e., target-site) mutation is more rapid if the mutation has been well characterized (Burgos et al. Reference Burgos, Tranel, Streibig, Davis, Shaner, Norsworthy and Ritz2013; Squires et al. Reference Squires, Coleman, Broster, Preston, Boutsalis, Owen, Jalaludin and Walsh2021). Measuring chlorophyll fluorescence can be useful in rapidly discriminating between herbicide-resistant and herbicide-susceptible weeds (Kaiser et al. Reference Kaiser, Menegat and Gerhards2013; Wu et al. Reference Wu, Varanasi and Perez-Jones2021). The previously conducted research utilizing this methodology was conducted across many weed species and herbicides, elucidating the utility of the technique. While these experiments are a successful substitute for whole-plant herbicide-resistance assays, their utility can be lost due to the cost of the equipment/technical knowledge in conducting the trials, the herbicide-resistance mechanism(s), and the herbicide site of action (Burgos et al. Reference Burgos, Tranel, Streibig, Davis, Shaner, Norsworthy and Ritz2013; Dayan and Zaccaro Reference Dayan and Zaccaro2012; Giacomini et al. Reference Giacomini, Gaines, Beffa and Tranel2018; Squires et al. Reference Squires, Coleman, Broster, Preston, Boutsalis, Owen, Jalaludin and Walsh2021).
Glufosinate (herbicide Group 10) is among the few effective postemergence herbicides remaining. Glufosinate is a nonselective, fast-acting contact herbicide that inhibits glutamine synthetase (EC 6.3.1.2), which ceases the production of glutamate and disrupts chlorophyll production, allowing for reactive oxygen species to induce lipid peroxidation of the cell membranes, resulting in cell death (Takano et al. Reference Takano, Beffa, Preston, Westra and Dayan2019). However, six weed species [Palmer amaranth (Amaranthus palmeri S. Watson), goosegrass [Eleusine indica (L.) Gaertn.], annual ryegrass (Lolium perenne L.), Italian ryegrass [Lolium perenne L. ssp. multiflorum (Lam.) Husnot], rigid ryegrass (Lolium rigidum Gaudin), and annual bluegrass (Poa annua L.)] have evolved resistance to this herbicide (Heap Reference Heap2022). The glufosinate-resistant populations of these weeds are not widespread; therefore, putative glufosinate-resistant weeds must be identified rapidly and managed accordingly to extend the effectiveness of this herbicide. The mechanism(s) of glufosinate resistance can differ across and within species from target-site mutation, target-site amplification, and metabolism (i.e., polygenic) (Avila-Garcia et al. Reference Avila-Garcia, Sanchez-Olguin, Hulting and Mallory Smith2012; Brunharo et al. Reference Brunharo, Takano, Mallory-Smith, Dayan and Hanson2019; Carvalho-Moore et al. Reference Carvalho-Moore, Norsworthy, González-Torralva, Hwang, Patel, Barber, Butts and McElroy2022; Jalaludin et al. Reference Jalaludin, Yu, Zoellner, Beffa and Powles2017). The assays described above may not be suitable for rapidly confirming glufosinate resistance as reported.
Injury is incurred rapidly (approximately 48 h after application) on glufosinate-treated plants but can vary based on species and rate (Hoss et al. Reference Hoss, Al-Khatib, Peterson and Loughin2003; Steckel et al. Reference Steckel, Wax, Simmons and Phillips1997) (Figure 1). Because the chlorophyll production is being disrupted and total chlorophyll content is decreased, the plant does not uniformly reflect green spectrum light (Carter Reference Carter1993). Glufosinate inhibits chlorophyll production and function very rapidly; consequently, chlorophyll florescence may not be sufficient to detect glufosinate resistance (Dayan and Zaccaro Reference Dayan and Zaccaro2012; Takano et al. Reference Takano, Beffa, Preston, Westra and Dayan2019; Wu et al. Reference Wu, Varanasi and Perez-Jones2021). However, chlorophyll content and spectral reflectance are correlated (Gitelson et al. Reference Gitelson, Gritz and Merzlyak2003a). Because abiotic- and biotic-stressed plants reflect other colors aside from green, the ability to detect differences of pigment degradation associated with glufosinate activity may increase by utilizing different wavelengths (Carter and Knapp Reference Carter and Knapp2001; Mee et al. Reference Mee, Balasundram and Hanif2017).
Differential phenotypic response of glufosinate-resistant (left) and glufosinate-susceptible (right) cotton leaves at 48 h after glufosinate (650 g ai ha−1) treatment.

Therefore, glufosinate-treated plants could be imaged to collect and detect differences in spectral reflectance. Previous research has demonstrated that image-based spectral reflectance can discriminate between herbicide-treated plants and ranges in weed species susceptibility to herbicides (Everman et al. Reference Everman, Medlin, Dirks, Bauman and Biehl2008; Reddy et al. Reference Reddy, Huang, Lee, Nandula, Fletcher, Thomson and Zhao2014; Zhao et al. Reference Zhao, Guoa, Huang, Reddy, Lee, Fletcher and Thomson2014). Corn (Zea mays L.), cotton (Gossypium hirsutum L.), and soybean [Glycine max (L.) Merr.] could be model species, as there are genetically modified and conventional varieties that are resistant and susceptible to glufosinate, respectively (Duke Reference Duke2005; Johnson et al. Reference Johnson, Fisher, Jordan, Edmisten, Stewart and York2012). Glufosinate resistance in crops is facilitated by the insertion of the Phosphinothricin N-acetyltransferase (pat) gene and bialaphos resistance (bar) gene isolated from Streptomyces viridochromogenes Waksman and Henrici and Streptomyces hygroscopicus Waksman and Henrici, respectively, and both encode for phosphinothricin acetyl transferase (EC 2.3.1.183) (Dayan and Duke Reference Dayan and Duke2014; Domínguez-Mendez et al. Reference Domínguez-Mendez, Alcantara-de la Cruz, Rojano-Delgado, da Silveira, Portugal, Cruz-Hipolito and De Prado2018; Krenchinski et al. Reference Krenchinski, Carbonari, Cesco, Albrecht, Arcuri, Maia and Velini2018). Phosphinothricin acetyl transferase converts glufosinate into N-acetyl-l-glufosinate, a nonphytotoxic compound that does not inhibit glutamate synthetase (Droge-Laser et al. Reference Droge-Laser, Siemeling, Puhler and Broer1994; Hérouet et al. Reference Hérouet, Esdaile, Mallyon, Debruyne, Schulz, Currier, Hendrickx, Van der Klis and Rouan2005).
The specific objectives of the present research were to determine (1) whether there was a discriminating glufosinate concentration to separate spectra between glufosinate-resistant and glufosinate-susceptible crop varieties, (2) whether the discrimination glufosinate concentration could reliably cause differential spectral reflectance from glufosinate-resistant and glufosinate-susceptible crop varieties, and 3) the wavelengths and vegetative indices best able to differentiate glufosinate resistance using image-based sensor designed for unmanned aerial vehicle use.
Materials and Methods
Dose Response: Determining a Discriminating Dose
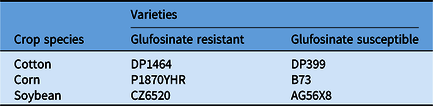
Seeds of glufosinate-resistant and glufosinate-susceptible varieties of corn, cotton, and soybean were sown into flats (21 cm by 28 cm) containing a 4:1 mixture of potting soil (Sun Gro® Sunshine no. 2, Sun Gro Horticulture, Agawam, MA, USA) to sand, including 5 g of pellet fertilizer (14-14-14) (Table 1). The plants were maintained in a glasshouse with a 30/25 C diurnal temperature fluctuation and a 14/10 h photoperiod. Sunlight was supplemented with 600 to 1,000 µmol m−2 s−1 PFFD of artificial light. Five plants were transplanted at a specific stage (cotton [1-leaf], corn [2-leaf], soybean [1-trifoliate]) into 15-cm diameter pots containing a 4:1 soil mixture including 5 g of pellet fertilizer (14-14-14). When the plants reached a specific stage (cotton [2- to 3-leaf], corn [3- to 4- leaf], soybean [2- to 3-trifoliate]), leaf disks were excised from youngest completely unfolded leaves below the apical meristem using a 6-mm single-hole punch. Technical-grade glufosinate (280 g ai L−1, Liberty®, BASF, Research Triangle Park, NC, USA) was diluted to various concentrations (mM) using de-ionized water. Eight glufosinate concentrations ranged from 0.01 to 10 mM along a 3.16 log scale including a nontreated control (0 mM). Treatments were arranged as a randomized complete block design with three replications (leaf disks were excised from three different plants) and conducted twice. Twenty-four-well plates (Spex Sample Prep, Metuchen, NJ, USA) were cut in half to a depth of 1.25 cm and used as the vessel to hold the leaf disk and aliquot. One milliliter aliquots of each glufosinate concentration were added to the corresponding well, and leaf disks were placed in the well with forceps. The leaf disks were submerged into the aliquot and allowed to resurface with the adaxial side facing up. The 24-well plates containing the glufosinate concentration aliquots and leaf disks were placed into a photography box and subjected to continuous light from an overhead LED light (12 lumens m−2) at 22 C with 50% relative humidity over the 48-h testing period. No diurnal light or temperature fluctuation was implemented to exacerbate glufosinate activity (Takano et al. Reference Takano, Beffa, Preston, Westra and Dayan2020).
Crop varieties used in the dose–response assay to determine whether glufosinate-resistant and glufosinate-susceptible varieties could be discriminated with spectral reflectance.
Multispectral images were acquired using a MicaSense RedEdge multispectral sensor (RedEdge, MicaSense, Seattle, WA, USA) every 2 h for 48 h. The multispectral sensor measures reflected energy in five discrete regions: blue (475 to 507 nm), green (560 to 587 nm), red (668 to 682 nm), red edge (717 to 729 nm), and near infrared (842 to 899 nm). Limited radiance output by the LED light source in the near infrared resulted in underexposed images at this wavelength, and data were not included in the analysis. The multispectral sensor has a focal length of 5.5 mm, a horizontal field of view of 47.2°, and an image resolution of 1,280 by 960 pixels. Ground spatial resolution for the multispectral sensor is 0.7 mm per pixel at 1 m above ground level. The multispectral sensor was placed approximately 1 m above the 24-well plates containing the leaf disks. The resulting images were combined into a single four-band, geometrically rectified image composite using custom Python (Python Software Foundation 2022) code and the SIFT (Scale Invariant Feature Transform) library available in OpenCV. The image composites were then used to determine reflected raw digital number (DN) values for each wave band using the FIELDimageR package in RStudio v. 4.1.1 (Matias et al. Reference Matias, Caraza-Harter and Endelman2020; R Core Team 2022). Reflectance ratios were calculated as well for the green leaf index (GLI) was also calculated in addition to the wave bands captured by the multispectral sensor in FIELDimageR. GLI was calculated as:
 $${{\left( {2{\rm{\;*\;red\;}} - {\rm{\;green\;}} - {\rm{\;blue}}} \right)} \over {\left( {2{\rm{\;*\;red\;}} + {\rm{\;green\;}} + {\rm{\;blue}}} \right)}}$$
where red, green, and blue represent the DNs measured at that wavelength. The GLI was selected, as it is commonly used as a metric to measure chlorophyll content (Gitelson et al. Reference Gitelson, Viña, Arkebauer, Rundquist, Galina and Bryan2003b; Louhaichi et al. Reference Louhaichi, Borman and Johnson2001).
Discrimination of Glufosinate Resistance across Varieties
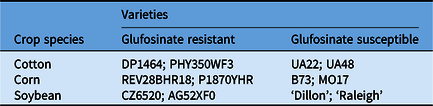
Two varieties of each glufosinate-resistant and glufosinate-susceptible crop species were utilized to determine whether the assay could discriminate between glufosinate susceptibility across different genotypes (Table 2). Plants were sown and curated as described earlier. Non-transgenic lines were selected as the glufosinate-susceptible varieties for all crop species for a better representation of a wild-type plant. Leaf disks were excised and placed into the 24-well plate with the corresponding glufosinate concentration and then placed in a photography box as described earlier. Glufosinate concentrations were 0 mM and the discrimination concentration from the dose–response assay. Treatments were arranged as a randomized complete block design with six replications (one leaf disk was taken from six different plants). The multispectral sensor collected imagery at 0, 24, and 48 h after treatment. Images were mosaicked, and DNs from wave bands and indices were extracted from the mosaicked images as described as earlier.
Crop varieties used to determine whether glufosinate-resistant and glufosinate-susceptible varieties could be discriminated with spectral reflectance with 10 mM of glufosinate.
Statistical Analysis
Discriminating Dose
Reflected DN data from all wave bands and indices were plotted across glufosinate concentrations using a three-parameter log-logistic, quadratic, or three-parameter sigmoidal-logistic models in SigmaPlot v. 14.0 (Systat Software, Palo Alto, CA).
The three-parameter log-logistic model is described as:
 $$y = {a \over 1} + {\left( {{x \over {x0}}} \right)^b}$$
where a is the upper asymptote, x is the glufosinate concentration, x0 equals an inflection point, and b is the slope at x0.
The quadratic model is described as:
 $$\left( {y = y0 + a{\rm{*}}x + b{\rm{*}}{x^2}} \right)$$
where a is the upper asymptote, x is the glufosinate concentration, x and y0 equal inflection points, and b is the slope at x.
The three-parameter sigmoidal-logistic model is described as:
 $$\left( {y = {{y0} \over {1 + \exp \left\{ { - \left[ {{{\left( {x + x0} \right)} \over b}} \right]} \right\}}}} \right)$$
where a is the upper asymptote, x is the glufosinate concentration, x0 and y0 equal inflection points, and b is the slope at x0.
Discrimination of Glufosinate Resistance across Varieties
Spectral reflectance data from all wave bands and GLI were subjected to ANOVA using PROC GLIMMIX in SAS v. 9.4 (Statistical Analysis Software, Cary, NC) (α ≤ 0.05), where glufosinate concentration, resistance trait, and variety (nested within resistance trait) were considered fixed effects, while experimental run and replication were considered random effects. Treatment means were separated using Fisher’s LSD (α ≤ 0.1).
Results and Discussion
Only the 48-h time point for both assays provided clear spectral differences between the treated and nontreated leaf disks of glufosinate-resistant and glufosinate-susceptible crop leaf disks; thus, for clarity, only the 48-h time point will be discussed.
Dose Response: Determining a Discriminating Rate
Corn
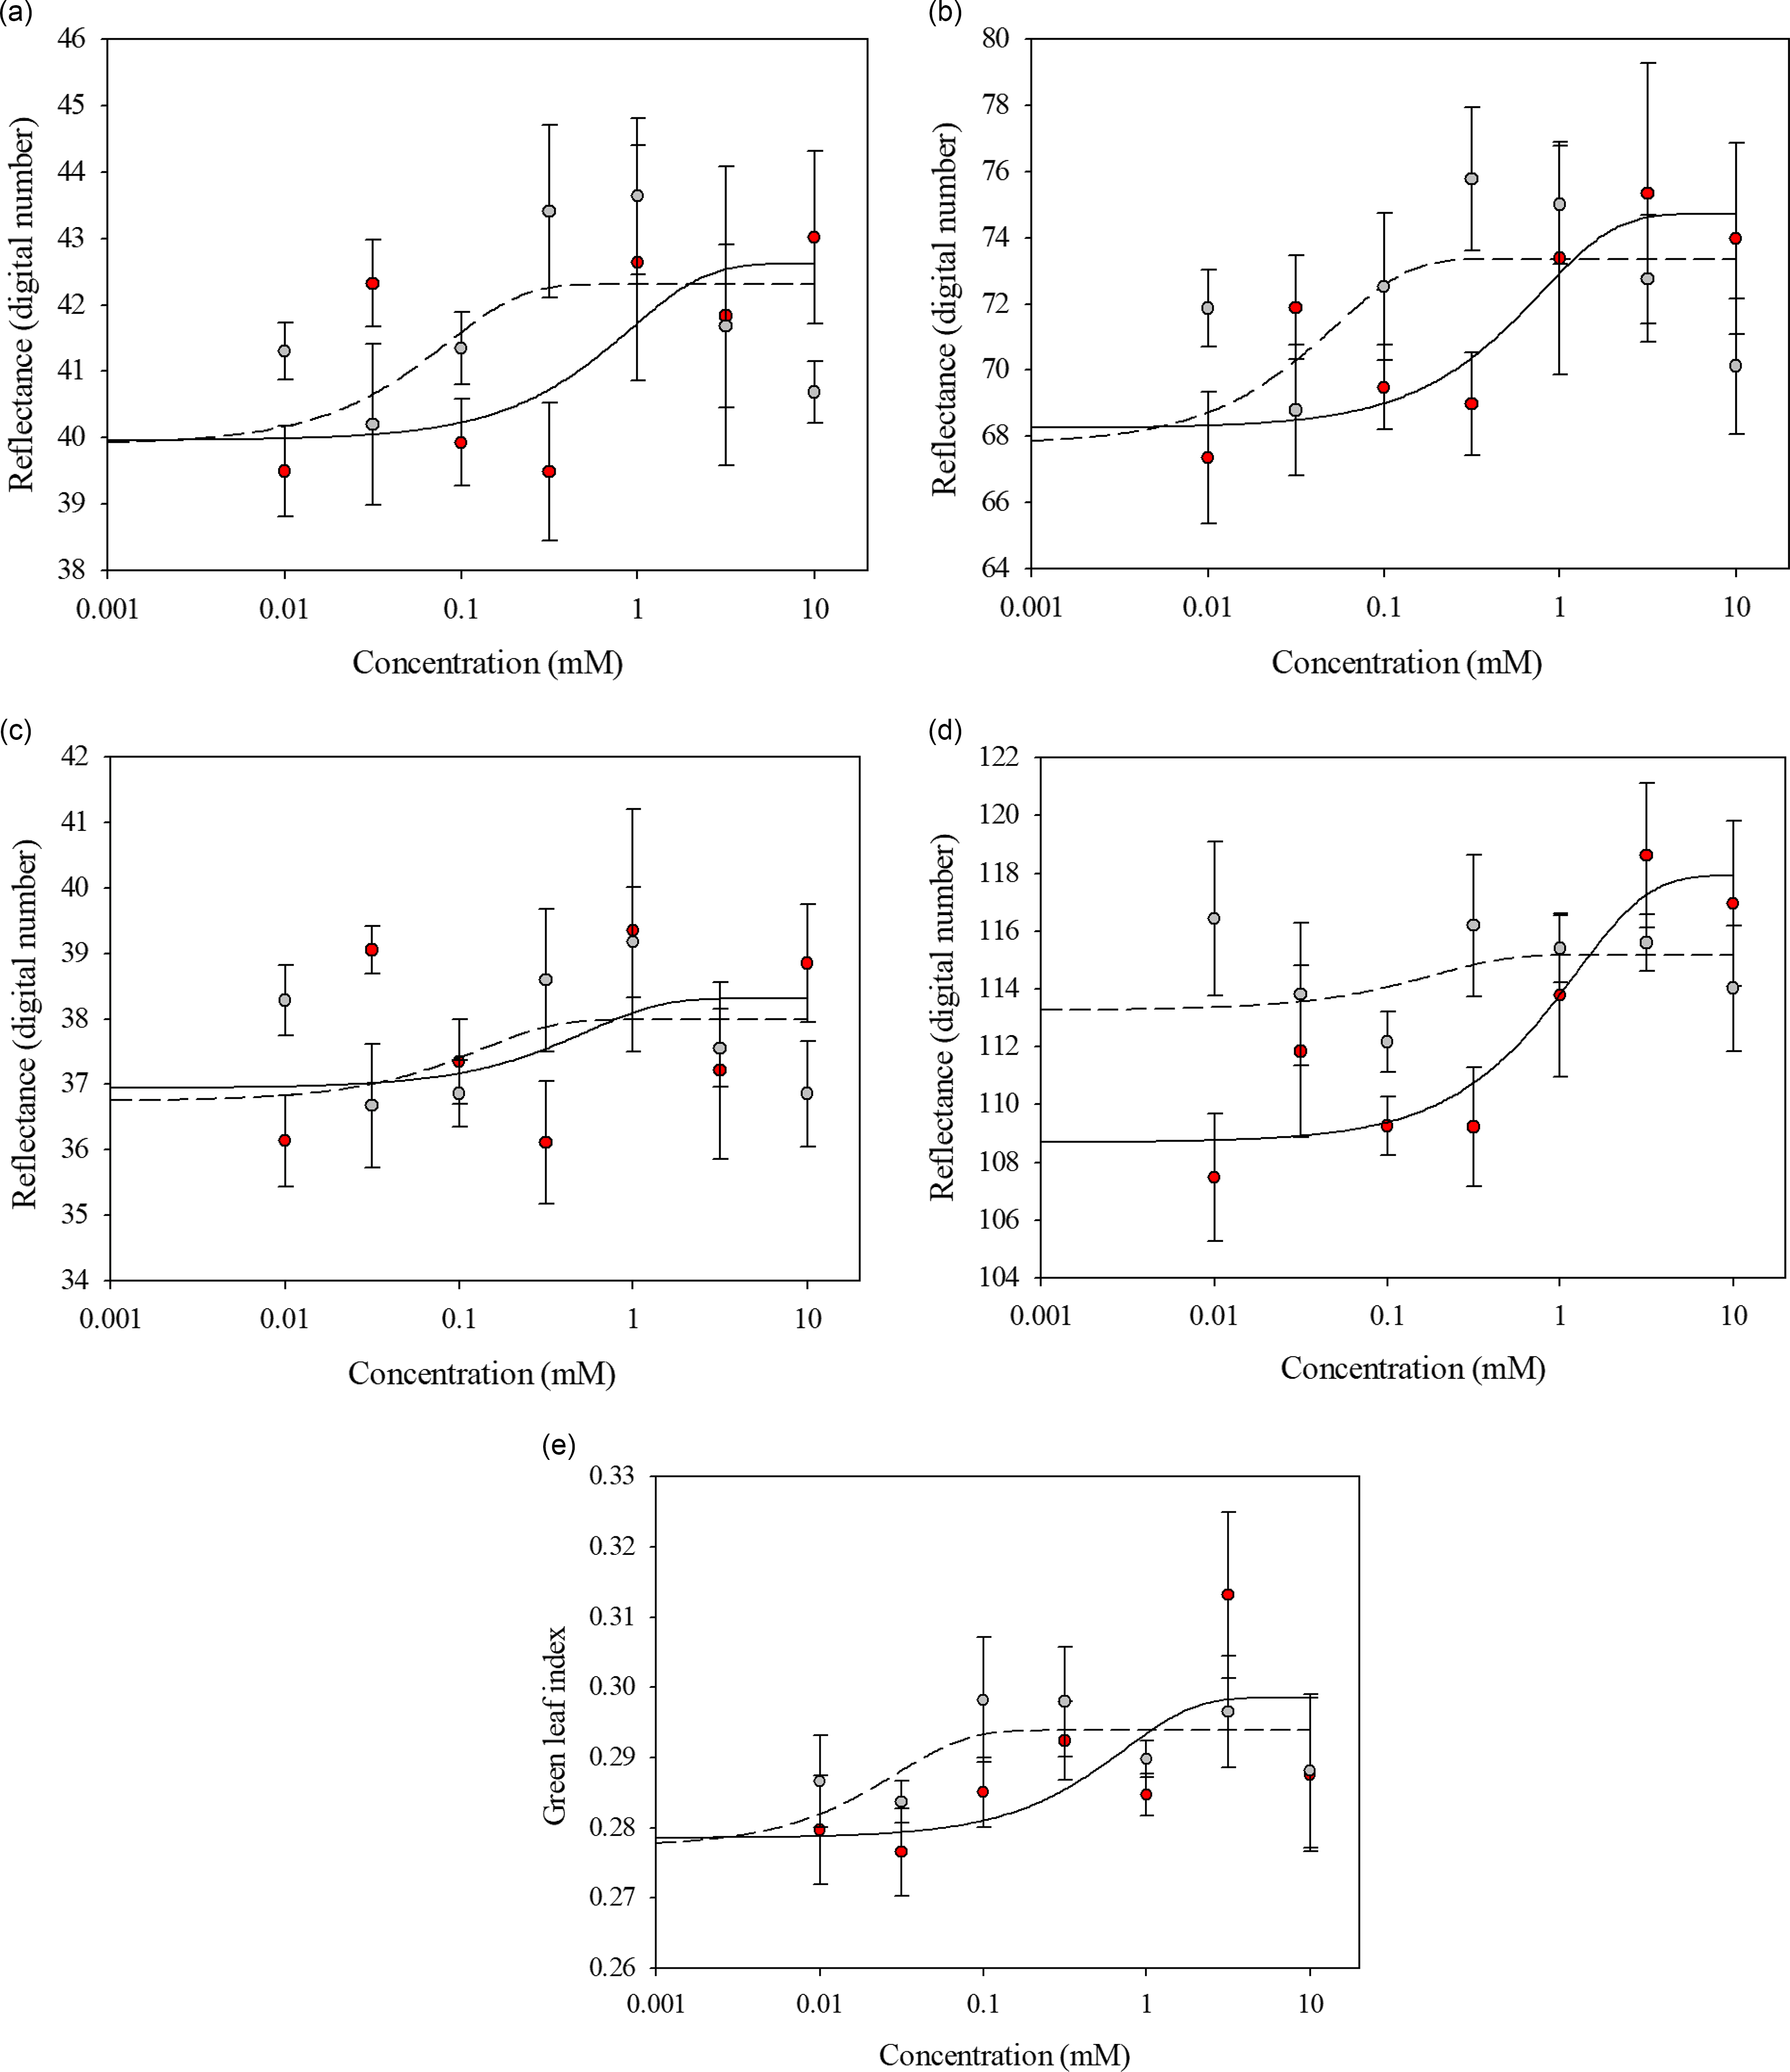
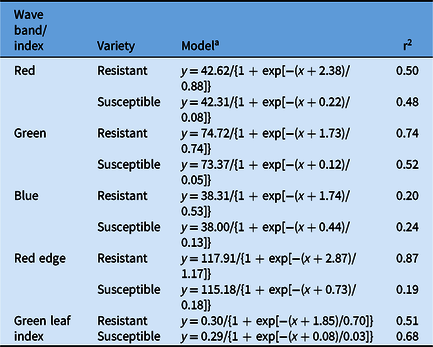
Glufosinate-resistant and glufosinate-susceptible variety leaf disks exhibited similar reflectance when treated with glufosinate concentrations ranging from 0 to 3.16 mM across all wave bands and GLI values (Figure 2). The spectral reflectance between the glufosinate-resistant and glufosinate-susceptible variety leaf disks became distinctive at the 10 mM glufosinate concentration for the red and blue wave bands (Figure 2). The spectral reflectance of the glufosinate-resistant and glufosinate-susceptible variety leaf disks was best modeled with a three-parameter sigmoidal-logistic function for all wave bands and indices (Table 3).
Spectral reflectance of glufosinate-resistant (red) and glufosinate-susceptible (gray) corn variety leaf disks at 48 h after treatment with various concentrations of glufosinate. (A) Red wave band; (B) green wave band; (C) blue wave band; (D) red-edge wave band; (E) green leaf index.
Parameter estimates from the linear regression for the spectral reflectance of glufosinate-resistant and glufosinate-susceptible corn leaf disks treated with glufosinate.
a
A three-parameter sigmoidal-logistic $\left( {y = {{y0} \over {1\; + \;\exp \left\{ { - \left[ {{{\;\left( {x + \;x0} \right)} \over b}} \right]} \right\}}}} \right)$
model was fit to all reflectance data for all wave bands and green leaf index.
$\left( {y = {{y0} \over {1\; + \;\exp \left\{ { - \left[ {{{\;\left( {x + \;x0} \right)} \over b}} \right]} \right\}}}} \right)$
model was fit to all reflectance data for all wave bands and green leaf index.
Cotton
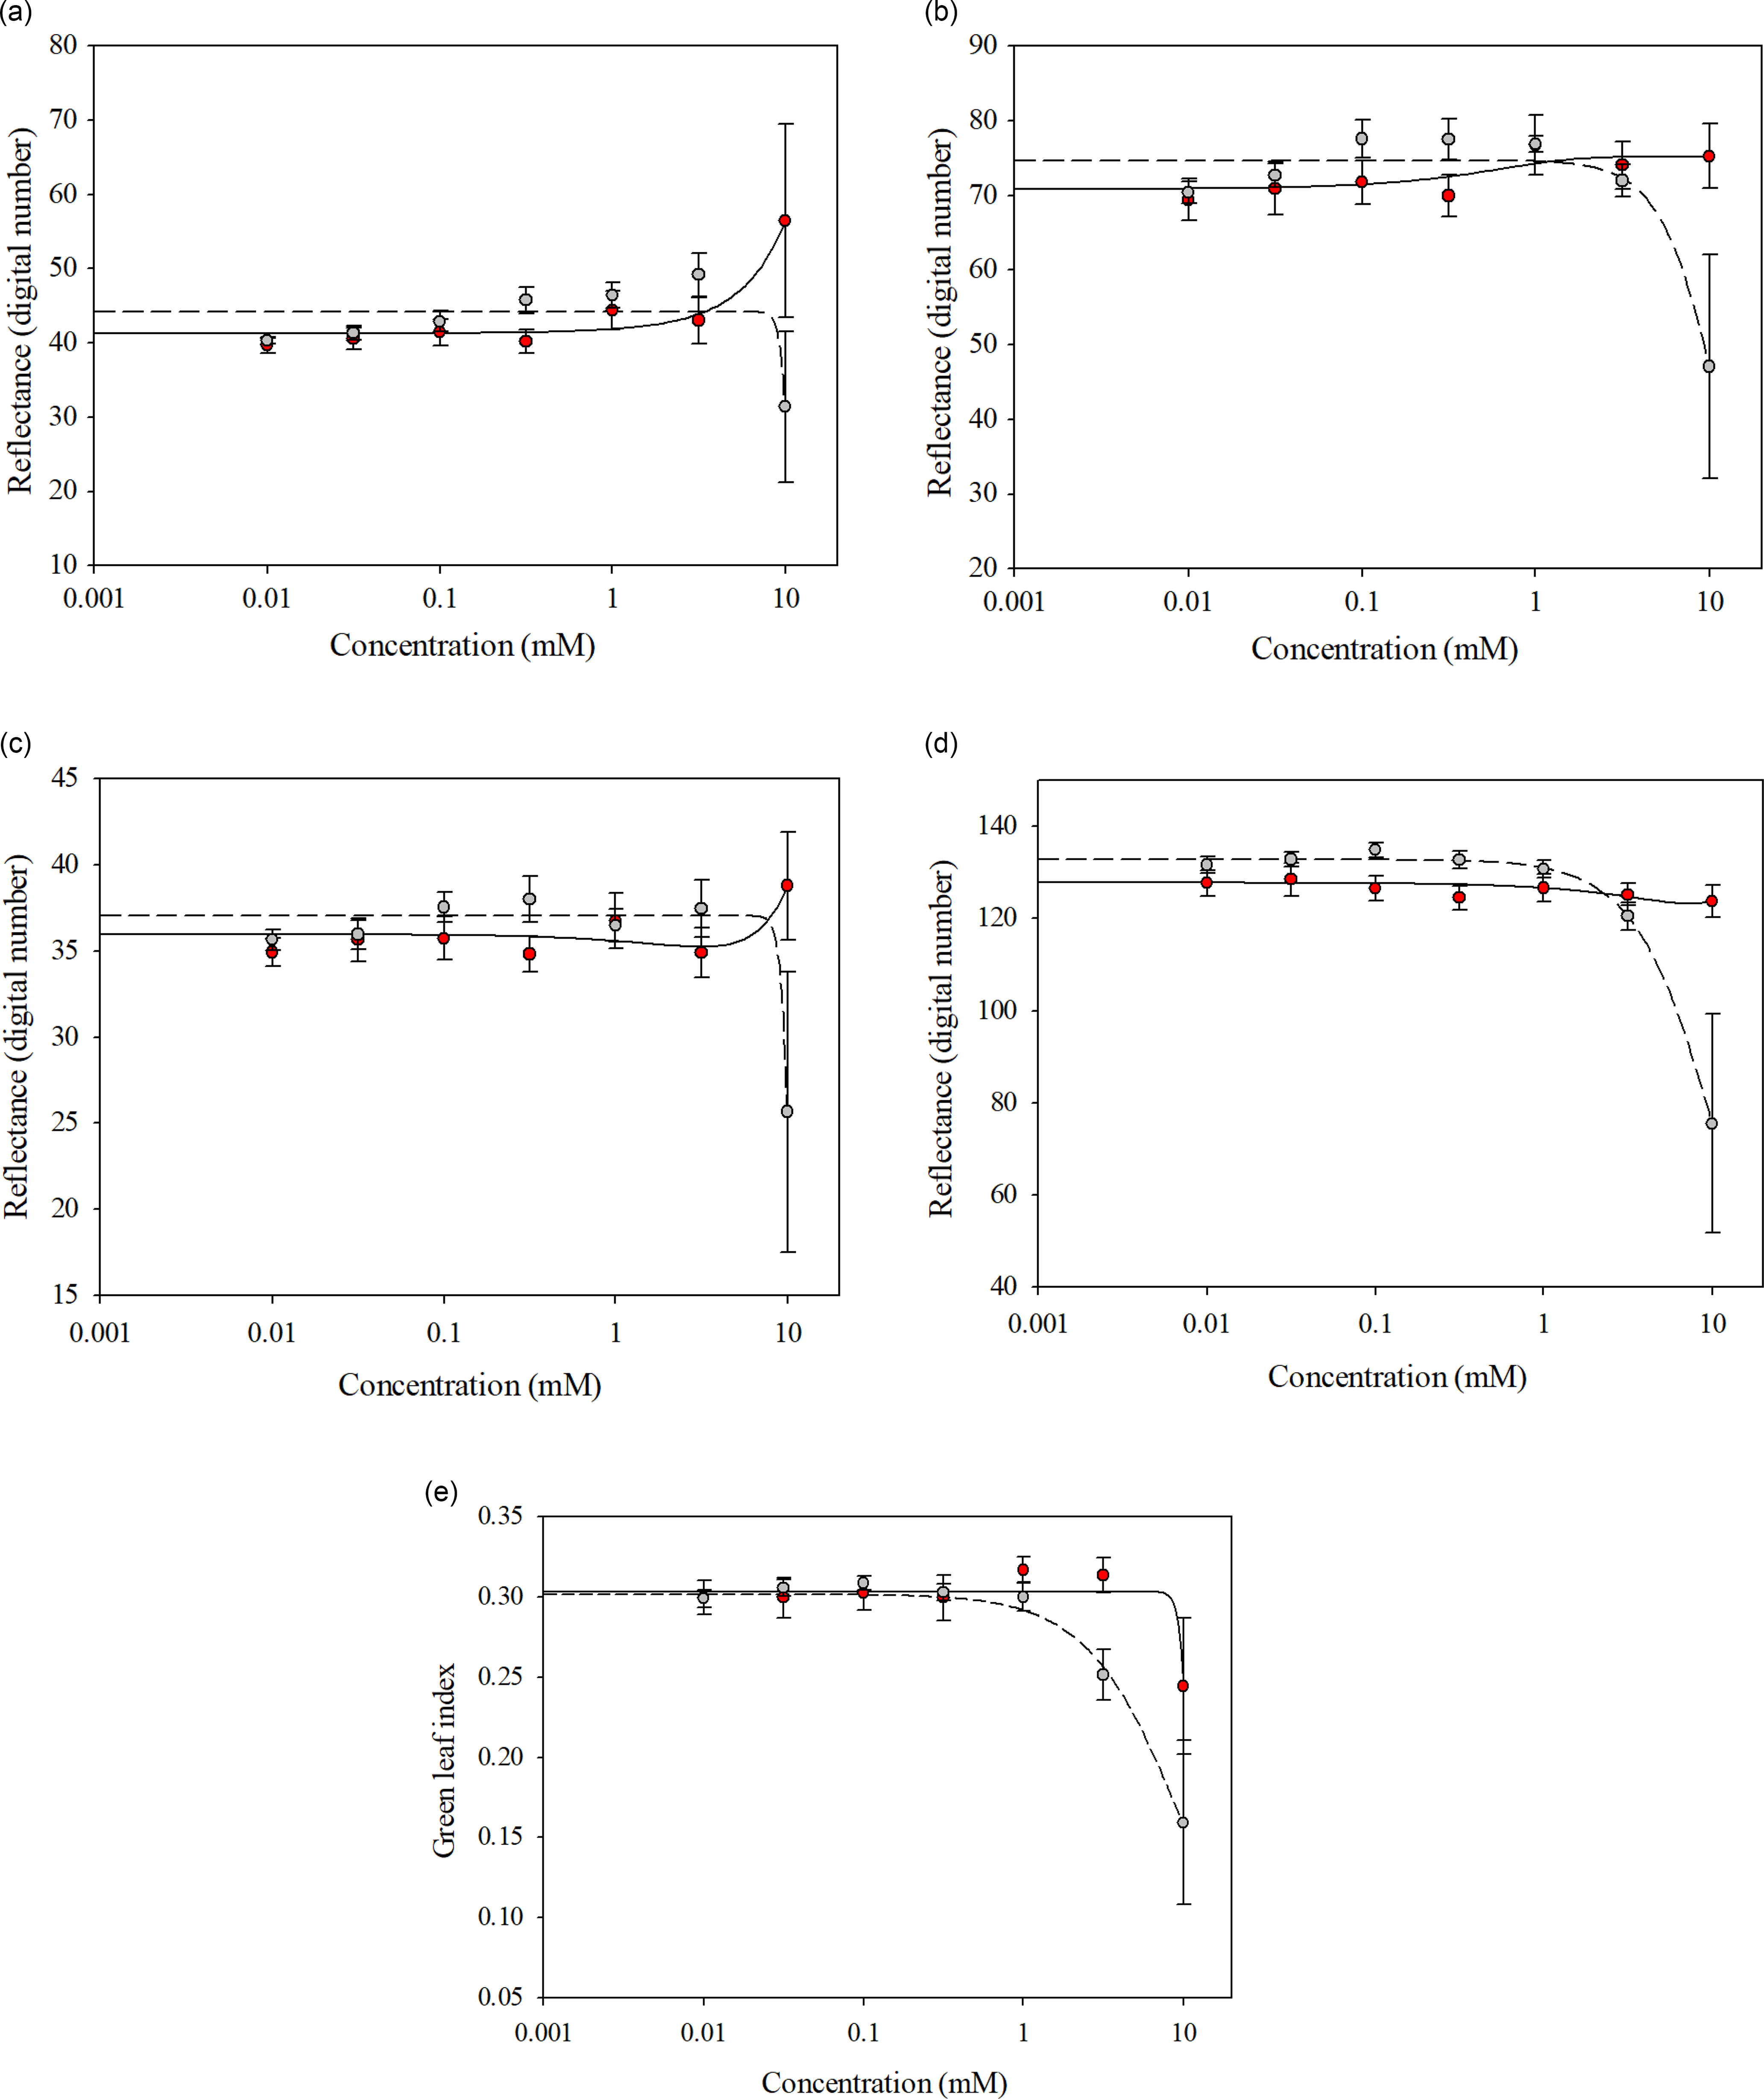
Similar spectra were reflected by the glufosinate-resistant and glufosinate-susceptible variety leaf disks treated with glufosinate concentrations ranging from 0 to 3.16 mM across all wave bands and GLI values (Figure 3). Separation of spectral reflectance between the glufosinate-resistant and glufosinate-susceptible variety leaf disks became apparent at the 10 mM glufosinate concentration across all wave bands and GLI values (Figure 3). Additionally, the differences in reflected spectra between the glufosinate-resistant and glufosinate-susceptible variety leaf disks was elucidated by the fitting of different models across wave bands (Figure 3; Table 4). The spectral reflectance of the glufosinate-resistant variety leaf disks was best modeled using a three-parameter log-logistic equation only for the GLI compared with the glufosinate-susceptible variety leaf disks best modeled with a three-parameter log-logistic equation for the green, blue, and red-edge wave band as well as the GLI (Table 4). The quadratic function best modeled the red-edge wave band reflectance for the glufosinate-resistant variety leaf disks (Table 4). The spectral reflectance of the glufosinate-resistant variety leaf disks were best modeled with a three-parameter sigmoidal-logistic function for the red and blue wave bands compared with the glufosinate-susceptible variety leaf, for which the red wave band was best modeled with this function (Table 4).
Spectral reflectance of glufosinate-resistant (red) and glufosinate-susceptible (gray) cotton variety leaf disks at 48 h after treatment with various concentrations of glufosinate. (A) Red wave band; (B) green wave band; (C) blue wave band; (D) red-edge wave band; (E) green leaf index.
Parameter estimates from the regression models for the spectral reflectance of glufosinate-resistant and glufosinate-susceptible cotton leaf disks treated with glufosinate.

a
A three-parameter log-logistic ( $y = {a \over 1} + {\left( {{x \over {x0}}} \right)^b}$
), quadratic
$y = {a \over 1} + {\left( {{x \over {x0}}} \right)^b}$
), quadratic $\left( {y = y0 + a*x + b*{x^2}} \right)$
, or three-parameter sigmoidal-logistic
$\left( {y = {{y0} \over {1\; + \;\exp \left\{ { - \left[ {{{\left( {x\; + \;x0} \right)} \over b}} \right]} \right\}}}} \right)$
model was selected based on goodness of fit to the reflectance data for all wave bands and green leaf index.
$\left( {y = y0 + a*x + b*{x^2}} \right)$
, or three-parameter sigmoidal-logistic
$\left( {y = {{y0} \over {1\; + \;\exp \left\{ { - \left[ {{{\left( {x\; + \;x0} \right)} \over b}} \right]} \right\}}}} \right)$
model was selected based on goodness of fit to the reflectance data for all wave bands and green leaf index.
Soybean
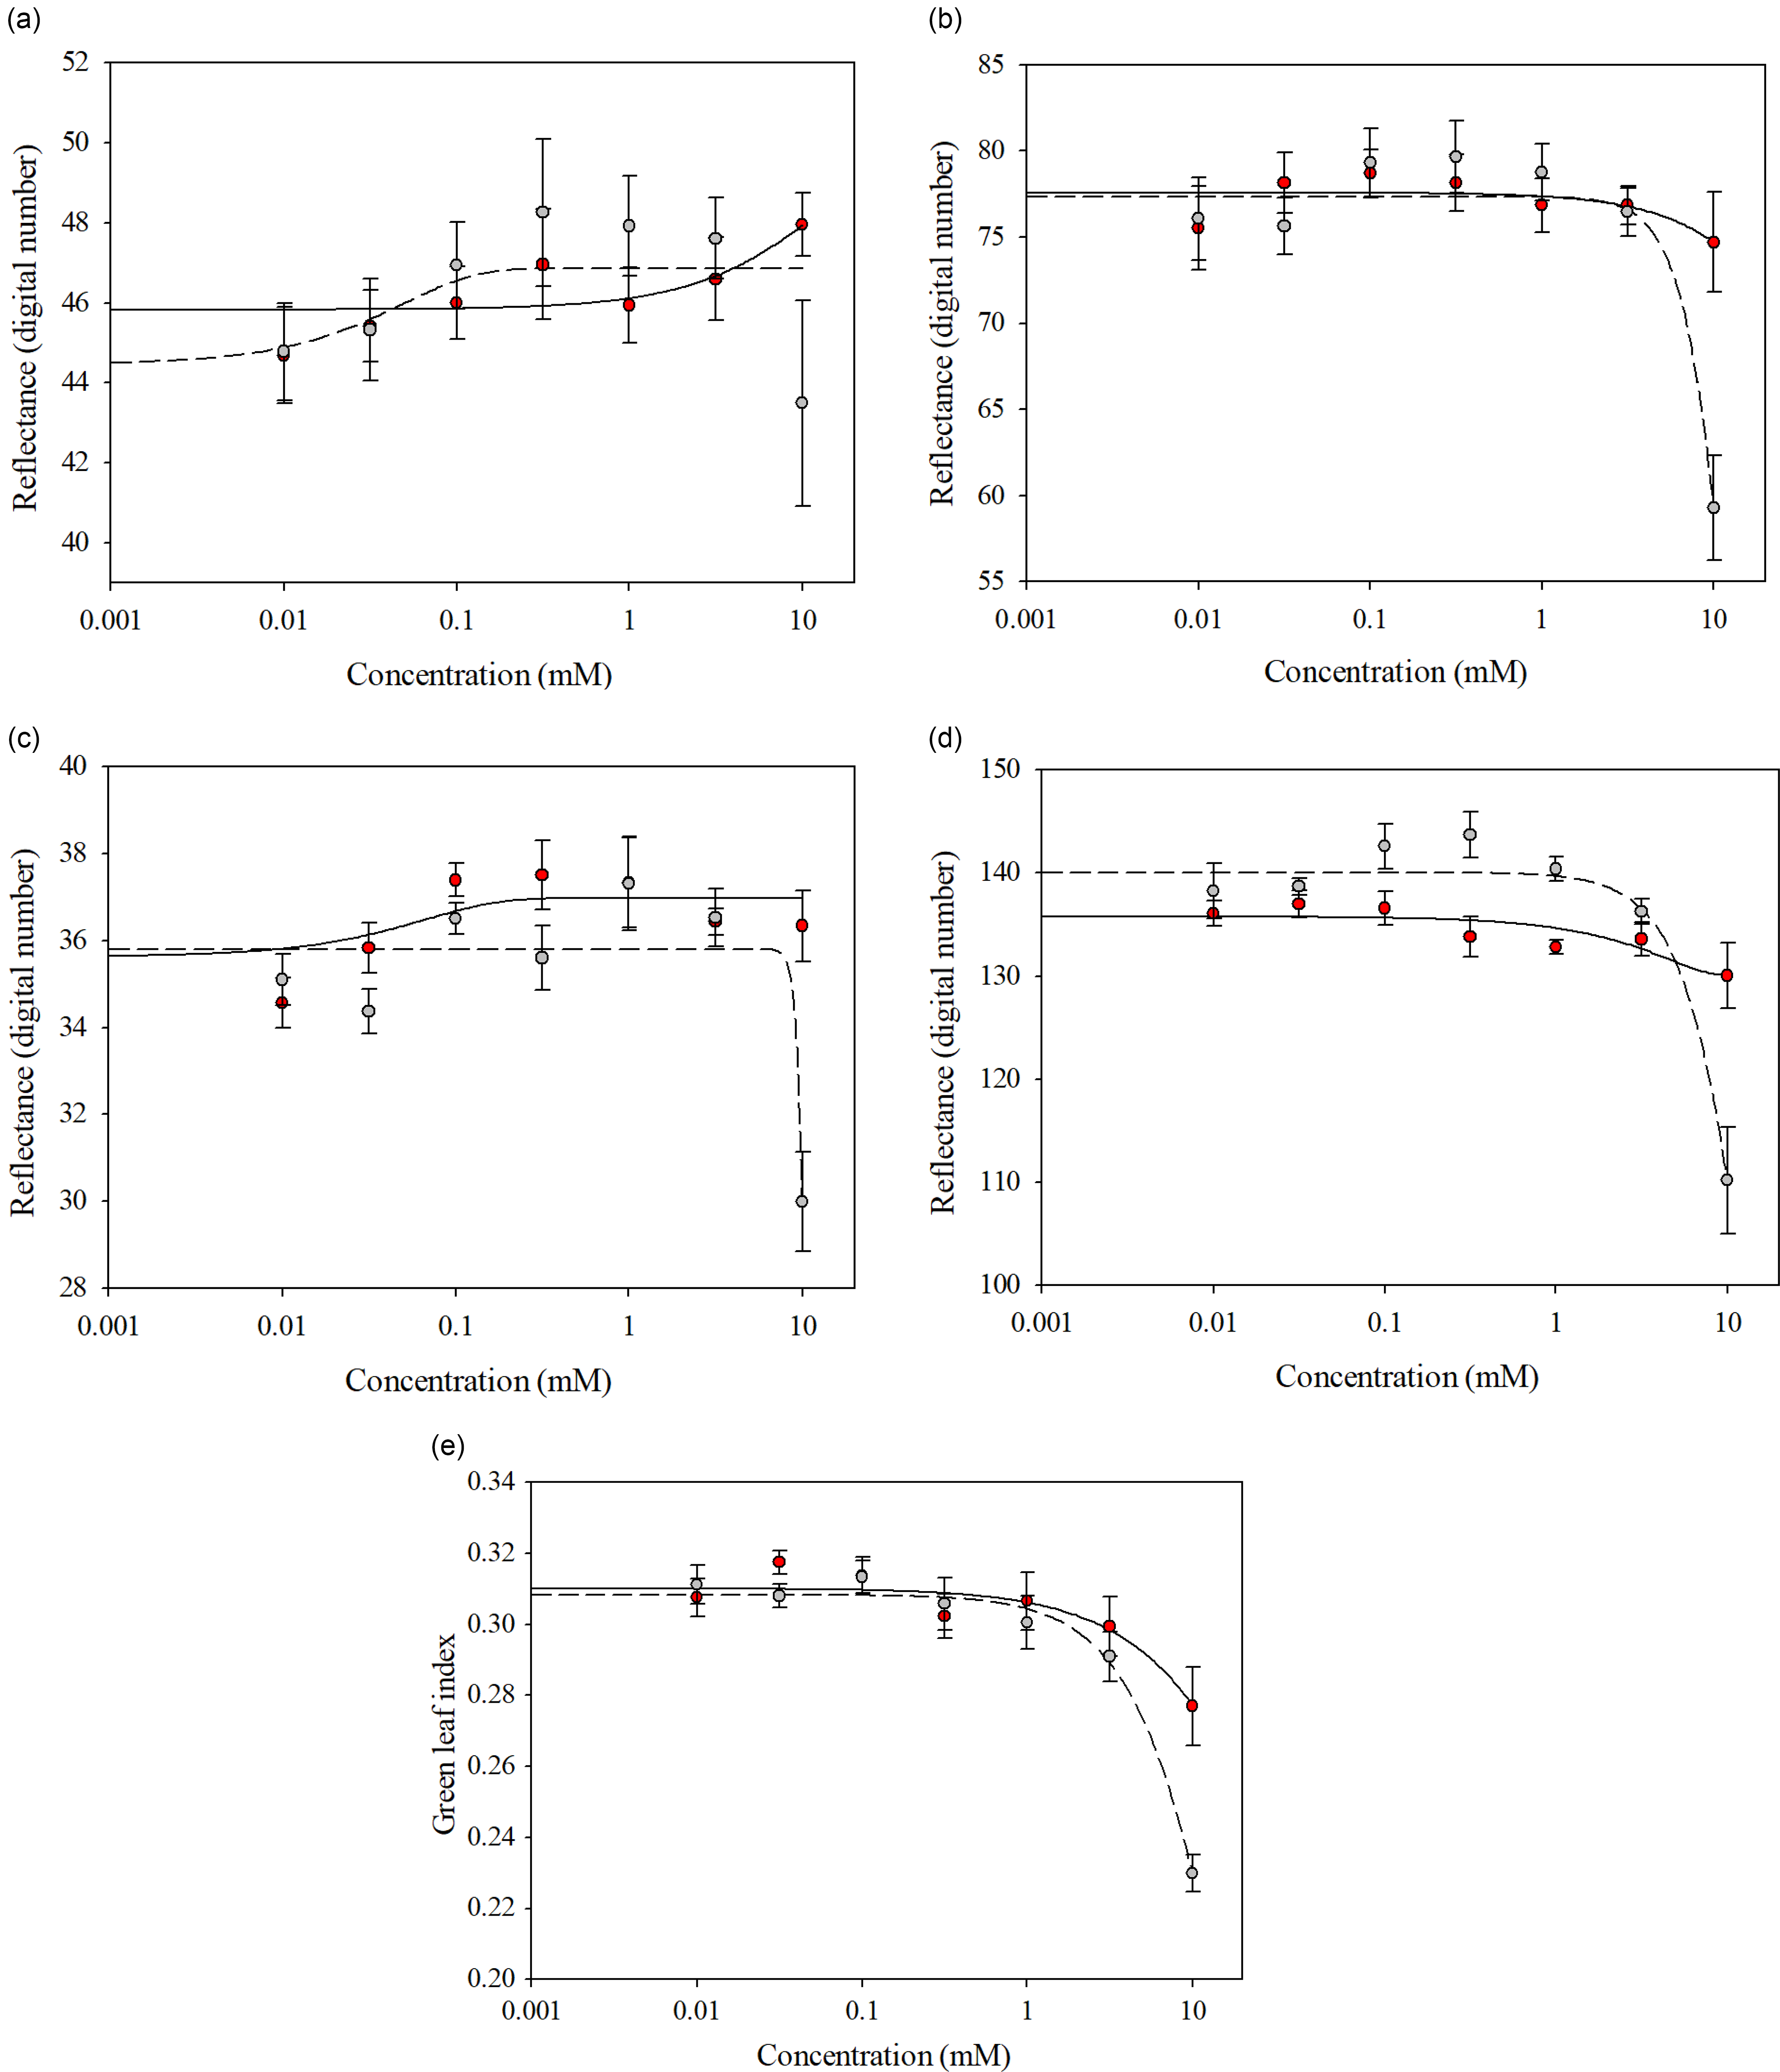
Glufosinate-resistant and glufosinate-susceptible variety leaf disks treated with glufosinate concentrations ranging from 0 to 3.16 mM reflected similar spectra for all wave bands and GLI (Figure 4). The spectral separation between the glufosinate-resistant and glufosinate-susceptible variety leaf disks became evident at the 10 mM glufosinate concentration for all wave bands (Figure 4), while the glufosinate-resistant and glufosinate-susceptible variety leaf disks exhibited inseparable ratios when treated with glufosinate concentrations ranging from 0 to 1 mM for the GLI (Figure 4). The ratios between the glufosinate-resistant and glufosinate-susceptible variety leaf disks were separable at the 3.16 mM glufosinate concentration but were inseparable at the 10 mM glufosinate concentration for the GLI (Figure 4). Additionally, the differences in spectral reflectance for the glufosinate-resistant and glufosinate-susceptible variety leaf disks were elucidated by the fitting of different models across wave bands (Figure 4; Table 5). The reflectance ratio of the glufosinate-resistant variety leaf disks was best modeled with a three-parameter log-logistic function only for the GLI compared with the glufosinate-susceptible variety leaf disks, which were best modeled with a three-parameter log-logistic equation for all wave bands and GLI (Table 5). The spectral reflectance of the glufosinate-resistant variety leaf disks was best modeled using a quadratic function for the blue and red-edge wave bands (Table 5). The three-parameter sigmoidal-logistic function best modeled the reflectance in the green wave band of the glufosinate-resistant varieties’ leaf disks (Table 5).
Spectral reflectance of glufosinate-resistant (red) and glufosinate-susceptible (gray) soybean variety leaf disks at 48 h after treatment with various concentrations of glufosinate. (A) Red wave band; (B) green wave band; (C) blue wave band; (D) red-edge wave band; (E) green leaf index.
Parameter estimates from the regression models for the spectral reflectance of glufosinate-resistant and glufosinate-susceptible soybean leaf disks treated with glufosinate.

a
A three-parameter log-logistic ( $y = {a \over 1} + {\left( {{x \over {x0}}} \right)^b}$
), quadratic
$\left( {y = y0 + a*x + b*{x^2}} \right)$
, or three-parameter sigmoidal-logistic
$\left( {y = {{y0} \over {1 + \exp \left\{ { - \left[ {{{\left( {x + x0} \right)} \over b}} \right]} \right\}}}} \right)$
model was selected based on goodness of fit to the reflectance data for all wave bands and green leaf index.
$y = {a \over 1} + {\left( {{x \over {x0}}} \right)^b}$
), quadratic
$\left( {y = y0 + a*x + b*{x^2}} \right)$
, or three-parameter sigmoidal-logistic
$\left( {y = {{y0} \over {1 + \exp \left\{ { - \left[ {{{\left( {x + x0} \right)} \over b}} \right]} \right\}}}} \right)$
model was selected based on goodness of fit to the reflectance data for all wave bands and green leaf index.
Discrimination Of Glufosinate Resistance across Varieties
Corn
Spectral reflectance was not different between the glufosinate-resistant and glufosinate-susceptible leaf disks treated or nontreated in the red, green, or blue wave bands for the concentrations evaluated (Table 6). Reflectance was higher for the nontreated glufosinate-resistant leaf disks compared with the treated leaf disks in the red-edge wave band and GLI (Table 6). Despite these minute differences, this assay was not informative for capturing distinct spectral profiles of glufosinate-resistant or glufosinate-susceptible corn. The distinct spectral profiles of the glufosinate-resistant and glufosinate-susceptible leaf disks in the red and blue wave bands from the dose–response assay were not concordant with the discriminating rate assay (Figure 2; Table 6). Ultimately, this assay was not informative for discriminating between glufosinate-resistant and glufosinate-susceptible corn varieties.
Reflectance of glufosinate-resistant and glufosinate-susceptible corn leaf disks treated with 10 mM of glufosinate at 48 h after treatment.
a Values within a column that share the same letters are not statistically different based on Fisher’s LSD (P < 0.1).
Cotton
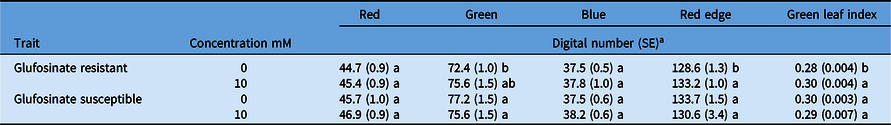
The reflectance between treated and nontreated glufosinate-resistant and glufosinate-susceptible leaf disks in were no different in the red wave band (Table 7). Reflectance was not different between the nontreated glufosinate-resistant and glufosinate-susceptible leaf disks in the green wave band, while the reflectance was lower for the treated glufosinate-susceptible leaf disks compared with the glufosinate-resistant leaf disks (Table 7). The spectral reflectance did not differ for the treated glufosinate-resistant leaf disks and nontreated leaf disks in the green wave band (Table 7). Similar trends of spectral reflectance were observed in the blue wave band (Table 7). Reflectance of the nontreated leaf disks was no different, while the reflectance of treated glufosinate-resistant leaf disks was higher than that of the glufosinate-susceptible leaf disks in the red-edge wave band (Table 7). The reflectance of the treated leaf disks was lower than that of the nontreated leaf disks in the red-edge wave band (Table 7). Additionally, the reflectance ratio was different between the treated and nontreated glufosinate-resistant and glufosinate-susceptible leaf disks in the GLI (Table 7). However, the reflectance ratio was no different between the glufosinate-resistant and glufosinate-susceptible leaf disks within treatment (Table 7). The distinct spectral profiles of the glufosinate-resistant and glufosinate-susceptible leaf disks from the dose–response assay were concordant with the rapid assay, except for the red wave band and GLI (Figure 3; Table 7).
Reflectance of glufosinate-resistant and glufosinate-susceptible cotton leaf disks treated with 10 mM of glufosinate at 48 h after treatment.

a Values within a column that share the same letters are not statistically different based on Fisher’s LSD (P < 0.1).
Soybean
Spectral reflectance of the treated and nontreated glufosinate-resistant and glufosinate-susceptible leaf disks was different in the red wave band, red-edge wave band, and GLI, respectively (Table 8). Reflectance of the treated and nontreated glufosinate-susceptible leaf disks was different, but this was not observed for the glufosinate-resistant leaf disks in the green wave band (Table 8). Reflectance of the treated and nontreated glufosinate-resistant and glufosinate-susceptible leaf disks was no different in the blue wave band (Table 8). Contrasts were conducted across the soybean varieties, and similar trends were observed (data not shown). The distinct spectral profiles of the glufosinate-resistant and glufosinate-susceptible leaf disks from the dose–response assay were not concordant with the discriminating rate assay (Figure 4; Table 8).
Reflectance of glufosinate-resistant and glufosinate-susceptible soybean leaf disks treated with 10 mM of glufosinate at 48 h after treatment. a

a Values within a column that share the same letters are not statistically different based on Fisher’s LSD (P < 0.1).
Resistant or susceptible corn treated with glufosinate did not exhibit a different spectral profile when compared with each other or with nontreated corn. However, corn treated with auxin herbicides and paraquat exhibited distinct spectral reflectance compared with nontreated corn (Everman et al. Reference Everman, Medlin, Dirks, Bauman and Biehl2008; Henry et al. Reference Henry, Shaw, Reddy, Bruce and Tamhankar2004). Previous research has demonstrated that grass plants incur injury when treated with glufosinate less rapidly than broadleaf plants (Takano et al. Reference Takano, Beffa, Preston, Westra and Dayan2019). Glufosinate is not the most efficacious grass weed herbicide, which might explain why discrimination between glufosinate-resistant and glufosinate-susceptible corn leaf disks was not successful with either assay (Aulakh and Jhala Reference Aulakh and Jhala2015; Burke et al. Reference Burke, Askew, Corbett and Wilcut2005; Chahal and Jhala Reference Chahal and Jhala2015; Ellis et al. Reference Ellis, Griffin, Linscombe and Ep2003). These results may foreshadow the incompatibility of the presented assays for detecting glufosinate-resistant grass weed species. The presented assays may have to be conducted for longer than 48 h for successful discrimination between resistant and susceptible grass weeds. The assay could be coupled with assays quantifying by-products of glufosinate (e.g., reactive oxygen species) to determine the length of time for conduction and the discriminating concentration needed (Takano et al. Reference Takano, Beffa, Preston, Westra and Dayan2019, Reference Takano, Beffa, Preston, Westra and Dayan2020).
Both assays successfully discriminated between glufosinate-resistant and glufosinate-susceptible cotton. This result is significant, as it is evidence that these assays could be manipulated into a rapid assay to confirm glufosinate resistance in weeds. The widespread evolution of glufosinate-resistant A. palmeri is a great concern in North Carolina (Jones et al. Reference Jones, Cahoon, Leon and Everman2022b); glufosinate-susceptible cotton and A. palmeri have a similar physiological response to glufosinate treatment, suggesting that the assays may be successful (Everman et al. Reference Everman, Thomas, Burton, York and Wilcut2009). While glufosinate is an efficacious broadleaf weed herbicide, the discriminating dose assay was not as informative compared with the dose–response assay for soybean. One reason why the discriminating dose assay was not successful could be the differential trichome characteristics exhibited by each soybean variety (Brewer and Smith Reference Brewer and Smith1994; Buick et al. Reference Buick, Buchan and Field1993). A trichome could act a physical barrier between the leaf surface and the glufosinate concentration despite initial submersion of the leaf disks (Hess and Falk Reference Hess and Falk1990). While the discriminating dose assay did not capture distinct spectral profiles of glufosinate-resistant and glufosinate-susceptible soybean leaf disks, there may be merit in doing a dose–response assay for detecting putative glufosinate-resistant weed species that exhibit dense pubescence, as discrimination was successful within 48 h for select wave bands (Figure 3).
The results of the experiment provide a basis of confirming glufosinate resistance in plants via spectral reflectance. Both assays could discriminate between glufosinate-resistant and glufosinate-susceptible broadleaf plants within 48 h, and conducting the assays had minimal barriers of entry. Rapidly providing a farmer with information concerning whether a weed is herbicide resistant or not will allow for timely implementation of effective control tactics and possible eradication of the biotype Another important aspect of the successful transfer of this assay from glufosinate-resistant crops to glufosinate-resistant weeds is the mechanism(s) of resistance will differ and may not be homogenously distributed throughout the weed population (Noguera et al. Reference Noguera, Porri, Werle, Heiser, Brändle, Lerchl, Murphy, Betz, Gatzmaan, Penkert, Tuerk, Meyer and Roma-Burgos2022; Zhang et al. Reference Zhang, Yu, Han, Yu, Nyporko, Tian, Beckie and Powles2022). Currently, the assays require a glufosinate-susceptible sample to determine whether a plant is resistant. More research is needed to determine “resistant” and “susceptible” thresholds for each wave band and GLI, which can be done by high-throughput screening of many glufosinate-resistant and glufosinate-susceptible crop varieties and weed biotypes. Establishing concrete “resistant” and “susceptible” thresholds may alleviate the need for a glufosinate-susceptible sample for assay success and differential mechanism(s) of resistance. Additionally, glufosinate concentrations may need to be adjusted when trying to discriminate between putative glufosinate-resistant and glufosinate-susceptible weed species.
Acknowledgments
Project funding was provided by the North Carolina Soybean Producers Association. The authors declare no conflict of interest.


 Open access