


1. Introduction
The surface mass balance of a glacier is a sensitive indicator of climatic change (e.g. Reference Kaser, Cogley, Dyurgerov, Meier and OhmuraKaser and others, 2006; Reference Zemp, Hoelzle and HaeberliZemp and others, 2009), but campaigns of direct mass-balance measurement can be laborious and expensive (Reference BraithwaiteBraithwaite, 1984; Reference Huss and BauderHuss and Bauder, 2009). The traditional stakes-and-pits method of measuring mass balance (e.g. Reference Østrem and BrugmanØstrem and Brugman; 1991; Reference Kaser, Cogley, Dyurgerov, Meier and OhmuraKaser and others, 2006 involves monitoring ice melt at ablation stakes during summer field campaigns and digging snow pits during the winter to measure both snow thickness and density. Further methodological shortcomings also arise, for example if ablation stakes sink into the firn during summer melt (Reference Østrem and HaakensenØstrem and Haakensen, 1999) or if the network of sample points is too sparse to be interpolated accurately across the whole glacier surface (Reference PatersonPaterson, 1994; Reference Barrand, James and MurrayBarrand and others, 2010). The importance of mass-balance measurements has therefore prompted many investigations into performing them from remote platforms (e.g. Reference HubbardHubbard and others, 2000; Reference Kohler, Moore and IsakssonKohler and others, 2003; Reference Hagg, Braun, Uvarov and MakarevichHagg and others, 2004; Reference Bamber and RiveraBamber and Rivera, 2007; Reference Machguth, Haeberli and PaulMachguth and others, 2012). Nonetheless, provided that they are accurate, direct mass-balance measurements provide a vital ground-truth reference for calibrating remotely sensed observations (e.g. Reference BoxBox and others, 2006; Reference Schuler, Loe, Taurisano, Eiken, Hagen and KohlerSchuler and others, 2007).
Here we explore the effectiveness of a simple geophysical survey as a complement to a campaign of winter mass-balance records. Geophysical methods, including seismic and ground-penetrating radar (GPR), have broad applications in glaciology for imaging the internal and underlying structure of glaciers and ice masses, but are increasingly used for quantifying glacier physical properties (e.g. density, water content, etc.; Reference Endres, Murray, Booth and WestEndres and others, 2009; Reference Matsuoka, Wilen, Hurley and RaymondMatsuoka and others, 2009; Reference BoothBooth and others, 2012; Reference Peters, Anandakrishnan, Alley and VoigtPeters and others, 2012). Specialized geophysical methods have been developed for characterizing the properties of snow and firn (e.g. Reference Kinar and PomeroyKinar and Pomeroy, 2007; Reference Hawley, Brandt, Morris, Kohler, Shepherd and WinghamHawley and others, 2008; Reference Bradford, Harper and BrownBradford and others, 2009; Reference Tsoflias, Ivanov, Anandakrishnan, Horgan and PetersTsoflias and others, 2010; Reference Kruetzmann, Rack, McDonald and GeorgeKruetzmann and others, 2011), but here we consider how effectively a co-located set of efficient GPR and seismic refraction surveys can measure both snow thickness and density. We first investigate the accuracy of snow thickness estimates from the seismic and GPR data compared with a measurement made in a snow pit and then compare the densities obtained from a number of familiar mixing models and empirical relationships with ground-truth observations.
We emphasize that the geophysical data in this paper were not purposefully optimized with the aim of measuring snow density (as described by Reference Harper and BradfordHarper and Bradford, 2003; Reference King and JarvisKing and Jarvis, 2007; Reference Tsoflias, Ivanov, Anandakrishnan, Horgan and PetersTsoflias and others, 2010; Reference Brown, Bradford, Harper, Pfeffer, Humphrey and Mosley-ThompsonBrown and others, 2012). However, our analysis suggests that even with such non-specialized acquisitions, we can obtain a first-order approximation of snow density and accurate snow thickness and we therefore suggest that geophysical survey methods do provide an efficient complement to a campaign of mass-balance measurements. However, we also acknowledge that surveys designed specifically for measuring snow density could provide significant improvements for reliability.
2. Field Site and Geophysical Acquisitions
Geophysical data were acquired on Storglaciären (Fig. 1), a polythermal mountain glacier in the Kebnekaise massif, northern Sweden (67°54’N, 18°34’W). The glacier has a long archive of mass-balance measurements, continuous since 1945 (e.g. Reference Karlén and HolmlundKarlén and Holmlund, 1996; Reference Holmlund and JanssonHolmlund and Jansson, 1999; Reference Holmlund, Jansson and PetterssonHolmlund and others, 2005; Reference Zemp, Hoelzle and HaeberliZemp and others, 2009, Reference Zemp2010). Furthermore, the spatial coverage of those measurements is very dense compared with other glaciers: the coverage of winter and summer mass-balance measurement points is ∼100 and ∼-15km–2, respectively (Reference Jansson and PetterssonJansson and Pettersson, 2007). Such detailed study is possible at Storglaciären given the nearby logistic base provided by Tarfala research station.
Map of Storglaciären and location of geophysical acquisitions (edited from Reference Holmlund and JanssonHolmlund and Jansson, 2002). Main grid coordinates are in Swedish grid (RT90), and contours are at 50 m intervals above sea level. Inset shows local grid around location of seismic refraction spread and snow pit. Stars show the locations of the seismic shots at each end of the refraction line (white dotted line, 11.5 m long). The centre of the GPR CMP gather is 2 m east of the western shot, and the grey square shows the position of the snow pit.
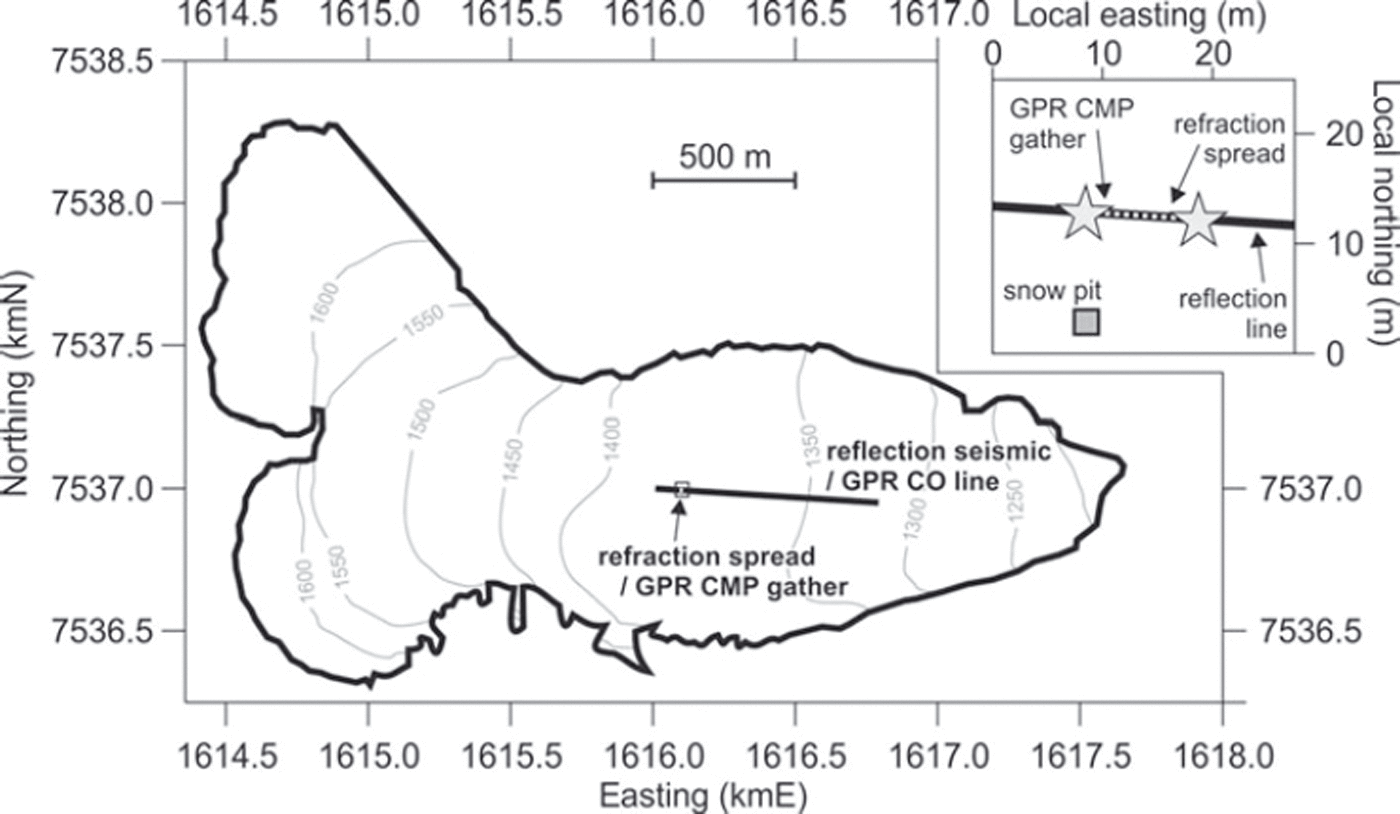
The GPR and seismic refraction surveys we present here were acquired in April 2012 in support of a seismic reflection profile located in the glacier’s ablation zone along its centre line (Fig. 1). Seismic refraction data play an important role in the processing of a reflection dataset, since they are used to define static corrections for removing the effect of topographic and near-surface velocity variations (Reference Farrell and EuwemaFarrell and Euwema, 1984; Reference CoxCox, 1999; Reference Yilmaz and DohertyYilmaz and Doherty, 2001). In the context of our Storglaciären acquisition, static corrections are required to remove the effect of lateral and vertical variations in the properties of snow cover, which was present across the entire glacier at the time of survey. The purpose of the refraction survey was therefore to measure the seismic P-wave (compressional wave) velocity through the snow cover and uppermost glacier ice.
Refraction surveys could also have been used to investigate snow thickness variations along the whole seismic line, but moving and replanting geophones at such a range of surface positions would have been too time-consuming for the available survey time. Instead, a high-frequency GPR system provided a more efficient (and, at the same time, higher-resolution) means of performing this task (e.g. Reference Dunse, Schuler, Hagen, Eiken, Brandt and HøgdaDunse and others, 2009). Observations from the two datasets were then tied together using a GPR common midpoint (CMP) survey at the location of the refraction spread.
The geophysical survey coincided with the start of winter mass-balance measurements at Storglaciären. On completing the survey, the opportunity arose to dig a snow pit directly at the site of the geophysical measurements to obtain a ground-truth record of snow thickness and density. This provides a useful reference for calibrating the seismic and GPR, but also allows us to test how reliably a non-optimized (i.e. not designed specifically for measuring snow density) but efficient set of geophysical acquisitions can quantify the properties of the snowpack. We first consider how accurately the thickness of snowpack can be estimated and then investigate the derivation of snow density from GPR and seismic data. Both of these estimates require wave propagation velocity to be measured accurately; a description of our velocity analyses is therefore included in the following sections.
2. 1. GPR data
GPR acquisition was performed with a Sensors and Software pulseEKKO PRO system equipped with antennas of 500MHz centre frequency. In the common offset (CO) configuration (Fig. 2a), the antennas were mounted in a sled (at a separation of 0.23 m) and traces were triggered every 5 cm along the profile using a calibrated odometer wheel. The efficiency of GPR acquisition was such that the 1 km length of the seismic reflection line was acquired in ∼30 min by surveyors walking on foot; however, the GPR system could easily be mounted on a snowmobile to give extremely rapid acquisition. For the accompanying CMP acquisition (Fig. 2b), antennas were positioned either side of the westernmost source location in the refraction line at an initial source-receiver offset of 0.4 m, extending to 4.0 m in increments of 0.1 m. The passage of the survey sled during the CO survey had left a smooth track in the snow; antennas were placed in this track during the CMP acquisition to lessen microscale elevation variations and we estimate that offsets are accurate to ± 1 cm.
500 MHz GPR data acquired at Storglaciaren. (a) 15 m section of CO profile. Data processing involves dewow and bandpass filters, time-zero correction, Kirchhoff migration and application of automatic gain control for display. (b) CMP gather. Acquisition is centred on the 190 m CO trace and the trace interval is 0.1 m. (c) Coherence response to (b). Successive responses are to individual half-cycles of the GPR wavelet (Reference Booth, Clark and MurrayBooth and others, 2010). Wavelet period T is measured as the travel time across three successive responses. Two reflections (an internal snowpack layer and the base of the snowpack) and a multiple are identified. Picks of stacking velocity (⊗ symbols) yield the solid trajectories in (b), which are shifted to approximate wavelet first breaks (dashed trajectories in (b)).

Two reflections are apparent in the CO and CMP data, interpreted as an internal horizon in the snowpack (upper event; travel time of 8.4 ns) and the base of the snowpack (lower event; travel time of 16.8 ns). Initially, travel times suggest that the lower event is a multiple of the upper, although application of the extended velocity analysis detailed below shows that this is not the case. Although there are several approaches to conducting CMP velocity analysis (e.g. semblance, t 2 – x 2 analyses; Reference Huisman, Hubbard, Redman and AnnanHuisman and others, 2003), here we use ‘coherence’ since it facilitates the application of an important velocity correction procedure (Reference Booth, Clark and MurrayBooth and others, 2010). We use the term coherence to distinguish from semblance: the two analyses vary only in terms of the duration of their analysis window, with that of semblance extending across 1-11/2 wavelet periods (Reference Sheriff and GeldartSheriff and Geldart, 1999) and that of coherence being one temporal sample only. The procedure we apply is a two-phase approach, first requiring the analysis of (specifically) the coherence response to a dataset and thereafter applying t 2 – x 2 to time-shifted reflection hyperbolae. The key steps in this method are given here; a complete description is presented by Reference Booth, Clark and MurrayBooth and others (2010).
Most approaches to velocity analysis yield models that are initially only strictly suitable for imaging (e.g. CMP stacking, hence the nomenclature ‘stacking velocity’; Reference Yilmaz and DohertyYilmaz and Doherty, 2001) and not for quantifying physical properties (Reference SchneiderSchneider, 1971). Even in the absence of refraction and anisotropic travel-time effects (Reference Tillard and DuboisTillard and Dubois, 1995; Reference Becht, Appel and DietrichBecht and others, 2006) velocity errors occur because it is only the first break of a wavelet that expresses true propagation velocity. Semblance and coherence analyses respond only to the ensuing half-cycles of a wavelet (i.e. its non-zero samples), hence the velocity that is expressed is biased systematically slow (Reference Booth, Clark and MurrayBooth and others, 2010). Likewise, time picks located at the peak amplitude of GPR wavelets and analysed thereafter in t 2–x 2 analysis are prone to equivalent velocity errors. These errors propagate into estimates of interval velocity (i.e. when velocities are substituted into Dix’s equation; Reference DixDix, 1955) and, therefore, into velocity-derived physical properties (e.g. depth, water content). The correction of velocity errors then becomes especially relevant where there is a nonlinear relationship between velocity and a quantity derived from it (e.g. Reference Topp, Davis and AnnanTopp and others, 1980; Reference Fortin and FortierFortin and Fortier, 2001).
The responses in a coherence panel correspond to reflection travel times along individual half-cycles of a wavelet (e.g. solid trajectories; Fig. 2c). This only occurs because the analysis window in coherence analysis is a single temporal sample (here 0.2 ns); semblance, with its longer analysis window, would not resolve such individual contributions to the overall response. As such, a coherence pick gives the travel time of the GPR wavelet along an individual half-cycle and furthermore allows the delay between that half-cycle and first break to be estimated. In Figure 2b, both picks correspond to the second response within a package of coherence peaks, suggesting that they both pertain to the second half-cycle of the GPR wavelet. Assuming that wavelet period T is constant with offset (valid given the low GPR attenuation rate in snow; Reference Kruetzmann, Rack, McDonald and GeorgeKruetzmann and others, 2011), the lag Δt between its first break and the peak of its nth half-cycle is
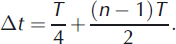
Consequently, subtracting 3/4T from these coherence-derived reflection trajectories leads to a better approximation of first-break travel times and hence improved velocity accuracy. Wavelet period can also be estimated directly from the coherence panel, since the responses to two half-cycles are separated by T/2 (1.20 and 0.85 ns, respectively, for the upper and lower events in Fig. 2b).
The dashed curves in Figure 2c are the approximations to first-break travel times following the application of -3/4T time shifts to the coherence-derived trajectories. The corresponding travel times are then substituted into t 2–x 2 analysis, with output velocities more representative of those expressed by first breaks (Reference Booth, Clark and MurrayBooth and others, 2010). The application of zero-phase deconvolution to our data (e.g. Reference Schmelzbach, Tronicke and DietrichSchmelzbach and others, 2012) would negate the application of time shifts (i.e. peak wavelet amplitude would coincide with first break), but our procedure is essentially a coherence-based approach to wavelet estimation that is nonetheless efficient and effective.
All coherence-derived GPR velocities, and the parameters relevant to this procedure, are listed in Table 1. Following the substitution of these models into Dix’s equation, depths of 0.76 ± 0 . 0 2 and 1.71 ± 0.03 m are estimated for the two horizons; note also that the corrected travel times are no longer suggestive of a primary-multiple relationship between the two events. Uncertainties are based on the resolution of coherence responses evaluated using a Monte Carlo simulation (Reference Booth, Clark and MurrayBooth and others, 2011).
Velocity–depth model derived from analysis of GPR CMP gather (Fig. 2). Coherence picks are obtained directly from the coherence panel (Fig. 2c), whereas shifted picks are obtained after the application of time corrections (=–3=4T). Interval velocities are estimated by substituting shifted picks into Dix’s equation (Reference DixDix, 1955)

2.2. Seismic refraction data
Our refraction survey comprised a spread of 24 vertical-component 10 Hz geophones pressed into a fresh snow surface and then covered with loose snow to dampen wind noise and shot-generated airwaves. Geophones were installed at 0.5 m intervals (giving a spread length of 11.5 m) and data were recorded on a Geometrics GEODE system. The seismic source was a 14 kg sledgehammer impacting a 0.5 m x 0.5 m plastic plate and we triggered the recording system using a piezoelectric sensor mounted on the hammer shaft. We recorded two shot gathers, with the source placed at the first and then at the last geophone location.
Seismic refraction data (Fig. 3a and b) show good signal-to-noise ratio and impulsive first breaks at almost all geophones. The derivation of a velocity model from seismic refraction data requires direct- and refracted-wave travel times to be identified. Travel-time picks for both records show a change in the gradient of first-break picks at ∼5m offset. First breaks are interpreted as direct waves for the first 4.5 m offset and as the first refraction thereafter. The GPR data (Fig. 2) show negligible dip at the base of the snow cover, hence we consider only one-dimensional variation in seismic velocity.
(a, b) Seismic refraction data and (c) travel-time analysis. Travel-time picks (triangles in (a) and (b), circles in (c)) correspond to direct waves across the first 4.5 m of the spread and to the first refraction thereafter. The geophone installed at 4 m (grey trace) consistently records noisy data, hence it is excluded from this analysis. Direct-wave intercept times are negative in (c), implying a time delay in the system trigger. The inverse slope of each straight line gives the apparent velocity expressed by the first breaks.
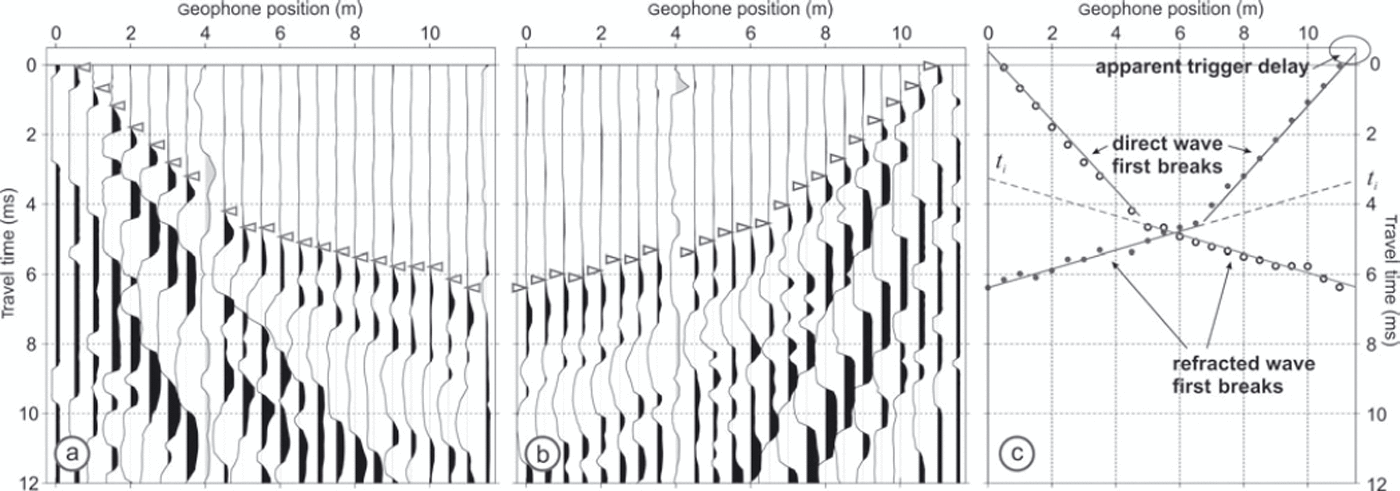
Figure 3c shows the best-fit linear trends to direct- and refracted-wave travel times. In each record, the zero-offset direct wave has a small negative intercept time (–0.41 and –0.35 ms). This is attributed to a trigger error, representing the time taken for the switch inside the piezoelectric sensor to close, although non-causality introduced by the recording system is an additional possibility. In any case, the trigger error does not adversely impact our first-break picking and is removed prior to depth estimation.
The velocity of the direct wave v 1 is simply estimated using the linear relationship

where Δx and Δt are the ranges of offset and travel time, respectively, over which the direct wave is observed. Prompted by the expected density gradient in the snowpack, we explored fitting power-law and linear velocity-depth functions (Reference CoxCox, 1999) to direct-wave travel times, but the extra complexity was unjustified since the observed velocity gradient was negligible.
The velocity of the refracted wave v2 is also established using Eqn (2), and the depth d to the refracting interface is

where ti is the intercept time of the refraction trend on the zero-offset trace (e.g. ≈ 3.3ms on the right-hand side of Fig. 3c). Trigger errors are removed by adding the relevant absolute delay to each ti prior to substitution into Eqn (2).
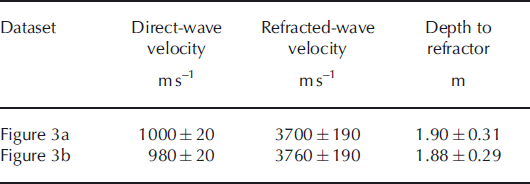
The two refraction-shot gathers give consistent velocity models (Table 2), with direct-wave velocity 1000 ± 20 m s–1 and snow thickness ≈ 1.90±0.3m. The mean inverse slowness expressed by slopes of the refracted arrival is 3730 ± 190 m s–1. The uncertainty in each quantity is derived from the standard error in the least-squares straight-line fitting, with the possible range of velocities used to establish the range of depth uncertainty. The maximum depth observed in the GPR (1.71 ± 0 . 0 3 m) is consistent with the depth of the seismic refracting layer, at least within the broader uncertainty bounds of the latter.
Velocity–depth model derived from analysis of two seismic refraction datasets (Fig. 3)
4. Comparison with Observed Snow Depth
Encouragingly, seismic refraction and GPR methods indicate an interface at similar depth and we now compare this with the snow depth recorded in the snow pit. The pit was dug into undisturbed snow ∼10m south of the midpoint of the GPR CMP gather (67°54.150’ N, 18°34.360’E; Fig. 1). We do not expect that snow thickness will vary greatly between the two measurement points, since no discontinuities on this spatial scale were seen anywhere in the GPR CO profile.
Figure 4 shows the variation of density with depth recorded in the snow pit together with representations of the depth models derived from the geophysical surveys (in Fig. 4 the uncertainty in each velocity and depth is represented by the line thickness). Density measurements were made in the field from snow cores extracted at 5 cm intervals from the vertical wall of the pit. There is the expected increase of density with depth, although the maximum value (500 kgm–3) is observed 0.15 m from the base of the pit (density comparisons are revisited in Section 5). The snow is 1.73 m thick and an ice lens (0.05-0.10 m thick) is observed at its base; the pit terminates 1.83 m below the surface on depth hoar.
(a) Variation of density with depth in the snowpack and (b, c) velocity–depth models derived from (b) GPR and (c) seismic velocity–depth models for comparison. In (b) and (c), the thickness of the black and grey bars represents the uncertainty in velocity and depth, respectively (transparency increases towards the edge of the precision range). The GPR accurately represents density transitions, although strong fluctuations towards the base of the snowpack are not recovered. For the seismic dataset, the estimate of the snow thickness is accurate within the precision range. The seismic direct wave is assumed to sample to 1.4 m depth, hence the shallower seismic velocity trend is dashed between 1.4 and 1.7 m.
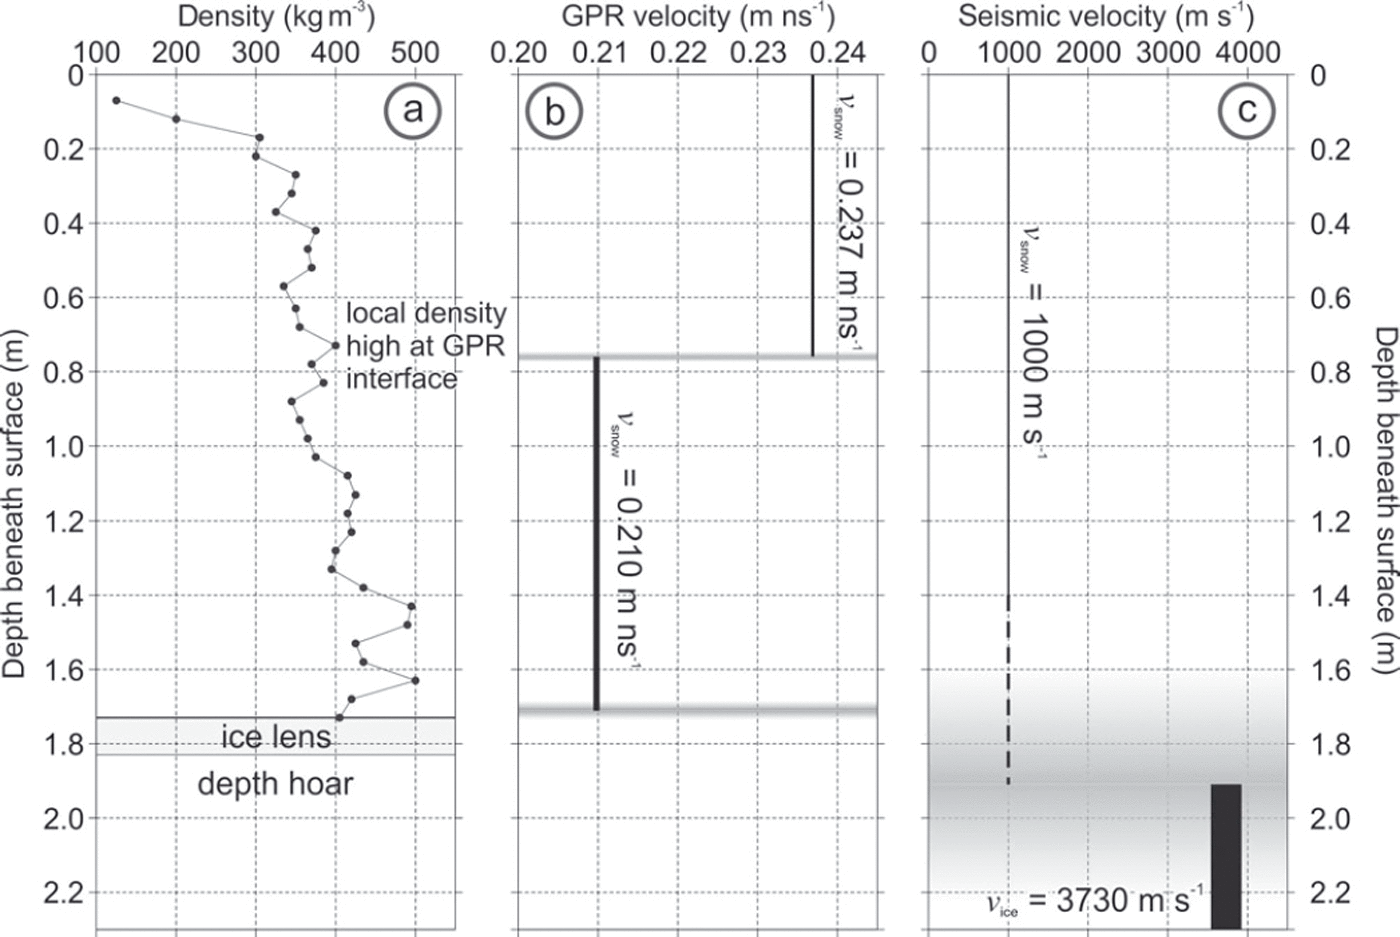
The GPR velocity model gives a very accurate estimate of the thickness of the snowpack, and depths agree within the radar precision range. The internal snowpack reflector correlates very well with a zone of increased density (∼50kgm–3) observed between 0.73 and 0.83 m. No reflection from the base of the ice lens is observed, unsurprising since its 0.1 m thickness is below the resolution of a 500 MHz wavelet travelling at any plausible velocity for ice.
The depth of the seismic refraction is consistent with that of the depth hoar (overestimated by 0.07 m), at least within the precision of the former. The velocity that the refracted wavelets express, ∼3730ms–1, is typical for slightly porous glacier ice (as observed for the uppermost ice at Storglaciaren by Reference Gusmeroi, Murray, Jansson, Petterson, Aschwanden and BoothGusmeroli and others, 2010), hence the refraction could also originate from glacier ice beneath the depth hoar. Note that the snow is shown as a dashed line beyond 1.4 m depth given considerations to the Fresnel volume of the seismic wavelet, as explained in Section 5.
5. Comparison with Observed Snow Density
As with depth, density is derived from wavelet velocity. We consider the experimental error in our velocity analysis to be small since our depth estimates are consistent, although allocating (at most) two velocities to the snowpack is probably an over-simplification of its fine-scale structure (e.g. Reference Bradford, Harper and BrownBradford and others, 2009). Therefore, we test how well our surveys characterize the first-order properties of the snow-pack, rather than replicating its detailed density structure.
Velocity is usually converted to density via mixing models (e.g. Reference RiznichenkoRiznichenko, 1949; Reference LooyengaLooyenga, 1965; Reference Topp, Davis and AnnanTopp and others, 1980; Reference Endres, Murray, Booth and WestEndres and others, 2009) or empirically defined relationships (e.g. Reference Wyllie, Gregory and GardnerWyllie and others, 1956; Reference KohnenKohnen, 1972; Reference Gardner, Gardner and GregoryGardner and others, 1974; Reference Tiuri, Sihvola, Nyfors and HallikainenTiuri and others, 1984; Reference Sihvola, Nyfors and TiuriSihvola and others, 1985; Reference Fortin and FortierFortin and Fortier, 2001). A further source of error is introduced by such an approach, since an assumption made in formulating a mixing model or in assigning an experimental variable may be invalid at Storglaciaren. We therefore investigate a range of widely used relationships between velocity and density. It should be noted that we do not advocate one method over another, but highlight the importance of acknowledging the site-specific variability in snow properties. The density estimate derived from each model is recorded in Table 3.
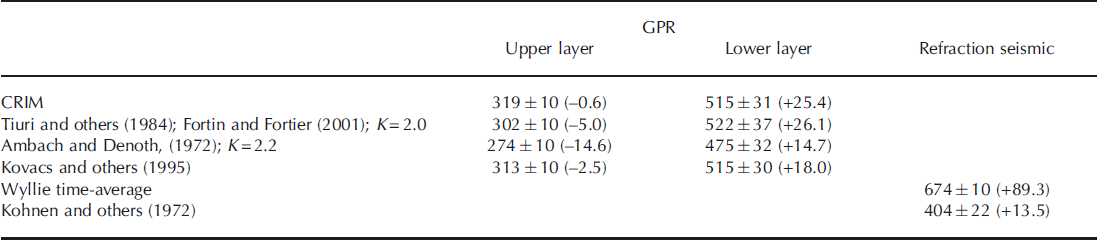
Snow density (kg m–3) as estimated from GPR and seismic velocities using different mixing models (CRIM and Wyllie time-average) and empirical relationships. Upper-layer values relate to the depth interval 0-0.76 m, in which the reference density is 321 ±74kgm–3; lower-layer values relate to the depth interval 0.76-1.71 m, in which the reference density is 414 ±44 kg m–3 Refraction seismic values relate to the depth interval 0-1.4 m, in which the refernce density is 356 ±44 kg m–3. Values in square brackets show the percentage difference between measured and reference densities
5.1. GPR density derivation
The velocity of a GPR wavelet through porous material is implicitly related to its density. Velocity is explicitly sensitive to the dielectric permittivity of a material, although changes to the porosity in that material influence both the bulk dielectric permittivity and density (e.g. Reference Sihvola, Nyfors and TiuriSihvola and others, 1985). For snow, air-filled porosity causes both dielectric permittivity and density to decrease, whereas water-filled porosity causes them both to increase. Throughout this analysis, we assume that pore spaces in the snowpack are completely filled with air and, as such, snow can be described as a two-phase ice/air mixture.
We also assume that by allocating a single GPR velocity to each layer we observe, the density we estimate is the average of the densities recorded therein. The average ground-truth density recorded within the upper and lower GPR intervals is therefore 321 ±74 and 414±44kgm–3, respectively (the uncertainties are the standard deviation in each depth range).
We first estimate density using the complex refractive index method (CRIM), which is a basic but widely applied mixing model (e.g. Reference Roth, Schulin, Flühler and AttingerRoth and others, 1990; Reference Huisman, Hubbard, Redman and AnnanHuisman and others, 2003). Reference Harper and BradfordHarper and Bradford (2003) formulate a CRIM relationship to link the observed snow velocity v snow to snow density psnow:
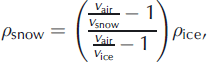
where pice is ice density and v air and v ice are GPR velocities through air (=0.300 m ns–1) and ice, respectively. At Storglaciaren, Reference Gusmeroi, Murray, Jansson, Petterson, Aschwanden and BoothGusmeroli and others (2010) use pice = 917 kgm–3 and measure v ice ≈ 0.17mns–1 for the uppermost glacier ice. Table 3 shows psnow values estimated by Eqn (4). The density of the upper layer is clearly well characterized (difference of -0.6%), whereas that of the lower layer is less accurate (difference of +25.4%).
Reference Fortin and FortierFortin and Fortier (2001) present a series of empirical relationships (Reference Ambach and DenothAmbach and Denoth, 1972; Reference Tiuri, Sihvola, Nyfors and HallikainenTiuri and others, 1984) that express density in terms of relative dielectric permittivity of snow r snow of the form

where K is a constant of proportionality, experimentally determined to be 2.0 (Reference Tiuri, Sihvola, Nyfors and HallikainenTiuri and others, 1984; Reference Fortin and FortierFortin and Fortier, 2001) or 2.2 (Reference Ambach and DenothAmbach and Denoth, 1972), with psnow expressed in gcm-3. Treating snow as a two-phase mixture between air and ice, the only control on bulk dielectric permittivity is the amount of snow within a given volume, since
r
for air is 1 and its density is negligible. Assuming low-loss GPR propagation (i.e. that electrical conductivity is negligible),
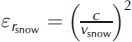 with c=0.300mns-1, Eqn (5) is rearranged as
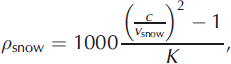
with the factor of 1000 introduced to express density in kgm–3. Table 3 shows psnow for K=2.0 and 2.2 for each layer. In the best cases, the lower K provides a good density match in the upper layer (-5% difference), whereas the higher K improves the match in the lower layer (+14.7% difference). Reference Fortin and FortierFortin and Fortier (2001) note that their experimental data have a high degree of scatter, hence K may be poorly constrained, and different values could be appropriate in the two layers of the snowpack, potentially warranting a site-specific study.
Finally, we consider the empirical relationship described in Reference Kovacs, Gow and MoreyKovacs and others (1995), which states that

with the same underlying assumption as the previous relationship. Again, we express ε r snow in terms of v snow and rearrange for psnow, and show densities in Table 3. The density of the upper layer is better characterized than that of the lower layer (differences of -2.5% and +18.0%, respectively, with respect to reference densities).
5.2. Seismic-derived densities
The velocity of a seismic wavelet is explicitly related to the density of a material, since density appears in the equation for seismic velocity (Reference Sheriff and GeldartSheriff and Geldart, 1999). Consequently, seismic velocity may be explicitly linked to density variations, although mixing models and empirical relationships remain commonplace due to complicating factors including pore fraction, connectivity and fluid material (e.g. Reference Gardner, Gardner and GregoryGardner and others, 1974; Reference Mavko, Mukerji and DvorkinMavko and others, 2009).
As with the GPR interpretation, the depth range over which our seismic velocity estimate averages density should be appreciated. Reference Spetzler and SniederSpetzler and Snieder (2004) define the ‘Fresnel volume’ as the finite volume around a geometric ray path that influences the propagation of a band-limited wavelet. The radius r of the Fresnel volume is:
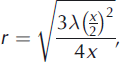
where λ is the seismic wavelength and x is the offset at which the wavelet is recorded. For a direct wave, the Fresnel radius is therefore the deepest position in the subsurface that can influence the recorded wavelet (Reference Gusmeroi, Murray, Jansson, Petterson, Aschwanden and BoothGusmeroli and others, 2010), although Reference Sheriff and GeldartSheriff and Geldart (1999) state that significant contributions probably only arise within a radius
 . We measure direct-wave velocities to a maximum offset of 4.5 m, and the wavelength of our seismic pulse is ∼4.4m (frequency 225 Hz, propagating at 1000 ms-1); the radius of the Fresnel volume therefore increases from 0.45 m when observed at 0.5 m offset, to 1.4 m at maximum offset. We therefore expect that the direct wave will average the physical properties of the top 1.4 m of the snowpack (hence the dashed line for depth will exceed 1.4 m in Fig. 4c), and the average density observed in this range is 356 ± 6 6 kgm-3.
We first compare a density estimate made using the Wyllie time-average equation (analogous to the CRIM relationship in Eqn (4)), which states
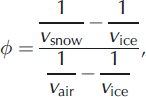
where is fractional porosity (Reference Wyllie, Gregory and GardnerWyllie and others, 1956). Values of v air = 330ms-1, v snow = 1 0 0 0 ± 2 0 ms-1 and v ice = 3 7 3 0 ± 190ms-1 are substituted into Eqn (9), and a fractional porosity of 0.265 (i.e. 26.5%) is obtained. Since the density of air is negligible, snow density is then simply approximated as psnow = (1-Φ)pice=674kgm-3 (assuming again that pice = 917 kg m-3; Reference Gusmeroi, Murray, Jansson, Petterson, Aschwanden and BoothGusmeroli and others, 2010). This value is almost double that measured in the snow pit (Table 3). We suggest that this mismatch arises because such CRIM- and Wyllie-type mixing models assume that there is a continuum between highly porous snow and non-porous glacier ice such that v snow=v ice when all the air-filled pore spaces are removed. While this is appropriate for GPR velocity, it is inappropriate for the seismic case since snow undergoes further densification before becoming ice. As such, our measured v ice is inappropriate in this context. The same assumptions are made in the mixing model of Reference RiznichenkoRiznichenko (1949), hence we do not explore its application here.
Compared with the GPR case, there are few empirical relationships defined for evaluating snow density from seismic velocity. One such relationship between P-wave velocity and density is proposed by Reference KohnenKohnen (1972), and has been used in several firn and ice settings (e.g. Reference King and JarvisKing and Jarvis, 2007; Reference Rege and GodioRege and Godio, 2011). The relationship states

where p z and vz are the density and seismic velocity at depth z, and is more appropriately defined for seismic velocities in ice. We substitute v snow= vz= 1 0 0 0±20 ms-1 and obtain a better estimate of the reference snow density (+13% difference; see Table 3).
Other relationships between P-wave velocity and density exist (e.g. Reference Gardner, Gardner and GregoryGardner and others, 1974; Reference Castagna, Batzle and EastwoodCastagna and others, 1985) but are typically established for water-saturated rocks rather than unconsolidated sediment that may serve as an analogue for snow. For example, the system of empirical relationships determined by Reference CarrollCarroll (1969) was derived for rocks with densities between 1600 and 2700 kgm-3 (Reference Wadhwa, Ghosh and Subba RaoWadhwa and others, 2010), much higher than the values observed in our snow pit. When density relationships are derived for unconsolidated material (e.g. Reference PrasadPrasad, 2002; Reference Zimmer, Prasad, Mavko and NurZimmer and others, 2007), they are more generally established in terms of a combination of P-wave and S-wave (shear wave) information (Reference King and JarvisKing and Jarvis, 2007; Reference Bradford, Nichols, Mikesell, Harper and HumphreyBradford and others, 2008; Reference Tsoflias, Ivanov, Anandakrishnan, Horgan and PetersTsoflias and others, 2010). S-waves are insensitive to pore fluid (Reference Mavko, Mukerji and DvorkinMavko and others, 2009), hence the properties they perceive pertain only to the grains (or, in our case, the snow crystals). In contrast, P-waves perceive the bulk density of the whole medium and are therefore sensitively affected by changes in pore fluid (i.e. residual liquid water in the snow could be erroneously interpreted as a high-density anomaly in the snow cover). The most representative characterizations of snow density therefore include both P- and S-wave velocity information (Reference King and JarvisKing and Jarvis, 2007; Reference Tsoflias, Ivanov, Anandakrishnan, Horgan and PetersTsoflias and others, 2010).
For our data, the requisite S-wave information could be inferred from multi-channel analysis of surface waves (MASW) (Reference Tsoflias, Ivanov, Anandakrishnan, Horgan and PetersTsoflias and others, 2010), which would facilitate analytic (rather than empirical) derivation of physical properties. However, given that our refraction experiment was designed for recording P-waves, surface wave amplitudes are clipped and it is impossible to determine the amplitude of individual frequency components, a fundamental step in implementing MASW. However, clipping is not widespread in the larger seismic acquisition and this approach could be explored in future research.
6. Discussion
In these analyses, we attempted to recover accurate estimates of snow thickness and snow density independently of ground-truth values observed in a co-located snow pit. The more successful of these analyses was the estimation of thickness, specifically from the GPR data: the estimated and observed snow thicknesses agreed to within centimetres. The thickness derived from the seismic data was also consistent with the ground-truth observation although rather less precise than the GPR estimate (expected given the wavelengths involved: ∼4.4 and ∼0.4m in the seismic and GPR cases, respectively).
For the upper layer of the GPR model, all but one of the derivation methods we apply delivers snow density accurate to within ±5%. However, the accuracy for the lower layer is much worse and density is consistently overestimated. For characterizing the bulk properties of the snowpack, our preferred method is therefore refraction seismic: there is overlap between the precision range of the observed and seismic-derived estimate of density, even if it is biased to slightly higher values. However, the discrepancies between the observed and estimated snow properties point towards some significant sources of error in these analyses.
First, we greatly simplify wavelet propagation through the snowpack. In the GPR case, we assume implicitly that the variation of travel time with offset is hyperbolic. While the effects of this are clearly small enough to have no significant impact on our depth conversion, the potential for error is greater in the nonlinear relationship between velocity and density. There are strong density fluctuations (amplitude ∼10 kg m–3) in the deepest 0.2 m of the snow pit (Fig. 4a) and this is likely to introduce strong non-hyperbolic moveout into travel times (e.g. Reference BradfordBradford, 2002), specifically causing GPR rays to refract closer to the vertical given the progressive decrease in velocity (Reference Becht, Appel and DietrichBecht and others, 2006). Conventional hyperbolic velocity analysis, even with the corrections applied here, is therefore unlikely to describe the reflection travel time adequately and a higher-order travel-time description is required (e.g. Reference Grechka and TsvankinGrechka and Tsvankin, 1998). Failing this, the offset range of the CMP gather could be restricted such that it does not exceed the depth of the target reflector (i.e. honouring the short-spread approximation; Reference Taner and KoehlerTaner and Koehler, 1969), but non-hyperbolic moveout terms not be completely eliminated and the resolution of the coherence analysis would be adversely affected (Reference Booth, Clark and MurrayBooth and others, 2011). These issues could be overcome using the ray-based modelling approach of Reference Brown, Bradford, Harper, Pfeffer, Humphrey and Mosley-ThompsonBrown and others (2012), where a best-fit velocity model is obtained for numerous CMP-derived velocity functions, although the accuracy of associated density estimates still depends on the suitability of a mixing model (see next paragraph). Seismic travel-time analysis should strictly consider curving ray paths, although we determined that this was not significant for the data interpreted here.
Second, our analysis shows the need to appreciate the suitability of an empirical relationship before applying it to density derivation. We make no suggestion that our observations invalidate the established models, but instead highlight the requirement either for the derivation of site-specific empirical relationships or for ground-truth control in geophysical analysis. As a minimum, a range of empirical relationships should be explored such that the experimental variability between them can be appreciated. We note that empirical velocity–density relationships have also been applied in the opposite sense to our approach (i.e. where a ground-truth density is used to calibrate GPR velocity; Reference Dunse, Schuler, Hagen, Eiken, Brandt and HøgdaDunse and others, 2009) and we would recommend equivalent caution in such cases.
Finally, we neglect in these models the possibility of a multiphase pore fluid (i.e. both air and liquid water within pore spaces) (Reference Bradford, Harper and BrownBradford and others, 2009). While it is trivial to add a water-phase term into either the CRIM or Wyllie time-average equations, each of the empirical relationships used here assumes that the snowpack is described by a snow–air blend. In the GPR case, the effect of liquid water would be to reduce the propagation velocity, leading to an overestimate of density. In the seismic case, there is a highly nonlinear relationship between velocity and water saturation, hence the net effect on a density estimate is difficult to predict (Reference BradfordBradford, 2010); nonetheless, the most accurate density estimates would also consider liquid water in the snowpack.
We therefore consider that geophysical methods can complement mass-balance measurements, but should not be applied without ground-truth measurement. The efficiency of GPR acquisitions suggests that they could be effectively applied to tie together thickness estimates made in a sparse array of snow pits (e.g. Reference Machguth, Eisen, Paul and HoelzleMachguth and others, 2006), although the benefit of acquiring CMP gathers for velocity control is also clear when considering the resulting accuracy of depth conversions. The additional depth control would therefore serve to improve the glacier-wide interpolation of mass-balance measurements or to extend the observations into areas of particularly sparse control. Seismic acquisitions are much less efficient than GPR, but may provide better density estimates given that GPR velocity is further removed from density. The use of MASW may represent an analytic means of measuring snow properties and we speculate that the ‘optimal’ survey design could be sparse MASW acquisitions that are tied to GPR profiles for extrapolating properties. However, for the datasets interpreted here, reliable density estimates would require validated mixing models and/or empirical relationships.
7. Conclusions
Geophysical acquisition can provide a good complement to a campaign of winter mass-balance measurements, but not without the control of ground-truth data. However, the accuracy of thickness estimates from GPR is encouraging and the method could provide valuable control for spatial interpolations between snow-pit sites or in areas of sparse control, particularly since GPR acquisition is efficient. The measurement of density from either seismic or radar wavelet velocity should be considered a first-order estimate if survey design is not optimized for density measurement and/or the method of converting velocity to density is not calibrated. The most useful complement could therefore be a dense network of GPR profiles tied into seismic and/or GPR surveys that are specifically designed for density measurement.
Acknowledgements
Adam Booth received support from the GLIMPSE project, funded by the Leverhulme Trust, and the Climate Change Consortium of Wales (C3W). Charlotte Axtell is sponsored by the Natural Environment Research Council of the UK (grant NE/J500367/1). The research leading to these results has received funding from INTERACT (grant agreement No. 262693), under the European Community’s Seventh Framework Programme. We are grateful to Gunhild Rosqvist and all the crew at Tarfala research station for logistical support during field acquisition. Allen Pope assisted with field acquisition, and data provided by the Parallel Ice Sheet Model (PISM) scheme, via Andy Aschwanden, were invaluable in designing the seismic survey. Base maps were provided by Alessio Gusmeroli. Mike Batzle provided insight into seismic mixing models. The manuscript was greatly improved by comments from two anonymous reviewers plus those of John Bradford as an editor.



