


Non-technical Summary
The concept of punctuated equilibria proposes that species do not exhibit much net change in morphology for most of their evolutionary history, but lineages commonly exhibit more change in association with speciation. While tests for changes in morphology within evolutionary lineages have been common in the scientific literature, relatively little attention has been paid to whether most species-level morphologies originate through branching (cladogenesis) or changes not associated with lineage splitting (anagenesis). Here we examine the importance of this distinction (known as evolutionary mode) and test how common each mode is for species origins in a sampling of recent species-level trees of fossil groups. We find the majority of fossil species to have originated through lineage splitting, consistent with the pattern of punctuated equilibria.
“When smart people don’t ‘get it,’ one must conclude that the argument lies outside whatever ‘conceptual space’ they maintain for assessing novel ideas in a given area.”
Stephen Jay Gould, The Structure of Evolutionary Theory
Introduction
To read much of the modern literature on punctuated equilibria (PE) is in some ways to encounter a world of seemingly alternative facts and definitions. On the one hand, many paleontologists (and some neontologists) are convinced that PE is not just well supported but important or even central to an adequate understanding of macroevolution (e.g., Eldredge and Gould Reference Eldredge, Gould and Schopf1972; Gould and Eldredge Reference Gould and Eldredge1977; Raup and Stanley Reference Raup and Stanley1978; Stanley Reference Stanley1979; Jackson and Cheetham Reference Jackson and Cheetham1999; Gould Reference Gould2002; Geary Reference Geary, Allmon, Kelley and Ross2009; Eldredge Reference Eldredge, Stephen, Danieli, Minelli and Pievani2013, Reference Eldredge2015; Prothero Reference Prothero2013: pp. 105–106; Lieberman and Eldredge Reference Lieberman and Eldredge2014; Serrelli and Gontier Reference Serrelli and Gontier2015; Eldredge et al. Reference Eldredge, Pievani, Serrelli and Temkin2016; Emlen and Zimmer Reference Emlen and Zimmer2020: pp. 522–524; and papers in this issue). On the other hand, there are many respected evolutionary biologists by whom PE is variously described as “dead” (Coyne Reference Coyne2021), “not widely accepted” (Futuyma and Kirkpatrick Reference Futuyma and Kirkpatrick2023: p. 535), “an idea with little support from empirical fossil data” (Rolland et al. Reference Rolland, Henao-Diaz, Doebeli, Germain, Harmon, Knowles and Liow2023: p. 1187), or at best, “an interesting hypothesis” with “some theoretical appeal, although as a limited rather than absolute generalization (because exceptions are known)” (Ridley Reference Ridley1996: p. 567). We have both noticed this widely in university biology departments for many years, especially in institutions where paleontology is not a major presence. PE is frequently not mentioned at all in general undergraduate evolution classes or graduate courses, and if it is, it is often inaccurately described or disparaged. If they hear about it at all, undergraduates in particular are likely being told that it is incorrect or no longer considered important, or just not to worry about it. Strikingly, in some cases, PE is presented as ambiguously or not well supported, but then macroevolutionary trends are discussed in a manner that appears to assume PE is the most common pattern observed when paleontologists document explorations of morphospace by clades over deep time (e.g., Bergstrom and Dugatkin Reference Bergstrom and Dugatkin2023: pp. 566–572). It has also been claimed that the use of the term PE has declined in recent years (Bokma Reference Bokma2008; O’Brien et al. Reference O’Brien, Valverde, Duran-Nebreda, Vidiella and Bentley2023), “perhaps because the theory’s acceptance declined or interest in it declined (or both),” or alternatively, “that the theory’s overall acceptance into the prevailing paradigm eventually reduced the need to call it out by name” (O’Brien et al. Reference O’Brien, Valverde, Duran-Nebreda, Vidiella and Bentley2023: p. 3). It is possible that the majority of evolutionary biologists fall somewhere along a continuum between the two extremes of completely rejecting or completely accepting PE (e.g., Stearns and Hoekstra Reference Stearns and Hoekstra2005: pp. 433–434; Barton et al. Reference Barton, Briggs, Eisen, Goldstein and Patel2007: p. 280; Freeman and Herron Reference Freeman and Herron2007: pp. 704–709; Benton and Harper Reference Benton and Harper2009: pp. 122–128; Hunt and Rabosky Reference Hunt and Rabosky2014; Rolland et al. Reference Rolland, Henao-Diaz, Doebeli, Germain, Harmon, Knowles and Liow2023). Even if this is true, the disparity of current views is still noteworthy.
This situation clearly has multiple origins (see, e.g., Ruse Reference Ruse1989, Reference Ruse, Machamer, Pera and Baltas2000, Reference Ruse, Sepkoski and Ruse2009; Gould Reference Gould2002; Allmon Reference Allmon, Allmon, Kelley and Ross2009; Geary Reference Geary, Allmon, Kelley and Ross2009; Sepkoski Reference Sepkoski2012). Unfamiliarity with the fossil record and its issues of temporal scale and resolution are likely major factors. Different researchers also have different criteria for what they think is important. If, for example, you study red-winged blackbirds you may focus on different kinds of questions and data than if you study Devonian brachiopods. Importantly, while repeated reviews and analysis of patterns of within-lineage patterns of morphological change have demonstrated that directional changes are rare (PE’s first major claim), increasingly sophisticated statistical tests have revealed that patterns are more complex than either critics or supporters of PE previously thought (Hunt et al. Reference Hunt, Voje and Liow2025).
In this paper, we focus on PE’s second major claim, which has received comparatively less attention: that distinct morphospecies arise in pulses that occur associated with speciation. Central to any such analysis is that PE is a claim about pattern, not process (Gould and Eldredge Reference Gould and Eldredge1977; Lieberman and Eldredge Reference Lieberman and Eldredge2014). Importantly, PE’s claim that morphological change of a magnitude associated with a recognizable new species happens at branching (as opposed to accumulating gradual change within anagenetically evolving lineages) does not mean that speciation involves completely different mechanisms or processes compared with within-lineage evolution. It means that speciation is frequently the locus of fixation for morphological change. Speciation can move the axis around which variation exists in morphospace; what is special about the time period during which speciation occurs is not that speciation involves any abnormal microevolutionary process, but that during speciation, variation can be displaced to be centered around a new position in morphospace. This is the “sloshing bucket” of Eldredge (Reference Eldredge, Crutchfield and Schuster2003) and the morphological ratchet articulated by Futuyma (Reference Futuyma1987, Reference Futuyma1989), and it is at the crux of the taxic view of macroevolution (Eldredge Reference Eldredge1979, Reference Eldredge2015; Allmon Reference Allmon1994; Grantham Reference Grantham, Sepkoski and Ruse2009). Distinguishing PE from other patterns of evolution requires clearly defining and understanding both evolutionary tempo and mode (Gould and Eldredge Reference Gould and Eldredge1977; Eldredge Reference Eldredge2015). This, in turn, means understanding these terms separately and not using “tempo and mode” as an alternative phrase for any and all aspects of biological evolution (Allmon Reference Allmon, Eldredge, Pievani, Serrelli and Temkin2016a).
Tempo and Mode Revisited
Ever since the term “tempo and mode” in evolution was coined by Simpson (Reference Simpson1944), the word “tempo” has been used fairly consistently to refer to evolutionary rates of various kinds, whereas “mode” has unfortunately been used to refer to a wide variety of evolutionary patterns and processes. This usage of mode is unfortunate because Simpson clearly meant for the term to refer to topology of evolutionary relationships—whether lineages evolved with or without speciation or branching (Allmon Reference Allmon, Eldredge, Pievani, Serrelli and Temkin2016a). The three modes described by Simpson (Reference Simpson1944) were speciation (cladogenesis), phyletic evolution (anagenesis), and quantum evolution (anagenesis with rapid transition to a new state) (pp. 197–199), although Simpson also considered quantum evolution a potential component or special form of anagenesis (p. 206).
PE is about the mode (cladogenesis or anagenesis) in which new morphologies tend to arise, and how morphospace is explored. As Gould and Eldredge (Reference Gould and Eldredge1977) made clear: “Our model of punctuated equilibria is a hypothesis about mode. We claim that speciation is orders of magnitude more important than phyletic evolution as a mode of evolutionary change” (Gould and Eldredge Reference Gould and Eldredge1977, p. 116; emphasis added). Lack of specificity about the meaning of “mode” may be the source of some of the many misunderstandings of PE. Hunt (Reference Hunt2012, p. 357), for example, uses the word to refer to “the three canonical modes of evolution—directional change, random walk, and stasis,” which is not how the term “mode” was used by Simpson, or Eldredge and Gould (Reference Eldredge, Gould and Schopf1972; see Allmon Reference Allmon, Eldredge, Pievani, Serrelli and Temkin2016a).
Using the term “mode” to refer to cladogenesis as opposed to anagenesis (Fig. 1) encourages us to distinguish these two ways in which novel phenotypes can arise in evolution and to assess their relative frequency. “Mode” (sensu Simpson and Eldredge and Gould; see Allmon Reference Allmon, Eldredge, Pievani, Serrelli and Temkin2016a, Reference Allmon2017) was always meant to characterize whether cladogenesis is part of the phenomenon under study, and where mode does appear important in the history of clade evolution, it opens the door for questions about processes operating beyond the direct extrapolation of microevolution to shape higher-order patterns of diversity and disparity. It is useful, therefore, to clarify alternative terminology for common uses of mode or “tempo and mode” that cause confusion. The word “model” is useful for describing what general pattern best fits the data (from among a set of theoretical idealized potential patterns) and can be readily applied for questions examining whether the morphology of a lineage or clade is in stasis, a biased random walk/trend, or an unbiased random walk through time (a case where the word “mode” has unfortunately been frequently applied). “Model” could also refer to whether a dataset fits the hypotheses of PE (because Gould and Eldredge [Reference Gould and Eldredge1977] refer to PE as a “model”), with a “PE model” meaning (1) most morphological change is associated with cladogenesis, or (2) most morphospecies arise via cladogenesis, or (3) both tested simultaneously. A PE model would be contrasted with alternative models, such as punctuated anagenesis or gradual anagenetic change (phyletic gradualism) (Fig. 2). The word “mechanism” can be applied to processes that drive or limit morphological change or differential reproductive success of evolutionary individuals.
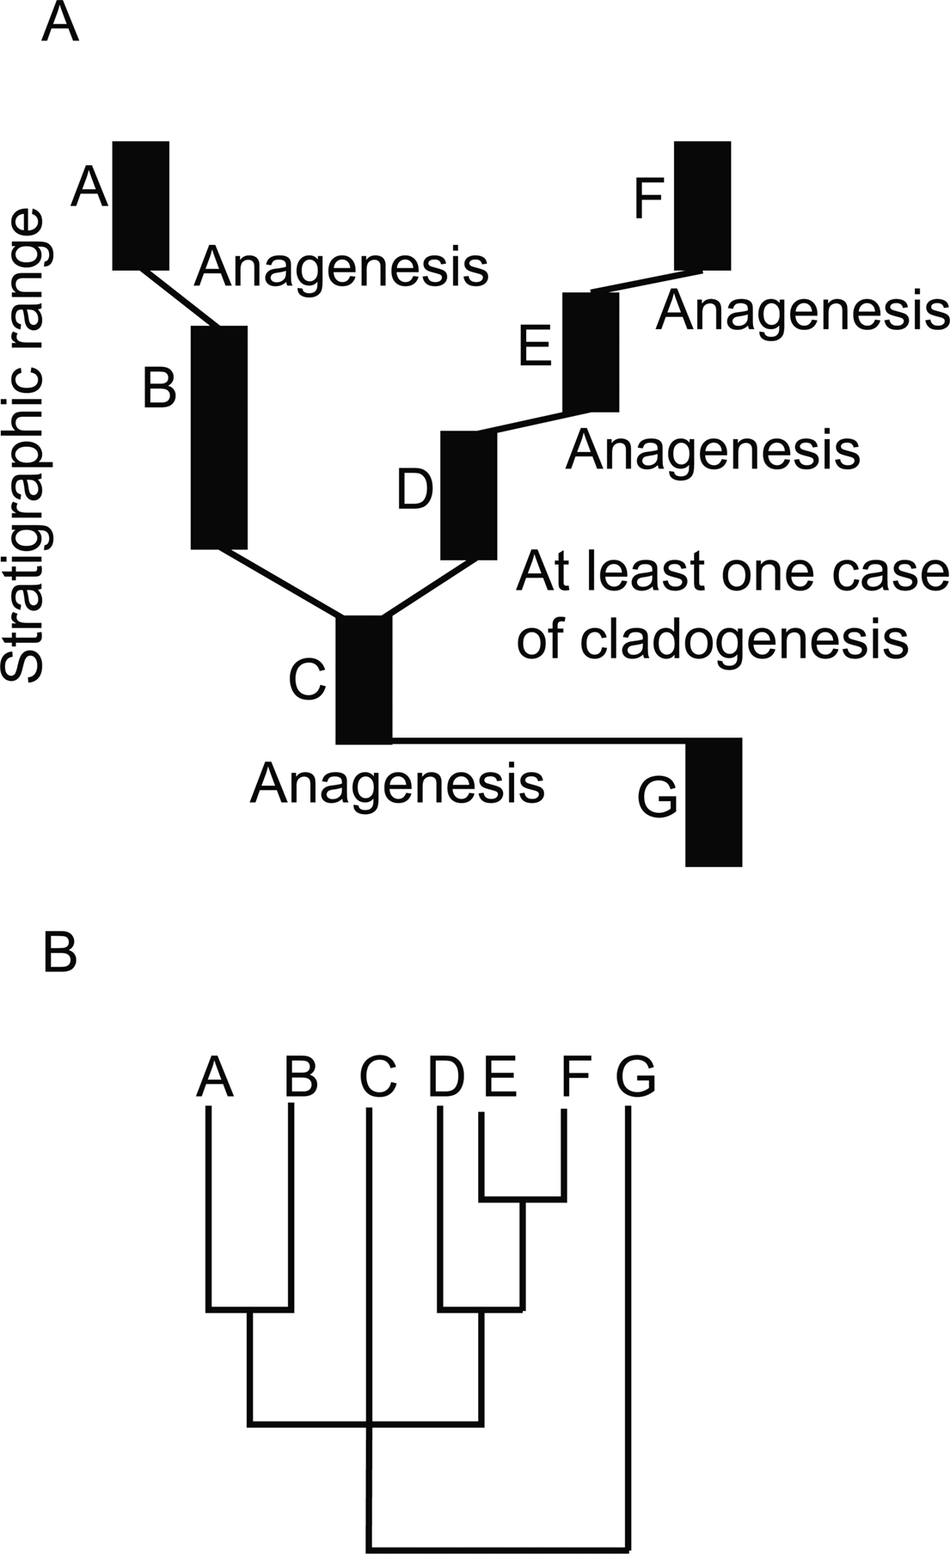
An illustration of a hypothetical fossil record where most morphospecies arose via anagenesis. A, The evolutionary history of a group as recorded in the rock record. For simplicity each species (labeled A–G) is represented as in stasis and occupying a distinct portion of morphospace. Thin black lines represent genetic connections unrecorded at the level of resolution of the fossil record. Inferred evolutionary mode is noted at the origin of each morphospecies. In this case four to five species arose by anagenesis and one to two species arose via cladogenesis. B, A cladogram corresponding to the history recorded in A. Note that if C evolved into both B and D, then the position of C in the polytomy is not a result of failure of resolution, but due to C actually being equally related to clade A–B and clade D–E–F.

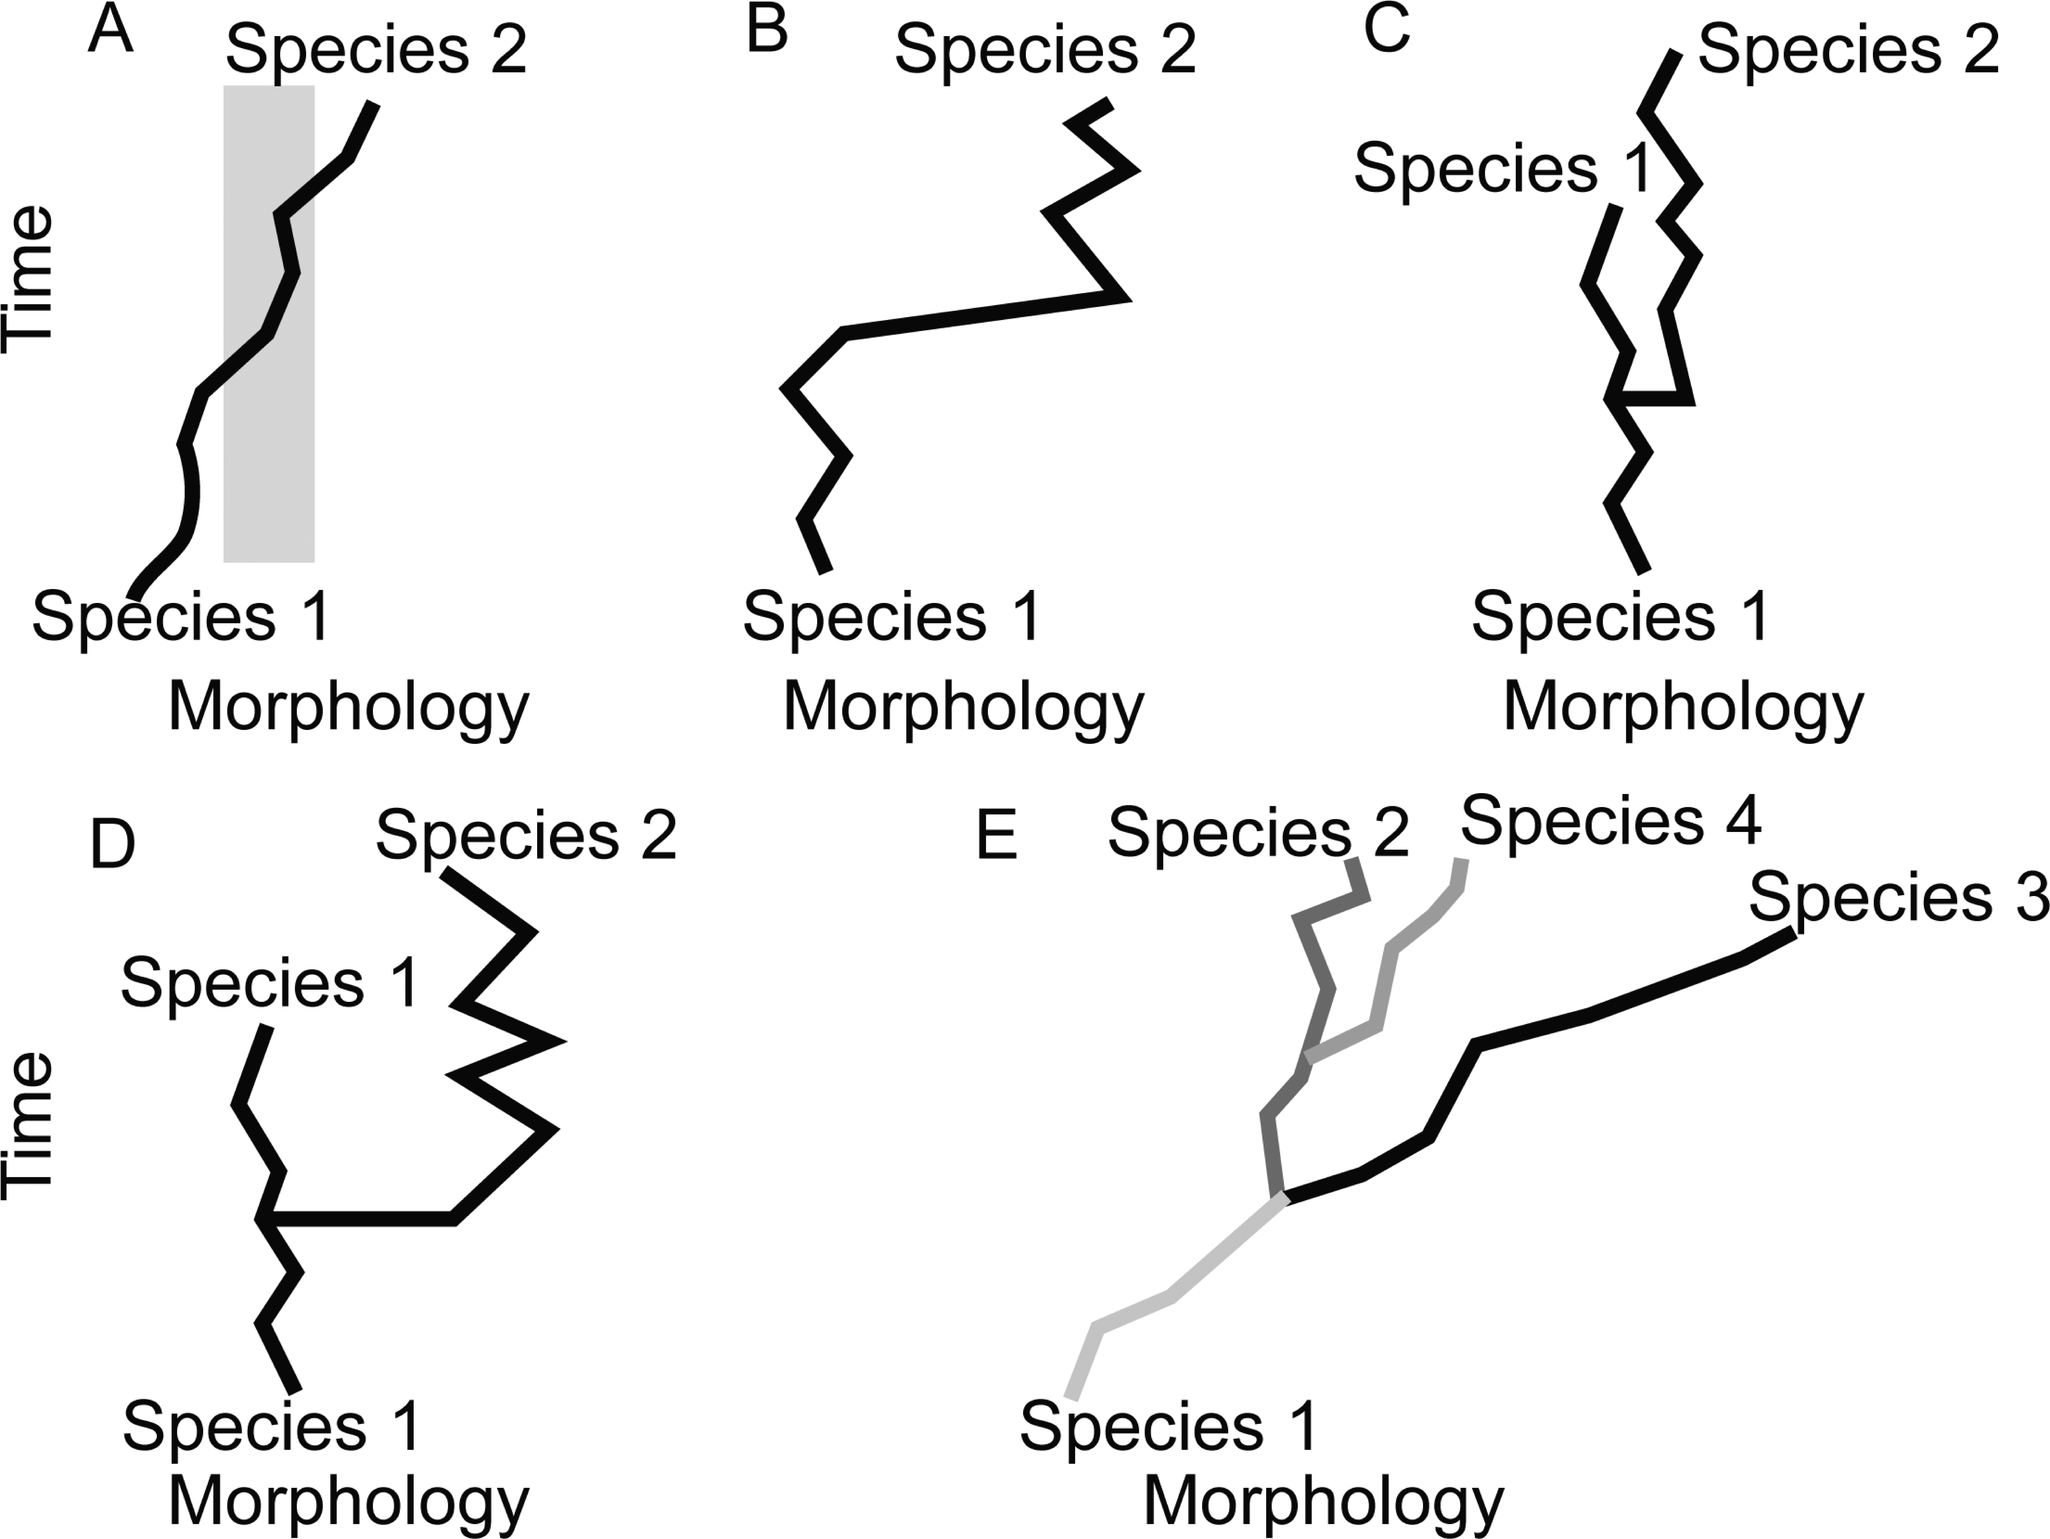
A schematic of different patterns (“models”) of tempo and mode that may be observed in the fossil record. A, Phyletic gradualism: A lineage moves through morphospace, and intermediate forms (gray) are difficult to assign to either named morphospecies at the beginning or end of the lineage’s history. B, Punctuated anagenesis: Morphospecies 1 is in stasis, then moves rapidly through morphospace to a new position that is easily distinguished and is named morphospecies 2, but no cladogenesis took place. C, Punctuated equilibria (PE): Little morphological change takes place at cladogenesis. Species 2 rapidly appears (at the level of resolution of the analysis depicted, it may appear to arise in a single time step), co-occurs in time with its ancestor, and both species do not exhibit substantial net change through their respective histories. Cladogenesis is not associated with a categorically larger step in morphospace than between time steps for either lineage during its period of stasis. D, PE: The cladogenetic event was also associated with unusually large morphological change. E, A case where cladogenesis occurs, but most morphological change in each lineage occurs independent of speciation. In this example, each species (color-coded) is distinguished by a feature other than the feature represented on the morphology axis. While species 2 may not have undergone significant displacement in morphospace through its history, species 1, 3, and 4 and the clade as a whole have consistently moved through morphospace independently of cladogenetic events. This is an example where PE is not the model that best fits the pattern observed, because stasis is not the dominant pattern of morphological evolution for each species. Instead, each species is displaced in morphospace more along its own evolutionary history than any movement in morphospace at the time of speciation.
Species in the Fossil Record
Addressing PE’s second claim also requires a clear understanding of what we mean by “species” in the fossil record. Many of the most pointed critiques of PE focus on the putative difference between “species” as recognized by neontologists and “species” as recognized by paleontologists (e.g., Levinton and Simon Reference Levinton and Simon1980; Schopf Reference Schopf1981, Reference Schopf1982; Stebbins and Ayala Reference Stebbins and Ayala1981; Charlesworth et al. Reference Charlesworth, Lande and Slatkin1982; Hoffman and Reif Reference Hoffman and Reif1990; Levinton, Reference Levinton2001: p. 312; Pennell et al. Reference Pennell, Harmon and Uyeda2014: p. 26; Hancock et al. Reference Hancock, Lehmberg and Bradburd2021: p. 1247). This is a crucial issue that paleontologists have not always addressed as forthrightly as they should have (Allmon Reference Allmon, Allmon and Yacobucci2016b). Paleontologists name species based exclusively on fossils all the time. When they do so, they are applying a purely morphological species concept, supplemented by data on geography and stratigraphy. Paleontologists do not have access to genetics, behavior, or (usually) soft part morphology. Therefore, critics insist, they cannot claim to recognize “species” with anything like the confidence of neontologists.
When they have engaged on this topic, paleontologists have traditionally done so by agreeing that they cannot usually—or ever— recognize cryptic (aka sibling) species (e.g., MacFadden Reference MacFadden1992: p. 170; Prothero Reference Prothero2013: p. 51), but also by suggesting that the frequency of cryptic species appears to be low in many cases, which would lessen their impact on evolutionary study (for the general argument, see, e.g., Eldredge Reference Eldredge1989: p. 108; Gould Reference Gould2002: p. 785; for specific examples, see Shin and Allmon Reference Shin and Allmon2023 and references therein). If these cases are representative of most taxa, the assumption is made that species in the fossil record (“morphospecies,” including extant species identified from morphology only) are generally equivalent to extant biological species (Gould Reference Gould2002; Allmon Reference Allmon, Allmon and Yacobucci2016b). If, however, cryptic species are very common, then the morphospecies of paleontology represent only minimal estimates of true biological species and speciation (MacFadden Reference MacFadden1992: p. 173; Allmon Reference Allmon, Allmon and Yacobucci2016b).
Resolving the debate on fossil species recognition, therefore, depends on improved knowledge of the actual frequency of cryptic species. Estimates of this frequency vary wildly, ranging from “the vast majority” to “very rare.” The truth is that we have very little empirical data. A recent literature survey of 465 marine shelled gastropod species (Shin and Allmon Reference Shin and Allmon2023) found that most species (70%) were not cryptic, with 30% judged as cryptic with varying degrees of confidence. About 6% were reported as cryptic sensu lato (i.e., morphologically distinguishable based on very small differences), and half of these were distinguishable by differences in the shell only (e.g., protoconch, shell sculpture). Only 2% were judged cryptic sensu stricto (no observable morphological differences at all). These results are consistent with previous narrower studies of marine gastropods (e.g., Michaux Reference Michaux1989, Reference Michaux, Lambert and Spencer1995), which have been applied to PE (Gould Reference Gould2002: pp. 786–787; for a recent update, see Gemmell et al. Reference Gemmell, Trewick, Hills and Morgan-Richards2020).
These results suggest that confidence in the fossil record of species is not completely misguided, but much more research in this area is clearly needed. In the absence of more information, paleontologists must concede that they do not know with high confidence that most of the taxa they recognize as “species” based solely on fossils were genetically distinct, reproductively isolated species similar to the biological species concept available for application in neontological research (Allmon Reference Allmon, Allmon and Yacobucci2016b). Cryptic species clearly occur in most groups of organisms, meaning that morphology and genetics are not always concordant and that some species differ genetically but not morphologically. To the degree that morphospecies are not equivalent to biological species, paleontological estimates of species and speciation are minimum estimates. This does not, however, mean that we cannot detect any branching in the record. It means we cannot see some—perhaps a lot of—branching. Indeed, a number of paleontologists have suggested that at least some, and perhaps many, fossil morphospecies are morphologically more comparable to modern species groups or genera than to individual living species defined by the biological species concept (e.g., Stanley Reference Stanley1979: p. 8; McCune Reference McCune1987: p. 3; see Allmon Reference Allmon, Allmon and Yacobucci2016b: p. 75 and references therein). In any case, while not all of the morphospecies of paleontology are equivalent to biological species, they still represent recognizable, distinguishable evolutionary lineages that often persist coherently for geologically long intervals (Allmon Reference Allmon, Allmon and Yacobucci2016b: p. 85). Additionally, the inability to document fossil cryptic species represents a bias against detection of cases of stasis, because the undetected existence of morphologically indistinguishable cryptic species would mean that multiple species maintained the same form for their stratigraphic durations rather than a single species (Struck and Cerca Reference Struck, Cerca, Monro and Mayo2022).
In summary, PE is a hypothesis about morphospecies, and the question of relative frequency of mode for evaluating PE is a is not a matter of assessing the relative frequency of absolute reproductive isolation, but rather of how different morphotypes arise in the fossil record. These morphotypes are the “endless forms most beautiful and wonderful” (Darwin Reference Darwin1859: p. 384; emphasis added) that can be recognized even without molecular data or hybridization experiments. When new forms arise, the question a PE model can potentially answer is “how did these novel, recognizable, morphotypes come into being?” PE proposes that most new forms appear through cladogenesis and that anagenetic changes are therefore of lesser importance for understanding how diversity of morphotypes arose: “The whole real guts of evolution—which is, how do you come to have horses and tigers, and things” (Waddington Reference Waddington, Moorehead and Kaplan1967: p. 14) as opposed to largely ephemeral vacillations about a relatively stable morphological mean.
Persistence of Ancestor
In this context, when we find morphological clusters of fossils in a particular temporal and spatial arrangement, we can recognize branching, or cladogenesis (Eldredge Reference Eldredge, Adrain, Edgecombe and Lieberman2001; Gould Reference Gould2002: p. 785; Allmon Reference Allmon, Eldredge, Pievani, Serrelli and Temkin2016a,Reference Allmon, Allmon and Yacobuccib, Reference Allmon2017). The pattern indicating cladogenesis is called persistence of ancestor (POA), in which in a sister pair of species, the earlier-appearing species—the putative ancestor—persists after the putative descendant appears (Fig. 2). While this term linguistically implies a more or less unchanged ancestral form, as may be predicted under cases of peripatry, the concept is used to encompass cases where cladogenesis can be established due to the co-occurrence of two or more sister species in time, even where two or more morphologically distinct species may have arisen from a common ancestor from which each is also morphologically distinct—that is all cases that are not phyletic/anagenetic transformation. Persistence of ancestor (or “ancestral survival”) is the term that has previously been applied in the literature for when the coexistence of two species requires cladogenesis to have occurred, in contrast to cases where a temporal succession of closely related species does not require cladogenesis to have occurred, as a means of determining the mode of morphospecies origination (e.g., Cheetham Reference Cheetham1986; Eldredge Reference Eldredge, Adrain, Edgecombe and Lieberman2001: p. 370; Gould Reference Gould2002: p. 840).
POA was emphasized as a crucial test for PE from the beginning (Eldredge and Gould Reference Eldredge, Gould and Schopf1972: p. 107), it has been referred to as the “surest sign” of PE (Gould Reference Gould and Milkman1982: p. 100; see also 2002: pp. 795, 840–850), and was acknowledged as of central importance in the secondary literature (e.g., Freeman and Herron Reference Freeman and Herron2007: p. 705). It is important to note that preservation can affect the perception of POA—the persisting ancestor has to be preserved (e.g., Silcox et al. Reference Silcox, Selig, Bown, Chew and Rose2021). This means, however, that an incomplete record is biased toward anagenesis. In a large test of the importance of POA, Strotz and Allen (Reference Strotz and Allen2013) applied the technique explicitly to an analysis of the relative frequencies of cladogenesis and anagenesis for planktic foraminifera, and concluded that “cladogenesis is the predominant mode by which new planktic Foraminifera taxa become established at macroevolutionary time scales” (2013: p. 2904).
Not understanding the significance of POA is, we think, at the core of a recent critique of Jackson and Cheetham’s (Reference Jackson and Cheetham1994) much-cited Metrarabdotos bryozoan study (Voje et al. Reference Voje, DiMartino and Porto2020). The authors claim that PE requires that the amount of morphological change at speciation be unusually large, but the important factors are cladogenesis and displacement in morphospace remaining distinct. While making valid statistical criticisms, they misunderstand the central role of POA in PE and therefore how to interpret data that indicate substantial stasis within each species lineage. Voje et al. (Reference Voje, DiMartino and Porto2020) still find that species co-occur with their sister lineages and that most lineages end their history in positions in morphospace relatively close to their initial position in morphospace, even when substantial variance is observed in each lineage through time (a pattern agreeing with either a random walk or stasis model). This would then uphold the expectations of PE.
Voje et al. (Reference Voje, DiMartino and Porto2020) argue that, because there is overlap in the occupation of morphospace for the traits held in common among species, and speciation is not associated with an unusually large displacement in morphospace, PE is invalidated in this case. Given the substantial influence of this study system in neontological conceptions of PE, even being cited in textbooks (e.g., Emlen and Zimmer Reference Emlen and Zimmer2020: p. 523; Bergstrom and Dugatkin Reference Bergstrom and Dugatkin2023: pp. 565, 566), this fundamental conflation of PE with the idea that speciation is always associated with accelerated change in most or all characters could have widespread detrimental impact on how neontologists view the importance of PE. We look at the same data as presented by Voje et al. (Reference Voje, DiMartino and Porto2020) and reach precisely the opposite conclusion about PE: those authors are testing an aspect that is potentially important in light of the frequent observations of PE, rather than whether the pattern observed is consistent with the core concepts of PE itself.
If PE is the dominant model followed by morphological evolution, then speciation is the locus for a clade’s exploration of morphospace. Asking whether speciation is associated with unusual acceleration in morphological change relative to the fluctuations observed while a lineage is in stasis or following a random walk model through morphospace is an interesting question, but not a relevant one for assessing whether clades explore morphospace more frequently through cladogenesis or anagenesis. In fact, it only makes sense to ask this question of speciation (whether it is potentially a time of accelerated evolutionary rate) in a context where the dominant pattern observed in a clade is one where lineages are readily identifiable through time. If most morphospecies were part of a continuum that evolved anagenetically, then we would have difficulty identifying the period of “speciation” over which to study associated rates of morphological change. At most, we could say that imperfections in the rock record caused these discontinuities in our anagenetic lineages. That is why tests of the pervasiveness of cladogenesis as a mode of evolution such as the one presented herein are critical to properly understanding the potential significance of PE.
In contrast to Voje et al.’s (Reference Voje, DiMartino and Porto2020) misunderstanding of the importance of mode to PE, Hearty and Olson (Reference Hearty and Olson2019) recently critiqued one of the two type examples of PE—the Bermudian land snail Poecilozonites—using both improved stratigraphy and a correct concept of PE. Hearty and Olson showed that with a more accurate documentation of species temporal ranges, ancestors did not persist, and therefore PE was not detected. Rather than persistence, their data instead showed that most transitions were anagenetic, without co-occurrence of potential ancestors with changes in body size in the anagenetically evolving lineages mirroring changes in available area in association with sea-level fluctuations. These changes were punctuated with periods of stasis in between events of rapid transition, but no speciation was detected. This proper conception of mode used by Hearty and Olson (Reference Hearty and Olson2019) therefore excludes this clade from being a case of PE, despite documentation of stasis and punctuational change. This example demonstrates that we are here claiming the mode component of PE is testable and that the same patterns are not observed in all clades at all times.
As many authors have noted (e.g., Fortey Reference Fortey1985, Reference Fortey1988; Geary Reference Geary1987, Reference Geary, Erwin and Anstey1995; Erwin and Anstey Reference Erwin, Anstey, Erwin and Anstey1995; Gould, Reference Gould2002: pp. 772ff., 854ff.; Barton et al. Reference Barton, Briggs, Eisen, Goldstein and Patel2009; Futuyma Reference Futuyma2009; Pievani Reference Pievani2016), the goal of macroevolutionary research is not to determine whether PE has ever been observed, but to quantify the relative frequency of the wide array of evolutionary patterns produced by the interaction among tempos and modes. As Kovaka (Reference Kovaka2021) has noted, however, relative frequency controversies may not reach a satisfactory resolution. Systematic surveys, or even explicit examination of mode in individual fossil clades are rare, perhaps in part because many paleontologists do not see the dominance of cladogenesis in their own data as surprising or controversial (although, based on our own experiences, another possibility is that mentioning implications for PE when discussing the results of a phylogenetic analysis can negatively provoke reviewers who consider PE “dead”).
In this paper, we attempt an explicit, albeit limited, assessment of the frequency of POA. We purposely have used paleontological data assembled for reasons other than to test evolutionary tempo and mode, rather than aggregating studies specifically concerned with PE. Some critics of PE have argued that, as one puts it, “It is futile to reason with taxonomic evidence” (Ridley Reference Ridley1996: p. 562), meaning that using the distribution of putative fossil species to test PE is tautological. Most fossil species, however, are identified (described) completely separately from analysis of their phylogenetic position, which does not usually rely on stratigraphic position. Phylogenies and taxonomies are not interchangeable (Lamsdell et al. Reference Lamsdell, Congreve, Hopkins, Krug and Patzkowsky2017), and species relationships in a phylogenetic hypothesis are not reducible to nominative taxonomic association. There is therefore no reason to presume that searching for cases of POA is biased by how individual taxonomic workers have decided to delimit their species. The proportion of species arising in each individual cladogram studied via cladogenesis versus anagenesis is thus a valid method for controlling for a consistent taxonomic concept applied to all species under consideration in each sampled study.
Given the history of misunderstandings of PE, we once again note that our analysis is explicitly not about whether most speciation is associated with morphological change. It is about whether most morphotypes assigned species rank arise from cladogenesis rather than as arbitrary divisions of gradually changing chronospecies or non-arbitrary divisions resulting from rapid (relative to the stratigraphic ranges of stable states on either side of the event) shifts in a single lineage’s trait mean—punctuated anagenesis (MacLeod Reference MacLeod1991). This may appear to be a trivial point (that most species arise by cladogenesis), but that is not how early paleontologists expected to record Darwinian evolution (see Allmon Reference Allmon2020), and in the context of geologic time, it is not tautological (Fig. 1). Eldredge and Gould argued, however, that this is an expectation, given the nature of the rock record, neontological understanding of how species originate and of the time required for speciation, and our ability as paleontologists to do biostratigraphy (Eldredge Reference Eldredge1971; Eldredge and Gould Reference Eldredge, Gould and Schopf1972; Gould and Eldredge Reference Gould and Eldredge1977). Therefore the (in hindsight) obviousness of this aspect of PE to paleontologists can cause those less familiar with conceptualizing evolution in deep time to misunderstand the significance of observing the mode by which morphospecies arise.
Documentation of stasis through the history of most lineages in the fossil record coupled with a cladogenetic origin of most species is sufficient to uphold PE as the dominant model of macroevolution in deep time. If cladogenesis is truly the dominant mode of generating persisting morphological change and novel forms, then within-lineage evolution as observable on ecological timescales is only rarely of long-term consequence, and anagenesis and phyletic gradualism are therefore generally not responsible for how clades have explored or presently occupy disparity space.
Herein we reexamine the question of the relative frequency of fossil species originating via anagenesis versus cladogenesis (mode of species origin) using a sampling of recently constructed phylogenies that were not themselves constructed or conceived of as tests of PE.
Materials and Methods
To test for POA, a phylogeny must be constructed at the species level, and ideally contain all members of the clade being examined. The phylogeny must also be accompanied by information on the stratigraphic range of each taxon.
We began by examining our own recently published phylogenies with stratigraphic information for the gastropod clades Volutospina (Volutidae, Paleocene–Eocene; Friend et al. Reference Friend, Anderson and Allmon2021), Caviturritella and Torcula (Turritellidae, Pliocene–modern; Friend et al. Reference Friend, Anderson, Altier, Sang, Petsios, Portell and Allmon2023), Vermicularia (Turritellidae, Miocene–modern; Anderson and Allmon Reference Anderson and Allmon2023), and Paleogene Olivoidea of the U.S. Gulf Coastal Plain (Allmon and Friend Reference Allmon and Friend2023). These phylogenies were not constructed specifically to test hypotheses related to PE, but were constructed at species level and with information on the stratigraphic ranges of the constituent taxa.
To expand beyond our own data, we sought other recently published phylogenies that may be used to test for POA, but which were not being newly constructed in order to test questions of tempo and mode. Because our aim was to assess relative frequency of the phenomenon of POA in the fossil record, we could not claim to be assessing an unbiased sample of the record if we sought those few studies explicitly aimed at examining cases of PE (i.e., studies designed to discredit or affirm PE may be a biased sampling of fossil-inclusive cladograms, and studies with mixed results may be subject to publication biases). We therefore surveyed 3 years of papers in Paleobiology (2019–2022), Journal of Paleontology (2019–2022), and Journal of Systematic Palaeontology (with online publication dates from 2011 to 2014, the most recent years to which we had full access) for suitable phylogenies. Our search initially screened for mention of the word “phylogeny,” then we excluded papers that did not contain species-level phylogenies or that contained phylogenies dominated by large polytomies. The remaining papers were then examined to determine whether stratigraphic range information was provided in the phylogeny, text, or supplemental information. Papers that contained only first-appearance information (e.g., to provide minimum node ages) were excluded. Taxa that were presented as genus names only, but where these genera are currently monospecific, were treated as species level. One case in which only a single genus in the phylogeny contained multiple species was retained (Tabuce et al. Reference Tabuce, Sarr, Adnet, Lebrun, Lihoreau, Martin, Sambou, Thiam and Hautier2020). Monospecific genera were more common for vertebrates than for invertebrates. Where phylogenies were focused on particular clades but other taxa were included to provide character polarity or test higher-level relationships, the clade(s) that were the foci of the study were examined, as we did not want to exclude studies for not having full species-level phylogenies of all the taxa that may have been included to establish character polarities. We also did not exclude phylogenies that included single branches that represented multispecies modern clades, treating these as a single origin (if the sister species to the branch overlapped with the first appearance of the modern clade, indicating at least one species of each coexisted), but not presuming any single species persisted through the represented range. Modern species included in phylogenies with no known fossil record were treated as representing persistence of lineages originating through cladogenesis (as modern species are known to co-occur in time). Where a focal clade was only studied in a single time interval (e.g., a description of a new clade with species that all co-occur), these were excluded, as they may bias the larger analysis in the same way that examining only modern taxa would necessarily find them all to co-occur. As some clades (e.g., all species of the Superciliaspididae; Scott and Wilson Reference Scott and Wilson2015) are known to have diversified during brief intervals with few or no descendants, this exclusion provides another bias in our analysis in favor of ascribing a higher percentage of species as having originated via anagenesis than cladogenesis.
Stratigraphic range information was mapped onto the studied phylogenies and examined across each phylogeny. Any set of sister lineages in which the younger lineage did not overlap in time with the older lineage was treated as a potential case of anagenetic change (an ancestor–descendant pair). Sister lineages in which the stratigraphic ranges overlapped were treated as originating through cladogenesis. Where an earlier branching species was found at a later stratigraphic unit than members of a sister clade containing multiple species, a ghost lineage was inferred, and this species was treated as having arisen via cladogenesis, even if it was not found coincident in time with any member of the sister lineage. The number of terminal taxa originating by each mode was then tallied for each clade investigated.
Our analysis was conducted twice, once presuming that stratigraphic information presented in each publication could be examined at face value (primary analysis), meaning that species that were described as co-occurring in time were considered co-occurring in time (sister species in the same time bin were treated as examples of POA), and once using a stricter interpretation of minimum possible stratigraphic ranges that treated all species as potentially ephemeral and not coexisting with others within their prescribed time bins (species that co-occur in the same time bin would not automatically be treated as examples of POA). Any set of sister lineages in which the younger lineage did not overlap in time with the older lineage was treated as a potential case of anagenetic change (an ancestor–descendant pair). In the primary analysis, sister lineages in which the stratigraphic ranges overlapped were treated as originating through cladogenesis. In the analysis of species that were treated as occupying the minimum possible stratigraphic range represented in the associated publication, lineages that both crossed the same temporal bin boundaries (each species found above and below the same boundary) were treated as necessarily coexisting at the time of the boundary (“boundary crossers”), but possible successive speciation events within the same time bin (e.g., multiple species in a subclade present in the same formation) were treated as potential examples of anagenesis that only appeared coincident due to time averaging and/or binning. Species that are currently extant were treated as co-occurring. In both analyses, however, tree topology could necessitate that a node was the result of cladogenesis. Where an earlier-branching species was found at a later stratigraphic unit than members of a sister clade containing multiple species, a ghost lineage was inferred, and this species was treated as having arisen via cladogenesis, even if it was not found coincident in time with any member of the sister lineage. This is because clades in which one branch has representatives at both earlier and later times must have persisted throughout that time period, and therefore they coexisted with their sister lineage, and one must be the result of cladogenesis. Combining cases of cladogenesis found through the application of this tree topology principle with cases of species that must have coexisted as both cross the same temporal boundary produces the minimum possible estimate of species arising via cladogenesis.
This absolute minimum estimate notably ignores species reported from the same stratigraphic unit and location, which is likely to be unrealistically biased against cases of cladogenesis. Nevertheless, even co-occurring species found in the same locality and bed (or even horizon) may have never existed at the same time and co-occur due to time averaging. We feel the assumption that species found in the same stratigraphic unit never co-occurred in time is likely to be unrealistic, at least for marine taxa, as it would require species to exist so ephemerally that a single unit (typically a formation) includes a majority of non-coincident species, each of which was however sufficiently abundant and of sufficient stratigraphic duration to be recorded in the rock record. High-resolution occurrence data were, however, not available for most of the studies examined.
Statistical analyses were performed in Past 4.03 (Hammer et al. Reference Hammer, Harper and Ryan2001).
Results
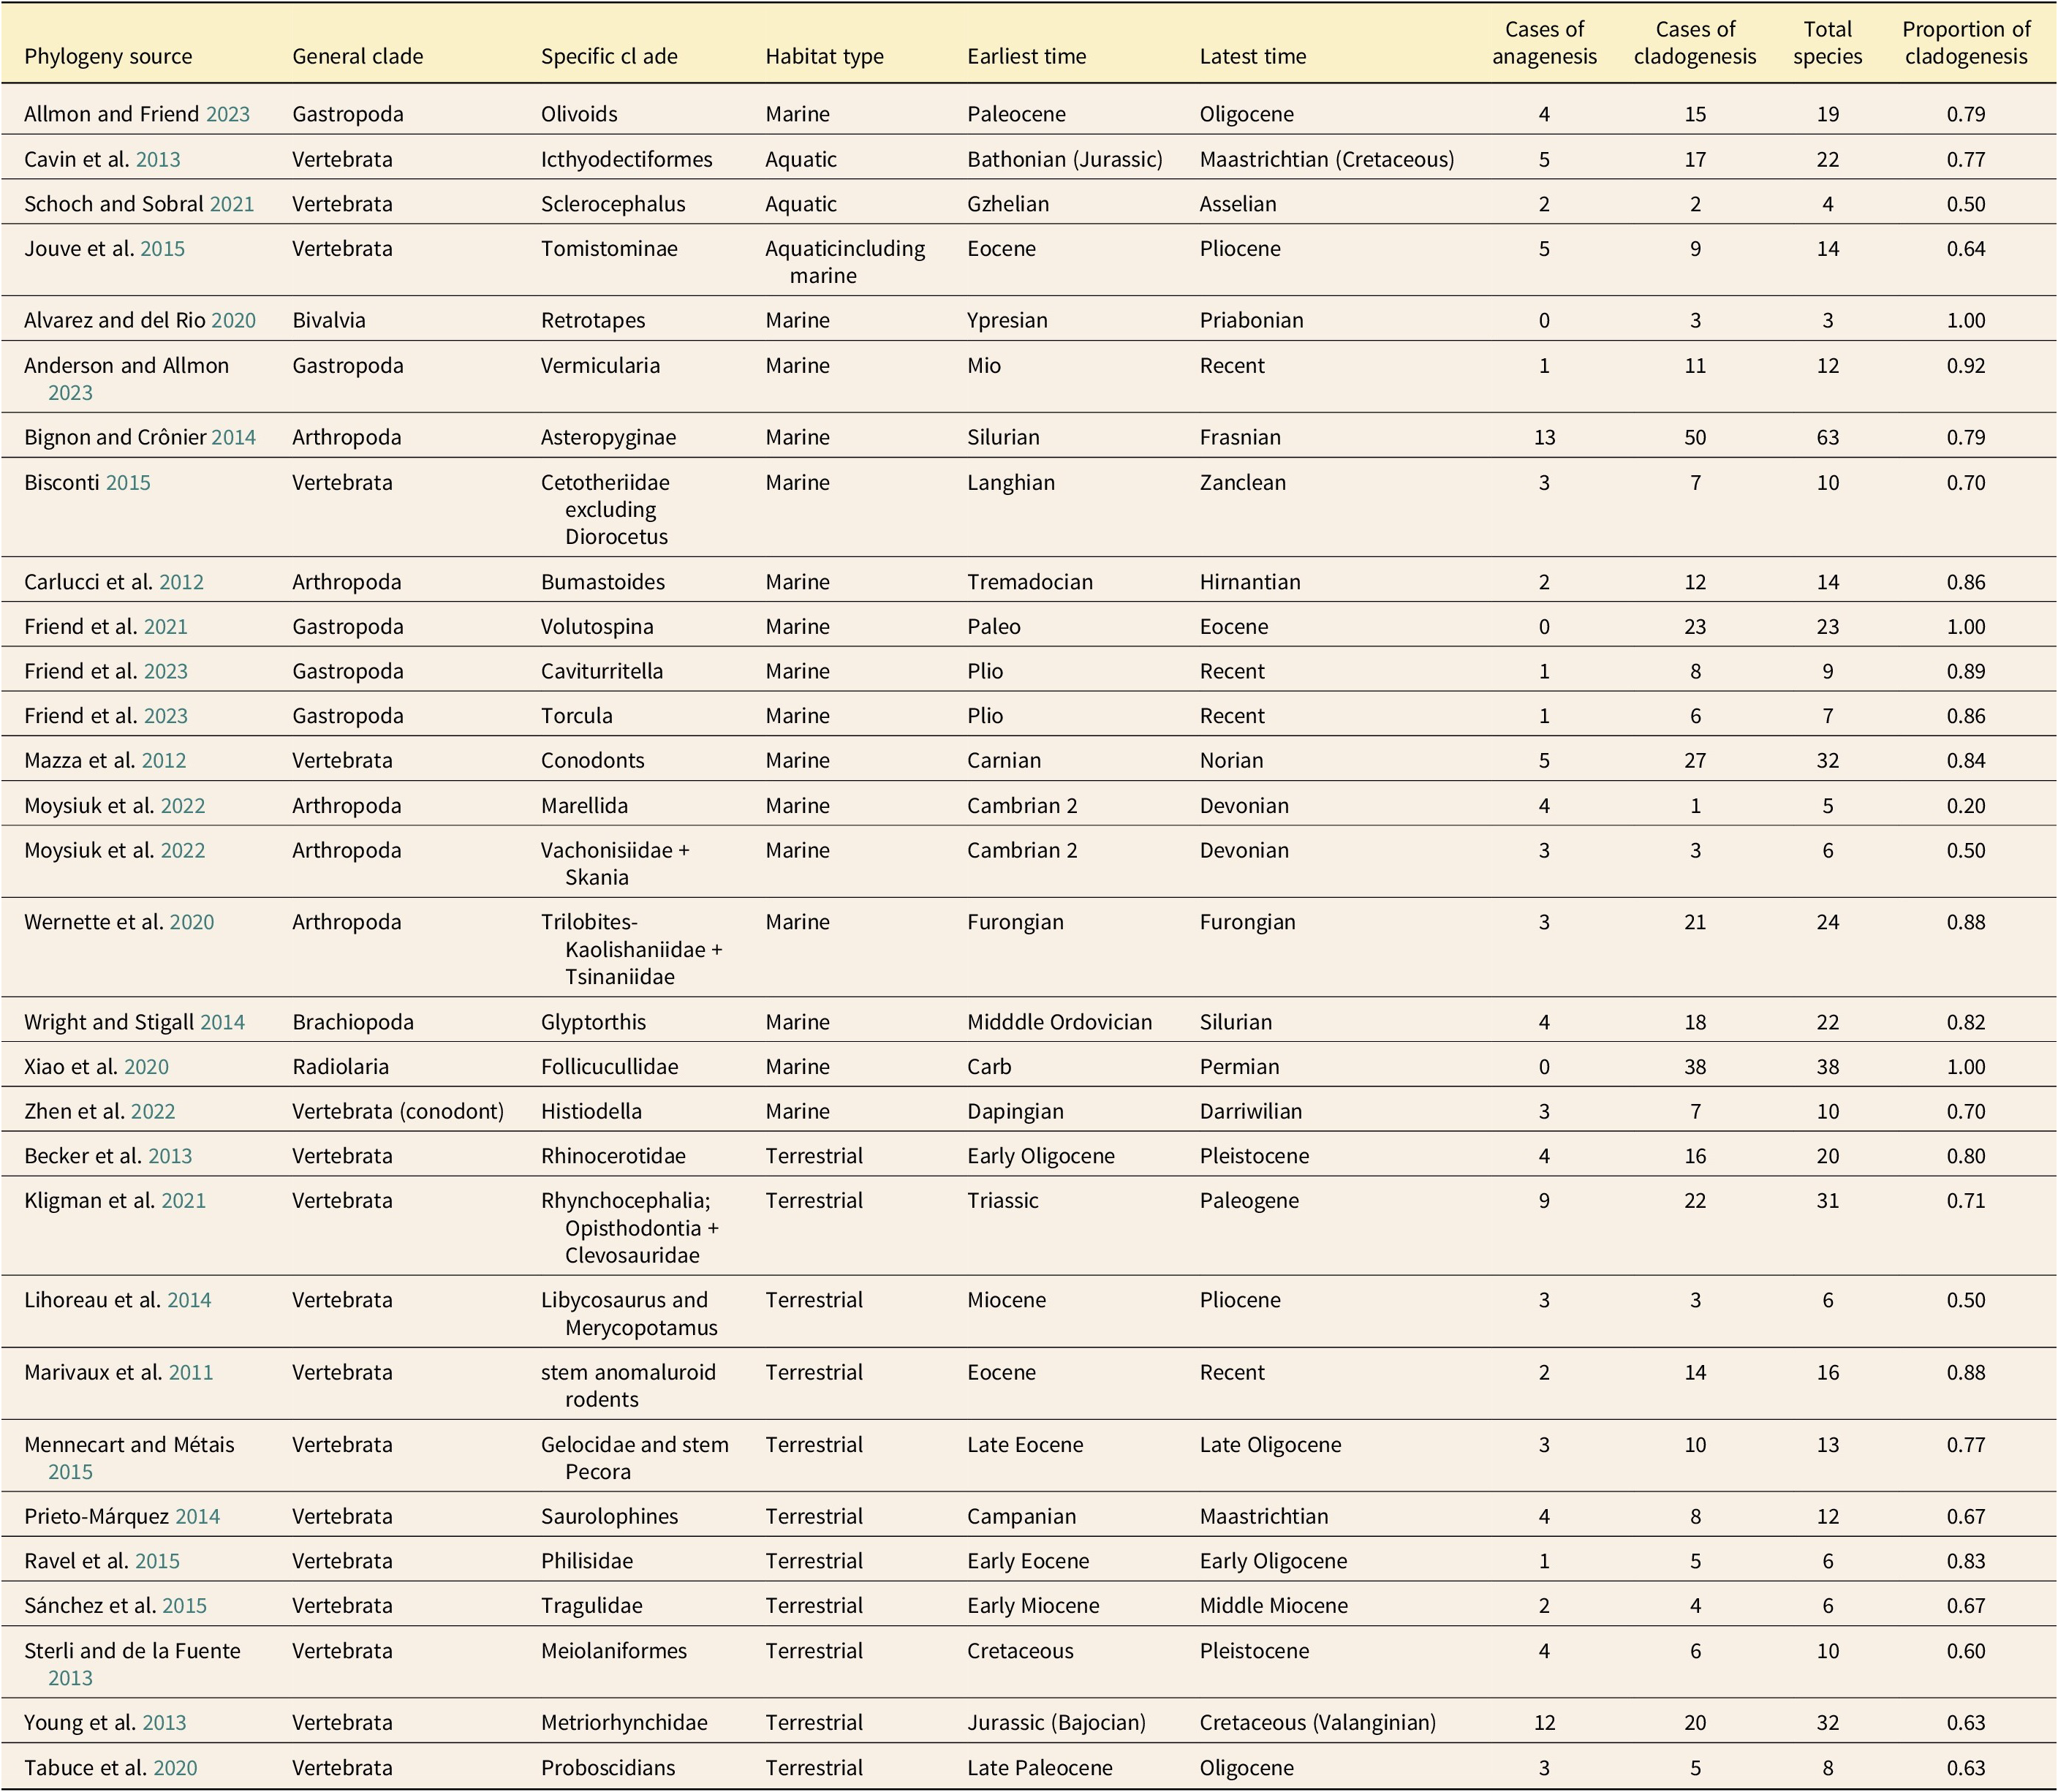
A total of 30 clades were deemed suitable for evaluation. These were obtained from 28 publications remaining from 254 publications responsive to the term “phylogeny” during the search window (Table 1). Of these 30 clades, 17 were phylogenies of vertebrates, 12 were of invertebrates, and 1 of Radiolaria. The majority of clades and species included were marine or aquatic (63% of clades; 68% of species) rather than terrestrial. All terrestrial taxa that were ultimately included were vertebrates. The average number of species per clade evaluated was 16.6, with a median of 12.5. The difference in the number of species sampled within each clade was not statistically distinguishable between terrestrial and marine clades (unequal variance t-test p > 0.47). A total of 497 species were included: 337 marine and 160 terrestrial.
Clades examined in our relative frequency analysis looking for the mode of morphospecies origins. For each, the minimum number of species arising via cladogenesis using a persistence of ancestor criterion is presented (the maximum number of ambiguous cases in each tree due to phylogenetic uncertainty are resolved as cases of anagenesis). (The following terminals were ignored because they were out of the time frame of investigation for the included study, they were missing stratigraphic information, or the text indicated potential synonymy of material included as a terminal was possible: Alvarez and del Rio [Reference Alvarez and del Río2020], R. ninfasiensis; Becker et al. [Reference Becker, Antoine and Maridet2013], species of Stephanorhinus and Ceratotherium, which were not included by Becker et al. [Reference Becker, Antoine and Maridet2013] in the presented phylogeny, did not have accompanying stratigraphic information; Kligman et al. [Reference Kligman, McClure, Korbitz and Schumacher2021], multiple extant Sphenodon taxa; Tabuce et al. [Reference Tabuce, Sarr, Adnet, Lebrun, Lihoreau, Martin, Sambou, Thiam and Hautier2020], Numidotherium sp. material.)

Using the conservative policy of resolving all cases that were ambiguous with respect to mode due to stratigraphic or phylogenetic uncertainty to maximize cases of anagenesis, cladogenesis was clearly favored as the mode by which distinct morphospecies originated, with 79% of species found to have originated via cladogenesis using a POA criterion. Across all clades evaluated, the average number of species originating within each clade via cladogenesis was 74%, and the median number of species originating via cladogenesis was 77% (Table 1). The portion of each clade originating via cladogenesis did not differ significantly between marine and terrestrial clades (p = 0.28), although marine or aquatic clades had an average of 77% of constituent species originating via cladogenesis, and terrestrial clades averaged only 70%. More marine species originated via cladogenesis than terrestrial species (82% vs. 71%), consistent with the hypothesis that higher rates of preservation in the marine realm increased the opportunity for capturing coexisting lineages, but tree topology was sufficient to necessitate cladogenesis in many cases for both marine and terrestrial clades, even with a stratigraphically limited fossil record of some constituent species.
For our strict analysis (where only topologically required or boundary-crosser species were identified as co-occurring), we provide the maximum number of species reported to co-occur in the same locality and age unit for each paper, along with the maximum reported from the same time unit for comparative purposes. The average absolute minimum proportion of each clade that originated via cladogenetic mode is 59% of species (the median proportion was also 59%) with 57% of species required to have originated via cladogenesis under the presented phylogenetic hypotheses (Supplementary Table S1).
It is notable that, once again, the studies with the highest temporal resolution appear to have the highest minimum rates of cladogenesis. This is expected, as boundary crossing was used to infer co-temporality. Poor stratigraphic resolution is therefore a bias against detection of co-occurring species in our strict analysis, as the strict analysis assumes ephemerality. The stratigraphic data in Mazza et al. (Reference Mazza, Cau and Rigo2012) were a measured section and had the same minimum number of species arising via cladogenesis as inferred in the primary analysis (because essentially all species operate as boundary crossers at this level of resolution).
Discussion
With nearly 80% of species found to have originated via cladogenesis based on a POA criterion (under the face-value reading of the fossil record wherein co-occurring taxa are presumed to be at least partly contemporaneous), cladogenesis is overwhelmingly the dominant mode of origin for morphotypes sufficiently distinct to be recognized as species-rank lineages. Even when the strictest possible criteria for assessing co-occurrence in time are applied (assuming species occurring in the same formation or unit are not contemporaneous without additional evidence of temporal association), nearly 60% of species are indicated to have arisen via cladogenesis, implying a significant role for PE must remain in our understanding of the mode of morphospecies evolution. It is also notable that no individual clade exhibited more than 50% of constituent species originating via anagenesis except Marrellida (Moysiuk et al. Reference Moysiuk, Izquierdo-López, Kampouris and Caron2022). Clades that were found to have a high proportion of species potentially having originated via anagenesis were taxa with low preservation potential (and therefore limited opportunity for documentation of persistence of ancestor). These included the two soft-bodied arthropod clades represented by exceptionally preserved deposits (Moysiuk et al. Reference Moysiuk, Izquierdo-López, Kampouris and Caron2022) and the Temnospondyls belonging to Sclerocephalus, which were lacustrine (Schoch and Sobral Reference Schoch and Sobral2021), a habitat underrepresented in the pre-Cenozoic fossil record (Allison and Briggs Reference Allison and Briggs1993). The taxa with the most consistent fossil records all record cladogenesis as the dominant mode of evolution. This observation is consistent with our own datasets based on recently completed monographic works, including one that documented all known fossil and extant species in a marine gastropod clade (with cladogenesis accounting for 92% of Vermicularia species; Anderson and Allmon Reference Anderson and Allmon2023). A high frequency of cladogenesis thus remains a valid observation in recently published phylogenetic analyses, with a higher likelihood of observation of POA in clades with higher preservation potential and thorough systematic treatments such as clade-specific monographic works (e.g., Carlucci et al. Reference Carlucci, Westrop, Amati, Adrain and Swisher2012; Wright and Stigall Reference Wright and Stigall2014; Anderson and Allmon Reference Anderson and Allmon2023; Friend et al. Reference Friend, Anderson, Altier, Sang, Petsios, Portell and Allmon2023). Indeed, even marine plankton (e.g., Xiao et al. [Reference Xiao, Suzuki, He, Benton, Yang and Cai2020] in our analysis), which have been considered to provide excellent documentation of gradual change due to the consistency and high temporal resolution of their fossil record and presumed lack of barriers to gene flow, have been shown to exhibit POA and demonstrate rapid origin of forms through cladogenesis when morphometric techniques are applied to fossil data (Hull and Norris Reference Hull and Norris2009).
It is important to note the ways in which our analysis favors the finding that species originate via anagenesis over origination via cladogenesis. First and foremost, all cases that could be anagenesis were treated as such, rather than applying any probabilistic model involving the likelihood of sampling a species or extending the ranges of taxa beyond their known fossil record to account for Signor-Lipps effects (Signor and Lipps Reference Signor and Lipps1982) or differences in the availability of fossiliferous rock in different regions, which may be represented in different portions of the cladogram. Morphologically distinct lineages of short stratigraphic duration (incipient species or short-lived good species) that are recovered in some high-resolution stratigraphic records are also less likely to achieve broad geographic ranges, high population sizes, or the stratigraphic duration presumed to be necessary in most cases for their presence to be recorded in the fossil record, again reducing the number of species/lineages recorded as instances of cladogenesis (Rosenblum et al. Reference Rosenblum, Sarver, Brown, Des Roches, Hardwick, Hether, Eastman, Pennell and Harmon2012; Crampton et al. Reference Crampton, Cooper, Foote and Sadler2020).
Additionally, the exclusion of cryptic species from assessment by paleontologists represents a loss of some portion of true species that would be counted as originating via cladogenesis, if we had perfect knowledge. The test of POA remains a valid, conservative test of the mode of species origin. Morphologically indistinguishable species (cryptic species; Shin and Allmon Reference Shin and Allmon2023) certainly existed in pre-modern communities just as they do today. The effect of cryptic species on hypotheses of mode is more complex, as it does not at first appear possible to determine if a species lineage consists of multiple cases of cladogenesis (as modern cryptic species would all necessarily be by virtue of their coexistence) or sequential speciation in which no morphological change takes place. However, if no morphological change takes place, then a single morphological species-lineage exists, and PE is a hypothesis about the origin of morphologically distinguishable lineages, not about whether the most recent member of a morphologically distinct lineage would be capable of successfully mating with the first member of the lineage, if given access to a time machine. Therefore, tests of mode via persistence of ancestor are similarly biased against confirmation to tests of stasis, when cryptic species are considered.
The only bias in favor of cladogenesis that was a result of our plain-reading methodology is the presumption that species occupied the full duration of their reported stratigraphic range, as reported in the papers sampled. In many cases, however, species were found to have been reported from the same lithostratigraphic units (not just stages, epochs, or other potentially broad time units). Furthermore, species recognized in the fossil record frequently have stratigraphic durations based on multiple occurrences that are larger than potential extension of the examined taxa’s ranges due to such temporal rasterization effects (i.e., assuming a species occupies the entire temporal extent of the temporal or stratigraphic unit in which it was reported to occur, rather than documenting it at the top and bottom of each unit) at the resolution that was used in the paper examined herein (Valentine Reference Valentine1970; Stanley Reference Stanley1979, Reference Stanley1985; Lamsdell et al. Reference Lamsdell, Congreve, Hopkins, Krug and Patzkowsky2017; Abdelhady et al. Reference Abdelhady, Seuss and Hassan2019). Co-occurrence in the same units was common for sister-species pairs in our own phylogenies, and species frequently spanned multiple time units at the resolution examined in the sampled studies. For this loss of temporal resolution to be a significant factor in the failure to record cases of anagenesis, a high proportion of species would need to be of very short duration and not co-occur with their sisters, which does not seem plausible given the available data on the frequency of co-occurrence of sister taxa in the same unit, fossil species’ average durations (Valentine, Reference Valentine1970), and the stratigraphic ranges we have observed in our own data (e.g., Friend et al. Reference Friend, Anderson and Allmon2021, Reference Friend, Anderson, Altier, Sang, Petsios, Portell and Allmon2023; Anderson and Allmon Reference Anderson and Allmon2023). Furthermore, at some point, taxa approaching infinitely short duration originating repeatedly via anagenesis may be better conceived of as a single species lineage undergoing anagenetic change. Even under the maximally strict criteria employed to address this issue of improper association of species through practices of time binning/time averaging, cladogenesis was still found to be the dominant mode of species origination, although there was an approximately 25% decline in the proportion of species showing POA in the strict analysis.
A major contribution of the observation of PE as a pervasive pattern of life’s evolutionary history is that species do not predominantly exist as a fuzzy smear of morphology through time, but appear as cohesive, recognizable entities that persist, often through long stretches of geologic history relative to the generation time of the organisms of which they are composed (e.g., Gould Reference Gould2002). In contrast, the time required for speciation, during which either cladogenesis or a punctuated anagenesis event (where a species shifts to oscillating about a new equilibrium morphology) takes place is commonly a small portion of a species’ total stratigraphic duration. As Eldredge and Gould (Reference Eldredge, Gould and Schopf1972: pp. 84, 96) observed, if speciation is expected to be a geologically rapid process (e.g., Turgeon et al. Reference Turgeon, Stoks, Thum, Brown and McPeek2005), and at least some of the time new species arise from small, localized, or geographically isolated populations, the time averaging inherent in individual geologic strata would be expected to typically be sufficient for species to appear rapidly in the fossil record as an extension of concepts promulgated by primarily neontological researchers about the timing and processes involved in speciation (Mayr Reference Mayr1942, Reference Mayr1963; Eldredge and Gould Reference Eldredge, Gould and Schopf1972; Lieberman and Eldredge Reference Lieberman and Eldredge2008). Thus, as always intended (but frequently misunderstood or misrepresented), PE is not to be viewed as claiming that species typically arise instantaneously on ecological timescales, but rather that the total durations of species as stable, recognizable entities usually far exceeds the time required for their origination.
The fact that species are distinguishable throughout geologic time is itself data, but it prompts a return to questions about how taxa evolve different morphologies. When lineages are examined through time using properties that vary among individuals, these do not tend to exhibit long-term directional trends, but rather are most often found to be best modeled as in stasis or proceeding through random walks (Hunt Reference Hunt2007, Reference Hunt2010). Higher clades examined using individual species as members of their statistical population in a time series can also exhibit non-directional behavior through time (e.g., turritelline gastropod body size throughout their evolutionary history; Pietsch et al. Reference Pietsch, Gigliotti, Anderson and Allmon2023), but stasis within a species is a particularly important observation that has a bearing on the core of macroevolutionary theory. The dominance of cladogenesis together with stasis within species relative to the time required for speciation forms the foundation of the hierarchical expansion of evolutionary theory (Gould Reference Gould and Milkman1982, Reference Gould2002; Eldredge Reference Eldredge, Eldredge, Pievani, Serrelli and Temkin2016). If most nonrandom morphological change that persists takes place in association with speciation, then long-term evolutionary trends are primarily driven by biases in the direction of speciation, frequency of speciation, or frequencies of extinction (Fig. 3).
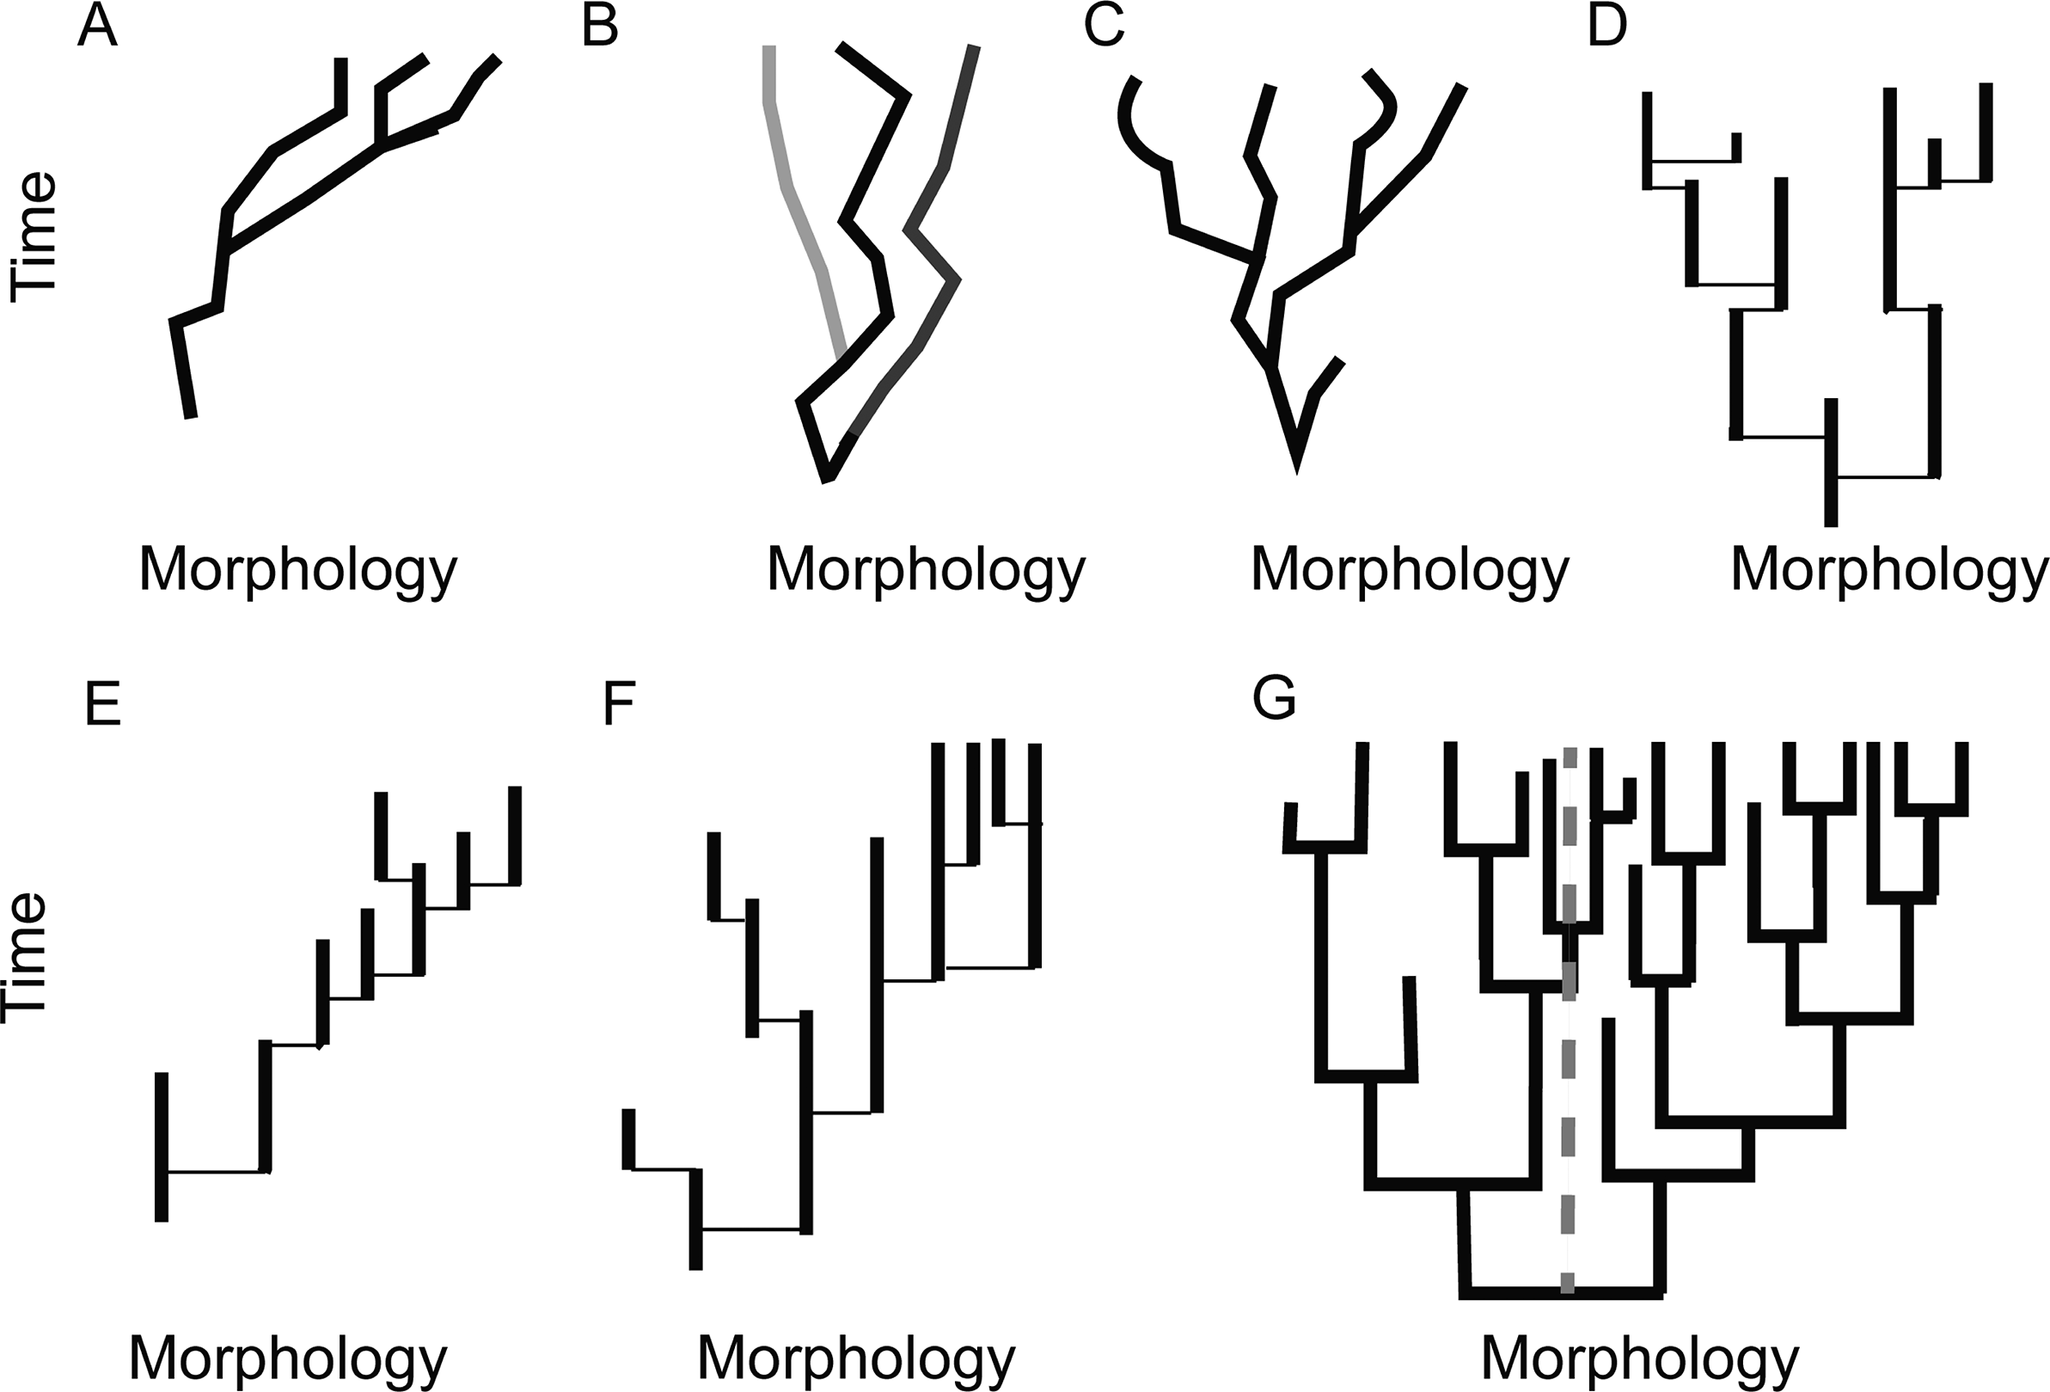
Alternative ways clades may have explored morphospace through deep time. A, Phyletic gradualism. Movement through morphospace primarily takes place anagenetically, and the overall trend is a result of a directional trend present in the majority of each constituent lineage’s evolutionary history. B, A clade where the clade is in overall stasis because species approximate stasis and speciation is both non-directional and not associated with substantial displacement in morphospace. C, A clade that is exhibiting increased variance, but no net change in morphology, where most evolution takes place through phyletic gradualism. D–G, Cases showing punctuated equilibria (PE). Note that while the lineage histories are shown as solid lines these represent lineages exhibiting minor fluctuations about a mean morphology or non-directional change, and in these depictions, speciation events take place over timescales below the resolution of analysis. D, A clade exhibiting increased variance, but overall stasis in average position in morphospace, where PE is the pattern of morphological evolution. Each lineage may exhibit fluctuations through time under close examination, but no net change is observed. Note that cladogenesis is the dominant mode of species origination, as determined by persistence of ancestor. E, A clade-level morphological trend generated under PE due to a bias in the direction of species origination only. Where cladogenesis occurs in this case, it is more likely that the descendant lineage occupies a position in morphospace to the right of the ancestor rather than to the left. F, A clade-level trend generated under PE due to increased rates of extinction (shorter species durations) in one portion of the tree. G, A clade-level trend generated by increased rates of speciation in one portion of the tree. The original mean state is demarcated by the dotted gray line. In this case, assessing the proportion of species on the right side of the line vs. the left would result in increasing proportions of species having the state on the right side of the line being documented through time, even though rates of extinction on the left are not higher (a ratio of 7 to 2 at the final time point recorded).
Mode is an essential part of this consideration, because infrequent, rapid anagenesis (punctuated anagenesis, resembling the quantum speciation of Simpson [Reference Simpson1944]) is also consistent with species occupying similar morphospace for the dominant portion of their histories and rapidly shifting to a new state, without speciation. Our conception of how to explain the observation of stasis and how evolution generates morphological diversity would be fundamentally different if most new morphologies appeared to sweep through entire populations with rapid replacement. It would, for example, be much easier to envision evolution as progressive in some way over long timescales, even without any teleological entanglements, or as proceeding through rapid reorganization across a series of ecological tipping points.
The dominance of stasis (or at least lack of a directional trend) in lineages along with cladogenesis as the dominant mode observed in the fossil record means that most species can be treated as evolutionary individuals, with discrete origins, terminations, and the ability to reproduce (through cladogenesis) (Stanley Reference Stanley1975; Gould and Eldredge Reference Gould and Eldredge1977: p. 132; Gould Reference Gould and Milkman1982, Reference Gould1998; Eldredge and Salthe Reference Eldredge and Salthe1984; Vrba and Gould Reference Vrba and Gould1986; Congreve et al. Reference Congreve, Falk and Lamsdell2018). Selection or sorting at higher hierarchical levels than the population may be theoretically separable from PE, but PE highlights the potential significance of species as evolutionary individuals for generating patterns or trends in disparity (Gould Reference Gould2002; Okasha Reference Okasha2006: pp. 203–205). If PE is a dominant pattern in the history of life, then differential origination and extinction is recognized as an important consideration for how disparity is constructed and how a clade comes to occupy disparity space. Further, trends in morphology that are observed over long timescales can no longer be viewed as simply the effects of anagenetic processes observed over long timescales. If cladogenesis is the dominant mode of the origin of morphotypes, then it is necessary to consider whether any trends observed in morphology at higher taxonomic ranks are the result of selection at the level of organisms or are the result of biased origination, extinction, or character-state direction of speciation (Lieberman and Vrba Reference Lieberman and Vrba1995; e.g., evolutionary mechanisms behind changes in clade body-size through time [see Anderson et al. Reference Anderson, Petsios, Behn, Betz, Allmon, Lieberman and Hendricks2024] or presumptions that non-planktotrophic larvae cannot revert to planktotrophy [see Friend et al. Reference Friend, Anderson and Allmon2021]).
The present paper has another important implication for evolutionary paleobiology. Given the importance of studies of mode to paleobiology, it is remarkable how few studies in the recent literature met the criteria for assessment (i.e., phylogenies constructed at the species level, containing at least all regional representatives of the clade under examination, and with stratigraphic information for all taxa). Even disregarding those papers that were not themselves concerned with generating new phylogenies, it was rare in the journals and years sampled for a study to meet all of the above-listed criteria. Our own studies were not originally designed as tests of PE but were generating phylogenies for other purposes (Anderson and Allmon [Reference Anderson and Allmon2023] was a monograph pursued as a prerequisite to a study heterochronic processes in Vermicularia; Friend et al. [Reference Friend, Anderson and Allmon2021] was designed to study how planktotrophy and non-planktotrophy influenced speciation and extinction rates; and Friend et al. [Reference Friend, Anderson, Altier, Sang, Petsios, Portell and Allmon2023] generated phylogenies as part of a taxonomic monograph revising a diverse and poorly studied fauna of turritellids). What these studies have in common is the necessity of treating the data at the species level for the study question. Where species-level phylogenies of clades are constructed and coupled with the comprehensive stratigraphic range information, especially where the fossil record is of high preservation potential, the dominance of POA is the clear testimony of the rock record.
Conclusion
PE is not dead. The core aspects of the theory of PE all remain valid observations 50 years after Eldredge and Gould’s Reference Eldredge, Gould and Schopf1972 paper. These are: (1) most species do not exhibit directional change in morphology through their evolutionary histories; (2) speciation takes place over a relatively short period of a species’ total stratigraphic duration (the period of ambiguous morphospecies assignment in a lineage is typically geologically brief); (3) the mode by which most morphospecies originate is cladogenesis rather than anagenesis; and (4) most morphological change that becomes fixed (and therefore important for the history of a clade overall), occurs in association with speciation.
Any attempts at understanding how diversity became unevenly distributed across the tree of life, or what resulted in the morphological trends observed in the fossil record must therefore grapple with the fossil record, PE, and hierarchical expansions of evolutionary theory (Gould and Eldredge Reference Gould and Eldredge1986; Vrba and Gould Reference Vrba and Gould1986; Gould Reference Gould2002; Lieberman and Eldredge Reference Lieberman and Eldredge2008; Lamsdell et al. Reference Lamsdell, Congreve, Hopkins, Krug and Patzkowsky2017; Congreve et al. Reference Congreve, Falk and Lamsdell2018; Lamsdell Reference Lamsdell2021). Despite 50 years of paleobiological work subsequent to PE and attempts to justify our position at the “high table” of evolutionary theory (Maynard Smith Reference Maynard Smith1984; Sepkoski Reference Sepkoski2014), it seems that many neontological biologists have decided to move to a different table. Thankfully, it appears they have left many of the meaty questions of how morphologies changed over time and how different clades came to prominence with us. This does not mean that questions such as mechanisms generating phenotypes at levels below the species, the details of the process(es) of speciation, or how phenotypes interact with the environment are not also important questions for understanding evolution. It does, however, mean that explanations of long-term evolutionary trends are necessarily incomplete without reference to the possibility of hierarchical processes such as sorting operating at higher levels of the taxonomic hierarchy and that a paleontological perspective is essential for a full understanding of how evolution operates. The perspective gained from paleobiology on the mode of morphospecies origins and how trends in disparity or ecospace occupation arise cannot be inferred by extrapolating from neontological data alone without scrutiny of the fossil record, and we should not limit our understanding of the foundation of biology to a single, arbitrary, and ultimately ephemeral point in time.
Acknowledgments
We are grateful to N. Eldredge and S. J. Gould for their essential contributions to our understanding of macroevolution. We thank D. Prothero and colleagues for organizing this issue, especially our editors M. Hopkins and P. Kelley. We also thank A. McCune and two anonymous reviewers for comments on previous drafts that improved the quality of this manuscript. B.M.A.’s work was supported by the National Science Foundation under Award No. 2225014 to W.D.A. and J. Hendricks.
Competing Interests
The authors declare no competing
Data Availability Statement
Data available from the Dryad Digital Repository: https://doi.org/10.5061/dryad.xsj3tx9s6


 Open access