


Introduction
As global temperatures rise, so are fears of major ecological collapse. In this climate of uncertainty, calls for developing and researching climate engineering technologies are gaining traction.Footnote 1 ‘Climate engineering’ – or ‘geoengineering’Footnote 2 – is an umbrella term for large-scale interventions into the climate system that aim to mitigate (dangerous degrees of) anthropogenic climate change. Common definitions distinguish between two types of such large-scale interventions. So-called Solar Radiation Management (SRM) refers to attempts to reflect incoming sunlight away from Earth, for example through the installation of mirrors in space or the injection of reflective aerosols into the stratosphere. Carbon Dioxide Removal (CDR), contrariwise, includes approaches to capture CO2 from the atmosphere, for example via air filters or by fertilising the oceans with iron sulphates to induce blooms of CO2-absorbing algae.
Scholars in International Relations (IR) and neighbouring disciplines would note early on that climate engineering touches upon key concerns of international politics – including international security, democracy, and justice. These works have, for example, discussed whether and how climate engineering (research) can be accommodated through international law and existing multilateral agreements, and which institutional changes and innovations in global governance this would require.Footnote 3 Others have studied how a securitisation of climate change could make the adoption of climate engineering – as an emergency measure – more probable, and how the deployment of such technologies could itself lead to unexpected security risks.Footnote 4 At a more fundamental level, climate engineering ties in with the emerging debate on international politics in the Anthropocene. The very idea that humans could intentionally manipulate the entire Earth system is, perhaps, the most vivid illustration of the Anthropocene concept, which holds that we have entered a new geological epoch defined by humans’ impact on the planet.Footnote 5 In this reading, the politics of climate engineering are also a form of ‘planet politics’ – a politics that has the entire Earth system as its object of governance.Footnote 6
The diagnosis of climate engineering as a symptom of our transition into the Anthropocene, and as a form of planet politics, is, however, complicated by the literature on changing and competing discourses of climate engineering itself.Footnote 7 This literature has shown that the latter is not so much a fixed set of technologies but more an open and contingent discourse, or future imaginary. Columba Peoples,Footnote 8 for example, describes how ideas of climate engineering as a ‘planetary crisis management’ would co-evolve with the emergence of planetary thinking and the notion of ‘planetary security’ from the 1990s. In this sense, the planetary frame, through which climate engineering is often approached in IR, is only one (historically contingent) spatial imaginary among others. Duncan McLaren and Olaf CorryFootnote 9 show that debates on the international governance of climate engineering technologies are also struggles about ‘clashing geofutures’ – understood as shared imaginaries of future global order. Thus, what is being negotiated in academic, public and policy debates is not only the meaning of climate engineering, per se, but also the world(s) and world orders in which such approaches are imagined to be deployed.Footnote 10
We advance this debate by showing how imaginaries of climate engineering and related forms of (world-)political order are shaped by what we call ‘the visual politics of climate engineering’. We argue that there is a research gap in the literature on discourses and imaginaries of climate engineering: existing works focus mainly on the textual construction of the latter. Drawing on the literature on visual global politics,Footnote 11 we show that the competing imaginaries of climate engineering discussed by othersFootnote 12 are performed and (re)produced through various forms of visuality. Images and other visuals not only allow imagined climate engineering approaches to be rendered visible in the present; in doing so, they also produce and reproduce competing visions of global order. In other words, they enable one to imagine the possible worlds in which climate engineering technologies might be deployed and to speculate about how this future world would be structured internally.Footnote 13 Starting from these assumptions, we ask: How do images construct and perform authorised imaginaries of climate engineering and underlying world orders?
Conceptually, the article furthers the debate on sociotechnical imaginaries and global order by bringing it into dialogue with visual politics, thereby carving out a more imagistic conception of climate engineering imaginaries.Footnote 14 Empirically, the article contributes to the debates on the global politics of climate engineering and on IR in the Anthropocene by providing the first systematic study of the visual construction of climate engineering and underlying imaginaries of world-political order. For this, we have compiled a novel dataset, or visual library, of climate engineering articles in English-language online media from 2009–20. We focus on imagery in online-mediasphere (see https://en.wiktionary.org/wiki/mediasphere) because it represents an important discourse arena in which public opinion on the issue of climate engineering is negotiated – and one in which voices as well as imagery from more specialised discourses are reproduced.Footnote 15 ‘Our political experience’, Chiara Bottici notes, ‘has become inconceivable outside of the continual flows of images that appear on our screens’.Footnote 16 Online news media are important visual actors involved both in the production as well as circulation of the climate engineering imagery. Even though social media platforms have brought about a certain ‘democratization of visual politics’, online news media remain important ‘image brokers’ that ‘structure and mediate the flow of [online] images’.Footnote 17 The imagery produced and shared by newspapers are not contained in their articles but rather circulate via social media and global platforms such as Google Images in a new media landscape.
The next section demonstrates the need for closer engagement with climate engineering visuality in IR and develops our core theoretical premise. The third section presents our empirical findings and identifies three visual clusters that together constitute the visual politics of climate engineering: images of human–nature relations; images of feasibility of climate engineering projects; and images of agency. In the fourth section we discuss how these ways of seeing climate engineering enact certain imaginaries of the global and discuss the political implications of such imaginaries. We conclude by answering our research question and outlining prospects for further research.
From discourse and representations to making worlds with/of climate engineering
As mentioned above, a growing literature is engaging with the construction of climate engineering in academic, political, and public debates. The underlying assumption herein is that climate engineering is not a fixed set of technologies but an open and contingent discourse. Already the question of which technologies should be considered climate engineering (as opposed to, for example, climate mitigation or adaptation efforts) is a highly political one. The existing literature has shown that competing understandings or framings of climate engineering coexist and that these have changed over time.Footnote 18 Furthermore, climate engineering is framed differently in specialised discourses (for example academic, political, and media debates) and in different countries.Footnote 19 These framings matter, because how climate engineering is collectively understood influences which actors can get involved, how related technologies could be practised and which broader political goals are responded to. Thus, discursive framings can enable or constrain the development and governance of related technologies.Footnote 20
A second strand of literature, with its roots mainly in Science and Technology Studies (STS), puts focus on the co-production of climate engineering proposals in tandem with imaginaries of (future) political order.Footnote 21 Drawing on the notion of sociotechnical imaginaries – defined as ‘collectively held, institutionally stabilised, and publicly performed visions of desirable futures’Footnote 22 – this literature engages ‘with how [climate engineering] is imagined and the imagined world in which it is expected to be deployed’.Footnote 23 As an imaginary, climate engineering is already subject to intense political debate, even though the related technologies themselves either do not exist or cannot be deployed at a large scale, yet.Footnote 24 Current climate engineering proposals are political not only because the discussed technologies carry considerable risks but also because ‘technological fixes conceived on such grand scales are premised on tacit understandings of who has the right to frame and solve problems.’Footnote 25 Per this understanding, research on climate engineering is inherently political because it involves negotiations about possible future forms of world-political order – or ‘clashing geofutures’.Footnote 26 A related strand of the literature traces imaginaries of climate engineering futures in popular culture, including in blockbuster movies like Geostorm or Snowpiercer or in the speculative fiction novels of Kim Stanley Robinson.Footnote 27 Studying these popular imaginaries is important because, as Sheila Jasanoff notes, ‘Technological innovation often follows on the heels of science fiction.’Footnote 28
Together the summarised works demonstrate the contested and political nature of climate engineering imaginaries in scientific proposals, media reports, political debate, and popular culture. What is sometimes implicated but seldom explicitly addressed in these works, however, is the role of images and underlying forms of visuality in the making and remaking of such imaginaries. Writing on the importance of metaphorical frames in geoengineering discourse, Brigitte Nerlich and Rusi Jaspal, for example, state that ‘frames make us see and act upon the world in specific ways. They create visions and expectations …’.Footnote 29 Nevertheless, their empirical analysis focuses exclusively on textual metaphors of climate engineering. A similar priority on textual representations characterises the debate on climate engineering imaginaries, too. In a recent book, Jeroen OomenFootnote 30 investigates three different ‘ways of seeing’ climate engineering and asks how these influence visions about desirable climate engineering futures. In a fascinating case study, they trace the epistemological positions of climate engineering experts and related worldviews that make the idea of intervening into the Earth system thinkable. However, ‘ways of seeing’ remains a metaphor in this empirically rich study, which leaves open the question of how images and forms of visuality enable these ways of seeing climate engineering in the first place.Footnote 31 Similarly, analyses of representations of climate engineering in movies like Geostorm or Snowpiercer have often focused on the narrative, plot, and moral of the story, thus treating them as texts rather than as audio-visual artefacts.
Towards an imagistic notion of climate engineering imaginaries
Based on these observations, we call for a more imagistic notion of climate engineering imaginaries. This analytical focus on images in discourses and imaginaries of climate engineering is supported by the literature on global visual politics in IR.Footnote 32 According to these works, images and other visuals are particularly powerful by giving complex and abstract phenomena – such as climate change, or in our case climate engineering – a concrete visible and graspable form.Footnote 33 Furthermore, images – especially photographs and other visual mediums such as satellite images – carry a certain claim to represent the depicted reality in a direct and objective manner.Footnote 34 Visual scholars have criticised this ‘illusion of authenticity’,Footnote 35 arguing that every image portrays the world from a particular perspective and position.Footnote 36 Through the selected perspective, angle and resolution, through the use of colours as well as composition, images frame issues of global politics in certain ways and carry subjective interpretations and meanings. In short, visuality can influence the meaning of issues such as migration, climate change, or terrorism – doing so specifically by shaping what is ‘politically visible and sayable’Footnote 37 about them.
However, images and other visuals do not only shape popular understandings of climate engineering but also allow imagining possible futures in which such technologies might be deployed. A good starting point to trace the importance of images in processes of imagination is the work of Chiara Bottici on ‘imaginal politics’.Footnote 38 Bottici develops the notion of the ‘imaginal’ as an alternative to existing theories that either understand imagination as an individual faculty of the mind or focus on social imaginaries as structural context.Footnote 39 The concept of the imaginal takes as its starting point ‘neither a subject separated from the world nor a world independent from the subject, but simply images’.Footnote 40 The latter, according to her, take up a special role in any kind of imaginative practice – be it collective or individual – since, ‘without images, there cannot be a world for us’. Furthermore, visual representations of the world carry a ‘surplus meaning’ that cannot be easily captured by words.Footnote 41 Similarly, scholars in STSFootnote 42 and Visual StudiesFootnote 43 have stressed the crucial role of images in the making and remaking of worlds: our imaginaries of the world depend on our images of it (Weltbilder).Footnote 44 This idea resonates with feminist, postcolonial, and poststructuralist scholarship in IR that ‘refuses to take the world – its borders, states, norms, publics – as ahistorical or static’.Footnote 45 As Cynthia Enloe reminds us, the ‘world is something that has been – and is being – made every day’.Footnote 46 It is made and remade through myriad practices, rituals, and discourses – including religion, scientific knowledge, diplomacy, and similar. Yet, as we will demonstrate, it is also remade through visual technologies such as satellite remote sensing, computer modelling, photography, microscopy, and their underlying ‘visual regimes’.Footnote 47 In the visual discourse of climate engineering, then, world-viewing is essentially a form of ‘world-making’.Footnote 48 Finally, following William A. Callahan, we hold that images not only allow us to visualise possible geoengineered world futures but also to imagine how these worlds would be ordered and structured internally.Footnote 49 World-making and world-ordering are, in this sense, two dimensions of the visual politics of climate engineering. Finally, in contrast to Jasanoff and following Manjana Milkoreit, we hold that the future worlds imagined through climate engineering visuality involve both desirable as well as undesirable visions of planetary futures.Footnote 50 Writing on the role of imagination in processes of social-ecologial transformations, Milkoreit argues that ‘dystopic visions of the future might harbor as much motivational potential as utopias’.Footnote 51 Similarly, we observe in our analysis below that climate engineering proposals are often informed by dystopian imaginaries of a looming ecological collapse.
Based on the works discussed in this section, we are now able to provide a preliminary definition of an imagistic notion of climate engineering imaginaries. First, these are visions of climate engineering futures that are crucially shaped by images and related ways of seeing. Second, the performative effect of such imaginaries can be described as world-making and world-ordering: that is, they deal with questions of what the world is and who has the capacity and legitimacy to act within and upon it.Footnote 52 Third, imagistic imaginaries of climate engineering involve visions of both desirable, utopian as well as undesirable, threatening futures.
Studying climate engineering visuality
As images are polysemous, their concrete meaning would always depend both on the interpretation of the viewing audience as well as their intertextual and intervisual relations.Footnote 53 The former refers to the context of images comprising, for example, captions, legends, headlines and other textual elements. The dimension of intervisuality, meanwhile, concerns the relation of visuals to other images.Footnote 54 Images visually refer to other images through practices of visual citation, appropriation, or common aesthetic characteristics. They are always embedded in larger ‘systems of visibility’.Footnote 55 The performative effects of images, thus, often only become visible when one zooms out from the single image and studies larger patterns. To instantiate a methodology that is attentive to both the interdiscursive as well as intervisual dimension of images, we combined two approaches: quantitative content analysis and visual discourse analysis.Footnote 56 We operationalised this with the help of the qualitative data analysis software MAXQDA. This allowed us not only to analyse large amounts of visual data but also to perform all our methodological steps in an integrated manner. This approach is able to zoom in on individual, paradigmatic images to scrutinise them within their interdiscursive context. At the same time, it is able to zoom out and group images along the line of thematic or aesthetic criteria. Following Richard Rogers, we deem such a research strategy particularly fruitful for digital images as it mirrors the ways in which online imagery is grouped and regrouped algorithmically by platforms such as Google Images.Footnote 57
Quantitative content analysis allowed us to identify dominant visual tropes and patterns that might indicate the existence of broader systems of visibility in the public discourse on climate engineering. We coded according to three analytical categories: image production; image source; and image content. The assigned codes were mutually exclusive and exhaustive – meaning that every image was assigned exactly one code in each of the three categories. To increase intercoder reliability, all images were coded independently by at least two different researchers who discussed their interpretations, where codings diverged.
In a second analytical step, the identified visual clusters were subject to a more fine-grained and interpretive visual analysis so as to investigate the discursive meanings and performative effects of climate engineering imagery.Footnote 58 For this, we analysed the image clusters as a group of three researchers. We used an open heuristic derived from established approaches of visual analysis that was inductively extended during the course of the analysis.Footnote 59 Initially, the heuristic comprised the following analytical categories: visibilities/invisibilities (what is highlighted/rendered invisible?); gaze/perspective (how is the object framed and who is the subject looking?); visual icons, symbols, and metaphors, as well as subjective impressions and feelings. The images in question were studied both as larger visual clusters to account for their intervisual relations as well as within their concrete contexts – by studying captions, headlines, and other accompanying texts. By moving back and forth between larger image clusters and individual images studied in relation to their concrete contexts, we iteratively developed the findings outlined below. As Gillian Rose points out, although images have their own visual effects (that is: performativity) spectators also always ‘bring their own visualities into viewing’.Footnote 60 By studying our material as a group, we were able to compare our individual perspectives and cross-validate our interpretations. Subsequently, these interpretations were further checked for plausibility through conference presentations and via feedback from academic peers.
The sample: Studying climate engineering visuality over time
To carry out our analysis we compiled a novel empirical data set of climate engineering images in major English-language online news media. We compiled the articles with the help of LexisNexis,Footnote 61 conducting several searches with the keywords geoengineering, climate engineering, solar radiation management, and carbon dioxide removal in the period 2009–20. Our initial search produced 14,000 hits. We then reduced our sample size by applying different selection criteria: we removed all press releases, blog articles, articles without imagery and news in brief. Furthermore, we only included articles that engaged explicitly with climate engineering (or either SRM or CDR), and only those journals with repeated coverage of the issue (three or more articles). The final sample comprises 288 articles in 24 international newspapers and magazines, with a total 459 images.Footnote 62 The vast majority of articles stem from United States and United Kingdom media, but some from Australian, Indian, and South African sources feature, too.
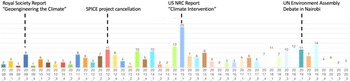
We chose 2009 as the start date of our study because in that year a number of major publications on climate engineering, such as the Royal Society report ‘Geoengineering the Climate: Science, Governance and Uncertainty’,Footnote 63 caused a considerable rise in public interest herein in the United Kingdom and other Western countries.Footnote 64 The significant increase in public interest vis-à-vis climate engineering following the publication of the Royal Society report would further increase from 2015 onwards (see Figure A1 in the Appendix). Not only did the number of climate engineering articles grow over time, also the number of images within such articles increased considerably, too – indicating the emergence of a genuine visual discourse. As one can further observe in Figure A1 in the Appendix, there would be a number of critical junctures (here visible as peaks in the number of articles): (1) the publication of the Royal Society report in 2009; (2) the 2012 cancellation of the controversial ‘Stratospheric Particle Injection for Climate Engineering’ project in the UK; (3) the 2015 report ‘Climate Intervention’ by the US National Research Council; and (4) the debate on climate engineering at the 2019 United Nations Environment Assembly (UNEP) meeting in Nairobi, Kenya.
These critical junctures not only generated public attention but also brought about qualitative changes in the discourse – in terms of the topics discussed in relation to climate engineering. Most articles in the sample are overview ones presenting the idea of climate engineering and discussing potential benefits and risks. In addition, many articles focus on issues of critical relevance for IR: the political regulation of climate engineering as well as related political conflicts; climate engineering as a potential security threat and a subject of geopolitics; and national or regional climate engineering proposals (such as refreezing the Arctic or the protection of the Great Barrier Reef).
The visual politics of climate engineering
Through our content analysis we identified several thematic clusters in the public discourse. By studying each of these clusters individually, and particularly characteristic images in their intertextual contexts, we could group them into three overarching themes: nature/environment; technology/infrastructure; and people/actors. Drawing on the theoretical perspective developed above, we argue that all three visual clusters affect how climate engineering approaches and the worlds in which they could be deployed are collectively imagined. The first visual cluster includes images that deal with the relationship between humans and the natural environment. This relationship is crucial for political and ethical debates about climate engineering as it concerns the general question of whether humans can and should actively manipulate the climate. The second cluster that we identified comprises images that depict climate engineering as a set of concrete technologies and infrastructures, dealing thus with questions of the feasibility of such approaches. The third cluster includes visual representations of the actors involved in the politics of climate engineering and their underlying subject position. These particular images thus concern questions of political agency and power in climate engineering imaginaries. Together, these visual clusters represent three (interlinked) dimensions of our proposed visual politics of climate engineering.
Images of human–nature relations
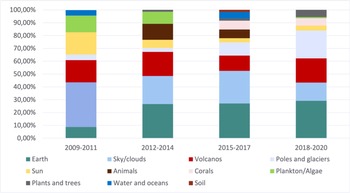
Imagery of ‘nature’ and ‘the environment’ in the sample is dominated by four main visual themes (see Figure A2 in the Appendix). These are (in order of magnitude): images of (1) Planet Earth as seen from space; (2) a blue, cloudy sky; (3) volcanic eruptions captured from different angles; and (4) of the Arctic/Antarctic. Minor clusters of visuals show the sun, animals, corals, plankton and algae, plants and trees, water and oceans, as well as soil.
In these images and visuals, climate engineering is not so much represented as a specific set of technologies or practices, but rather as a space for negotiating human–nature relations and ethical dimensions of large-scale interventions into the Earth system.Footnote 65 When the idea of climate engineering entered public debate around 2009 it was represented as a matter of inconceivable magnitude and scale, and met with great suspicion.Footnote 66 It thus comes as no surprise that climate engineering – understood as large-scale interventions Footnote 67 – triggered questions about the ‘implicit anthropology’ of those proposals and the seemingly unprecedented responsibility that came along with them. This metaphysical debate involved theologiansFootnote 68 as well as philosophers – because what was ultimately at stake in (evaluations of) climate engineering proposals was nothing less than the ‘meaning of being human’,Footnote 69 and the question of whether humans are allowed to ‘play God’.
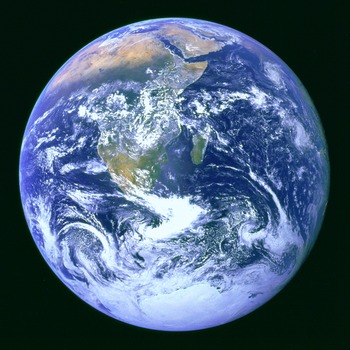
Many images in this visual cluster depict Planet Earth captured from space (see Figure 1). As prominently argued by STS and visual scholars, the ‘planetary gaze’ adopted by these iconic ‘blue marble’ images helped establish an understanding of the Earth as a single object and whole system.Footnote 70 Such images perform what Donna HarawayFootnote 71 calls a ‘God trick’: on the one hand this planetary gaze purports to offer a disembodied neutrality and objectivity (as a view-from-nowhere); on the other, it demonstrates technical mastery and human control of the planet.
The iconic blue marble image. Source: NASA.
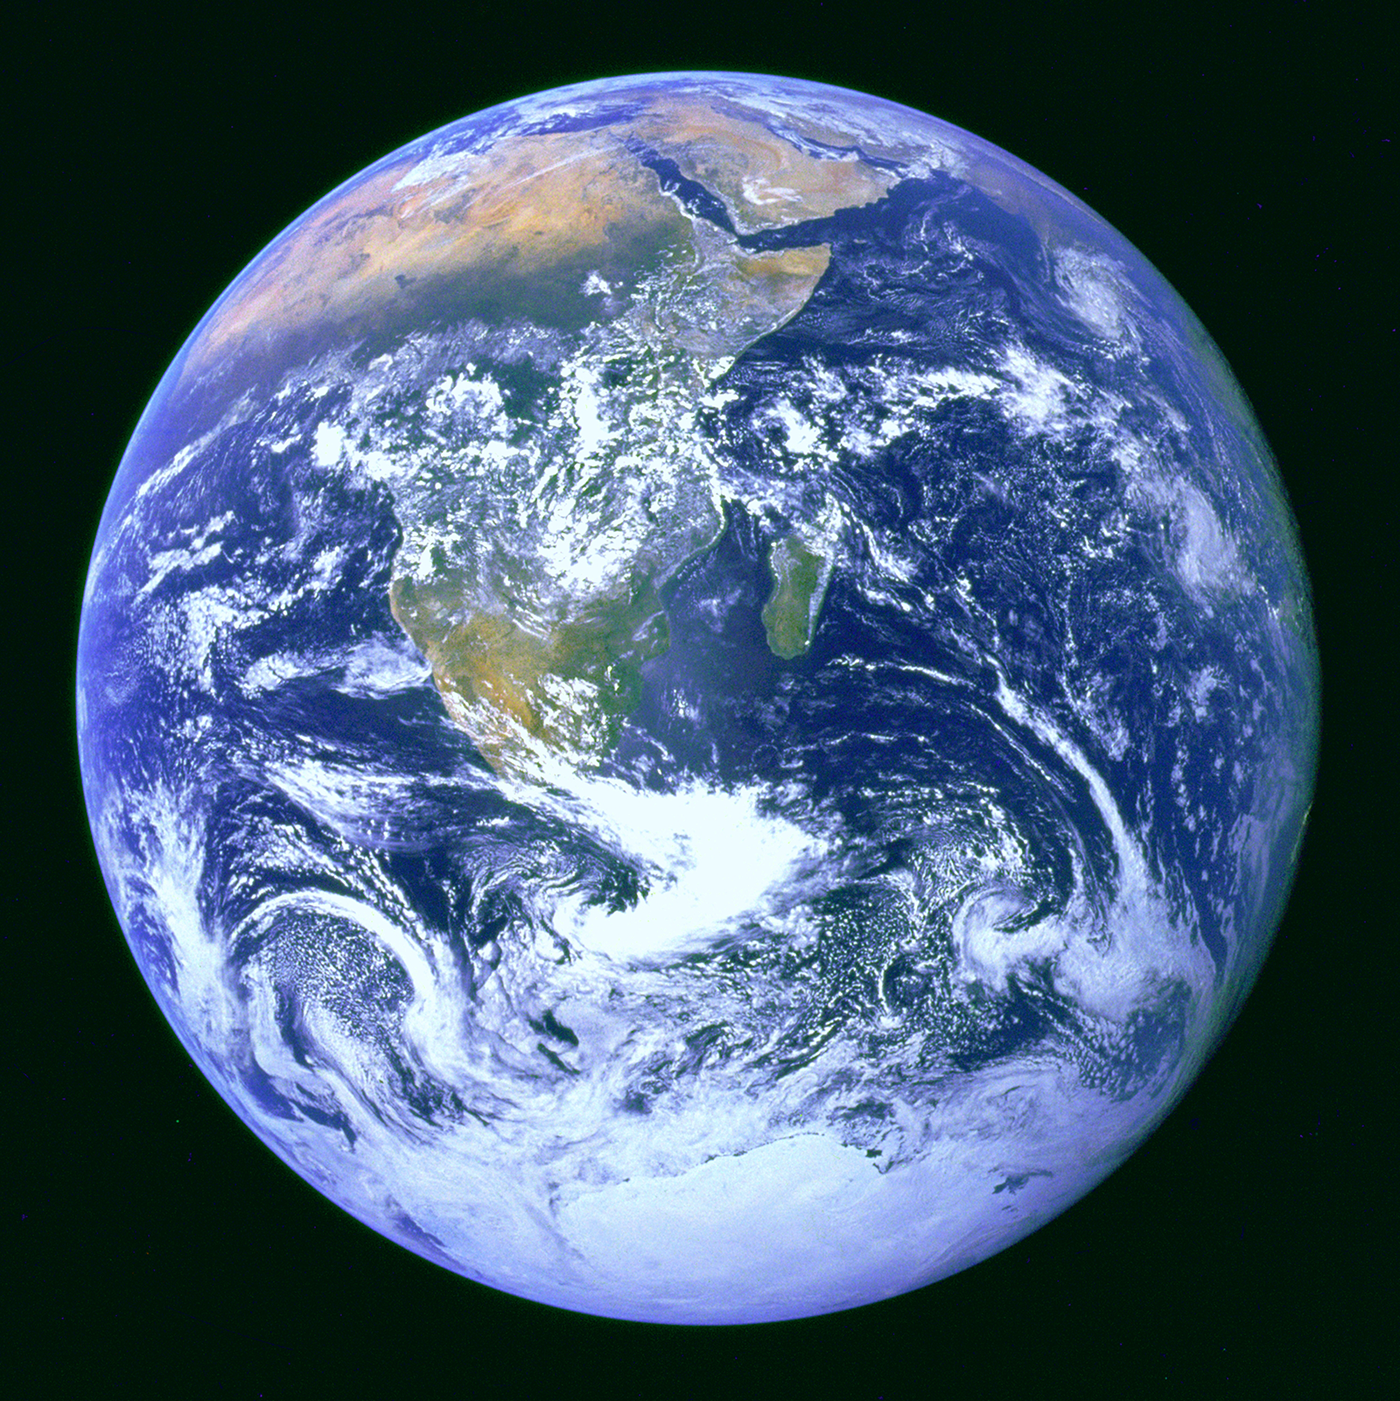
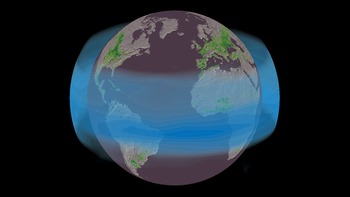
In the sample, creative appropriations of the blue marble image are used to imagine climate engineering. Figure 2 shows a computer animation that visualises the idea of protecting the planet through an artificial shield of reflective aerosols. Another image shows the blue marble as a machine, attached to two vacuum cleaners, visually representing the idea of sucking carbon out of the air by technical means.Footnote 72 We hold that such practices of image manipulation render the idea of manipulating the entire planet both thinkable and more plausible. As Adam Wickberg and Johan Gärdebo argue, ‘media technologies used for creating knowledge about a global environment also influence our alterations of and interventions into that environment’.Footnote 73
Blue marble appropriation. Source: Film still captured from http://www.globalpolicy.science/blog/2018/8/10/publication-measuring-effects-of-geoengineering-on-agriculture-using-volcanoes, copyright Jonathan Proctor, Solomon Hsiang.

In addition, satellite images in the sample are used to render the effects of ocean-fertilisation experiments visible. In such satellite images, the chlorophyll produced by artificially induced plankton blooms is visible in red and yellow. The view from space enabled by multispectral remote-sensing satellites, allows one to trace, observe, and potentially control human experiments with the planet. Satellite imagery here functions as a form of visual proof of the feasibility of climate interventions. Together, the space, satellite, and microscopy images position the Earth/the environment as an external object to be monitored, researched, and controlled.
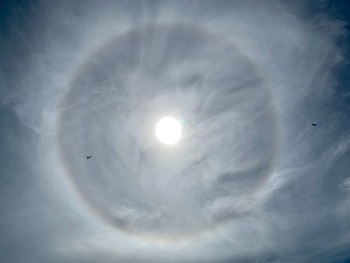
However, humankind as the collective actor in climate engineering discourse is not only looking down on Earth, but also looking up to the sky – as the salience of ‘skyscape’ images in the sample demonstrates (Figure A2 in the Appendix). As James R. FlemingFootnote 74 argues, in skyscape images the sky becomes a projection of human hopes and fears in the face of an open and uncertain future. Some of these images portray the human subject looking up to the sky as a humble yet hopeful one – the uncertainty of the future appears as an opportunity rather than a threat.Footnote 75 Other images in the sample paint a different picture.Footnote 76 These images can be described as ‘anti-skyscapes’: herein dark, menacing skies, thunderstorms, and lightning visually undergird ‘narratives of environmental degradation, despair, disease, dystopia, collapse’.Footnote 77
Figure 3 offers a paradigmatic example of such skyscape imagery. The halo effect shown here is a natural phenomenon caused by cirrus clouds. In this context, it illustrates the idea of intentionally modifying solar radiation, for example through cirrus cloud thinning.Footnote 78 At the same time, all involved researchers expressed the feeling that the halo appeared mystical, beyond comprehension, and even dangerous. This interpretation is supported by the existing literature on the halo as icon in art history, where it represents a divine eye watching over our Earthly activities – oftentimes, an implicit warning to the spectator.Footnote 79 One example is the famous Sun Dog Painting, ‘depicting a halo phenomenon observed in the sky above Stockholm on 20 April 1535’, which was at the time, a ‘rare and unexpected phenomenon’ and ‘considered an astrological sign with eschatological meaning’.Footnote 80
Halo that appears like an eye in the sky. Source: https://commons.wikimedia.org/wiki/File:Halo_optical_phenomenon_in_March_2020_in_Queensland.jpg.

The visual cluster of volcanic images has a similar performative effect of representing both fear of nature as well as hopes for its eventual domestication. On the one hand, images of eruptions are used to illustrate the idea of Stratospheric Aerosol Injection (SAI) as plans to artificially imitate the cooling effect of volcanic eruptions (mimicking nature). As an icon of the human desire to control nature, images of volcano eruptions in fact have a longer history of deployment. For example, Svante Arrhenius’s pioneering work on the greenhouse effect in the early twentieth centuryFootnote 81 crucially relies on volcano imagery. As Barbara StaffordFootnote 82 argues, beginning in the nineteenth century the construction of scientific knowledge about the world would become increasingly based on images rather than on written texts in Western societies.Footnote 83 In the work of nineteenth- and early twentieth-century natural scientists, such imagery fuelled fears of a coming new Ice Age, leading Arrhenius and others to speculate about whether anthropogenic CO2 emissions might be utilised to counter this threat by artificially warming the climate. According to Fleming, this hence foreshadowed much of the current debate about whether or not to manipulate the climate.Footnote 84
On the other hand, these images are representations of the uncontrollable force of nature and of the environment as an external threat to humankind. This becomes apparent, in our view, in the many pictures of volcanoes in our sample, which appropriate a powerful image from the Cold War era: the iconic mushroom cloud (Figure 4).Footnote 85 The resemblance of some of the depicted scenes to war zones – with soldiers and military bases shown in front of massive ash clouds – relates climate engineering to a discourse of security and disaster relief.Footnote 86
Mushroom cloud caused by volcano eruption. Source: Dave Harlow, United States Geological Survey.

One such image that features frequently in our sample is an award-winning photograph by Alberto Garcia of the eruption of Mt Pinatubo in the Philippines in 1991 – a major natural disaster that caused a measurable cooling of the Earth’s surface for almost two years.Footnote 87 The image is dominated by the large ash cloud caused by the eruption, which appears to be moving towards the viewer of the image. At the bottom centre of the image one can see a street along which a blue pickup seems to be fleeing from the ash clouds moving towards the viewer. The image resembles a scene from a disaster movie, and paints the picture of an exceptional and threatening situation. At the same time, however, the visual technology of photography is able to freeze and thus defuse the situation.Footnote 88 In so doing, the photograph enacts the idea of SRM, which is to mimic the cooling effect of volcanic eruptions in a controlled and constant manner. Solar geoengineering is enacted visually as what could be called a routinised emergency.
All visual representations of ‘nature’ discussed so far express a relationship of exteriority between humans and their ‘environment’. However, some images in the cluster construct humans as integral parts of and embedded within their natural environment. Such images use perspective or composition to represent human–nature entanglement. One image in the sample shows a rising wave in front of the skyline of Miami.Footnote 89 While the wave symbolises the vulnerability of the coastal city to sea-level rise, the perspective is crucial here: the viewer is looking at the metropolis from within the wave and in this sense is part of the threat. The composition and perspective paradigmatically represent the contemporary ‘condition of the Anthropocene’, in which humankind is increasingly becoming a threat to itself.Footnote 90
Figure 5 is an example of how images depict human–nature entanglement in a rather hopeful manner. The artwork illustrates the idea of soil enhancement as a method of nature-based climate engineering. A number of insects and earthworms, soil, fungi as well as plants and trees are visible in the foreground, while small smokestacks – as icons of the fossil fuel industry – are visible in the distance. The image thereby represents animals as the acting ‘subjects’ in a ‘natural climate engineering’ programme. The animals are shown in close-up perspective and from straight on, so that the viewer gets the impression of being embedded in ‘nature’ and looking at the smokestacks as insects themselves see them.
Nature-based climate engineering. Source: https://www.nytimes.com/2017/12/02/opinion/sunday/soil-power-the-dirty-way-to-a-green-planet.html, published with kind permission of Eleanor Taylor, copyright 2017.

The images discussed in this section allow to imagine how climate engineering would change the relation between humans and nature. Such visual imaginaries position ‘the human’ – as a universal, collective subject – vis-à-vis ‘the environment’ as its object.Footnote 91 All analysed images are characterised by one repeating theme in imaginaries of planetary futures – that is: the fear of an uncontrollable nature versus hopes for a more harmonious human–nature relationship or the possibility of domesticating nature.Footnote 92 Images that construct the human subject as detached from and in control of ‘the environment’ all revolve around the idea of humankind as a ‘planetary manager’.Footnote 93 In a hopeful image of Earth’s future, humans accept their responsibility for the current planetary crisis and use their technical capabilities to make up for their wrongdoings. Images of nature as a threat, on the contrary, justify human control of the planetary environment as a form of self-defence.
Images of human–nature entanglement are much less prominent throughout the sample. Such images can promote ideas of ‘natural geoengineering’ and of a ‘good Anthropocene’Footnote 94 – on the assumption that humans have always sought to manipulate their environment, and an ‘untouched’ nature thus does not exist. However, images of human–nature entanglement as a threat can also result in pessimistic imaginaries of the future, in which any human attempt to intentionally shape the Earth’s environment would be seen as hubristic.
Images of feasibility
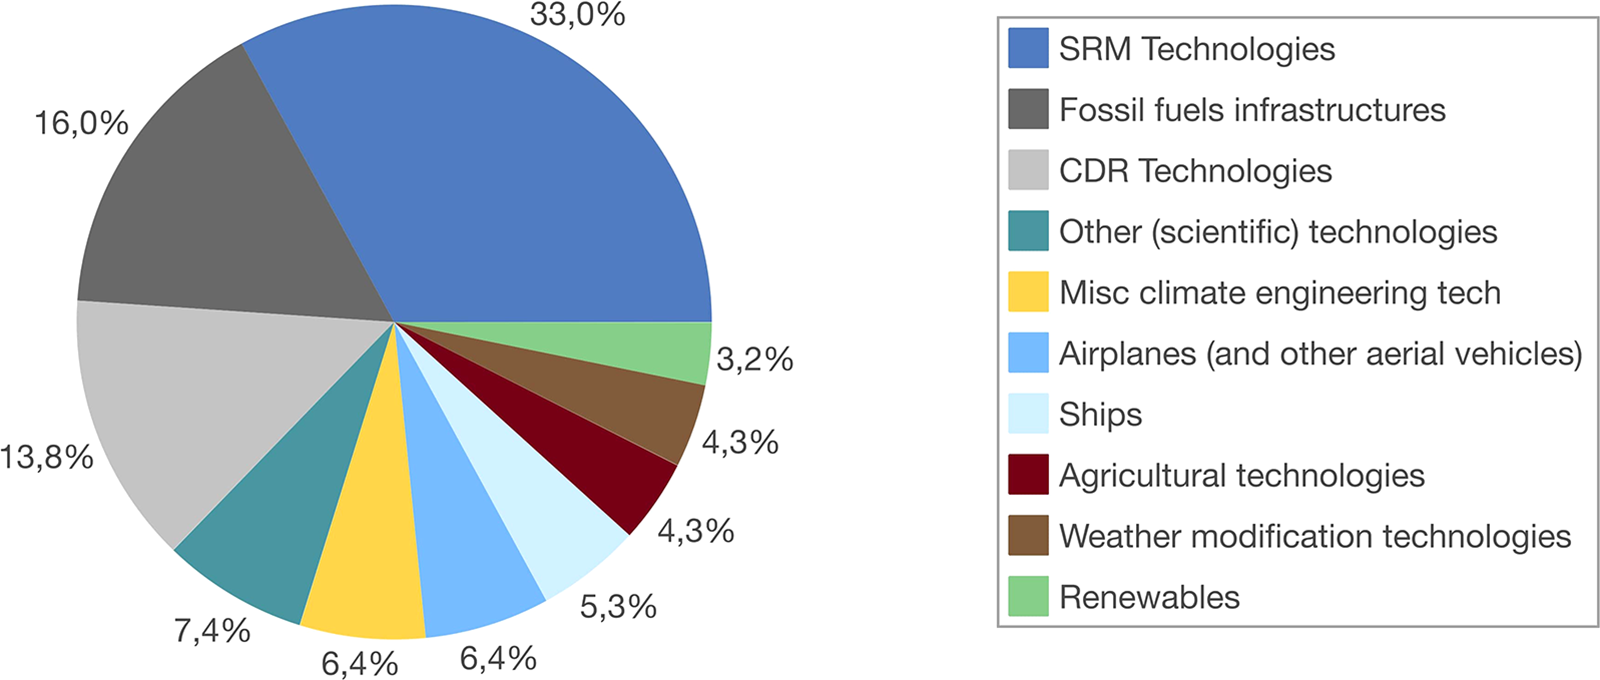
The second meta-theme we identified comprises images of climate engineering as a set of tangible technologies and infrastructures. The largest group of images within this cluster depicts different types of SRM technologies and infrastructures, such as SAI, marine cloud brightening, space mirrors, or roof whitening (see Figure A4 in the Appendix). Visual representations of CDR approaches, such as direct air captures or ocean fertilisation, represent the second-biggest category here. A third cluster comprises overview images that present all kinds of climate engineering technologies within a single frame. Smaller clusters show airborne and marine vehicles of different types, weather-modification (cloud-seeding) technologies, agricultural technologies, research infrastructures, and renewable-energy technologies/infrastructures.
Several scholars have argued that the popular framing of climate engineering as a tangible set of (emerging) technologies could arise with its depoliticisation. Jack Stilgoe, for example, holds that ‘viewed as a set of technologies, geo-engineering resembles no more than a mixed bag of half-baked schemes’.Footnote 95 By treating climate engineering as a ‘thing in the world to be examined’, researchers ‘tend to naturalise it’.Footnote 96 This would strengthen arguments for technological and scientific autonomy and the prevalence of expert assessments of the issue and related research agendas. In a similar vein, Holly Buck has claimed that ‘when we put [geoengineering] in the “technology” box, it becomes the domain of technology experts, and we fail to see what else it is: the social life of the intervention is obscured.’Footnote 97
The mentioned authors make a convincing argument about the depoliticising impact of portraying climate engineering as technology. We would qualify this argument by stressing that the political effects of a technology framing depend on how exactly climate engineering technologies are shown and seen. Isabell Schrickel, for example, analyses how one infographic (Figure 6) became an authorised representation of climate engineering late on in the first decade of the new millennium.Footnote 98
Schematic overview of climate engineering technologies. Source: Rita Erven/SPP1689.

According to Schrickel, such images tend to depoliticise climate engineering by locating various approaches within a single frame – and in fact within a single landscape.Footnote 99 Thereby, such images promote the use of ‘geoengineering’ as a generic umbrella term and erase the differences between highly controversial proposals such as SAI and approaches that are much more politically accepted – such as, for example, large-scale afforestation.Footnote 100 Besides, via various design choices, climate engineering technologies aesthetically resemble renewable-energy ones and so are visually ‘defuturized’Footnote 101 – thus appearing more feasible, while associated risks are concealed.
Our study confirms Schrickel’s findings and shows how the ways of seeing that she describes with regard to climate engineering are popularised through the (re)appropriation of composite images by online news media. In some cases, newspapers hire graphic designers to produce their own composite images that mirror closely the one shown in Figure 6. In others, smaller sections of the digital-overview images are copied and reused as standalone pictures. Finally, many other computer animations, mechanical drawings, and technical illustrations in the sample reproduce the aesthetics and composition of said composite images. The original composite image, thus, becomes a ‘metapicture’Footnote 102 that structures a whole system of visibility of technical climate engineering representations. All images in this system of visibility break down the complexity of climate engineering proposals into a set of very select parameters, thereby detaching them from any social or geographic context. They show such technologies in a generic, often empty environment unlocatable on a political map – a kind of ‘non-space’ that disentangles them from their economic, social, and political contexts.Footnote 103 This visual representation blurs the fact that field trials would have to be conducted somewhere and infrastructures physically built, too. Considering the fierce resistance that new technologies and infrastructures often face from local communities,Footnote 104 this visual framing clearly has a depoliticising effect.
The overview images, technical drawings, and computer animations of future climate engineering technologies (mostly SAI) dominate the early phase of our study period. However, our analysis also revealed that representations of climate engineering technologies would become more diverse over time (see Figure A5 in the Appendix). From about 2015 onwards, images of CDR infrastructures would become much more prominent. Simultaneously, graphic illustrations and computer animations of future technologies became less and less important, while photographic representations of already-existing installations and infrastructures – such as the one shown in Figure 7 – increased.
Hellisheidi geothermal plant: home of a direct air capture test facility. Source: U.S. Department of State.
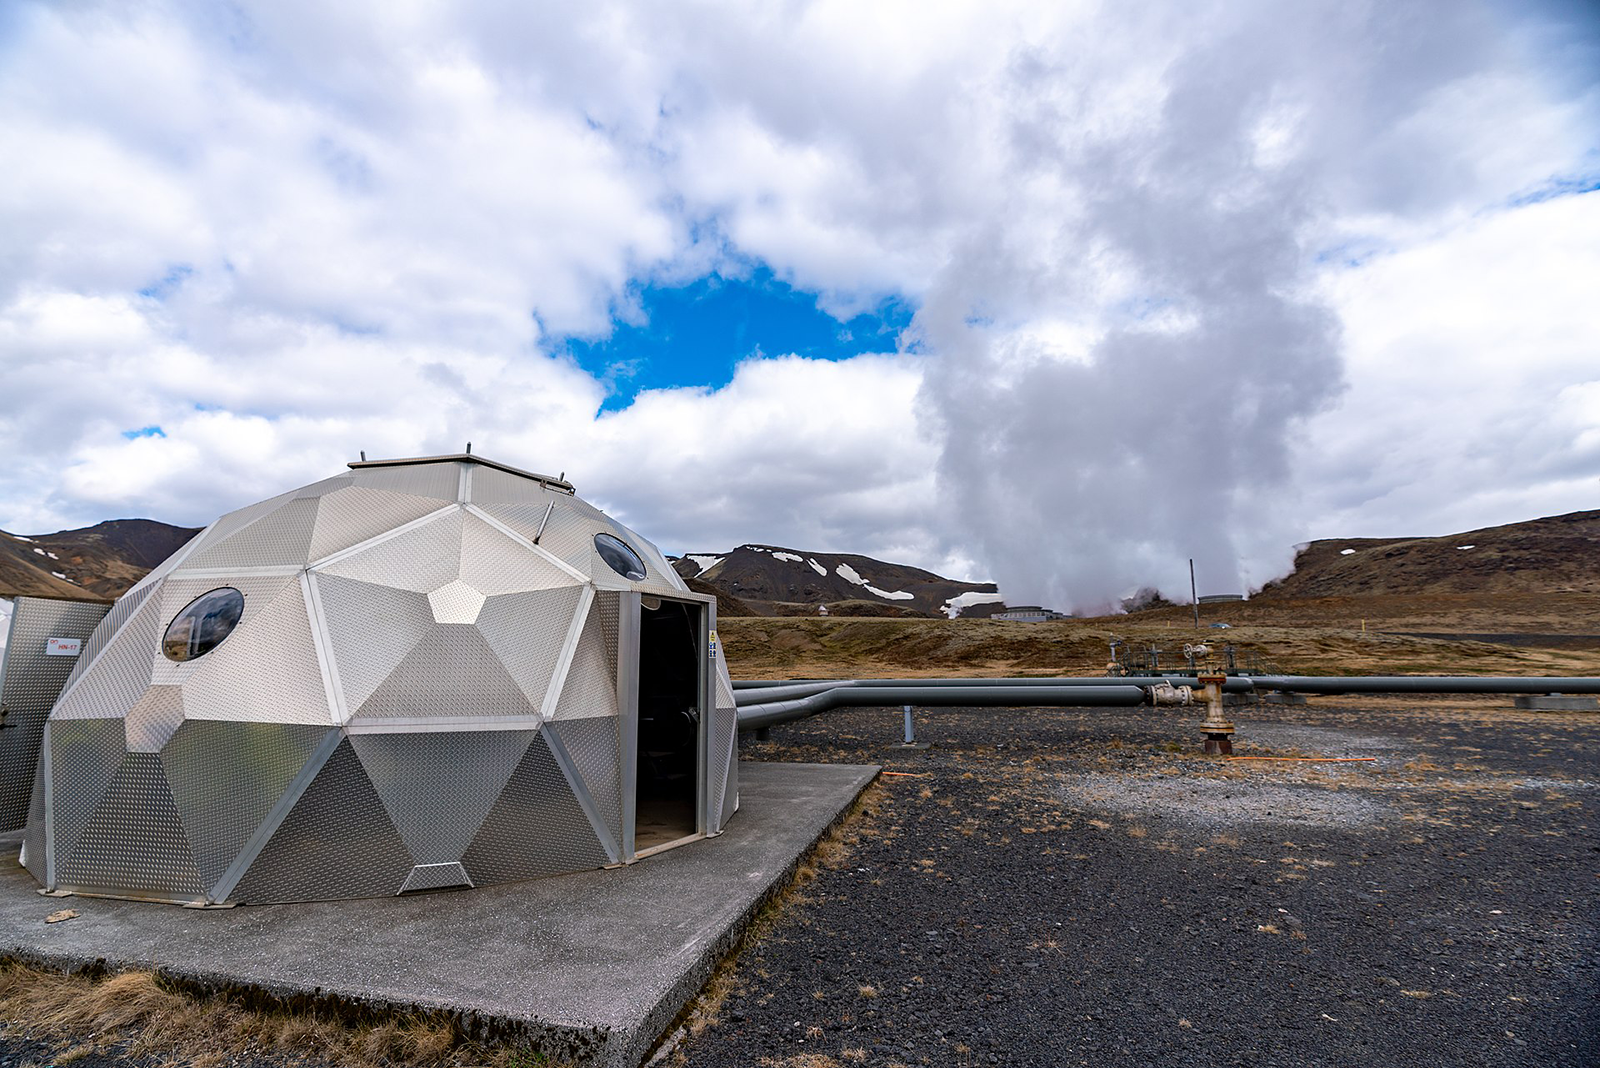
These findings are important because photography’s claim of mimetic representation constructs climate engineering technologies as technically feasible, and renders them present. In these images climate engineering is not some future vision but appears as something that can be collectively imagined (and in fact be touched – as done by workers or engineers that are shown in some of the images).Footnote 105 As Buck argues, ‘the moment of infrastructural development is [also] a flash point for contestation … . Until the infrastructure is imagined, we’re still in the sci-fi fantasy space of floating cities.’Footnote 106 As soon as climate engineering is visually transformed from the realm of sci-fi into a potential infrastructural endeavour, the feasibility,Footnote 107 and desirability of these projects become subject to public debate. The visibility of climate engineering infrastructures is, then, a crucial facilitating condition for their politicisation.Footnote 108
Just like the ‘environment’ imagery discussed above, infrastructure images have a performative effect by ordering the represented technologies in specific ways. First, they order existing as well as imagined technologies in relation to the abstract category of ‘climate engineering’. As different scholars have noted, due to public criticism of climate engineering the question of which exact technologies are associated with it has become a highly political one.Footnote 109 Many images lump together all sorts of technical interventions into the environment located in the aforementioned non-space. Others, on the contrary, zoom in on concrete projects as tangible, locatable, and thus contestable infrastructure. Second, the images discussed in this section order climate engineering approaches in a temporal sense by visually defuturising related technologies. Both forms of ordering climate engineering approaches crucially affect how they can be approached and contested by political and civil society actors, which brings us to our third visual theme: agency.
Images of agency
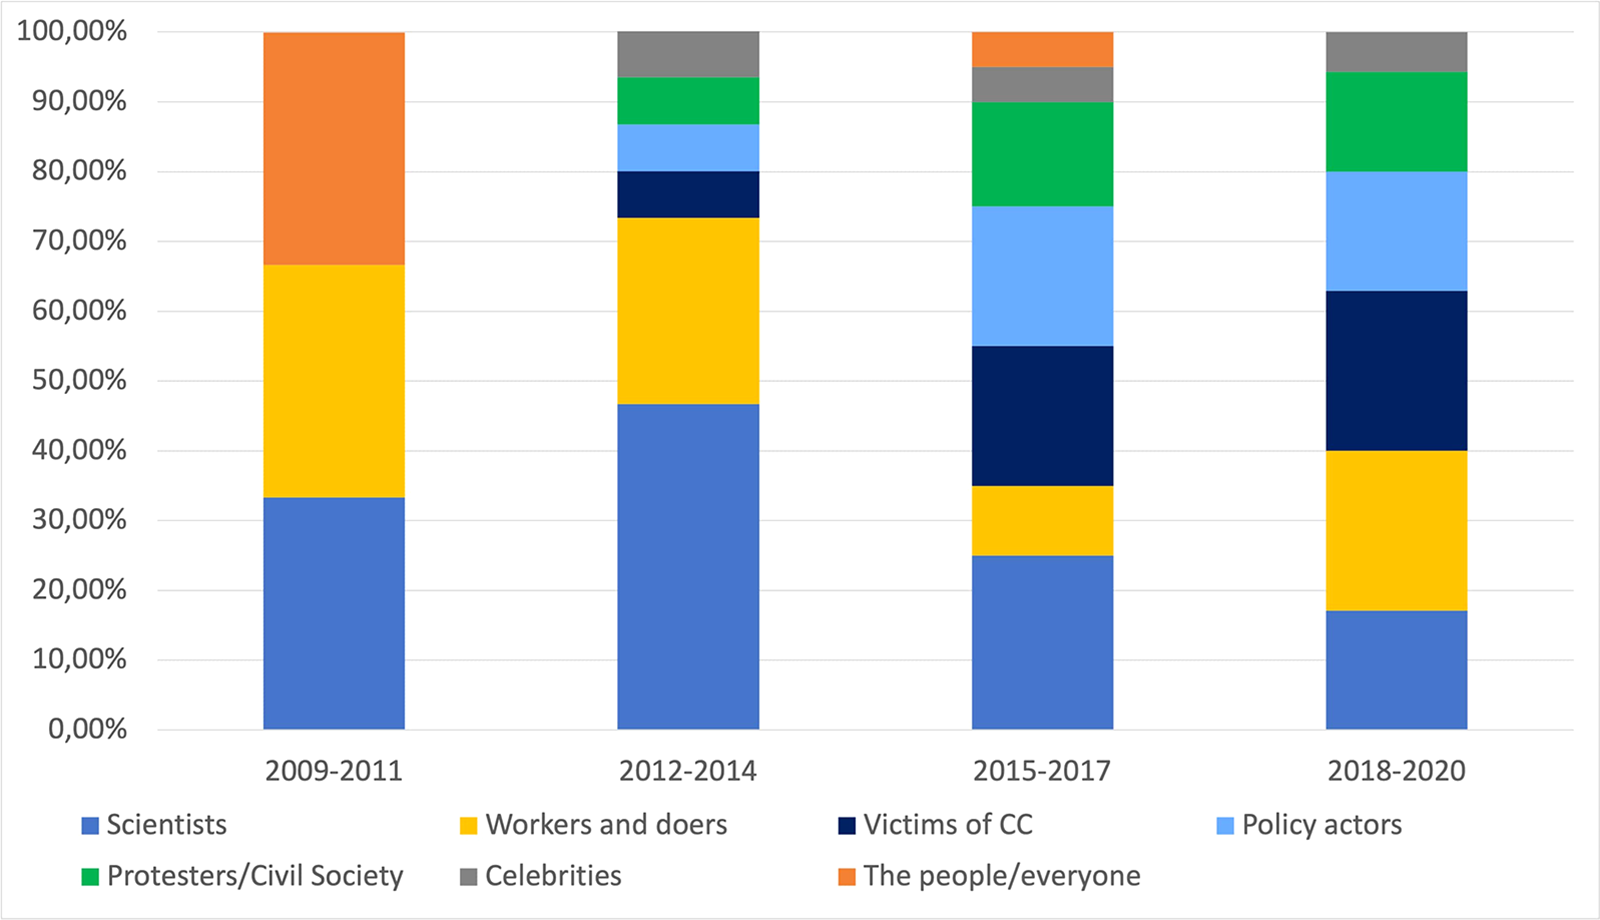
A third major theme emerges out of images of people. The most dominant categories herein include (in order of magnitude): images of scientists; people depicted as ‘workers and doers’ (such as engineers, construction workers, and other individuals portrayed as being active); and those visually framed as ‘victims of climate change’ (see Figure A6 in the Appendix). Further smaller clusters of images depict political actors, civil society actors, protesters as well as ‘celebrities’ – such as Al Gore or Bill Gates.
These images allow one to imagine the concrete actors potentially involved in climate engineering projects as well as related forms of political order and power. Several of these images draw on the universal figure of the human as planetary manager (see above) and further specify this subject position. This works, for example, through symbolic images that show the iconic blue marble in the hand of a human actor, who is either constructed as a scientist, doctor, or engineer. A good example is an image showing a blue marble being held by a human hand covered in blue protective gloves.Footnote 110 The hand seems to belong to a white-coded person – wearing a facemask and protective suit, and visible in a background only blurry in nature. The hand here symbolically represents power and control over the planet, while the human actor in the distance is further specified as an anonymous (white) scientist.
The subject position of the planetary manager is further reinforced by photographic portraits of scientists, representing the largest category of images in the people cluster. The portrayed individuals are almost exclusively senior, white men engaging in activities such as lecturing and gesturing (explaining) as well as various kinds of research – often in natural surroundings. Such imagery frames white, male scientists as experts capable of acting and speaking on the topic of climate engineering.Footnote 111
Other images in the sample, contrariwise, position scientists as tragic anti-heroes or villains. Such images reproduce stereotypical figures in popular culture such as the simpleton or the mad scientist.Footnote 112 The latter is a (usually male-coded) anti-hero figure popular in comics or animated movies – a genius striving for world domination by means of technological innovation, but doomed by his insatiable lust for power. The simpleton, on the contrary, is a tragic figure in folklore whose repeated foolish actions invoke both mirth and pity.
Figure 8 combines the two figures of the mad scientist and the simpleton. The artwork uses visual metaphors and symbols, including the notion of a heated planet (the blue marble has turned red) as patient and hammer, wrench, and lamp as symbols of climate manipulation. The fact that the mad scientist’s arm is entangled with the lamp’s wire points to a tragic ending to the depicted story. Such pop culture representations of scientists have a long tradition, as Glen S. AllenFootnote 113 shows for the US, but would become particularly powerful in the context of the Cold War nuclear-arms race. They frame scientists alternatively as heroes or villains, and are thus open to both critical as well as affirmative positions on climate engineering.
The figure of the mad scientist. Source: https://www.economist.com/books-and-arts/2013/11/23/stopping-a-scorcher, published with kind permission of Daniel Pudles, copyright 2013.

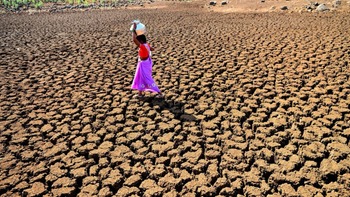
All discussed visual representations of scientists, as heroes as well as villains, present them as active subjects. This is in stark contrast to the visual framing of people in the Global South. Here, the discourse on climate engineering reproduces crisis narratives that revolve around the racialised figure of the climate victim (Figure 9).Footnote 114 Such people are portrayed during passive and everyday activities (such as waiting or sitting) in poor and hostile climatic environments – such as droughts or storms.Footnote 115 Most of those so depicted are women or children – often from an aerial perspective, too. The faces of these people are often veiled or hidden; in contrast, scientists’ faces are often visible and captured from a straight on or low angle. We interpret these visual representations as a form of social ordering, establishing the presumed position of passive and helpless ‘climate victims’ in the Global South vis-à-vis the active and rational scientists of the Global North.Footnote 116
Stereotypical representation of a ‘climate victim’. Source: https://commons.wikimedia.org/wiki/File:D%C3%A9sertification_des_terres.jpg.

Climate engineering visuality, thus, incorporates a powerful icon of both broader climate change and humanitarian discourses: ‘the climate victim’. However, the appropriation of images also always implies a shift in meaning – as images become related to novel issues and imaginaries. Figure 9 is not only a paradigmatic depiction of the climate victim but, in our view, also visually expresses the idea of climate engineering as a form of ‘fixing’ or ‘repair’Footnote 117 – here represented by the cracked soil on which the person is seen walking. One can thus observe a shift of the object of governmental intervention. Rather than addressing (potential) climate victims through humanitarian measures or development policies, governmental interventions now seek to protect vulnerable populations by intervening in and fixing their physical environment.
Both subject positions – of the scientist as planetary manager and of the climate victim – are consistent with the planetary frame discussed above. Another dominant cluster of images, however, traverses this binary actant structure and presents images of people involved in concrete activities associated with climate engineering. These are marked by work clothing and other visual signifiers, including protective helmets and vests. Such people are, furthermore, depicted during physical labour and bodily activities. Images here focus on the engineering part of climate engineering, and promote an understanding of it as activity rather than as scientific debate or abstract vision. An image that appears repeatedly in the sample shows several men spreading a white, reflective sheet to cover a glacier in the Swiss Alps.Footnote 118 Images such as this illustrate the notion of SRM – or more concretely, albedo modification – as a tangible and situated practice. Again, the people shown in this category are mainly white- and male-coded. One notable exception is the images of farmers seemingly situated in the Global South.Footnote 119 Here climate engineering is visually related to agricultural practice – through so-called forms of ‘natural geoengineering’ including the production of sunlight-reflecting crops or biomass production for ‘Biomass Energy Carbon Capture and Storage’ systems.
As Figure A7 in the Appendix shows, the visual discourse on actors of climate engineering has diversified considerably over time. From about 2016 onwards, this discourse would not only contain more images of people in general but those depicted also became more diverse in nature. Images of political and civil society actors as well as entrepreneurs and celebrities became more prominent. One could, thus, argue that the visual discourse would not only become more diverse but also more political, in the sense that it increasingly dealt with different forms of contestation.
The political actors in our sample include participants of UN negotiations and high-ranking US politicians.Footnote 120 Although this constructs climate engineering as an instance of political debate, it also symbolically delegates agency and responsibility to a few unilateral or multilateral entities alone. This is visually reinforced by political symbols such as the UNEP logo or the US flag, thus situating climate engineering politics in the realm of the international. Simultaneously the images, in showing policy actors during negotiations and while giving talks, underscore the contested nature of climate engineering.
Also visual depictions of celebrities and entrepreneurs feature more frequently in our sample over time. One emblematic image, for example, shows Al Gore and British entrepreneur and philanthropist Richard Branson.Footnote 121 Branson, who is the founder of the Virgin Group and engages in several philanthropic initiatives promoting technical solutions to the climate crisis, is smiling and throws a beach ball that looks like the Earth – as seen from space – up in the air, while Al Gore is watching him playing. The caption indicates that the scene was captured at the launch of the Virgin Earth Challenge on ‘carbon-capture solutions’. At a more symbolic level the activity portrayed implies that these two powerful philanthropists and well-known politicians are quite literally playing around with the planet.
In addition to visual depictions of political and economic actors, one can observe the increased circulation of images of mass protest from about 2016 onwards. These include depictions of climate movements such as Fridays for Future marches as well as Extinction Rebellion protests. Some of these images, contrariwise, depict anti-geoengineering protests. One such example shows people marching through the streets of Berlin holding a banner that says, ‘Stop geoengineering’.Footnote 122 One protester in the back carries a flag that appropriates the iconic ‘smiling sun’ symbol of the anti-nuclear movement combined with the slogan ‘Chemtrails? No Thanks’. Another image shows a protester wearing white scrubs and diving goggles, which sarcastically appropriates the image of the mad scientist discussed above.Footnote 123 They are holding up a sign that says ‘Big Business, Bad Science’, therewith lambasting climate engineering as a profit-driven elite project. Taken together these images portray the increased civil society contestation and hence politicisation of climate engineering.
To sum up, by visually ordering people in relation to the idea of climate engineering the analysed imagery produces several subject positions and associated forms of agency. Many of the images in the people category cohere with the planetary frame discussed above. Climate engineering in this imaginary represents a form of power over the entire planet, exerted by a smaller group of scientists and (to a lesser degree) entrepreneurs/philanthropists. This form of planetary power is legitimised by a humanitarian discourse that constructs people in the Global South as helpless victims of the climate crisis. Other images, especially those circulating since 2016, break with this binary agency structure. Such imagery frames climate engineering as a situated practice, as an object of international negotiation and political dispute, and as a site of protest and contestation.
Discussion: Imag(in)ing geoengineered worlds
By comparing our findings across the three visual clusters and in line with the existing literature on climate engineering discourses and imaginaries, one can ultimately identify several political implications to the visual discourse of climate engineering. First, our findings confirm and qualify existing research on climate engineering discourses and imaginaries. For example, several studies have identified ‘planetary management’ as a dominant frame in the discourse on climate engineering.Footnote 124 Our analysis validates this observation and shows how the planetary frame is visually enacted not only through satellite and space images of Planet Earth but also through artistic depictions of scientists as doctors and visual metaphors of the planet as machine or patient. In addition, photographs of nature, which feature prominently in our sample, support the ‘human as planetary manager’ frame. As Ingrid Hoelzl and Rémi Marie argue, the perspectival image – paradigmatically represented by nature or landscape photography – ‘has been a foundation of humanist ideology, which located Homo sapiens at the center of an inanimate, dumbfounded “world” in need of human ruling’.Footnote 125 Technology-enabled ways of seeing climate engineering, thus, locate the latter in a modernist episteme – one in which the environment is positioned as a passive object vis-à-vis the viewing subject.
Another dominant perspective in our sample discussed already by earlier studies of climate engineering discourses is the (planetary) ‘emergency frame’Footnote 126 – here enacted through images of collapsing glaciers, burning forests, or the depiction of climate victims. Furthermore, earlier studies also identified the nature–society relationship as a dominant frame in climate engineering discourses – including representations of climate engineering as mimicking nature or by ‘framing through natural analogy’.Footnote 127 As we have shown in this study, images can be very powerful examples of ‘framing by natural analogy’ (volcano images), or framing nature–society relationships (sky- and landscape images).
The political implications of these framings have been outlined by others.Footnote 128 Planetary management frames, for example, can strengthen the focus on global approaches, while ruling out more localised proposals for climate interventions. Emergency frames could naturalise climate engineering research as a necessary ‘Plan B’ and thereby depoliticise the issue. Similarly, framing by natural analogy could normalise related approaches and thereby silence criticism. What our study adds to these findings is how these political effects crucially depend on visual technologies and the performativity of images. It is one thing to argue (verbally) that there is a climate emergency or that the Earth is a fragile, interconnected system; it is something else entirely to actually be able to see and show it. Images, in this sense, work as a visual proofing that give weight to dominant climate engineering imaginaries.
Furthermore, the methodological approach developed here allows for tracing changes in climate engineering imaginaries and underlying ways of seeing over time. There are only a handful of existing studies that have looked into such changes in discourse to date. One notable exception is the analysis of Samantha Scholte, Eleftheria Vasileiadou, and Arthur C. PetersenFootnote 129 who find that the framing of geoengineering in news media discourse is becoming more diverse over time and that ‘overly deterministic frames such as the techno-fix and benefits for society are decreasing’. This is consistent with the observation made in this article, which found a similar diversification regarding climate engineering visuality.
In all three visual clusters discussed above, the visual discourse tends to become more diverse from the mid-2010s onwards (see Figures A3, A5 and A7 in the Appendix). The analysed images now increasingly show concrete actors such as politicians, entrepreneurs, and celebrities, existing infrastructures and technologies, contestation and protest, and human–nature entanglements. In such imagery the world is not a single object of human intervention any more, but a political space populated by international organisations, national policymakers, entrepreneurs, and a transnational civil society. We hold that this shift is to be welcomed, because it allows for another form of contestation: it enables us to engage with and criticise climate engineering as a concrete (economic, political, ecological) project conducted by tangible actors. Engaging with visuality is thus a way of exposing and contesting imbalances and injustices in the international politics of climate engineering (research). This holds especially true for the dominant visual representations of agency identified in our analysis, which can reinforce the ‘unevenly empowered epistemic communities’Footnote 130 in climate engineering research dominated by research centres in the Global North.
On the other hand, our findings also go beyond earlier text-centred analyses of climate engineering imaginaries. Many images in our sample, at least in our interpretation, not only work at a semantic but also an affective level – that is, by provoking emotive reactions on the part of the viewer. Images of collapsing glaciers, raging wildfires, or erupting volcanoes, for example, raise fears of major ecological collapse and a nature out-of-control.Footnote 131 Images of climate victims or the iconic starving polar bear can invoke feelings of pity meanwhile. Such emotions might then be used to mobilise for or against climate engineering research, for example by linking fears of a coming climate breakdown to imaginaries of climate engineering as the appropriate emergency exit here. Our analysis thus points to a crucial affective dimension to climate engineering debates – one that has, however, so far received little attention in the scholarship.Footnote 132
Finally, as Michele-Lee Moore and Manjana Milkoreit note, human beings’ ability to imagine the future is considerably shaped and constrained by shared collective memories of the past.Footnote 133 We agree, and would add to this contention that visual icons and conventions make up a crucial part of this collective memory. As we have been able to show in this article, climate engineering images rely on popular icons – including the volcanic eruption and resulting mushroom cloud, the blue marble image, or the mad scientist. Thus, we hold that future imaginaries of climate engineering and related orders rely to a considerable degree on Cold War iconography. Furthermore, what is remarkable, at least in our view, is the dominance of photorealistic depictions of climate engineering technologies compared to more speculative, futuristic imagery and ‘science fiction’ aesthetics. Even computer animations of speculative technologies like SRM visually resemble already-existing technologies like renewable-energy infrastructures.Footnote 134
In short, the future world being imagined here is a projection of the one of the past or present. In her important work on ‘imaginal politics’, Bottici describes an apparent paradox to the contemporary era: on the one hand public discourse is saturated with images due to digital technologies and social media, on the other there seems to be an increasing lack of imagination. Politics, Bottici claims, ‘seems to lack imagination in the sense of the capacity to question what is given’.Footnote 135 Following Bottici, the proliferation of climate engineering images in news media and online platforms might, thus, paradoxically limit the space available to imagine radically different climate engineering futures.Footnote 136
Conclusion
In this article we set out to rectify a critical blind spot in the literature on discourses and imaginaries of climate engineering. We argued that images and other visuals in the public discourse on climate engineering not only shape how the public imagines such approaches but also the possible (future) worlds in which these would be deployed. Ipso facto we asked which imaginaries of world-orders and social-orders are being produced and reproduced through the dominant forms of climate engineering visuality.
We first developed a theoretical understanding of visual politics accounting both for the semantic as well as for the performative effect of such visuality. To operationalise this perspective, we then outlined a novel analytical approach combining computer-assisted quantitative content analysis of larger clusters of images with more fine-grained, interpretive visual-discourse analysis. Equipped with this framework, we thereafter provided the first systematic empirical study of climate engineering visuality in public discourse.
We identified three major thematic image clusters: of nature/the environment; of people/human actors; and of technologies/infrastructures. Based on the more fine-grained interpretive analysis, we showed that these clusters each deal with a different set of questions: The first cluster comprises images depicting the fundamental relationship between humans and nature. The second cluster is made up of images that show concrete climate engineering infrastructures and technologies, thus addressing the issues of the feasibility and acceptance of such projects. The third and final major cluster of images relates to questions of political agency and power. Together, these three questions constitute what we have termed ‘the visual politics of climate engineering’.
A preliminary answer to our original research question is herewith now possible. Images and other visuals open up several ways of seeing climate engineering. In the article’s final section we discussed how these ways of seeing interact with dominant imaginaries of climate engineering, as well as their political implications. First, images can reinforce already-dominant framings or imaginaries of climate engineering by adding visual proof to their underlying claims. Such dominant frames, for example, imagine climate engineering as a form of planetary management or as a ‘Plan B’ to deal with the looming climate emergency. Second, images can facilitate the contestation and hence politicisation of climate engineering when they enable one to see and show actual projects or actors. Third and finally, following Bottici we argued that the increasing circulation of climate engineering images in news media and across online platforms might also serve to constrain the imagination. As most of the images analysed draw on established visual icons of the past and present to visualise a climate-engineered future, it becomes harder for us to imagine any real alternative – for example, the possibility that climate engineering technologies might in fact be deployed in a global order that is radically different from the present one.
Additional research is required to further test and advance the findings of this article. This could include impact studies that scrutinise how different audiences perceive the outlined visual clusters and test whether these public perceptions differ from our interpretations. Other works could trace, meanwhile, the circulation of dominant imagery beyond the mediasphere in further studying how images become reappropriated and can function as boundary objects linking different discourses and social fields. Finally, further research on alternative ways of seeing and imagining climate engineering is something desirable, especially as including works that develop such approaches through inter- and transdisciplinary cooperation.
Acknowledgements
Authors are listed in alphabetical order. We would like to thank three anonymous reviewers, as well as Helena Carrapico, Werner Distler, David Shim, Neil Renic, Nina Perkowski, and Holger Niemann for valuable feedback on earlier versions of this article. We are grateful to Annika Reinke for supporting our research project through literature searches and the compilation of empirical sources.
Appendix
Climate engineering articles in the sample over time.

Images of the human-nature relationship.

Images of the human-nature relationship over time.

Images of technologies and infrastructures.
Images of technologies and infrastructures over time.

Images of people.

Images of people over time.


 Open access