

Introduction
Traditionally, meteorological measurements (including the amount of storm snow) have proven more useful for avalanche forecasting than measurements of the mechanical properties of the snowpack (Reference PerlaPerla, 1970). This is surprising since the slab avalanches that constitute most hazardous avalanches begin with shear failure of an identifiable weak layer in the snowpack (Reference McClungMcClung, 1987). Accordingly, several researchers have used shear frames (Fig. 1) to test the shear strength of the weak snowpack layers that were judged most likely to cause slab avalanches, and the results of such tests have been used to calculate stability parameters for comparison with avalanche activity on the tested slopes or nearby slopes (Reference RochRoch, 1966a; Reference Sommerfeld and KingSommerfeld and King, 1979; Reference Stethem and TweedyStethem and Tweedy, 1981; Reference Conway and AbrahamsonConway and Abrahamson, 1984; Föhn, Reference Föhn1987b). In contrast, our study compares stability parameters with avalanche activity reported within 15–30 km of the test site.

Fig. 1. Testing the shear strength of a weak snowpack layer with a shear frame and manual force gauge.
Although this study compares stability parameters with avalanche activity, other meteorological factors such as increasing air temperature cannot be ignored in operational avalanche forecasting. It is likely that such warming contributes to dry slab failure by reducing slab stiffness (Reference McClungMcClung, 1987) rather than by reducing the shear strength of the active weak layer. Hence, the stability parameters used in this study will not show any effect from warming although slab stability may be reduced by increases in solar radiation or air temperature.
Stability Parameters
Various stability parameters can be derived from the ratio of shear strength Σ to overburden stress σv . One of the simplest that has been used operationally by two highway avalànche control programs in Canada is the stability factor SF, where
in which overburden stress σv is determined from a vertical series of density ρ samples of known height h as
where g is the acceleration due to gravity.
SF can be determined for either level study plots or slopes, although in practice its use in Canada has been limited to level study plots (Reference Schleiss and SchleissSchleiss and Schleiss, 1970). The transitional value of SF, which distinguishes values associated with stability from values associated with instability, must be determined empirically since there is no critical ratio of horizontal (or slope-parallel)’ shear strength to vertical stress that can be derived theoretically.
Reference FöhnFöhn (1987b) has proposed a stability index S which is the ratio of shear strength Σs corrected for normal load and the statistical effects of shear frame size to the shear stress σxz adjusted for slope angle ψ
(The x and z axes are down-slope and slope-perpendicular, respectively.) Since slab failure is believed to begin with slope-parallel shear failure (e.g. Reference McClungMcClung, 1987) and S is the ratio of slope-parallel shear strength to slope-parallel shear stress, values of S near 1 are expected for snow slopes that are just at the point of releasing natural slab avalanches.
The shear strength Σ∞ of a large area ( > 1 m2) is less than that obtained using a small shear frame because of the greater probability of a weakness or flaw over the larger area (Reference Sommerfeld, King and BuddingSommerfeld and others, 1976). According to Reference SommerfeldSommerfeld (1980), the size correction for a 0.025 m2 shear frame is given by Σ∞ = 0.65 Σ0.025 .
Shear strength corrected for normal load is Σ∞ + σzz tanϕ where σzz = σvcos2ψ is the normal load and the “internal friction” is tanϕ. Reference RochHowever, Roch’s (1966b) empirical formula for tanϕ is dependent on the grain structure of the weak snow layer and Reference MellorMellor (1975) questions the concept of internal friction for shear failure of snow. Nevertheless, an increase in shear strength — as measured by a shear frame — with normal load has been reported by Reference RochRoch (1966b) and Reference Perla and BeckPerla and Beck (1983). Consistent with Reference RochRoch (1966a) and Reference FöhnFöhn (1987b), we used Reference RochRoch’s (1966b) correction for granular snow given by tanϕ = 0.4 + 0.08Σ∞ where Σ∞ is in kPa.
Reference FöhnFöhn (1987b) used the slope-parallel shear stress σxz = σvsinψcosψ for the slope being tested. However, since our objective was to apply stability parameters to slopes of various angles many kilometres away from the study slope, we used ψ = 35° (a typical slope inclination for slab avalanche starting zones) to obtain S35 as

which, in terms of SF, is

Between the low values of a stability parameter that are associated with unstable snow and the high values that are associated with stable snow, there is a critical or transitional value. In practice, the transition consists of a band of values because of differences in snow conditions between avalanche starting zones and measurement sites and because of the variability of shear strength and overburden measurements. Because stability parameters are used in conjunction with other observations, we elected to base the width of the transition band on the 90% confidence band for the stability parameters. The width of this band can be approximated from the shear strength measurements which are much more variable than the density measurements. Typically, values of SF and S 35 were based on seven shear frame tests that have an average coefficient of variation of 15%. This corresponds to a 90% confidence band given by ±10% of the transitional value.
Study Area
Shear frame tests were performed at a level study plot and on small, nearby, 15–30° slopes near the tree line at 1900 m elevation in the Cariboo Mountains of western Canada. This site is central to the terrain used by Mike Wiegele Helicopter Skiing, a region of more than 5000 km2. Although some of the avalanches used in this study were 30 km from the study plot, most were within 10–15 km, an area that also includes part of the Monashee Mountains. Avalanche starting zones in the area are at elevations of 1500–3000 m.
Most snow storms were accompanied by wind from the south, southwest or west which increases the amount of snow deposited on the north, northeast and east slopes. The small test slopes near the study plot face north, northeast and east as do many of the slide paths on which avalanches were reported.
Test Methods
The two stability parameters are compared with the avalanche activity reported daily by the helicopter skiing guides. The effectiveness of the parameters for large-scale avalanche forecasting is assessed on the basis of the number of days that the parameters were consistent with the reported avalanche activity.
Shear Strength
Before the shear frame test is performed, the active weak layer, that is, the weak layer most likely to be associated with slab avalanches, is identified with a tilt board test (NRCC/CAA, 1989), shovel test (NRCC/CAA, 1989), rutschblock test ( Reference FöhnFöhn, 1987a) or profile of snow layers (NRCC/CAA, 1989). Overlying snow is removed, leaving approximately 40–45 mm of undisturbed snow above the active weak layer (Fig. 1). A 0.025 m2 stainless steel shear frame with sharpened lower edges is then gently inserted into the undisturbed snow so that the bottom of the frame is within 5 mm, and preferably within 2 mm, of the active weak layer (Reference Perla and BeckPerla and Beck, 1983). A thin blade is passed around the sides of the frame to ensure that surrounding snow is not in contact with, and possibly bonding to, the frame. The force gauge is attached to the cord linking the two sides of the frame and is pulled smoothly and quickly ( < 1s) resulting in a plane failure in the weak layer just below the base of the frame. Shear strength is determined by dividing the maximum load on the force gauge by the 0.025 m2 area of the frame.
We rejected the results of tests for which the fracture was not approximately planar or deviated beyond the active weak layer. Average shear strength, based on sets of at least seven shear frame tests, was determined in the level study plot on 70 days and on nearby study slopes on 76 days.
Avalanche Activity
Avalanche occurrences were compiled by type of release (slab or loose), size, type of trigger (natural, cornice or skier-released), moisture, aspect, elevation and location (NRCC/CAA, 1989) using mainly information obtained from helicopter skiing guides operating in the study area. On a given day the portion of the total study area observed for avalanche occurrences varied from 0–40% depending on visibility conditions, number of guides skiing (typically 5–12) and their operating locations. The research team also compiled occurrence data for slopes visible from near the study plot, particularly during bad weather when helicopter skiing operations were grounded.
An avalanche day was defined as a day on which measurements for stability parameters were made in the level study plot or on nearby slopes and on which one or more naturally released dry slab avalanches potentially harmful to people (class 1.5 or larger according to NRCC/CAA, 1989) were reported. (During and immediately following winter storms there are often many small avalanches of size class 1 or smaller that do not constitute a serious danger and are too numerous to record in detail.) Similarly, a non-avalanche day was defined as a day on which measurements for stability parameters were made but no large (class 1.5 or larger) naturally released dry slab avalanches were reported.
Most reported avalanches were within 10–15 km of the study area, but some were more than 30 km away. Cornice-triggered avalanches were excluded from the study since some cornices are powerful triggers which may release relatively stable slabs. Slab avalanches triggered by skiers and helicopters were recorded but there were too few of these avalanches to use in the analysis.
Some avalanche occurrence data were unavoidably influenced by weather and operational factors. Typically, this happened when visibility was limited or there was no helicopter skiing near the location of the avalanche for one or more days after an occurrence. Some avalanche fracture lines and/or deposits were estimated to be several days old when they were first observed. Consequently, for most of these avalanches, the date of occurrence was estimated. In the following analysis, the stability parameters are compared to avalanche activity both including and excluding avalanches with estimated dates.
For the level study plot, stability parameters were obtained on approximately 25 avalanche days and 45 non-avalanche days (17 avalanche days and 53 non-avalanche days excluding avalanches with estimated dates). On nearby study slopes, stability parameters were obtained on 25 avalanche days and 51 non-avalanche days (20 avalanche days and 56 non-avalanche days excluding avalanches with estimated dates).
An avalanche day is considered to be correctly predicted when one or more large natural dry slab avalanches were reported and the value of the stability parameter was below the transition band. A non-avalanche day is considered to be correctly predicted when no large natural dry slab avalanche was reported and the value of the parameter was above the transition band. The transition band and the forecasting success of each stability parameter were determined from the percentage of avalanche days correctly predicted (P A) and the percentage of non-avalanche days correctly predicted (P N)- Avalanche days and non-avalanche days corresponding to values of the stability parameter within the transition band were not used to calculate P A or P N.
To avalanche forecasters, a high P A and a high PN are both important. However, non-avalanche days include days when dry slab avalanches occurred but were not large (size < class 1.5) and days when poor visibility restricted the helicopter skiing operation and hence the reporting of avalanches. Because of the uncertainty associated with non-avalanche days, the parameters are assessed, based on Ρ which weights P A three times as much as P N
We acknowledge, however, that other weighting factors (> 1) would also be appropriate.
Ρ was maximized by trial and error to obtain the transitional value for SF and S 35. These values are given in Table 1 for four cases determined by two factors: treatment of avalanches with estimated dates (included versus excluded) and measurement location (level study plot versus slope).
Table 1. Comparison of stability parameters

Results
Avalanche activity is plotted against concurrent values of SF and S 35 for those days in which measurements were made in the study plot in Figures 2 and 4, respectively, and for those days in which measurements were made on study slopes in Figures 3 and 5. Avalanche activity in Figures 2–5 includes avalanches with estimated dates. The transition band between unstable and stable ranges of the stability parameters is also shown in these figures.

Fig. 2. Avalanche activity and concurrent values of the stability index SF measured in a level study plot. Each point represents the number of large (potentially harmful to people) natural dry slab avalanches reported for a given day and the value of the stability index for the same day.

Fig. 3. Avalanche activity and concurrent values of the stability index SF measured on a study slope.

Fig. 4. Avalanche activity and concurrent values of the stability index S35 measured in a level study plot.
The percentages of avalanche days and non-avalanche days that were successfully forecast are tabulated in Table 1 along with the weighted percentage of correctly forecast days Ρ which ranged from 75–87%. These percentages do not include days with values of the stability parameter within the transition band.
We did not visit the sites of the large dry slab avalanches that occurred naturally when the stability parameters were above their transitional values, but expect that some such avalanches resulted from loading of lee slopes by local winds or by intense snow showers.
Including or excluding avalanches with estimated dates has little or no effect on the transitional values of the stability parameters and the effect on Ρ is not systematic and is limited to 5 percentage points.
The transitional values for stability parameters measured on slopes are lower than for the corresponding transitional value measured in the study plot. This is likely due to additional snowfall (overburden) on the lee slopes used for shear frame tests compared to the level study plot. The percentage of correctly forecast days is higher, by an average of 7 percentage points, for SF or S 35 determined in the level study plot compared to the same parameter determined on study slopes. We suspect this apparent advantage of the level plot over study slopes is due to the more consistent thickness of snowpack layers in the level plot.
For the stability parameter SF, the percentages of correctly forecast days PA , P N and P, averaged over the four cases presented in Table 1, are within one point of the percentages for S 35. This is not surprising since the correction term in Equation (5), cot 35 tanϕ, only ranged from 0.58 to 0.87 (based on the shear strengths Σ 0.025 that ranged from 0.07 to 4.03 kPa). Hence, S 35 is an almost linear function of SF (Equation (5)) and the correction for normal load does not improve P A, P N or P. Apparently SF, which is simple enough to be calculated by mental arithmetic, is as good a forecasting parameter as S 35.
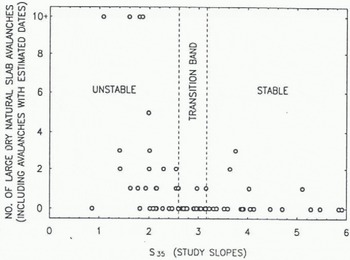
Fig. 5. Avalanche activity and concurrent values of the stability index S35 measured on a study slope.
Transitional values for SF ranged from 1.56 to 1.78, slightly greater than the critical value of 1.5 used by Rogers Pass (Reference Schleiss and SchleissSchleiss and Schleiss, 1970). This greater transitional value may be due to the increased variability in snowpack conditions encountered within the large forecast area of the present study.
Although SF has no theoretically based transitional value, transitional values for S 35 near 1 are expected when shear frame tests are performed in critical areas of avalanche starting zones (Reference FöhnFöhn, 1987b). In the present study, since shear frame tests were not performed in such critical areas, higher transitional values for S 35 (Table 1) are expected. However, Föhn’s values of S, calculated for specific avalanche slopes, averaged 2.3 for the slopes which avalanched naturally, implying a transitional value greater than 2.3. While such a difference between theoretical expectation and field observations could be due to shear frame tests being done at locations other than the weak zones (Reference FöhnFöhn, 1987b) from which shear failures are believed to spread (Reference Conway and AbrahamsonConway and Abrahamson, 1984), it could also indicate that the normal load correction is inappropriate.
Case History
Between 31 January 1991 and 7 February 1991, a storm accompanied by generally south winds deposited snowfall equivalent to 130 mm of water in the study plot and substantially more in the lee-slope starting zones. In most areas, this snow was deposited on top of a weak layer of surface hoar and resulted in numerous large dry slab avalanches. During this period, instrumentation near the study plot recorded air temperature continuously and wind speed (when the anemometer was not rimed) as shown in Figure 6. The accumulating snow load over the surface hoar layer and the stability parameters were monitored daily. The following case history shows how shear frame stability parameters can complement meteorological measurements for avalanche forecasting.

Fig. 6. Air temperature, wind speed, snow load over a buried layer of surface hoar, stability factors SF and S35 based on shear frame tests of the buried surface hoar layer, and avalanche activity for 31 January to 7 February 1991. Meteorological and snowpack measurements made at 1900 m in the Cariboo Mountains.
On 31 January, when the stability parameters were well below their respective transition bands, there were hundreds of small (class 1 or smaller) natural dry slab avalanches. On 1 February, the first large (class 1.5 or larger) natural dry slab avalanche was reported. From 2 to 5 February, snowfall and large natural dry slab avalanches continued. No large natural dry slab avalanches were reported for 6, 7 or 8 February although snowfall continued on 6 and 7 February. The reduction in air temperature from −1°C to −6°C which occurred on 5 February may have contributed to the absence of large avalanches on 6 February; however, the marked increase in the stability parameters to values above the transition band indicates an increase in strength of the weak surface hoar layer. (It is unlikely that the absence of large dry slab avalanches on 6 February is due to surface hoar that was removed from starting zones by previous avalanches since hundreds of starting zones within the study area had not released.) On 7 February, the load increased more rapidly than the shear strength of the surface hoar layer, and as a result the stability parameters dropped into their transition bands. In situations such as occurred on 6 and 7 February, shear frame stability parameters can help the forecaster understand the interaction between loading and the shear strength of active weak layers.
Conclusions
On 75–87% of days, SF and S 35 were effective predictors of whether one or more natural dry slab avalanches large enough to injure, bury or kill a person were likely to occur, or whether the snow stability was marginal. SF and S 35 are comparable in performance but SF is easier to calculate. Either of these two stability parameters appears to be effective for large-scale avalanche forecasting when used in conjunction with established techniques including avalanche observations, meteorological measurements, observations of snowpack stratigraphy and slope tests.
The stability parameters SF and S 35 performed better when based on measurements from a level study plot characterized by uniform snowpack layers than when based on measurements from relatively small, safe lee slopes.
Acknowledgements
We are grateful to the Natural Sciences and Engineering Research Council of Canada and Mike Wiegele Helicopter Skiing for financial support, to D.M. McClung and R. A. Sommerfeld for helpful comments on the paper, and to M. Shubin and J. Hughes for their careful field measurements, often under difficult conditions.


