The metabolic syndrome is a complex condition related to various co-morbidities such as diabetes, hypertension, hyperlipidaemia, obesity and CVD(Reference Shin, Lee and Lim1–Reference Yanai, Tomono and Ito3). In recent years, the morbidity associated with the metabolic syndrome has increased. Lifestyle-related diseases caused by the metabolic syndrome may influence the quality of life. Eating habits are associated with the metabolic syndrome(Reference Fumeron, Lamri and Abi Khalil4,Reference Beydoun, Gary and Caballero5) . In addition to the metabolic syndrome, sarcopenia is also associated with dietary habits(Reference Bloom, Shand and Cooper6).
In mammals, the central circadian clock is controlled by light in the suprachiasmatic nucleus; it regulates 24-h cycles in biological rhythms and regulates peripheral organs(Reference Ishida, Kaneko and Allada7). The biological clock in the liver is known to be highly influenced by diet(Reference Kobayashi, Oishi and Hanai8). Diet is a major stimulus for the synchronisation in peripheral organs. The major clock genes Clock (circadian locomotor output cycles kaput), Bmal1 (brain and muscle Arnt-like protein), Per (period) and Cry (cryptochrome) are all transcription factors. These genes form a negative feedback loop that show 24-h rhythm(Reference Ishida, Kaneko and Allada7). Clock genes are expressed in almost every organ of the human body, and each organ shows its own rhythm. The regulation of clock genes in each organ is involved in the regulation of organ metabolism. For example, Rev-erba (nuclear receptor subfamily 1, group D, member 1) which regulated by Bmal1, is involved in lipid metabolism in peripheral tissues(Reference Martelot, Claudel and Gatfield9).
Numerous reports have demonstrated that disordered eating habits result in obesity and several metabolic diseases(Reference Maruyama, Sato and Ohira10–Reference Yahia, Achkar and Abdallah13). Recent studies have shown that irregular eating habits induce dyslipidaemia by disrupting circadian oscillations(Reference Shimomura, Takahashi and Shimizu14,Reference Yamajuku, Okubo and Haruma15) . The timing of meals, especially breakfast, plays an important role(Reference O’Neil, Byrd-Bredbenner and Hayes16). Skipping breakfast has been reported to increase the risk of the metabolic syndrome and obesity(Reference Kutsuma, Nakajima and Suwa17) and to increase the risk of lifestyle-related diseases(Reference Yokoyama, Onishi and Hosoda18,Reference Bi, Gan and Yang19) ; daily breakfast eaters showed a reduced risk of hypertension compared with infrequent breakfast eaters(Reference Ofori-Asenso, Owen and Liew20). Modern dietary patterns, such as the Western diet and irregular eating behaviour, are important contributors to the epidemic of lifestyle-related diseases. The Western diet, known to be a high-fat diet, has been reported to disrupt feeding behaviours and circadian rhythms in mice(Reference Kohsaka, Laposky and Ramsey21). In our previous study, disrupted circadian oscillations and increased body weight were observed in rats fed a high-fat diet combined with time-shifted feeding(Reference Shimizu, Hanzawa and Kim22). To clarify the role of skipping breakfast on lipid metabolism, a normal diet was adopted in the present study. The feeding efficiency ratio of mice is known to be higher than that of rats(Reference Yan, Combs and DeMars23,Reference Kunle, Atawodi and Taiwo24) . Mice are also known to exhibit higher energy metabolic rates than rats(Reference Hussein25) and to respond more to dietary conditions. The aim of this study was to clarify the impact of the skipping breakfast regimen (SBR) with a normal diet.
Methods
Animals
The animal experiments were approved by the Nagoya University Animal Care Committee (No. 2018011901). The experiments were performed in accordance with the guidelines for the Care and Use of Laboratory Animals at Nagoya University. Thirty-six male C57BL/6J mice were purchased from the CLEA Japan Inc. The mice were maintained in cages (23 (sd 1)°C) and kept under a 12-h light/dark cycle at each zeitgeber time (light: ZT 0–12, dark: ZT 12–24). During the experiment, the mice were allowed ad libitum access to water. Temperature data loggers (KN Laboratories Inc.) were implanted into the abdominal cavities of 7-week-old male mice. After 3 d of recovery from surgery, mice were randomly divided into control (n 9) or SBR (n 8) groups according to body weight and food intake. Another nineteen mice were divided into control (n 9) or SBR (n 10) groups at the same time. Mice were fed AIN-93G for all experimental periods. The control mice were permitted access to food during ZT 12–24. The SBR mice were permitted access to food during ZT 16–24. Body weight and food intake were measured daily. All mice were kept under breeding condition until just before sacrifice. Decapitation was used for sacrifice method. Decapitation was carried out without anaesthesia due to excluding an effect of anaesthetics. Blood was harvested from cut part. During day 14 to day 15, mice were killed every 4 h at ZT 2, 6, 10, 14, 18 and 22 (n 3 per time point). At each time point of sacrifice, blood, liver, adipose tissues and muscle tissues were harvested and frozen at –80°C for further analysis. Two weeks of experimental period altered the peripheral circadian rhythm by dietary intervention(Reference Kobayashi, Oishi and Hanai8) and changes in energy expenditure were clearly observed until 4 h after active phase begun(Reference Hatori, Vollmers and Zarrinpar26). Based on the results of present studies, we set 4 h of SBR with susceptible to reflect the impact of SBR.
Measurement of body temperature
Seven-week-old mice were implanted with the data logger into the abdominal cavity, as described above. Body temperatures were recorded at 10-min intervals during the experiments. Data loggers were collected at the time of sacrifice, and the Rh Manager programme (KN Laboratories Inc.) was used to analyse temperature data.
Biochemical analysis
Serum TAG and cholesterol levels were measured as described previously(Reference Sun, Hanzawa and Umeki27). Briefly, TAG and cholesterol levels were measured using the Triglyceride E-test kit and Cholesterol E-test kit (FUJIFILM Wako Pure Chemical Corp.). Serum insulin and corticosterone levels were measured using ELISA kits (Mouse Insulin ELISA kit; Morinaga Institute of Biological Science Inc.; Corticosterone ELISA kit; Assaypro).
RNA preparation and real-time quantitative PCR
Total RNA from the liver, epididymal adipose tissue and plantar muscles of mice were prepared using the method described by Chomczynski and Sacchi(Reference Chomczynski and Sacchi28) or TRIzol Reagent (Invitrogen). Complementary DNA was synthesised using kits (Takara Bio Inc. and Toyobo). Gene expression was determined using the real-time quantitative PCR. PCR was performed using the Step One Plus Real-Time PCR system (Thermo Fisher Scientific) using the SYBR Green method (Thermo Fisher Scientific and Toyobo). Apoe in the liver and 18S rRNA in the other tissues were used as the internal controls. Hepatic Apoe was unaffected by dietary sources in previous study and was used for normalisation(Reference Oda, Nozawa and Hitomi29). A brief description of the gene groups analysed by qPCR is as follows. Clock genes: Bmal1, Clock, Per1, Per2, Cry1, Cry2, Dec1 (differentiated embryo chondrocytes 2), Dec2, Rev-erba, Rora (nuclear receptor retinoic acid-related orphan receptor-α), E4bp4 (E4 promoter-binding protein 4), Dbp (D site of albumin promoter binding protein), Hlf (hepatic leukaemia factor) and Tef (thyrotroph embryonic factor). Lipid metabolism-related genes: Acly (ATP citrate lyase), Fas (fatty acid synthase), Acc (acetyl-CoA carboxylase), Srebp1c (sterol regulatory element-binding protein-1c), Ppara (peroxisome proliferator-activated receptor α), Pparg (peroxisome proliferator-activated receptor γ), Mtp (microsomal TAG transfer protein), Elovl6 (elongation of very long chain fatty acids protein 6), Atgl (TAG lipase), Fgf21 (fibroblast growth factor 21) and Adn (adiponectin). Muscle differentiation-related genes: Myod (myogenic determination protein 1), Myog (myogenin). Muscle atrophy related genes: Atrogin-1 (muscle atrophy F-box 1) and Murf-1 (muscle-specific RING finger protein 1). Apoptosis gene: Bcl2 (B-cell/CLL lymphoma 2). Primer sequences are listed in online Supplementary Table S1.
Periodic analysis
Diurnal variations in body temperature, serum parameters and gene expression were analysed using the JTK_CYCLE software(Reference Hughes, Hogenesch and Kornacker30). Significant differences in periodicity were determined at P < 0·05. To ensure the reliability of the results of the non-parametric JTK_CYCLE analysis, a parametric cosinor analysis was also performed for comparison(Reference Ohkura, Oishi and Sakata31). The comparison of acrophase by two methods is shown in online Supplementary Table S7. Those were similar in the most of cases. Therefore, results were mentioned with mainly JTK_CYCLE.
Statistical analysis
The results are presented as mean with their standard error of the mean. Body weight, organ weight and food intake were assessed using Student’s t test. Statistical significance was set at P < 0·05. Statistical analyses were performed using the SPSS software (IBM).
Results
Skipping breakfast regimen increased body weight gain
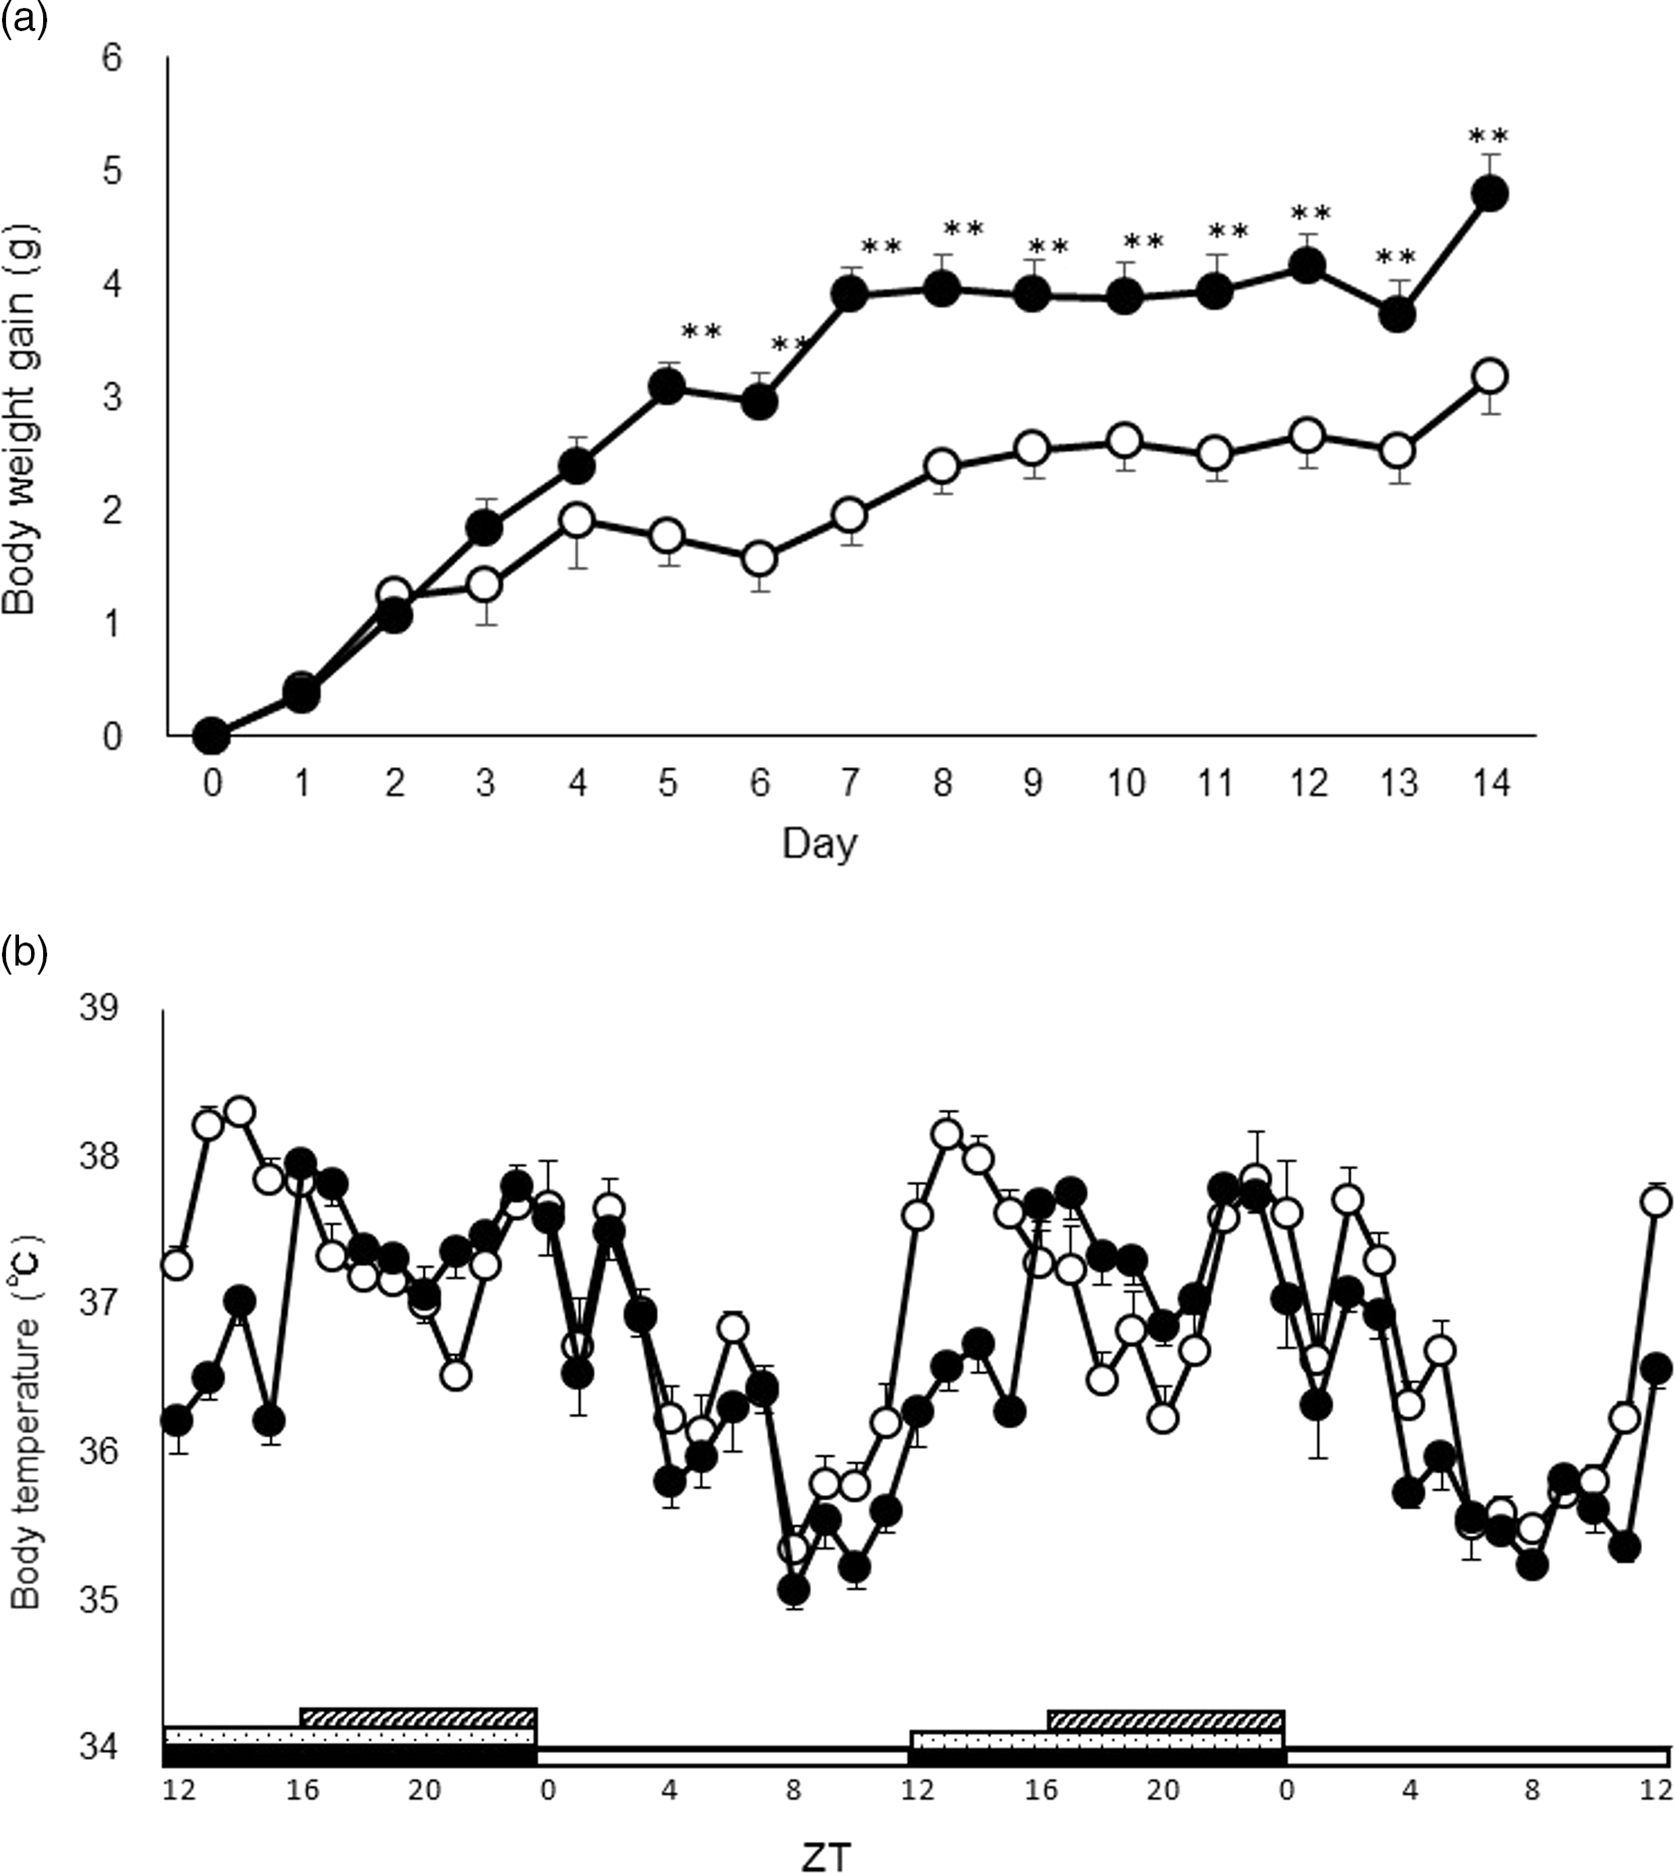
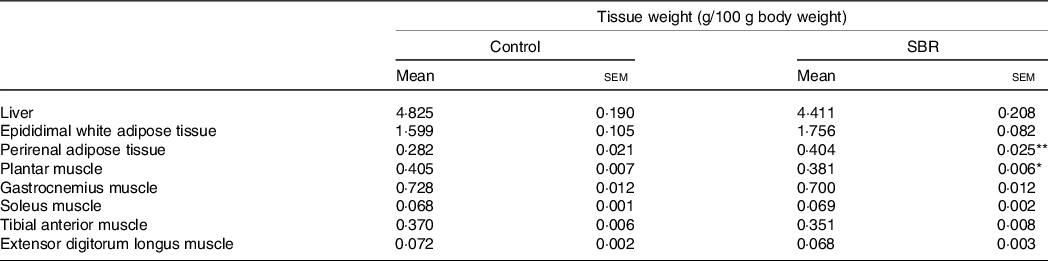
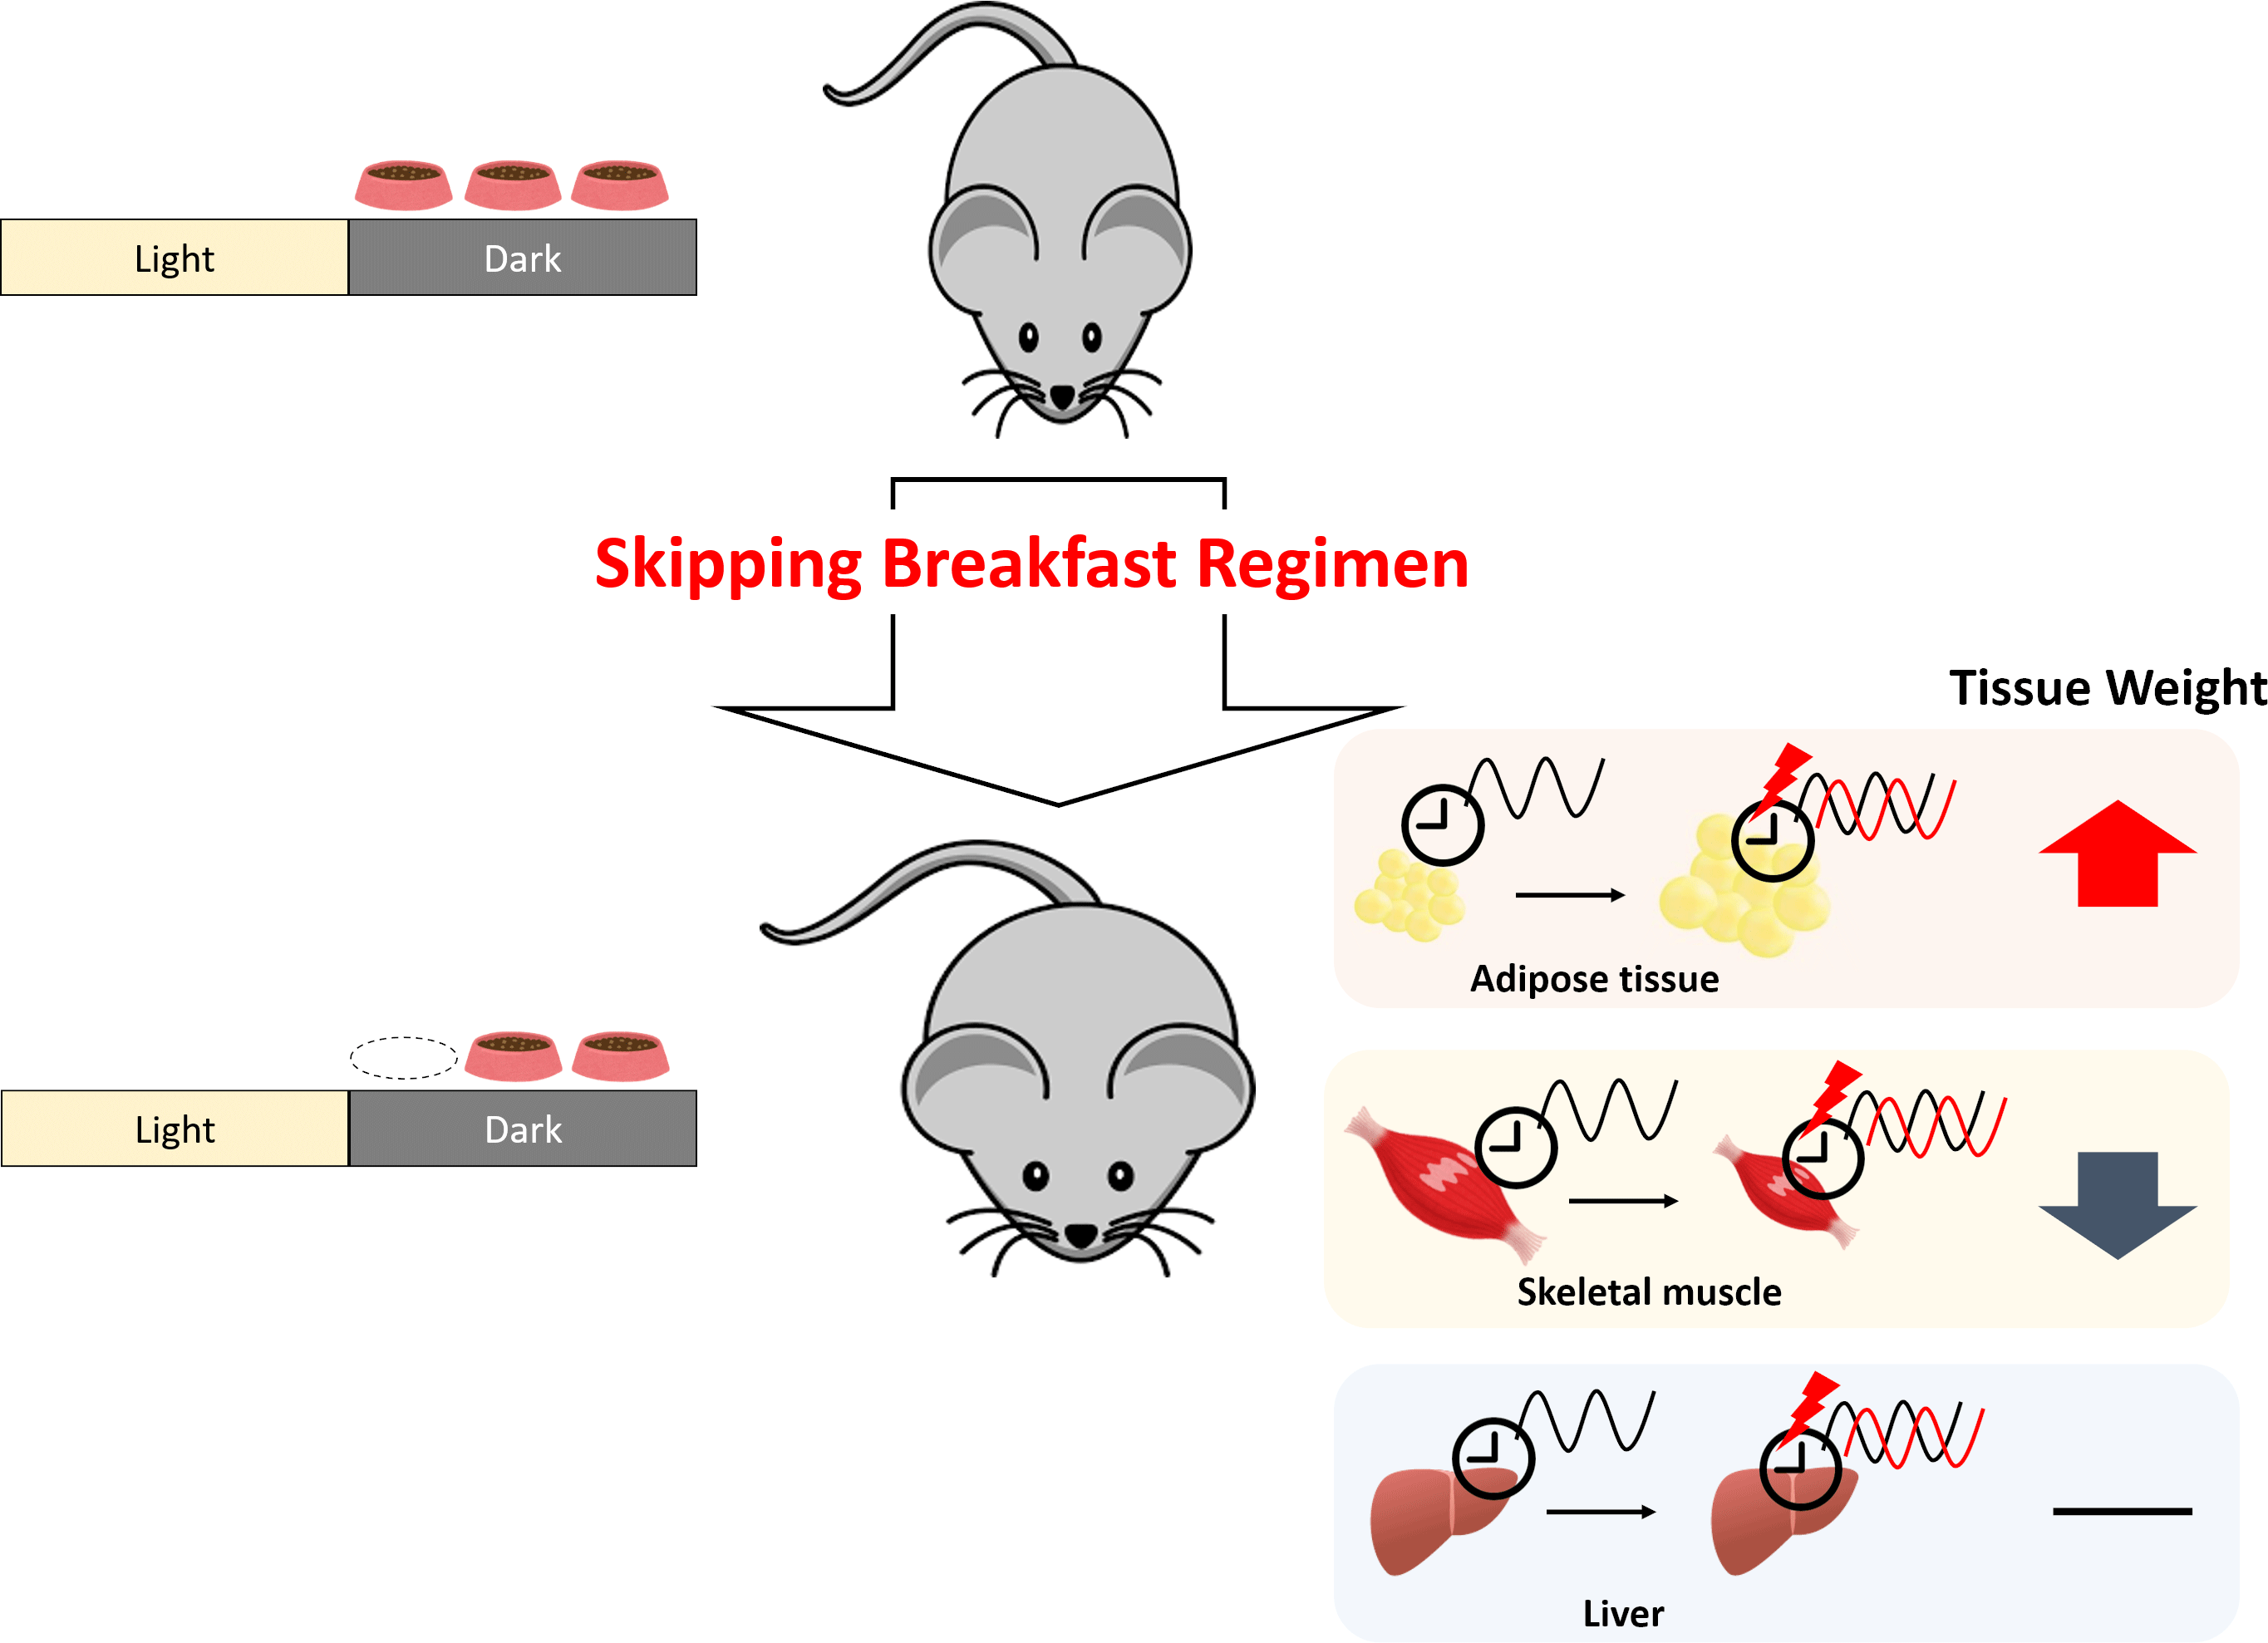
Compared with the control mice, the body weight gain of SBR mice significantly increased from day 5 onward (Fig. 1(a)). No differences were found in the total food intake between the groups (online Supplementary Fig. S1). As shown in Table 1, the weight of perirenal adipose tissue was higher in SBR mice than in control mice. There were no statistical differences in liver weight between the control and SBR mice. These results indicate that SBR increased body weight and adipose tissue weight. In contrast, plantar muscle weight significantly decreased and tibial anterior muscle weight tended to be lower in the SBR group than in the control group (Table 1).
SBR increased body weight gain and delayed rising body temperature in mice. (a) Body weight gain was measured for 14 d. The values are means with their standard error of the mean. **P < 0·01 (Student’s t test); n 18. The open circles represent control mice, and the closed circles represent SBR mice. (b) The core body temperature was analysed using the data logger. The body temperature data were analysed using the hourly average for 2 d from day 14 to day 15. The open circles represent control mice, and the closed circles represent SBR mice. The light periods are shown with open bars (ZT 0–12), and the dark periods are shown with closed bars (ZT 12–24). The dot pattern bar represents the control feeding time (ZT 12–24), and the striped bar represents the SBR feeding time (ZT 16–24). The values are means with their standard error of the mean; n 8–9. SBR, skipping breakfast regimen; ZT, zeitgeber time.

Changes in tissue weights in the SBR and control groups (Mean values with their standard errors of the mean)

n 18. Control: normal diet ad libitum during the active phase (ZT 12–24); SBR: normal diet time-restricted feeding (ZT 16–24).
* P < 0·05.
** P < 0·01 (Student’s t test).
Skipping breakfast delayed the rise in body temperature
The circadian rhythm of body temperature is mainly controlled by the suprachiasmatic nucleus (Reference Morf and Schibler32). To determine the effects of SBR on body temperature variation, we analysed the oscillations in body temperature over 24 h in the data logger-implanted mice. The rhythmicity of body temperature was observed in both control and SBR groups (control: P < 0·001, SBR: P < 0·001). The amplitude of the rhythm was enhanced in the SBR group compared with the control group (control: 0·496, SBR: 0·919). The body temperature of the control mice rose at the beginning of the dark period (ZT 12) and decreased at the beginning of the light period (ZT 24); the body temperature of SBR mice slightly increased at ZT 12 and increased immediately at the start of the diet period (ZT 16). The body temperature in both groups decreased gradually during the light period (Fig. 1(b)).
Skipping breakfast regimen delayed peaks in serum TAG, NEFA and insulin levels
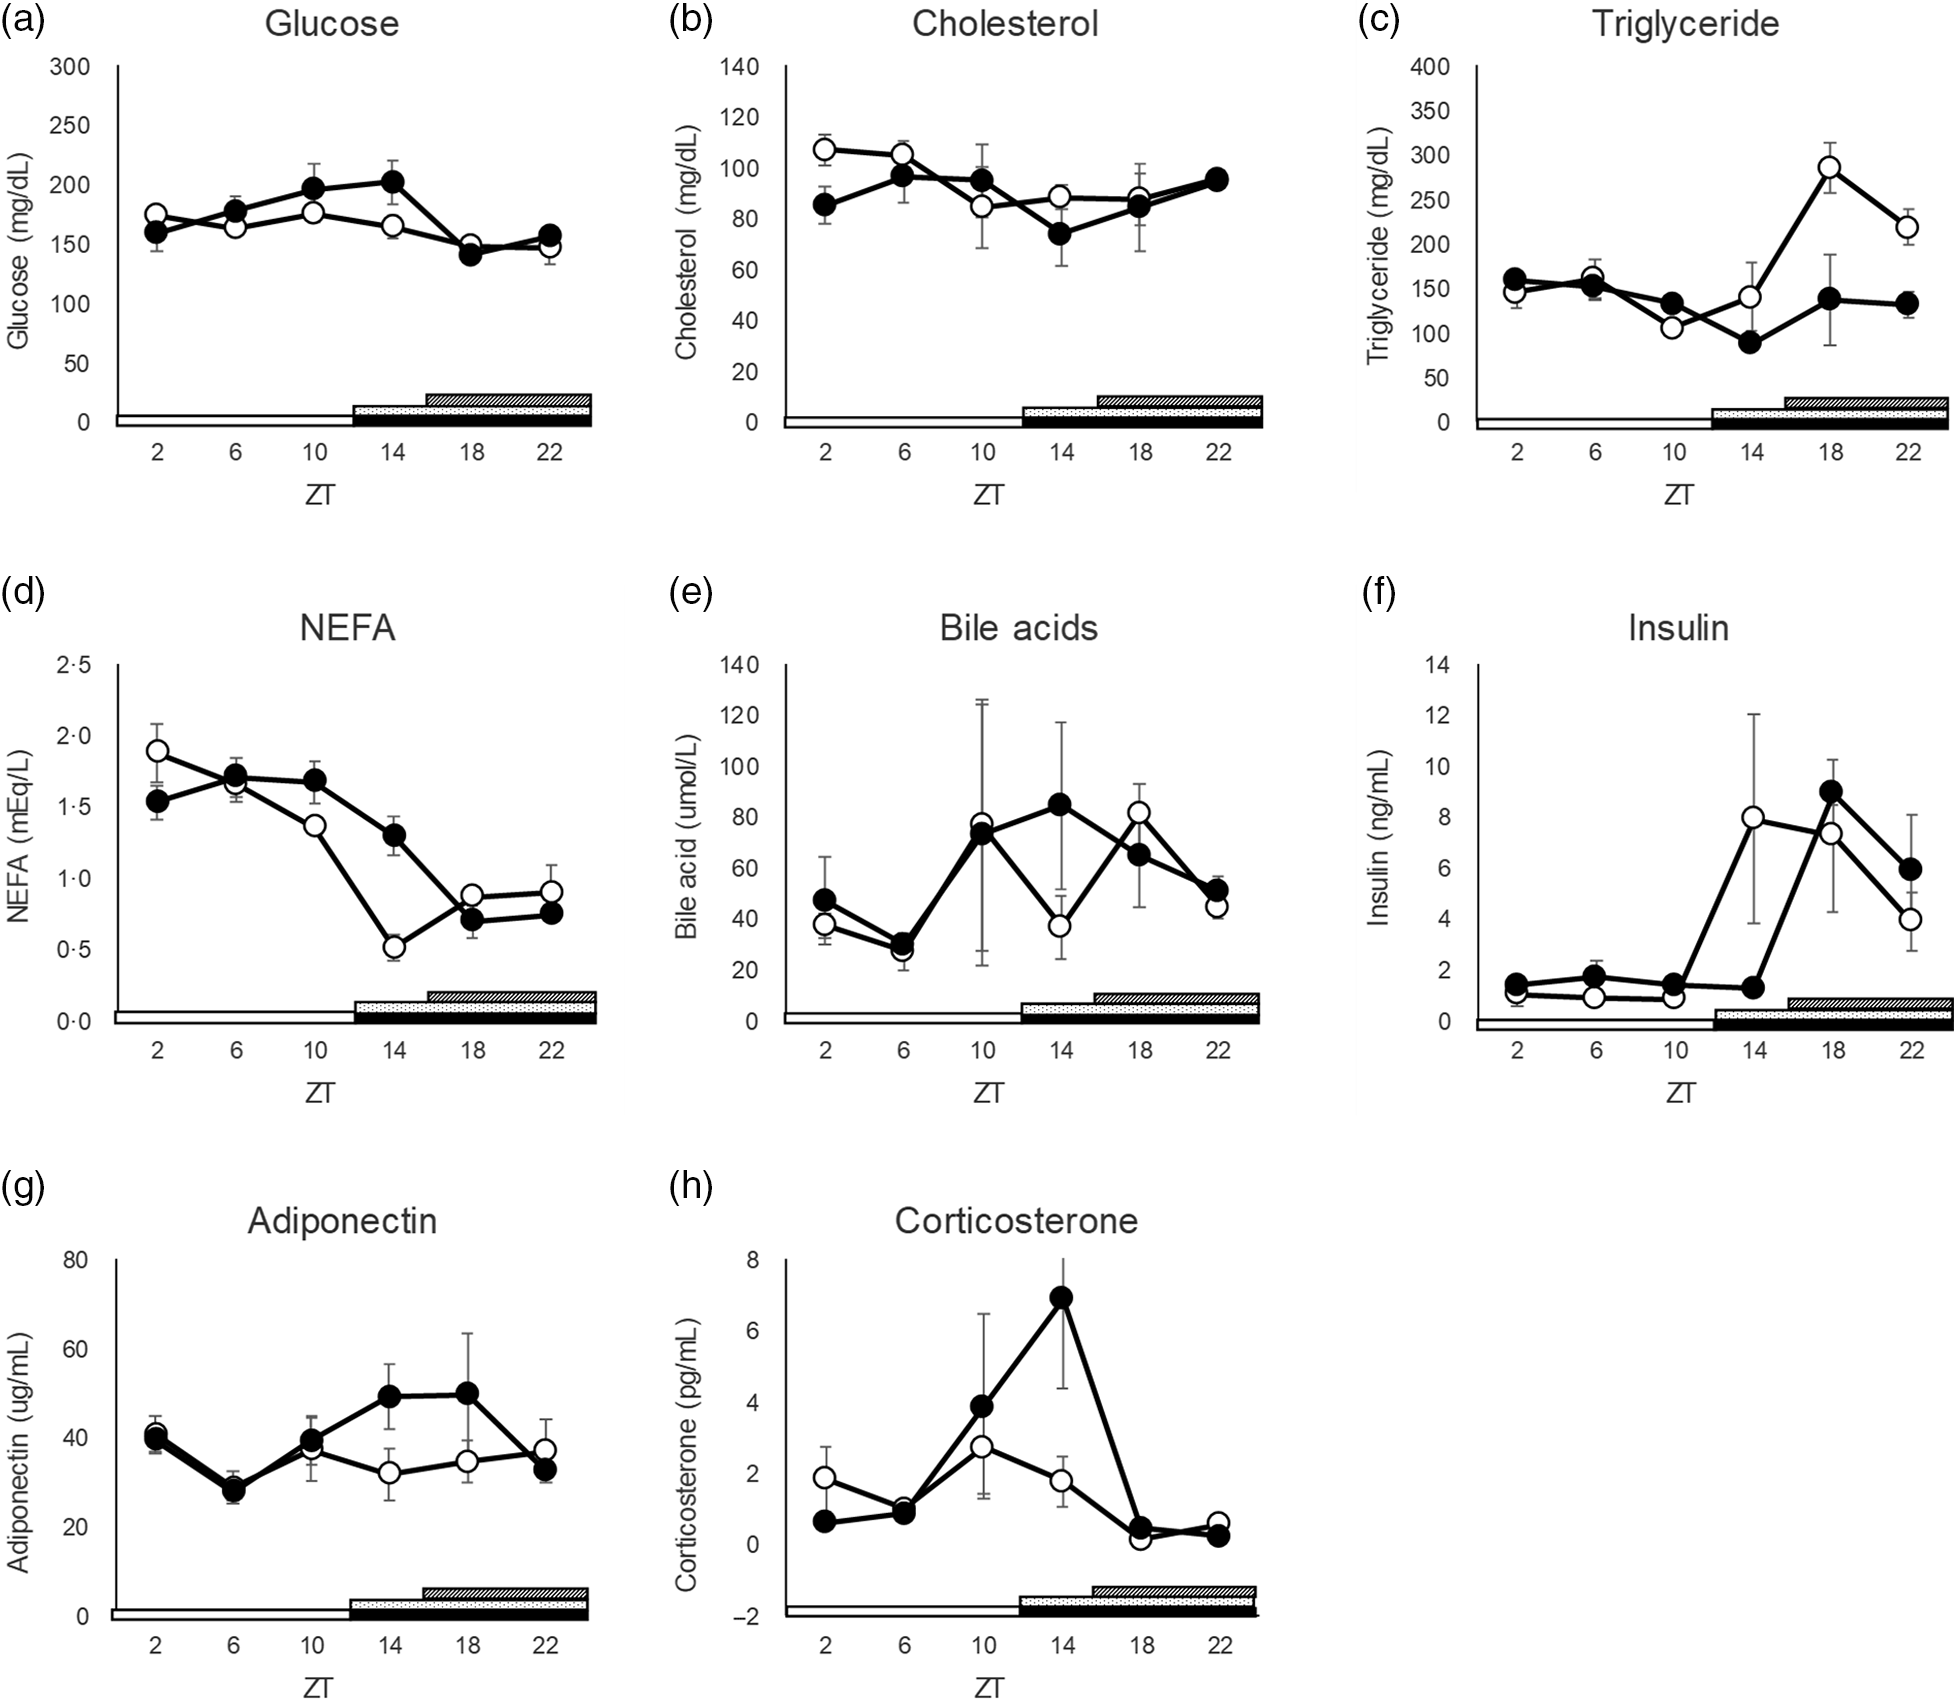
The concentrations of serum glucose, cholesterol, bile acids and adiponectin did not change in SBR mice compared with those in control mice (Fig. 2(a), (b), (e) and (g), and online Supplementary Table S2). The peak time of the TAG level in SBR mice was delayed by 8 h from ZT 18 in the control group to ZT 2 until the following day (Fig. 2(c) and online Supplementary Table S2). The peak time of NEFA, insulin and corticosterone levels was delayed by 4 h, from ZT 14 in the control mice to ZT 18 in the SBR mice (Fig. 2(d), (f) and (h) and online Supplementary Table S2). These results indicate that the circadian rhythms of TAG, NEFA, insulin and corticosterone levels were delayed by SBR.
SBR delayed the peaks of serum TAG, NEFA and insulin levels in mice. The serum (a) glucose, (b) cholesterol, (c) TAG, (d) NEFA, (e) bile acid, (f) insulin, (g) adiponectin and (h) corticosterone levels were analysed. The open circles represent control mice, and the closed circles represent SBR mice. The light periods are shown with open bars (ZT 0–12), and the dark periods are shown with closed bars (ZT 12–24). The dot pattern bar represents the control feeding time (ZT 12–24), and the striped bar represents the SBR feeding time (ZT 16–24). The rhythmicity was analysed by JTK_CYCLE. The results of the rhythmicity are shown in online Supplementary Table S2. SBR, skipping breakfast regimen; ZT, zeitgeber time.

Skipping breakfast regimen shifted the expression of clock genes and lipid metabolism-related genes in the liver
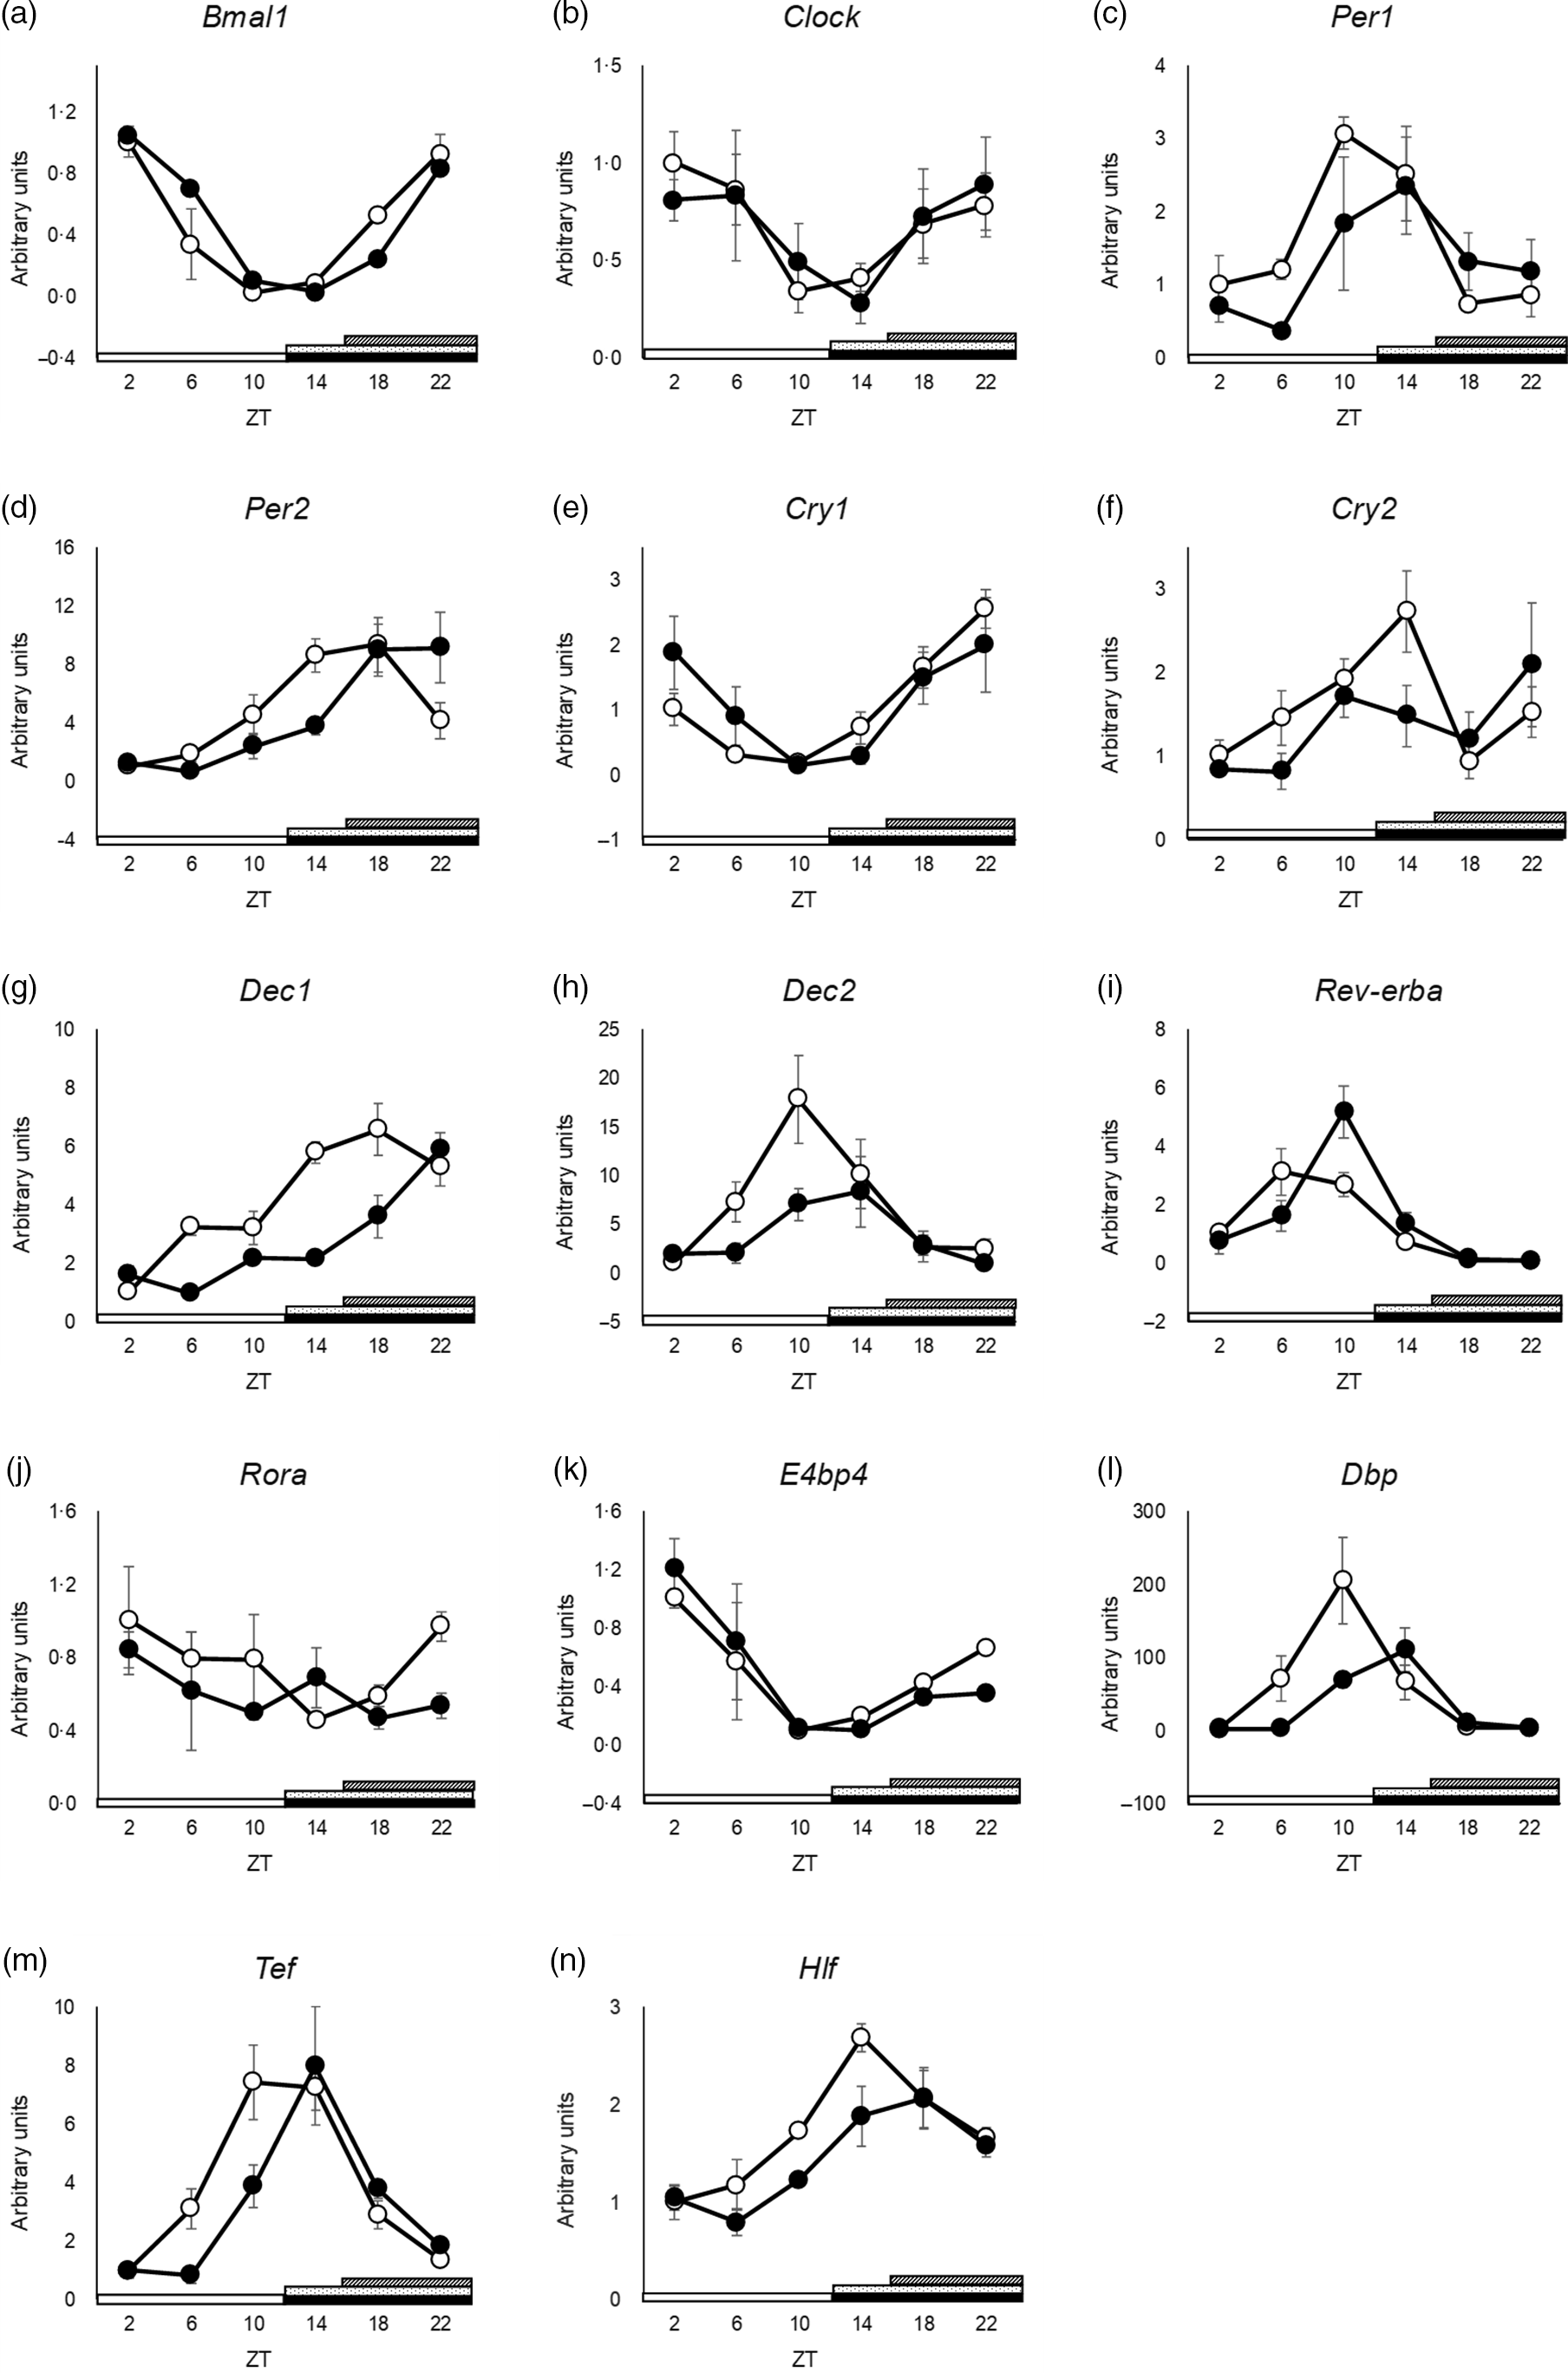
The peak time of Clock and Dec2 did not differ between the groups (Fig. 3(b) and (h) and online Supplementary Table S3). Cry2 and Rora showed no rhythmic mRNA expression in either group, as determined by JTK_CYCLE analysis (Fig. 3(f) and (j) and online Supplementary Table S3). Cosinor analysis showed that the peak time of Cry2 was shifted in the SBR group, but JTK_CYCLE analysis did not show rhythmicity and any shift in peak time by SBR (online Supplementary Table S3 and S7). The peaks of Bmal1, Per1, Per2, Cry1, Dec1, Rev-erba, E4bp4, Dbp, Hlf and Tef expression were delayed by 4 h by SBR (Fig. 3(b), (c)–(e), (g), (i), 3(k)–(n) and online Supplementary Table S3). These results indicated that a 4-h shift in feeding induced a 4-h delay in the circadian rhythm of clock genes in the liver.
SBR delayed circadian oscillation of hepatic clock gene expression in mice. (a) Bmal1, (b) Clock, (c) Per1, (d) Per2, (e) Cry1, (f) Cry2, (g) Dec1, (h) Dec2, (i) Rev-erba, (j) Rora, (k) E4bp4, (l) Dbp, (m) Tef and (n) Hlf mRNA expression in the liver was analysed using RT-qPCR. ApoE rRNA was used as a reference for the RT-qPCR. The open circles represent the control group, and the closed circles represent the SBR group. The light periods are shown with open bars (ZT 0–12), and the dark periods are shown with closed bars (ZT 12–24). The dot pattern bar represents the control feeding time (ZT 12–24), and striped bar represents the SBR feeding time (ZT 16–24). Each value in the ZT points is means with their standard error of the mean; n 3. The rhythmicity was analysed by JTK_CYCLE. The results of the rhythmicity are shown in online Supplementary Table S3. SBR, skipping breakfast regimen; ZT, zeitgeber time.

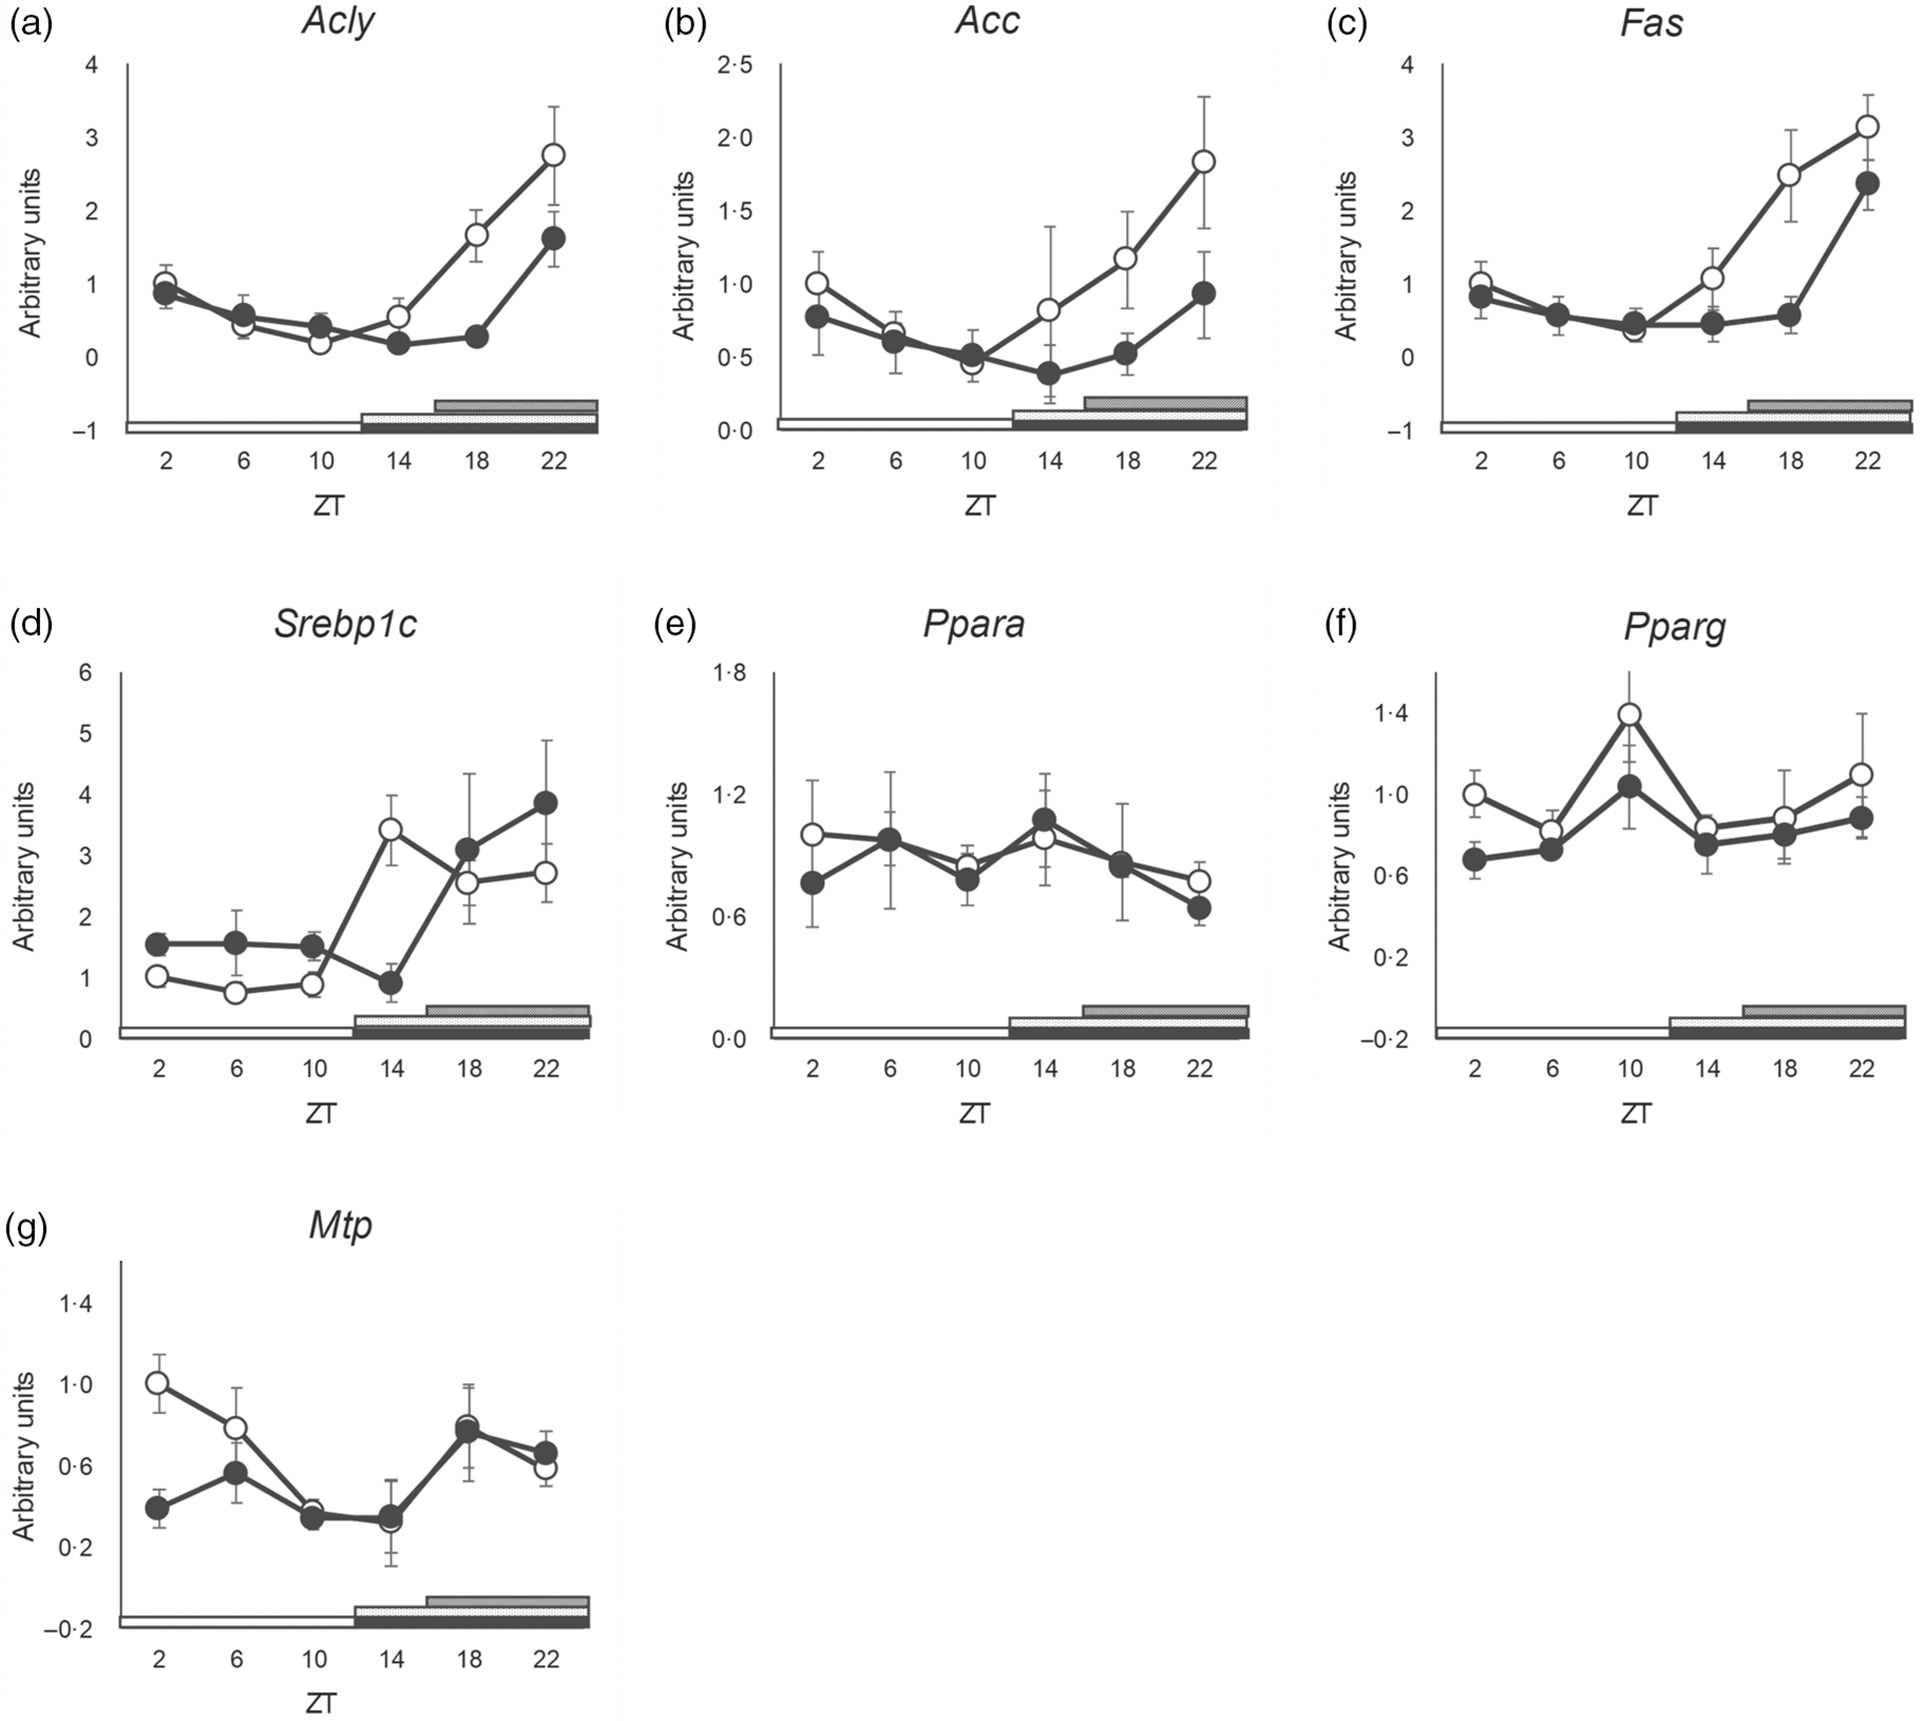
Since rhythmicity in the expression of various clock genes was delayed by SBR, we investigated the circadian oscillations of lipid metabolism-related genes in the liver, as several such genes are regulated by clock genes(Reference Martelot, Claudel and Gatfield9,Reference Oishi, Shirai and Ishida33) . The rhythmic expression of Acc and Srebp1c was suppressed in SBR mice (Fig. 4(b) and (d) and online Supplementary Table S4). These data showed that SBR not only delayed the expression of lipid metabolism genes but also affected the amplitude of lipid metabolic gene expression in the liver. Pparg and Mtp showed no rhythmic expression in either group (Fig. 4(f) and (g) and online Supplementary Table S4).
Oscillation patterns of hepatic lipid metabolism-related gene expression in mice. (a) Acly, (b) Acc, (c) Fas, (d) Srebp1c, (e) Ppara, (f) Pparg and (g) Mtp mRNA expression in the liver was analysed using RT-qPCR. 18S rRNA was used for normalisation in the RT-qPCR. The open circles represent the control group, and the closed circles represent the SBR group. The light periods are shown with open bars (ZT 0–12), and the dark periods are shown with closed bars (ZT 12–24). The dot pattern bar represents the control feeding time (ZT 12–24), and the striped bar represents the SBR feeding time (ZT 16–24). Each value in the ZT points is means with their standard error of the mean; n 3. The rhythmicity was analysed by JTK_CYCLE. The results of the rhythmicity are shown in online Supplementary Table S4. SBR, skipping breakfast regimen; ZT, zeitgeber time.

Skipping breakfast regimen shifted the expression of clock genes in the adipose tissue and muscle
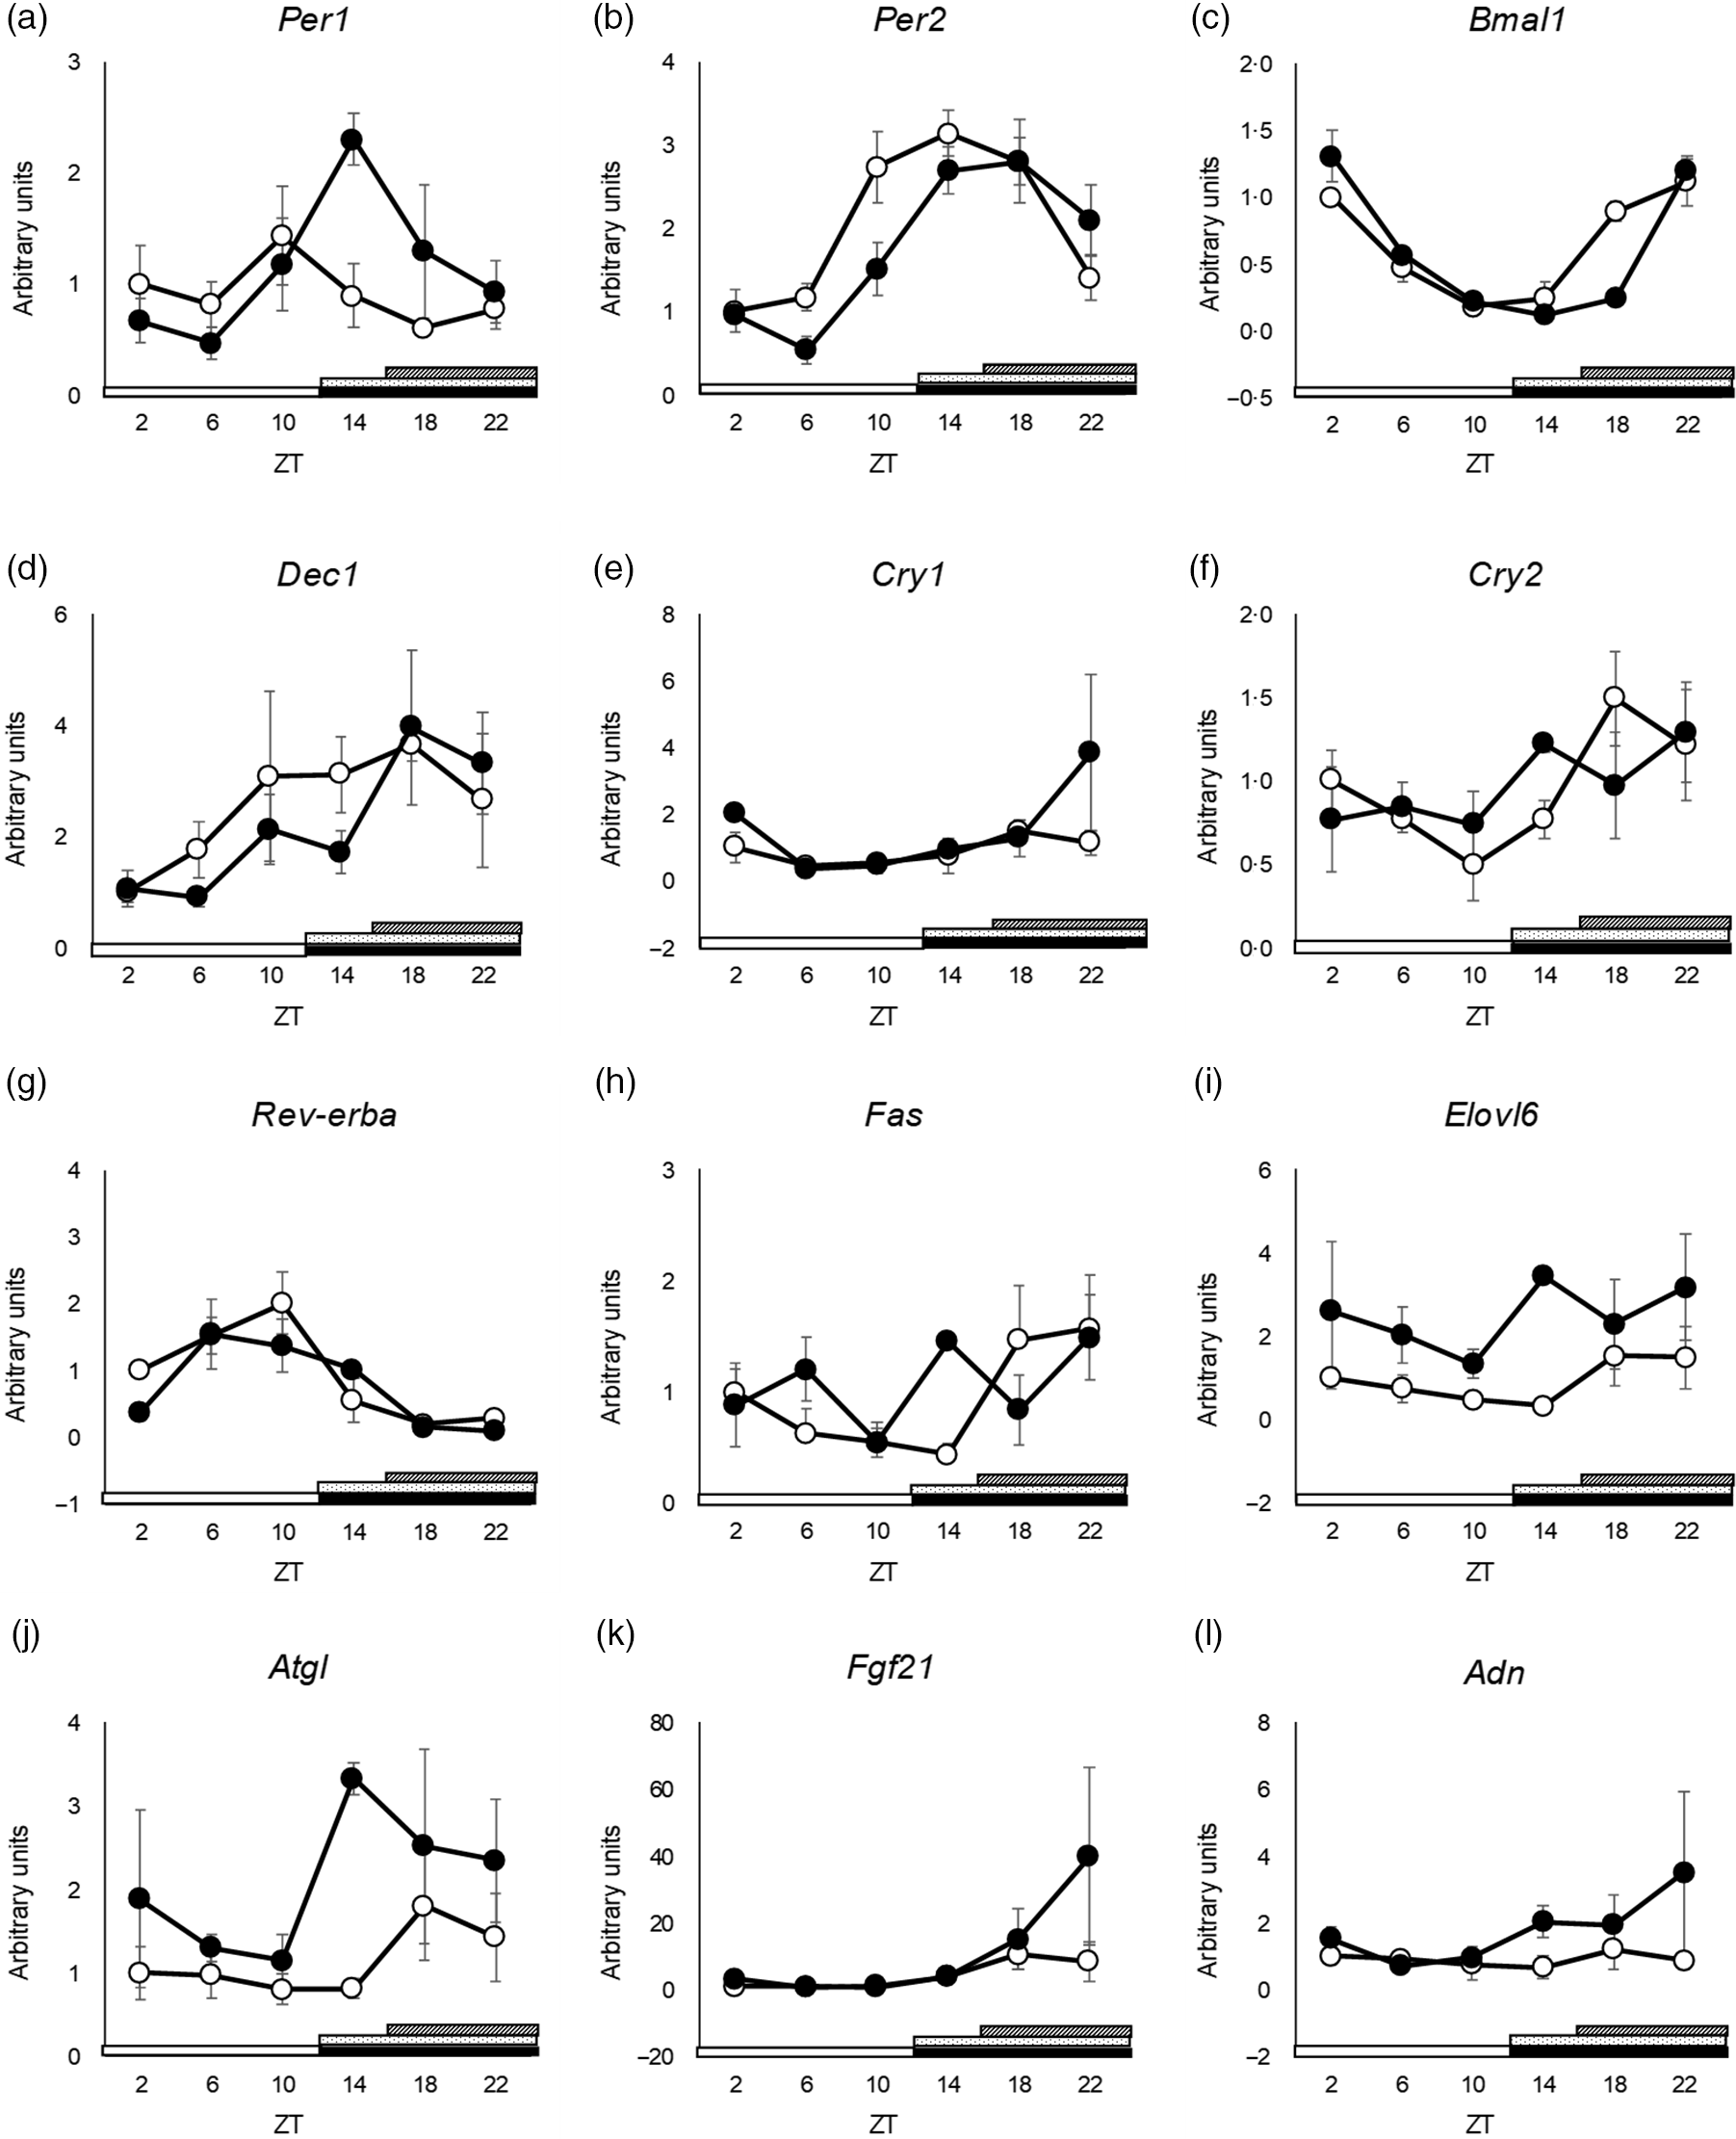
As mentioned above, we observed that adipose tissue weight increased, and muscle weight decreased in SBR mice. To elucidate the mechanism underlying the induction of increased adipose weight and decreased muscle weight by SBR, we investigated the expression of clock genes, lipid metabolism-related genes and muscle metabolism-related genes. As we stored only epididymal adipose tissues and plantar muscles, we analysed epididymal adipose tissues and plantar muscles by qPCR. The peaks of Bmal1 and Rev-erba expression were delayed by SBR in the epididymal adipose tissues (Fig. 5(c) and (g) and online Supplementary Table S5). The expression of Per1, Per2, Dec1, Cry1, Cry2, Elovl6, Atgl, Fgf21 and Adn did not differ between the groups (Fig. 5(a), (b), (d)–(f), (h)–(l) and online Supplementary Table S5).
Oscillation patterns of clock and lipid metabolism-related gene expression in adipose tissue. (a) Per1, (b) Per2, (c) Bmal1, (d) Dec1, (e) Cry1, (f) Cry2, (g) Rev-erba, (h) Fas, (i) Elovl6, (j) Atgl, (k) Fgf21 and (l) Adn mRNA expression in the epididymal adipose tissues was analysed using RT-qPCR. 18S rRNA was used for normalisation in the RT-qPCR. The open circles represent the control group, and the closed circles represent the SBR group. The light periods are shown with open bars (ZT 0–12), and the dark periods are shown with closed bars (ZT 12–24). The dot pattern bar represents the control feeding time (ZT 12–24), and the striped bar represents the SBR feeding time (ZT 16–24). Each value in the ZT points is means with their standard error of the mean; n 3. The rhythmicity was analysed by JTK_CYCLE. The results of the rhythmicity are shown in online Supplementary Table S5. SBR, skipping breakfast regimen; ZT, zeitgeber time.

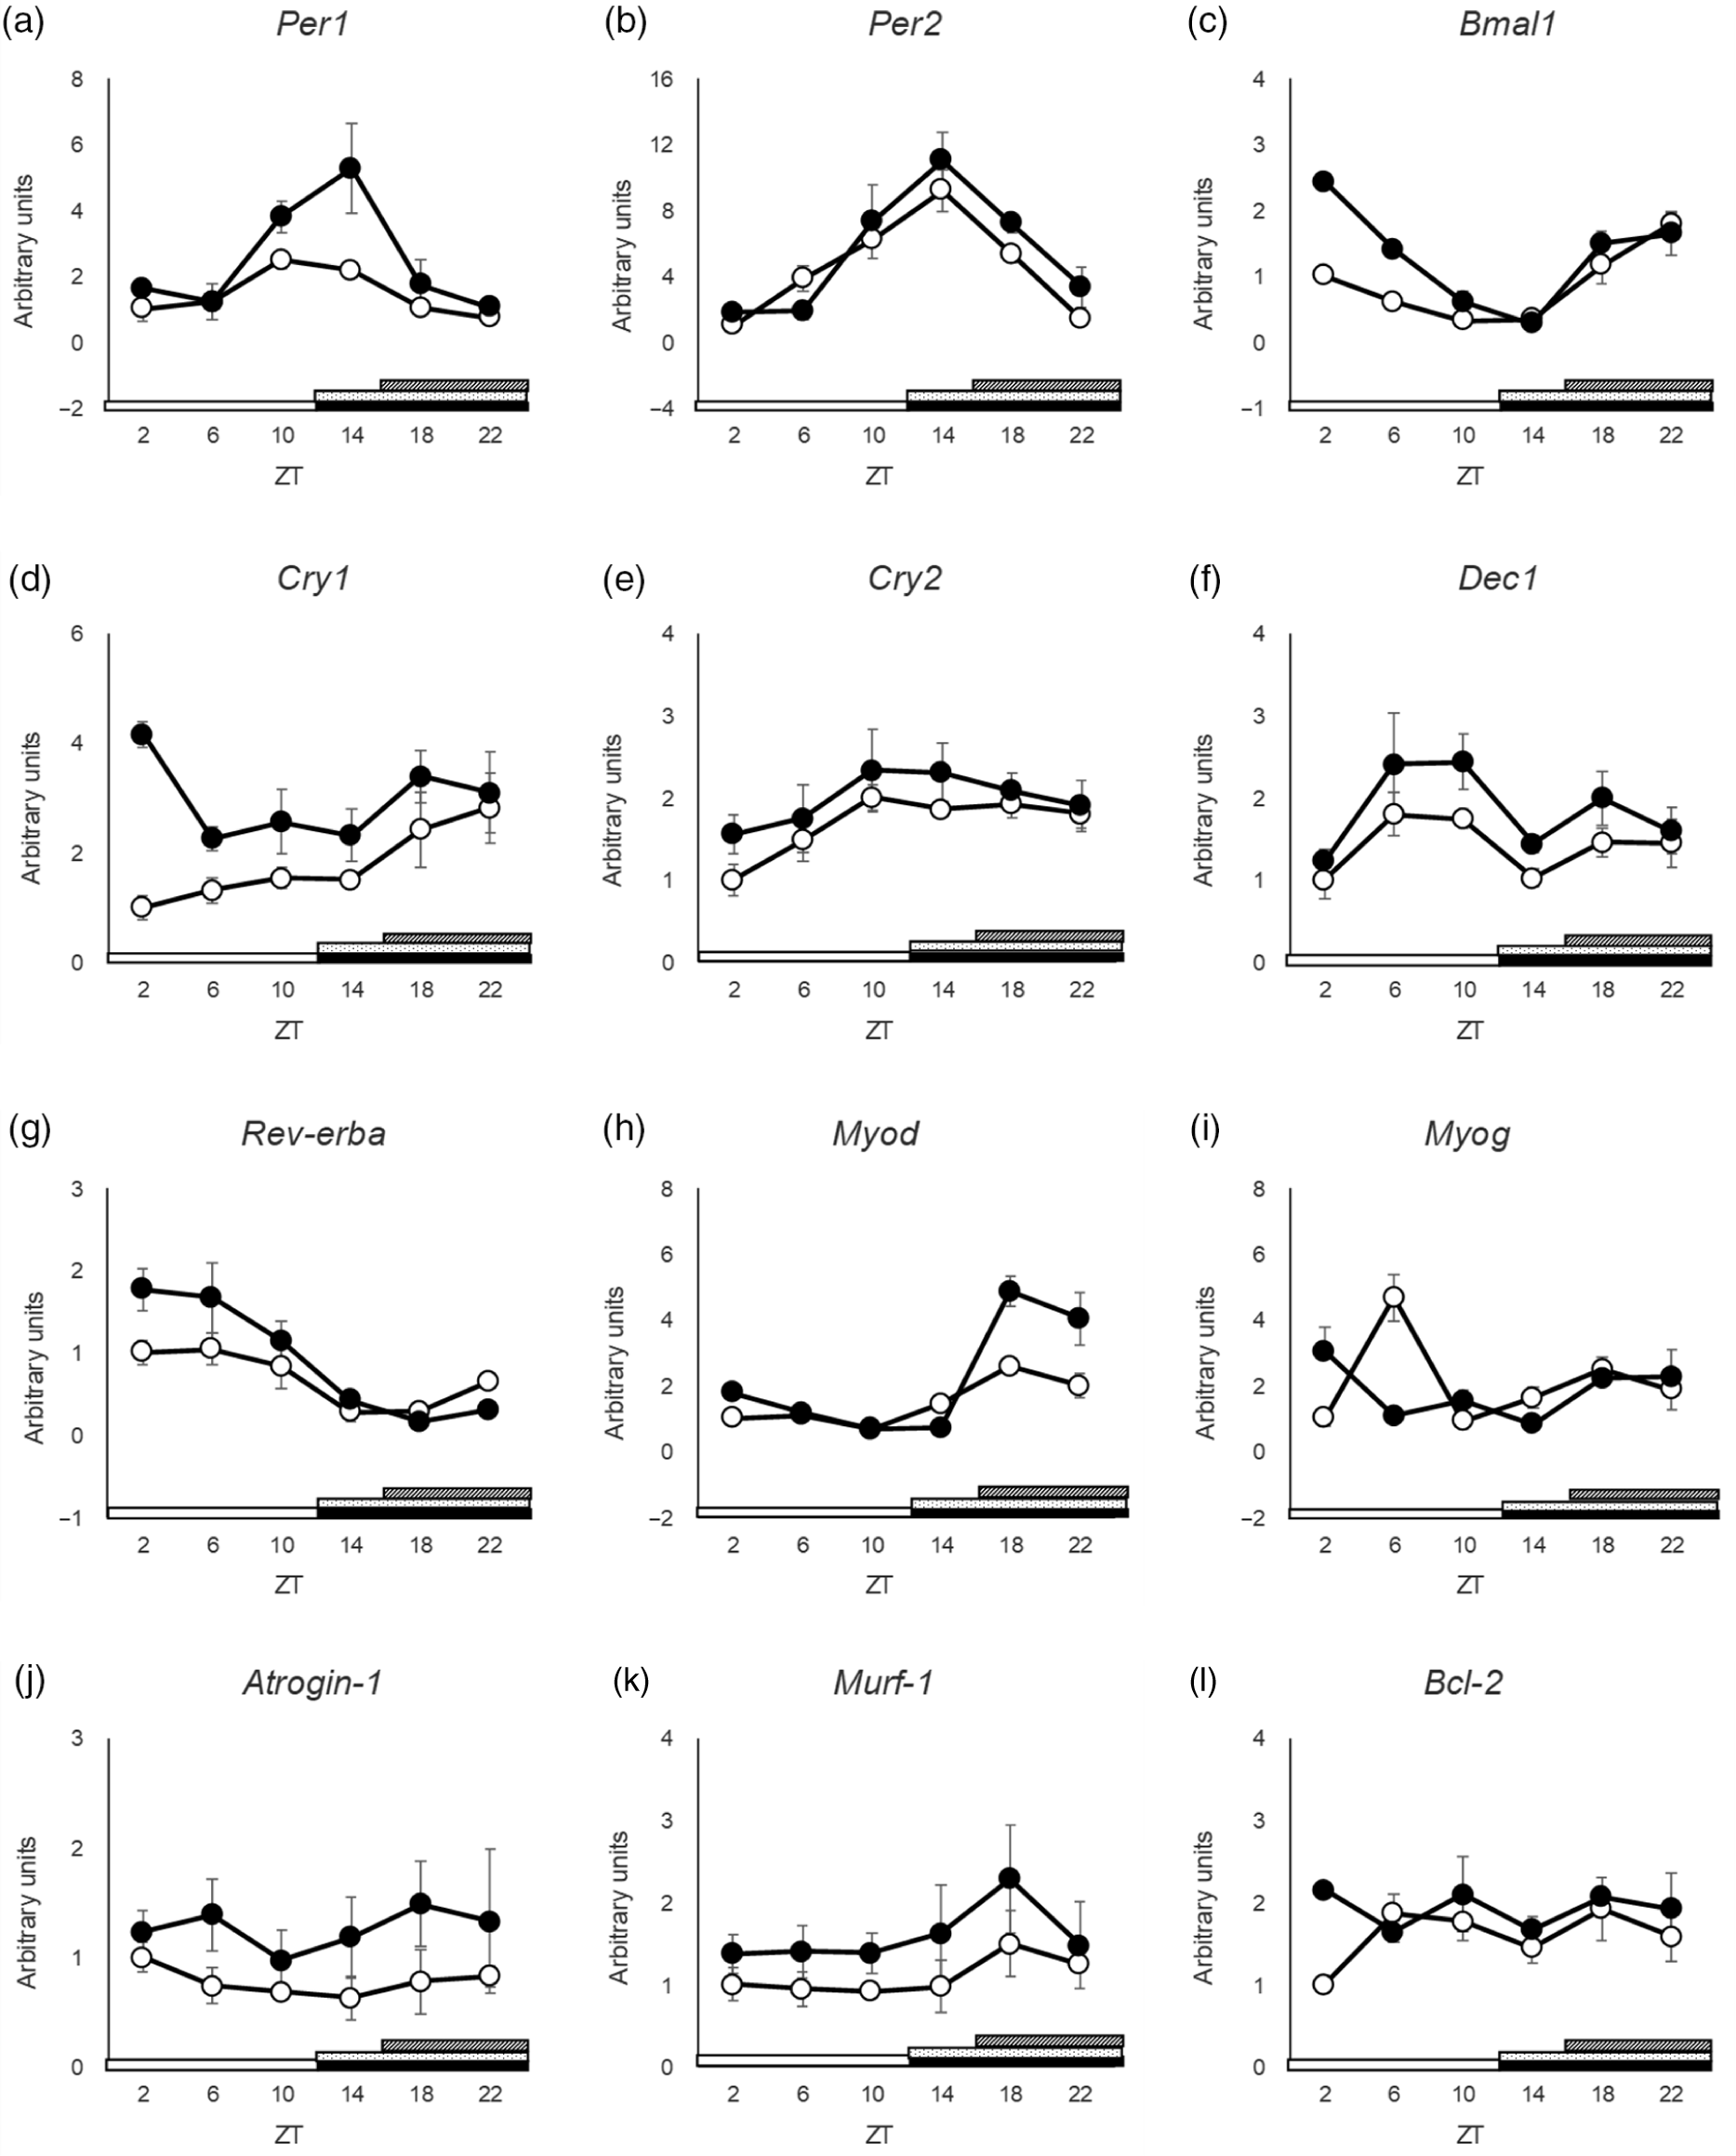
The oscillations in Per1, Per2, Bmal1, Rev-erba and Myod expression were delayed by SBR in the plantar muscle (Fig. 6(a)–(c), (g), (h) and online Supplementary Table S6). Atrogin-1 and Murf-1 expression tended to increase at every time point (Fig. 6(j) and (k)). In cosinor analysis, peak time of Murf-1 was not shifted drastically by SBR, but JTK_CYCLE analysis showed no rhythmicity and larger shift of peak time (online Supplementary Tables S6 and S7). The expression of Cry1, Cry2, Dec1, Myog and Bcl2 was not different between the groups (Fig. 6(d)–(f), (i), (l) and online Supplementary Table S6).
Oscillation patterns of clock and muscle metabolism-related gene expression in muscle. (a) Per1, (b)Per2, (c) Bmal1, (d) Cry1, (e) Cry2, (f) Dec1, (g) Rev-erba, (h) Myod, (I) Myog, (j) Atrogin-1, (k) Murf-1 and (l) Bcl-2 mRNA expression in the plantar muscle tissues was analysed using RT-qPCR. 18S rRNA was used for normalisation in the RT-qPCR. The open circles represent the control group, and the closed circles represent the SBR group. The light periods are shown with open bars (ZT 0–12), and the dark periods are shown with closed bars (ZT 12–24). The dot pattern bar represents the control feeding time (ZT 12–24), and the striped bar represents the SBR feeding time (ZT 16–24). Each value in the ZT points is means with their standard error of the mean; n 3. The rhythmicity was analysed by JTK_CYCLE. The results of the rhythmicity are shown in online Supplementary Table S6. SBR, skipping breakfast regimen; ZT, zeitgeber time.

Discussion
Skipping breakfast has been proposed to increase the risk of lifestyle-related diseases in humans(Reference Yokoyama, Onishi and Hosoda18,Reference Bi, Gan and Yang19) . In our previous study, time-shifted feeding of rats resulted in increased body weight gain and induced circadian disorders in the liver(Reference Shimizu, Hanzawa and Kim22). Our previous study suggested that the combination of a high-fat diet and irregular feeding behaviour would increase body weight(Reference Shimizu, Hanzawa and Kim22). However, the factors that contribute to this increase in body weight remain unknown. To clarify which factor directly impacts the increase in body weight, a normal diet was used in this study. As mentioned above, compared with rats, mice have a higher feeding efficiency ratio and higher energy metabolic rate(Reference Yan, Combs and DeMars23–Reference Hussein25). It has been suggested that mice respond more to dietary conditions and are suitable for dietary intervention studies. The group we used as control is time restricted feeding condition. Time restricted feeding during inactive phase is reported not to influence lipid metabolism in mice(Reference Kentish, Hatzinikolas and Li34). In the present study, we limited mice to access food at light phase (ZT 0–12) to bring out the impacts of SBR more drastically. Furthermore, the feeding conditions in each mouse needed to be same just before the beginning of the active phase (ZT 12–16) to evaluate the effects of SBR.
In the present study, we investigated whether SBR induced negative effects on lipid and muscle metabolism in mice fed a normal diet. Our results indicated that 2 weeks of SBR increased body weight gain in mice (Fig. 1(a)). Despite SBR mice being fed for 4 h less than control mice, there was no significant difference in food intake between the groups throughout the experimental period (online Supplementary Fig. S1). SBR mice showed significantly increased perirenal adipose tissue weight and decreased plantar muscle weight compared with control mice (Table 1), whereas the liver weight did not change. SBR delayed circadian oscillations in the expression of clock genes and lipid metabolism-related genes, but liver weight did not change, suggesting that SBR did not affect lipid accumulation in the liver.
Skeletal muscle fibres are roughly divided into two types: fast-twitch muscle fibres and slow-twitch muscle fibres. The plantar, gastrocnemius, tibial anterior and extensor digitorum longus muscles are characterised by fast-twitch muscle fibres, and the soleus muscle is characterised by slow-twitch muscle fibres(Reference Cornachione, Benedini-Elias and Polizello35). Fast-twitch muscle fibres are preferentially degraded during fasting(Reference Goodman, Kotecki and Jacobs36). In the present study, the weight of the four muscles with fast-twitch fibres, except the plantar muscle, tended to decrease with SBR (Table 1). These changes were not observed in the soleus muscle, which is characterised by slow-twitch fibres. In this study, the weight of muscles with fast-twitch fibres significantly decreased or tended to be decreased by SBR. We speculate that 4-h fasting owing to SBR in the first active phase induced the degradation of muscles with fast-twitch fibres. In the present study, only the perirenal adipose tissue weight was increased by SBR. We hypothesised that epididymal adipose tissue is the major adipose tissue affected by SBR and collected adipose tissue only from the epididymis region for gene expression analysis. However, only perirenal adipose tissue weight was changed by SBR. A similar finding was reported in our previous study(Reference Shimizu, Hanzawa and Kim22). Previous study suggested that lipid metabolism is regulated differently in different adipose regions(Reference Caserta, Tchkonia and Civelek37). Based on the differences in lipid metabolic regulation, perirenal fat may have been significantly affected by SBR in the present study.
In mammals, energy expenditure is correlated with core body temperature, which in turn has been reported to be modulated by food components(Reference Yamaoka38). The core body temperature is associated with diet-induced thermogenesis(Reference Vinales, Begaye and Thearle39). In this study, the core body temperature rose sharply during the first active phase in the control groups along with diet-induced thermogenesis (Fig. 1(b)). However, the core body temperature in the SBR group rose slightly during the first active phase and sharply rose immediately after feeding (ZT 16), suggesting that thermogenesis was delayed by SBR. In the present study, the body temperature in control mice increased sharply at ZT 12 (Fig. 1(b)). However, the body temperature of SBR mice increased slightly at ZT 12 and further increased sharply at ZT 16 (Fig. 1(b)). These results suggest that both light and diet regulate the circadian oscillations in body temperature. We speculate that a delay in rising body temperature led to the suppression of increased energy expenditure in the active phase, and energy expenditure would contribute to an increase in body weight associated with fat accumulation in adipose tissues.
Hepatic circadian oscillations are regulated by both the suprachiasmatic nucleus and diet(Reference Radziuk40,Reference Stokkan, Yamazaki and Tei41) . In this study, the peak time of clock gene expression in the liver was delayed by 4 h by SBR (Fig. 3). The peak time of serum NEFA, insulin and corticosterone levels was delayed by 4 h by SBR (Fig. 2). These results suggest that serum NEFA, insulin and corticosterone levels are synchronised with hepatic clock gene expression. We have demonstrated that insulin plays an important role in synchronising the circadian clock in the liver(Reference Yamajuku, Inagaki and Haruma42). Interestingly, the circadian rhythms of Igf-1 (insulin-like growth factor-1) have sexual dimorphism(Reference Astafev, Patel and Kondratov43). Although we have not examined sex differences in the present study, sex of mice is an important modulator of circadian oscillations and glucose/lipid metabolism. Further experiments are required to reveal the effects of NEFA and corticosterone on the circadian clock.
Several reports have discussed the functions of clock genes(Reference Okumura44,Reference Albrecht45) . Clock genes are known to regulate lipid metabolism-related genes, such as Ppara, Pparg and Srebp1c (Reference Martelot, Claudel and Gatfield9,Reference Oishi, Shirai and Ishida33,Reference Grimaldi, Bellet and Katada46) . In this study, the peak time of lipid metabolism-related gene expression was delayed by 4 h in both the liver and epididymal adipose tissue in SBR mice (Figs. 4 and 5). These results suggest that the expression of clock genes and lipid metabolism-related genes is synchronised and controlled in both the liver and adipose tissues. It has been reported that lipogenic enzymes are mainly regulated at the transcriptional level(Reference Goodridge47) and are correlated with both protein levels and enzyme activities(Reference Ohtsuki, Schaefer and Kawakami48). Several mRNA involved in lipid metabolism as well as their metabolites exhibit circadian oscillations(Reference Dallmann, Viola and Tarokh49). Therefore, it is possible that altered gene expression profiles may influence lipid metabolism. Clock genes are reported to regulate the circadian modulation of lipogenesis, lipolysis and adipokine secretion(Reference Martelot, Claudel and Gatfield9,Reference Shostak, Meyer-Kovac and Oster50,Reference Man, Xia and Li51) . It has been reported that clock gene deficiency mice showed dyslipidaemia and was suggested that clock genes involved in the regulation of lipid metabolism(Reference Hussain and Pan52). In the present study, the gene expression of Acly and Fas was delayed, and the rhythmicity of Acc and Srebp1c expression was suppressed in the liver by SBR (Figs. 3 and 4); furthermore, the expression of several clock genes was delayed by SBR in the epididymal adipose tissues (Fig. 5). These results suggest that altered gene expression caused by SBR leads to abnormal lipid metabolism. The alteration of clock gene expression in adipose tissue and suppressed energy expenditure may be related to increased body weight gain. We showed that SBR leads to an increase in body weight (Fig. 1(a)), and the disruption of the expression of clock genes and lipid metabolism-related genes would contribute to lifestyle-related diseases such as obesity. In the present study, 2 weeks of SBR induced abnormal lipid metabolism in mice. Since clock gene oscillations are flexible and rapid depending on the diet(Reference Yamaguchi, Isejima and Matsuo53), it is possible that recovery from SBR may cause the oscillations in clock gene expression to return to normal again at an earlier stage. Recovery from SBR may be expected to abolish the effect of SBR on abnormal lipid metabolism. Since we only evaluated the expression of lipid metabolism-related genes in the present study, there is insufficient evidence for a conclusive result. Further investigations are necessary to elucidate the relationship between gene alterations and lipid metabolism.
In the present study, plantar muscle weight was significantly decreased by SBR (Table 1). Muscle not only regulates locomotion but also controls nutritional homoeostasis. The disruption of clock gene expression in muscles induces disorders of metabolism and energy homoeostasis(Reference Dyar, Ciciliot and Wright54). Muscle metabolism is regulated by diet and exercise(Reference Aoyama and Shibata55). Myod is a master regulator of myogenesis and is a circadian oscillator that is regulated by clock genes(Reference Andrews, Zhang and McCarthy56). Rev-erba-deficient mice showed increased expression of muscle atrophy-related genes and reduced muscle mass(Reference Mayeuf-Louchart, Thorel and Delhaye57). Choi et al. suggested that the disturbance in circadian rhythm caused by shift work leads to an increased risk of sarcopenia(Reference Choi, Park and Chung58). The oscillations in the expression of clock genes and Myod in the plantar muscle were delayed by SBR (Fig. 6). The expression of Myod increased from ZT 18 to ZT 22 in SBR mice. This result suggested that the conditions for muscle breakdown, such as SBR, trigger a compensatory increase in the expression of Myod (Fig. 6). E3 ubiquitin ligases, such as Murf-1 and Atrogin-1, are regulators of protein degradation in skeletal muscle(Reference Gumucio and Mendias59). In the present study, the expression of Murf-1 and Atrogin-1 tended to increase in every time period in SBR mice (Fig. 6). The expression of Murf-1 and Atrogin-1 is known to increase after fasting(Reference Qinghe, Jinxiu and He60). In the present study, SBR mice were exposed to longer fasting periods than control mice. These results indicated that muscle protein breakdown was boosted by SBR. It has been suggested that the SBR-inducible disruption of circadian rhythm increases the risk of muscle atrophy and sarcopenia.
The present study demonstrated that SBR increased body weight and fat mass in adipose tissue. Moreover, skeletal muscle weight was reduced by SBR. The expression of clock genes was delayed in the liver, adipose tissue and muscle of SBR mice. SBR also leads to the delayed or fluctuating expression of several lipid and muscle metabolism-related genes. On the other hand, skipping meal in latter half of the active phase is reported to improve lipid metabolism(Reference Delahaye, Bloomer and Butawan61). The findings of their study support the result of the present study. Thus, we speculate that the disruption in the expression of clock, lipid metabolism-related and muscle metabolism-related genes caused by SBR led to body weight gain and muscle-mass loss. The mechanism of SBR-induced lipid abnormalities was suggested to be due to alterations in clock and lipid metabolism genes, as well as suppression of rising body temperature by nutrient depletion. The phenomena of the SBR-induced delays can be partially explained by our previous findings that insulin is a major factor in clock control(Reference Stokkan, Yamazaki and Tei41). Since the peripheral tissues evaluated in this study are the target tissues of insulin, we speculate that the alterations of several clock genes were caused by insulin.
In this study, several genes showed different results in the JTK_CYCLE analysis and cosinor analysis. These results can be explained by differences in the principles of the analysis methods. When the rhythm is complex or the waveform is not clear, it is difficult to fit actual curves by parametric analysis. This is because cosinor analysis tries to fit the results to a cosine curve, which does not fit the actual curve. However, the results and trends of the cosinor analysis are mostly similar to those of the JTK_CYCLE analysis. The results of this study indicate that dietary restriction, such as SBR, may not only lead to abnormal lipid metabolism but also deplete nutrients and suppress muscle synthesis. The combination of abnormalities in lipid and muscle metabolism may contribute to more serious health problems such as sarcopenic obesity. Our study suggests the importance of a breakfast regimen to prevent obesity and sarcopenia. Further studies are necessary to determine the relationship between obesity, sarcopenia and skipping breakfast.
Acknowledgements
We are indebted to Yasuko Matsuyama, Takahiro Okuda, Misako Kitano, Yuichiro Mori, Taishi Koyama and Yukino Koshinaka for technical assistance. We would like to thank Editage (www.editage.com) for English language editing.
This research was supported by a Grant-in-Aid for Scientific Research from the Japan Society for the Promotion of Science (16H04922, 20H02930) and Miki Corporation.
Conceptualisation: K. K., H. Y. and H. O.; methodology: H. O.; data curation: K. K., M. Y., S. S., D. K. and H. O.; writing – original draft preparation, K. K.; writing – review and editing, K. K. and H. O.; project administration, H. O.; funding acquisition, H. O. All authors have read and agreed to the published version of the manuscript.
Two of the authors, K. K. and H. Y., are employees of Miki Corporation. The other authors declare no conflict of interest.
Supplementary material
For supplementary materials referred to in this article, please visit https://doi.org/10.1017/S0007114522000356