
Introduction
In 2015, China initiated “Made in China 2025” and set nine priorities such as upgrading manufacturing innovation, enhancing its industrial base, and strengthening ten core sectors, which range from new technologies to farming machines (Chen Reference Chen2018; Ding and Dafoe Reference Ding and Dafoe2021; State Council 2015a, 2015b). Since 2015, western countries have shed light on China’s subsidies. During the trade war (2018–20), Washington claimed that Beijing offered massive subsidies to manufacturing firms in defiance of international trade law. By contrast, Beijing claimed that such fiscal support is a reasonable policy to boost economic growth. Beijing also claimed that Washington uses subsidies (e.g., agricultural subsidies) to boost certain industries (Carcelli and Park Reference Carcelli and Park2024). What merits our attention is that China has not provided subsidies to manufacturing firms indiscriminately. By 2025, China aims to overtake Western technological prowess by improving the competitiveness of strategically important manufacturing industries such as artificial intelligence (AI), 5G, aerospace, and defense (Council on Foreign Relations 2019).
Academics and the media have emphasized that China provided large subsidies such as cash, R&D support, innovation grants, preferential loans, tax cuts, and guidance funds for manufacturing firms of strategic significance (Financial Times 2022; Chen and Rithmire Reference Chen and Rithmire2020). Data that this article assembles from the Shanghai/Shenzhen Stock Exchanges is also in line with them. Figure 1 illustrates that manufacturing firms of high strategic importance (e.g., AI, 5G, aerospace, etc.) on average received more subsidies than those of low strategic importance. This can suggest that manufacturing firms of more strategic importance may be more targeted by the state. One question may arise here: how do political considerations affect subsidies? This question is worth investigating for three main reasons. First, subsidy distribution is reflective of state priorities in terms of economic and political objectives (Hou and Li Reference Hou and Li2023; Lim, Wang, and Zeng Reference Lim, Wang and Zeng2018). Second, firms manufacturing cutting-edge products and firms in the strategic sector do not necessarily mean that they are aligned with the state’s political goals. In general, firms are driven more by commercial motives than by the state’s political motives.
Trends of Subsidies Offered to Manufacturing Firms of Strategic Importance (2009–22).
Note: Pearson (Reference Pearson, Naughton and Tsai2015) provides information on China’s strategic industry.

Third and last, the “Made in China 2025” has framed the growth of the manufacturing sector in terms of national security (Pearson, Rithmire, and Tsai Reference Pearson, Rithmire and Tsai2022, Reference Pearson, Rithmire and Tsai2023; State Council 2015a). The “Made in China 2025” has assigned great significance to “indigenous innovation” and “self-reliance” since Chinese politicians view dependence on foreign technology and imports as a potential threat to the national interest. Furthermore, innovation, strategic industries, and high-tech manufacturing may constitute the core of a country’s military capabilities (Ding and Dafoe Reference Ding and Dafoe2023). In addition, China’s position in global value chains has limited its bargaining vis-à-vis foreign firms, thereby making it difficult to push them to transfer their technologies to Chinese companies (Ding Reference Ding2024; Minnich Reference Minnich2025). These points can explain why the Chinese party-state pays a lot of attention to indigenous innovation and self-reliance. The logic so far informs the expectation that political considerations may matter when governments allocate subsidies to domestic companies. Specifically, China may grant more subsidies to those manufacturing firms politically more connected with the Chinese party-state.
This article argues that China will distribute more subsidies to those manufacturing firms more connected to the party-state. Its H1 is that China gives more subsidies to manufacturing firms with Party Cells than to those without Party Cells. H2 is that China gives more subsidies to manufacturing firms whose CEO/Chair concurrently hold office in state organizations than to those without such managers. There are two reasons for the argument. First, firms connected to the state interact more often with officials and they have more influence vis-à-vis officials, making it easier to get subsidies (Huang and Véron Reference Huang and Véron2022). This logic is in line with cronyism: connected firms use their connections to influence officials (Kang Reference Kang2008; Kim Reference Kim2023; Lu and Wang Reference Lu and Wang2023). Last, officials will provide more subsidies for firms that are more deeply connected to the state. This logic is in line with party-state capitalism (Pearson, Rithmire, and Tsai Reference Pearson, Rithmire and Tsai2023). Party Cells help firms to build communication channels with the state and connections with the state (Heberer and Schubert Reference Heberer and Schubert2020). Party Cells usually play symbolic roles in shaping firm behavior. However, some firms have yet to have Cells due to potential concerns about state interference.
Evidence from manufacturing firms listed in Shenzhen and Shanghai (2009–22) supports the argument that China allocates more subsidies to those manufacturing firms more connected to the party-state. (For robustness checks, this article also studies the period of 2015–22.) Analyses show that the positive effects of subsidies on local economic growth (i.e., GDP in the secondary sector divided by city population) fell when political connectedness rose. This means that the symbiotic relationship between the party-state and connected firms may curb on the growth momentum. What deserves our attention is that China did not grant more subsidies to state-owned manufacturing firms than to private manufacturing firms. This means that the theory on state ownership has become less helpful for our understanding of how China manages its economy. The boundary between state and private has been blurred since Xi Jinping assumed the presidency in Fall 2012. Under his party-state, both state-owned enterprises (SOEs) and private firms are required to show their loyalty to the Xi leadership by building Party Cells. Finally, this article also conducts robustness checks and addresses some alternative explanations.
This article makes three contributions. First, it highlights the roles of a Communist Party Cell as an emerging type of connections between firms and the party-state, which has been relatively little studied by scholars. Political connectedness of domestic firms has attracted a lot of attention in the literature on comparative/international political economy and on Chinese politics. Political connectedness can be a tool by which firms influence officials and politicians to capture, for instance, subsidies, procurement contracts, and investment opportunities (Diwan, Keefer, and Schiffbauer Reference Diwan, Keefer and Schiffbauer2020; Kim Reference Kim2023; Kubinec, Lee, and Tomashevskiy Reference Kubinec, Lee and Tomashevskiy2024; Li Reference Li2021; Li Reference Li2023; Li Reference Li2024; Li and Lu Reference Li and Lu2025; Lu and Wang Reference Lu and Wang2023; Rithmire Reference Rithmire2023). Also, connectedness is often a strategy for the state to manage, regulate, govern, and/or control domestic firms. Especially in non-democratic regimes, connectedness has been often through state ownership. For instance, since Vladimir Putin rose to power in 2000, he has nationalized many private companies such as Gazprom to make sure that companies would act in line with Kremlin’s directives such as anti-oligarchy and weaponization of natural resources (Goldman Reference Goldman2008).
The party-state headed by President Xi Jinping has been enforcing political connections through relatively new mechanisms: Party Cells within firms. There exist robust discussions about the roles of Party Cells within firms (Yan and Huang Reference Yan and Huang2017). Party Cells often act as symbolic roles in shaping firm behavior (Yue, Zheng, and Mao Reference Yue, Zheng and Mao2024). Party Cells sometimes act as important roles in influencing firms’ decision-making process (Lin and Milhaupt Reference Lin and Milhaupt2023; Pearson, Rithmire, and Tsai Reference Pearson, Rithmire and Tsai2023). How connectedness, in its older forms (e.g., state ownership, bribing, and top managers in public office) and newer forms in China (e.g., Party Cell), has impacted firms’ access to state resources has been less sufficiently studied. This article shows that state ownership may not be a significant factor that accounts for the variations in subsidies. This means that the conventional theory on state ownership has become less useful for our understanding of how China governs its economy. This article also demonstrates that firms in the highly strategic manufacturing sector tend to receive more subsidies especially when they have Party Cells (and also when they have CEO/Chair concurrently holding public office).
Second, the evidence that the effects of subsidy on local economic growth fell as political connectedness rose adds to the literature on the regulatory state. In a regulatory state, subsidy allocation is a key tool to execute industrial policies (Hsueh Reference Hsueh2011; Tan Reference Tan2021). Some scholars note that industrial policies can spur economic growth (Alder, Shao, and Zilibotti Reference Alder, Shao and Zilibotti2016; Rodrik Reference Rodrik2007). Others however note that industrial policies can sometimes undermine growth (Agarwal Reference Agarwal2023; Criscuolo et al. Reference Criscuolo, Martin, Overman and Van Reenen2019). Politicians and officials pick winners and losers, which can result in resource misallocation. They also prioritize political logic over economic logic. This article shows that the effect of subsidies on growth is conditioned by firms’ political connectedness. It also shows that the effect of subsidies on firm productivity is conditioned by connectedness. Some scholars note that more subsidies can lead to decreased firm productivity (Branstetter, Li, and Ren Reference Branstetter, Li and Ren2022; Lim, Wang, and Zeng Reference Lim, Wang and Zeng2018). Others however note that subsidies can ease financial constraints, improve business strategies, and thus lead to increased firm productivity (Du et al. Reference Du, Girma, Görg and Stepanok2023; Li, Jin, and Kumbhakar Reference Li, Jin and Kumbhakar2022; Takeuchi and McNeme Reference Takeuchi and McNeme2023; Yang Reference Yang2023).
Last, this article adds to the emerging literature on party-state capitalism since it shows that China subsidized those manufacturing firms connected to the party-state. Those less connected to the state received fewer subsidies, making it hard to engage in innovative projects. The traditional literature on China’s state-capitalism mainly studies the roles of the State Asset Supervision Administration Commission (SASAC) in managing SOEs, the roles of personnel appointment in managing SOEs, and the roles of SOEs in managing the economy (Huang Reference Huang2008; Kim Reference Kim2018; Leutert and Vortherms Reference Leutert and Vortherms2021; Li Reference Li2016; Yeo Reference Yeo2020a Reference Yeob). So, the traditional literature on state capitalism cannot sufficiently account for why and how China has been managing private firms. Under the resurgent party-state headed by President Xi Jinping, the boundary between private and state has been gradually obscured. The Xi administration has pressured both SOEs and private firms to build Party Cells (Pearson, Rithmire, and Tsai Reference Pearson, Rithmire and Tsai2022, Reference Pearson, Rithmire and Tsai2023). Despite the importance of the topic, only a few scholars began to study how party-state capitalism influences state-business relations in China (Lin and Milhaupt Reference Lin and Milhaupt2023; Mueller et al. Reference Mueller, Wen and Wu2023).
Argument
This article argues that China will grant more subsidies to manufacturing firms more connected to the party-state. Scholars argue that politically connected firms can more easily influence officials and receive more state resources compared to non-connected firms (Kang Reference Kang2008; Kim Reference Kim2023; Moon and Schoenherr Reference Moon and Schoenherr2022; Pei Reference Pei2016). The state also relies on connected firms. The effects of connections on firms’ access to resources tend to be more pronounced in countries without a free market. In countries with a free-market, non-connected firms can still obtain state resources through competition. By contrast, in countries without a free-market, connections provide firms with a lot of informational advantage and bargaining leverage vis-à-vis officials, which help them obtain more resources (Diwan, Keefer, and Schiffbauer Reference Diwan, Keefer and Schiffbauer2020; Li Reference Li2023). From the vantage point of firms in China, there are several ways to build connections: bribing (e.g., buying/giving gifts); hire former bureaucrats; run for political office; and establish a Party Cell (Hou Reference Hou2015, Reference Hou2019; Huang and Véron Reference Huang and Véron2022; Lin Reference Lin2025a; Sun, Zhu, and Wu Reference Sun, Zhu and Wu2014).
Since the inauguration of the Xi administration, bribery has been less preferred by firms. Since Xi began corruption crackdowns in 2013, many firms have recognized that bribery can be extremely dangerous for them. Griffin, Liu, and Shu (Reference Griffin, Liu and Shu2022) have shown that Xi’s anti-corruption frightened many firms away from spending on socializing with bureaucrats. Hiring former bureaucrats is still common. At the same time, however, many firms are not fully sure about whether those who already left public office can meaningfully influence bureaucrats. Running for political office is a very attractive option. Once a top manager such as a chairperson or CEO has been seated in the National People’s Congress or in the People’s Political Consultative Conference, they often serve for five years. In this period, firms can interact with officials, use their connections to influence officials, and get more subsidies. Lastly, building a Party Cell has been seen by many firms as a meaningful way to establish political connections. In Fall 2012, the Xi leadership began to generate more pressure on both SOEs and private firms to abide by the requirement to build Party Cells. In Fall 2017, Xi re-emphasized the requirement.
In China, one of the best-known regulatory states, subsidy allocation is a development policy, which intends to replace markets by administrative planning (Tan Reference Tan2021). China’s regulatory system has been traditionally associated with four features: state-owned strategic industries; state institutions such as the SASAC (i.e., a state agency responsible for the supervision of state assets and for personnel management of SOEs); the bureaucratic origins of regulatory systems; and the fragmented authority of regulators (Hsueh Reference Hsueh2011; Pearson Reference Pearson2005). After Xi rose to power in Fall 2012, the party-state relied much more on new tools of Party influence (e.g., Party Cells) to embed itself more deeply into the economy. The party-state’s economic activism is manifest in the scope and content of its industrial policies such as the “13th Five-Year Plan (2016–20)” and “Made in China 2025.” Through “Made in China 2025,” the party-state wants to ensure that manufacturing firms will contribute to economic growth (i.e., economic objective) and national security (i.e., political objective) (It should be noted that the policy’s narrative has been more about national security than about economic growth).
In China, both central and local leaders want to facilitate economic growth. For central leaders, GDP is important since it indicates the nation’s strength. Beijing aims to overtake Washington in terms of the size of the economy. For local leaders, GDP is also important since central leaders examine the degree to which local leaders have accomplished key policy goals when they choose candidates for promotion (Chung Reference Chung2016; Lee Reference Lee2020; Lee Reference Lee2023; Shih, Adolph, and Liu Reference Shih, Adolph and Liu2012). To facilitate economic growth, one way that central and local leaders can choose is to increase fiscal expenditures such as subsidies (Guo Reference Guo2009). For instance, Lim, Wang, and Zeng (Reference Lim, Wang and Zeng2018) see subsidies as tools that central and local leaders in China employ to achieve their five-year plans. For instance, the “12th Five-Year Plan (2011–15)” aimed to foster sustainable development and equitable wealth distribution by implementing infrastructure construction plans, facilitating investment, and boosting employment. Subsidies are also tools that central and local leaders employ in order to implement specific industrial policies like “Made in China 2025” introduced in 2015 (Li, Yang, and Sandu Reference Li, Yang and Sandu2018; Sheldon and Dua Reference Sheldon and Dua2020).
Local leaders tend to prioritize boosting economic growth as a way to demonstrate their competence to central leaders for upward mobility. As a result, local leaders may want to find those manufacturing firms who appear aligned with the state’s policy agendas (e.g., politically connected firms). Central leaders also want to find those firms who seem aligned with the state’s policy agendas. Politically connected firms may appear more familiar with the state’s policy agendas compared with politically non-connected firms. In non-democratic regimes, many firms are usually informally connected to the state based upon personal relationships (guanxi), past school ties, and nepotism (Hicken Reference Hicken2011; Szakonyi Reference Szakonyi2019). Because informal interactions usually do not entail documentation, it is not easy to create, maintain, and increase repeated interactions between the firm and the state. When there exist few continued interactions, many officials will suspect that firms may not be politically motivated to perform constantly on the tasks that they value. For this reason, both central leaders and local leaders may want to find those firms which have formal political connections, for instance, Party Cells.
This article sees two types of firms as firms politically connected with the Chinese state: first, firms having Party Cells (a relatively newer type of connections); and second, firms having CEO/Chair concurrently holding public office in the People’s Congress, the People’s Political Consultative Conference, or the government (a relatively older type of connections). This article considers a firm with a Cell as a firm politically more connected compared to a firm without a Cell. Cells aim to enforce Party directives, supervise the observance with relevant laws and regulations, strengthen the unity of people, and improve the healthy development of the firms (Party Constitution 2022). In SOEs, Cells participate in major decision-making, for instance, regarding personnel. In both private firms and SOEs, Cells instill discipline and carry out ideological education. Both managers and normal workers are supposed to learn “socialism with Chinese characteristics” and “the thoughts of Xi Jinping” (Beck and Brødsgaard Reference Beck and Brødsgaard2022; Leutert and Eaton Reference Leutert and Eaton2021; Lin Reference Lin2021; Lin and Milhaupt Reference Lin and Milhaupt2021). Therefore, firms having Party Cells will be seen by the state as more politically connected compared to those without Party Cells.
This article also considers a firm with CEO/Chair concurrently holding public office as a politically connected firm compared to a firm without such managers. State organizations can document the activities of these executives through repeated interactions (Brancati Reference Brancati2014; Dickson Reference Dickson2007). Compared to firms without such executives, therefore, firms with such executives will find it hard to deviate from the state. Also, many of these executives voluntarily align themselves with the party-state’s interests (Milhaupt and Zheng Reference Milhaupt and Zheng2015). Holding public office is a rare opportunity and they can receive additional income (Truex Reference Truex2014). This article expects that the party-state will provide subsidies to these two types of firms (i.e., firms having Party Cells and firms having CEO/Chair concurrently holding public office) to ensure that they can contribute to its priorities. The discussion so far informs H1 through H4. Compared to H1 and H2 (the dependent variable is measured by subsidies including both central and local subsidies), H3 is specifically about central subsidies. H4 is specifically about local subsidies.
H1: A manufacturing firm having a Party Cell will receive more subsidies compared with a manufacturing firm having no Party Cell.
H2: A manufacturing firm with a CEO/Chair concurrently holding office in a state organization will receive more subsidies compared to a manufacturing firm without such a CEO/Chair.
H3: A politically connected firm will receive more central subsidies compared with a politically non-connected firm.
H4: A politically connected firm will receive more local subsidies compared with a politically non-connected firm.
Research design
Sample selection
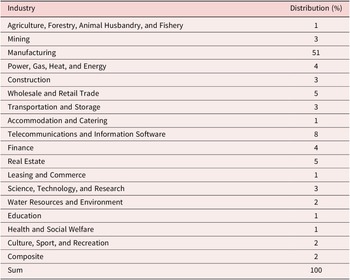
This article uses financial reports of firms listed in Shanghai and Shenzhen available at the China Securities Regulatory Commission (CSRC) (www.cninfo.com.cn/), WIND dataset (a major data provider in China; www.wind.com.cn/), Baidu, and the website of firms and governments. The unit of analysis is firm i year t. The number of observations is 17,538 (2009–22; 815 (2009), 960 (2010), 987 (2011), 1,097 (2012), 1,132 (2013), 1,177 (2014), 1,261 (2015), 1,379 (2016), 1,395 (2017), 1,414 (2018), 1,444 (2019), 1,477 (2020), 1,464 (2021), 1,536 (2022)). This number is calculated as follows. First, this article collects financial reports of manufacturing firms according to the CSRC. Table 1 shows that 51 percent of observations belong to the manufacturing industry. Second, among those manufacturing firms in 2015–22 (i.e., since the beginning of “Made in China 2025”), this article excludes those who have never indicated “Made in China 2025” in their financial reports. This is because they may not have been targets and beneficiaries of “Made in China 2025.” Last, this article assembles financial reports of the remaining firms from 2009–22.
Industry Classification (2009–22)

Of course, there might be some criticisms about this approach. To be specific, excluding samples without a compelling rationale could result in selection biases. If the data is excluded based on the dependent variable (e.g., the presence or absence of the links to the “Made in China 2025” campaign), it may lead to a sample that is not representative of the broader population, inevitably producing biased estimates. Although fewer than 7 percent of the data are excluded, it is necessary to conduct additional analyses using the entire samples. These additional analyses will help to compare the results excluding those who have never indicated “Made in China 2025” with the results including those who have never indicated “Made in China 2025.” Tables and Figures A121–A176 as well as A208–A229 reveal the results using the entire observations (i.e., including those who have never indicated “Made in China 2025” in their financial reports). These results are largely consistent with the results of the analyses excluding those firms who have never indicated “Made in China 2025” in their financial reports.
Dependent variable: Subsidies divided by assets (continuous)
According to the general definition released by the CSRC, the “government subsidies” refer to (but are not limited to) cash, R&D grants, investment/renovation support, bailouts, tax benefits, discounts on loans, guidance funds, etc. Established in 2003, the SASAC makes decisions on subsidies to some central and local SOEs in non-financial but strategic industries such as aviation and telecom (Yeo Reference Yeo2009). The National Development & Reform Commission (NDRC) is in charge of subsidizing private firms, non-strategic SOEs, and SOEs in the financial sector. Central NDRC makes broad and general guidelines. Local NDRCs interpret and enforce these guidelines. Central and local NDRCs coordinate with the Ministry of Commerce, the Ministry of Industry and Information Technology, and the Ministry of Finance. Such coordination does not imply that the NDRC is on a par with other Ministries in terms of a hierarchy. As the party-state’s chief coordination agency, the NDRC is in charge of reviewing policies drafted by the Ministries such as the Ministry of Industry and Information Technology.
In this article, the subsidy variable is operationalized by subsidies×100 divided by assets, given that firms with more assets tend to get more subsidies. There are two issues arising from the measure of subsidies. First, in the period 2015–22, there may be some money which is not related to “Made in China 2025.” This article finds that during the period 2015–22, more than 70 percent of subsidies were tied to “indigenous innovation” (zizhu chuangxin), “military-civil fusion” (junmin ronghe), “R&D” (yanfa), “science and technology” (keji), “industrial development” (chanye/zhizaoye fazhan), and “Made in China 2025.” Among the subsidies not classified under these categories, this article excludes the tax refunds which denote the money that firms simply get back from the taxes that they paid. Second and last, the subsidies need to be divided into central subsidies and local subsidies. This article finds that in 2009–22, central subsidies are observed in 16 percent of firm-year observations. Results employing central subsidies are reported in Tables A7, A8, Figure A9, Tables A33, A34, Figure A35, etc. Results employing local subsidies are reported in Tables A10, A11, Figure A12, Tables A36, A37, Figure A38, etc.
Treatment variable (I): Party Cell (binary)
In Fall 2012, the Xi Jinping administration reminded both SOEs and private firms of the requirement to have Party Cells (dangzhibu, dangwei, dangzu, dangzongzhi, jiwei, etc.). The Xi administration re-emphasized the requirement in Fall 2017. Before 2012, there already existed several rules that require firms to build Party Cells. In 1925, the Party Constitution required that entities with three Party members build a Party Cell. Also, Article 19 of China’s Company Law has required firms to establish Party Cells since 1993. Despite these rules, many private firms did not build Party Cells. One potential reason is that Xi’s predecessors, Jiang Zemin and Hu Jintao, wished to boost economic growth by accommodating the private sector (Lin Reference Lin2017; Tsai Reference Tsai2007). The Jiang and Hu administrations at least partly tolerated those firms which did not build Party Cells due to their potential for state interference in businesses (Heberer and Schubert Reference Heberer and Schubert2020). Compared with the Jiang and Hu administrations, however, the Xi administration has been pressuring both SOEs and private companies to set up Party Cells.
Reports by the Organization Department of the Central Committee inform that 16%, 58%, and 73% of private firms in all industries (both non-listed and listed) had Cells in 2008, 2013, and 2017. At the same time, 87%, 91%, and 91% of SOEs in all industries (both non-listed and listed) had Cells (Organization Department 2009, 2014, 2018). Figure 2 shows the trends of manufacturing firms with Cells. In 2009, 95% of SOEs in the manufacturing sector had Cells and the ratio rose to 99% in 2022. In 2009, 55% of private firms in the manufacturing sector had Cells and the ratio rose to 71% in 2022. For the purpose of robustness checks, this article also considers the alternative explanation that Cells in private firms may serve simply as a symbolic gesture to appease the government, exerting minimal influence on daily operations. This article shows that in some private firms, CEO or chair is the leader (shuji) of the Cell who oversees daily operations. It also shows that private firms whose CEO/Chair leads the Cell tend to get more subsidies compared with private firms whose CEO/Chair does not lead the Cell.
Trends of Manufacturing Firms with Party Cells (2009–22).

This article collects data on the Communist Party Cell variable from financial reports, Baidu, and the websites of firms and governments. In 2009–22, 68 percent of firm-year observations had Party Cells (“1”) while 32 percent of firm-year observations did not have Party Cells (“0”). Specific coding criteria are explained in the section of robustness checks. 68 percent may have decided to build Party Cells since they may have found it necessary to have a Party presence to develop relationships with Party officials who can influence their business (Huang and Véron Reference Huang and Véron2022). When firms respond to the top leadership’s call for setting up Party Cells, they will be more favored by having larger access to state resources such as subsidies. Firms’ responsiveness will strengthen the leaders’ authority and motivate other firms to follow suit. For this reason, firms having Party Cells can foster good relationships with Party officials. By contrast, 32 percent of manufacturing firms listed in China may have been reluctant to establish Party Cells. One potential reason is that if they established Party Cells, some domestic and foreign investors could think that political considerations would possibly dominate business activities.
Of course, not all Party Cells interfere into the activities of firms (Martina Reference Martina2017). Party Cells in some private firms may just serve as a symbolic gesture to appease party-state officials (Yue, Zheng, and Mao Reference Yue, Zheng and Mao2024). When Party Cells play symbolic and rhetorical roles, they will not meaningfully impact firms’ business activities. Nonetheless, some firms perceive that Party Cells may harm business performance and the board may become undermined (Lin Reference Lin2021; Liu and Zhang Reference Liu and Zhang2019; Zhang Reference Zhang2019). Figure 3 describes the annual trends of subsidies provided to manufacturing firms having Party Cells (2009–22). Figure 3 illustrates that the variation is both cross-sectional and time-varying. The gap between the average amount of subsidies distributed to manufacturing firms with Party Cells and the average amount of subsidies distributed to manufacturing firms without Party Cells generally increased from 2009 to 2022. In addition, the average amount of subsidies distributed to manufacturing firms with Party Cells was equivalent to 41 million RMB in 2009, which increased to 110 million RMB in 2022.
Trends of Subsidies Offered to Manufacturing Firms with Party Cells (2009–22).

Treatment variable (II): Public office (binary)
The Party Cell treatment is related to H1 (i.e., a manufacturing firm having a Party Cell will get more subsidies compared to a manufacturing firm having no Party Cell). The public office treatment is related to H2 (i.e., a manufacturing firm with a CEO/Chair concurrently holding office in a state organization will get more subsidies than a manufacturing firm without such a CEO/Chair). The public office variable refers to whether firm i’s CEO/Chair held a concurrent position in one of three institutions for at least six months: the government, the People’s Political Consultative Conference, or the People’s Congress (Hu et al. Reference Hu, Karim, Lin and Tan2020). Among manufacturing firms listed in China (2009–22), 24 percent of firm-year observations had CEO/Chair who concurrently held political office (“1”). At the same time, however, 76 percent did not have such high-ranking managers (“0”). Figure 4 illustrates the trends of manufacturing firms which had executives concurrently holding public positions. Starting in 2017, regardless of ownership structure, a growing number of firms had CEO/chair holding public office in state organizations.
Trends of Manufacturing Firms with Executives in Public Office (2009–22)

Figure 5 describes the trends of subsidies provided to manufacturing firms with executives concurrently holding public office (2009–22). Figure 5 illustrates that the variation is both cross-sectional and time-varying. The difference between the amount of subsidies to manufacturing firms with executives in public office and the amount of subsidies to those without such executives increased from 2009 to 2022. For robustness checks, this article also considers the alternative explanation that some Party Cells may demonstrate more political connectedness compared to other Party Cells in contexts of private firms. To consider this explanation, it uses the data on private firms having Party Cells. Compared to other private firms, in some private firms, the CEO or chair both is the leader of the Party Cell who oversees daily operations and concurrently holds public office. This article shows that private firms whose CEO/Chair holds public office and also serves as the leader of the Party Cell tend to receive more subsidies compared to private firms whose CEO/Chair does not lead the Party Cell.
Trends of Subsidies to Manufacturing Firms with Executives in Public Office (2009–22).

Covariates
First, this article controls for the ratio of debts×100 divided by assets. Firms with more debts may receive more subsidies since subsidies are often used to rescue financially distressed firms (Lee, Walker, and Zeng Reference Lee, Walker and Zeng2014). In other words, increased debt-to-assets ratio will lead to increased subsidy-to-assets ratio (i.e., the dependent variable in baseline analyses). Second, the number of employees is controlled for. Firms with more workers may receive more subsidies since subsidies are often used to maintain social stability (Lim, Wang, and Zeng Reference Lim, Wang and Zeng2018). Third, this article controls for the variable of whether firm i had a corporate entity listed in Hong Kong in year t. When firm i issues stocks in Hong Kong, it will be able to attract foreign stock investment, making it easy to ease financial constraints. This variable may either positively or negatively affect subsidy distribution. It may negatively affect subsidies when the state offers large subsidies to those firms with limited access to investors in Hong Kong. It may positively affect subsidies when the state intends to decrease firms’ reliance on financing from abroad.
Fourth, this article controls for the variable of state ownership because the party-state may find it easier to mobilize SOEs compared to private firms. In this respect, SOEs may receive more government subsidies compared to private firms. In 1998, China’s National Bureau of Statistics clarified that one primary criterion of state ownership is whether the central and/or local government retains 50 percent of firms’ stock shares (National Bureau of Statistics 2006). The International Monetary Fund and the US administration also employ the 50 percent threshold. This is one of the reasons why many political scientists and economists study the government’s management of firms with “majority state ownership” (Chen and Rithmire Reference Chen and Rithmire2020). However, state ownership sometimes also refers to the government as the controlling shareholder. When/where the government is the majority shareholder or the controlling shareholder, the value of “1” is assigned (In the section of robustness checks, the state ownership variable is used as the treatment variable). Financial reports available at the website of CSRC and WIND data provide data on the debt-to-assets ratio, employees, listing in Hong Kong, and ownership.
The fifth variable is the level of strategic importance. This article uses the measures developed by Pearson (Reference Pearson, Naughton and Tsai2015): “2” means the “highly strategic” industries (e.g., AI, aerospace, weapons, and vessels); “1” denotes the “strategic” industries (e.g., heavy industry, steel, chemicals, auto, electronics, and biotechnology); and “0” means the “least strategic” industries (e.g., manufacturing related to agriculture and ordinary machines). Sixth, it also controls for provinces where operating headquarters are located to account for regional differences. Seventh and last, the one-year lagged dependent variable (i.e., subsidies×100 divided by assets in year t-1) is included in the analyses. This article includes the lagged dependent variable for two reasons. First, subsidies in year t-1 affect subsidies in year t. Once firms start receiving subsidies, it becomes politically challenging for the state to remove these subsidies. Second, the lagged dependent variable can partly address reverse causality (Angrist and Pischke Reference Angrist and Pischke2009). If subsidies pressure firms to establish Party Cells, reverse causality can potentially occur. Summary statistics of those variables included in statistical analyses are reported in Table 2.
Descriptive Statistics (2009–22)

Note: The variable of “Head of Party Cell” is used in the section of robustness checks. The variables of “Total Factor Productivity,” “Net Profit per Assets,” and “GDP in the Secondary Sector Divided by Population” are used in section “Additional Analysis.” Regarding city-level, this article includes data on prefectures, Beijing, Tianjin, Shanghai, and Chongqing.
Estimation Strategy
One key issue when we estimate the effects of political connectedness on firm subsidies is non-random assignment of the political connectedness variable. For instance, a manufacturing firm with a Party Cell could be systematically different from a manufacturing firm without a Party Cell. Also, other firm characteristics—assets, debts, employees, cross-listing in Hong Kong, state ownership, and strategic industry—might confound the effects of Party Cells on subsidies. Thus, this article needs to deal with the criticism that the Party Cell variable might be somewhat meaningless and some firms had decided to establish Party Cells for some unobservable and observable reasons. Our concerns for the effects of Party Cells may also include the presence of unobserved variables that correlate with both Party Cells and subsidies, as well as reverse causality biases (e.g., the mechanism in which a firm’s subsidies might lead to the establishment of a Party Cell). For these reasons, using a naïve ordinary least squares model is not appropriate. In this regard, this article employs an entropy balancing technique.
The technique deploys a reweighting scheme that can calibrate unit weights to ensure that the reweighted treatment/control group meet a large set of pre-specified balance conditions that include information on observed sample moments (Hainmueller Reference Hainmueller2012; Truex Reference Truex2014). Therefore, the technique can partly correct for systematic inequalities in representation in regard of the covariate distributions. In this article, the treatment variable has two indicators (i.e., Party Cell and CEO/Chair concurrently holding office). Tables A1–A2 show balance tables after correcting for systematic inequalities in the distribution of variables. In Table A1, the Control (Weighted) columns show the related sample moments for the weighted non-Party Cell portfolio. Tables A1–A2 show the desired results. The weighted control group has significantly similar average values and variances across variables. This article uses equations (1) and (2) in order to estimate the effects of connectedness on subsidies. Equations (1) is designed to test H1. Equation (2) is designed to test H2. Results which demonstrate the effects of connections on central subsidies and local subsidies respectively (i.e., H3 and H4) are reported in the Appendix.
<Equation (1): Treatment—Party Cell>
<Equation (2): Treatment—Public Office>
 $$ {\left( Subsidy\hskip0.42em per\hskip0.42em Asset\right)}_{i,t}=\varphi +\rho {\left( Subsidy\hskip0.42em per\; Asset\right)}_{i,t-1}+{\beta}_2{\left( Public\ Office\right)}_{i,t}+{\lambda \delta}_{i,t}+{e}_{i,t} $$
where i,t: firm, year. $ {\delta}_{i,t} $
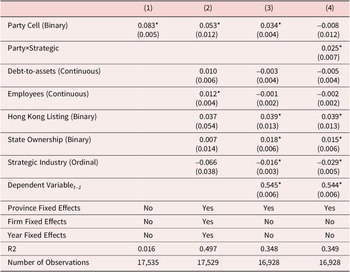
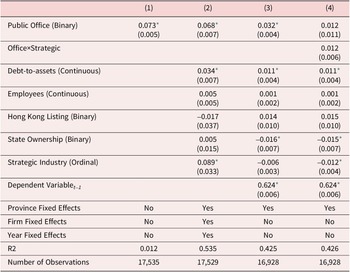
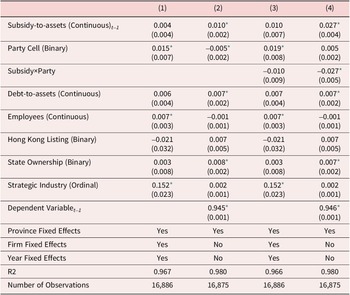
means debt per assets, employees, Hong Kong listing, state ownership, strategic importance, and provinces. In Tables 3 and 4, Model 1 shows the bivariate relationship between the treatment and the outcome. Model 2 shows the results with the firm and year fixed effects. Model 3 shows the baseline results. Model 4 adds an interaction between political connectedness and strategic importance. In Models 3 and 4, the firm and year fixed effects are not included. Angrist and Pischke (Reference Angrist and Pischke2009) have suggested that a lagged dependent variable and unit fixed effects create similar effects, therefore, using both will produce biased estimates.
$ {\delta}_{i,t} $
means debt per assets, employees, Hong Kong listing, state ownership, strategic importance, and provinces. In Tables 3 and 4, Model 1 shows the bivariate relationship between the treatment and the outcome. Model 2 shows the results with the firm and year fixed effects. Model 3 shows the baseline results. Model 4 adds an interaction between political connectedness and strategic importance. In Models 3 and 4, the firm and year fixed effects are not included. Angrist and Pischke (Reference Angrist and Pischke2009) have suggested that a lagged dependent variable and unit fixed effects create similar effects, therefore, using both will produce biased estimates.
Determinants of Subsidies (2009–22) / Entropy Balancing Technique (Treatment: Party Cell)

Note: The unit of analysis is the firm-year. The dependent variable is measured by the amount of subsidies divided by assets. Standard errors are in parentheses. *p < 0.05.
Determinants of Subsidies (2009–22) / Entropy Balancing Technique (Treatment: Public Office)

Note: The unit of analysis is the firm-year. The dependent variable is measured by the amount of subsidies divided by assets. Standard errors are in parentheses.
* p < 0.05.
Table A7, Table A8, Figure A9, Table A33, Table A34, Figure A35, Table A74, Table A75, Figure A76, Table A98, Table A99, Figure A100, Table A131, Table A132, Figure A133, Table A160, Table A161, Figure A162, Table A181, Figure A182, Table A196, Figure A197, Table A208, Figure A209, Table A220, and Figure A221 show that connected firms receive more central subsidies, compared with non-connected firms. These results support H3 (i.e., A connected firm will receive more central subsidies compared with a non-connected firm). In addition, Table A10, Table A11, Figure A12, Table A36, Table A37, Figure A38, Table A77, Table A78, Figure A79, Table A101, Table A102, Figure A103, Table A134, Table A135, Figure A136, Table A163, Table A164, Figure A165, Table A183, Figure A184, Table A198, Figure A199, Table A210, Figure A211, Table A222, and Figure A223 demonstrate that connected firms also receive more local subsidies, compared with non-connected firms, which support H4.
Baseline Results
Table 3 supports H1 that a manufacturing firm having a Party Cell will receive more subsidies compared with a manufacturing firm having no Party Cell. Table 4 supports H2 that a manufacturing firm with a CEO/Chair concurrently holding office in a state organization will receive more subsidies compared to a manufacturing firm without such a CEO/Chair. The value of R2 in Tables 3 and 4 shows that Models 3 and 4 can explain at least 35 percent of the variations within the dependent variable. Some covariates did not affect subsidy distribution. In Models 3 and 4 in Table 3, neither the ratio of debt-to-assets nor the number of employees affected subsidies. The debt-to-assets may not be a strong predictor. Although subsidies often intend to rescue financially distressed firms (Lee, Walker, and Zeng Reference Lee, Walker and Zeng2014), the party-state may also be unwilling to offer subsidies which can induce moral hazard. The number of employees also does not seem to be a strong predictor. Although subsidies tend to be granted to firms having many employees, they are also granted to small firms which engage in high-tech items. Lastly, the effects of the Hong Kong listing variable are not consistent across Tables 3 and 4.
Figure 6 describes the effects of political connectedness on subsidy allocation conditional on the level of strategic importance. Figure 6 shows that the positive effect of a manufacturing firm’s political connectedness on subsidies is large especially when its strategic importance is high. These results suggest how China uses subsidies to achieve both economic and political goals. Subsidy allocation is reflective of state priorities in terms of both economic and political goals (Hou and Li Reference Hou and Li2023; Lim, Wang, and Zeng Reference Lim, Wang and Zeng2018). “Made in China 2025” has framed the development of the Chinese manufacturing industry in terms of national security (Pearson, Rithmire, and Tsai Reference Pearson, Rithmire and Tsai2022, Reference Pearson, Rithmire and Tsai2023; State Council 2015a). The party-state has attached importance to “self-reliance” since dependence on foreign firms can harm the national interest. However, firms manufacturing cutting-edge products do not necessarily mean that they are willing to contribute to the state’s political objectives. Chinese politicians may therefore provide more subsidies to those manufacturing firms which are politically more connected with the state.

Additional analysis: The effects of subsidy on productivity
Primary dependent variable: Local economic growth
Some scholars suggest that industrial policies can spur economic growth (Alder, Shao, and Zilibotti Reference Alder, Shao and Zilibotti2016; Rodrik Reference Rodrik2007). Given that increased fiscal expenditure will lead to higher GDP, subsidies as a common type of fiscal support can help increase the size of GDP. Other scholars, however, suggest that industrial policies can sometimes hurt economic growth (Agarwal Reference Agarwal2023; Criscuolo et al. Reference Criscuolo, Martin, Overman and Van Reenen2019). Politicians and officials select winners and losers, which can lead to resource misallocations and market distortions. Politicians and officials prioritize political logic above economic logic. This article expects that the positive effects of subsidy on local economic growth will decrease when/where political connectedness increases. Firms having Party Cells and firms whose CEO/Chair are concurrently seated in party-state organs will be pressured to perform well on the tasks that the state values, such as following Party ideologies, protecting the environment, and keeping employment rates high. Firms having Party Cells will find it hard to care only about their own businesses (Han, Li, and Oi Reference Han, Li and Oi2022; Lim, Wang, and Zeng Reference Lim, Wang and Zeng2018).
This article also expects that the effects of subsidy upon local economic growth will increase when/where there is no political connectedness. Such firms will be less likely to see the state as their supervisor since they are more detached from the state. They will care more about their own business without paying much attention to what the state prioritizes, for instance, the degree to which firms follow the state. The discussion so far informs H5 and H6:
H5: The positive effect of subsidy on local economic growth will decrease when firmi has a Party Cell.
H6: The positive effect of subsidy on local economic growth will decrease when firmi’s CEO/Chair holds office in a state organization.
In H5 and H6, the dependent variable is the level of local economic growth, operationalized by GDP in the secondary sector divided by city population. Data on this variable are collected from China Data Online (www.china-data-online.com/). The “city” refers to prefectures plus Beijing, Tianjin, Shanghai, and Chongqing. Prefecture-level data are better than province-level data since province-level data are too aggregate. This article uses data on GDP in the secondary sector (e.g., manufacturing) because subsidies granted to manufacturing firms will not directly boost growth in the primary sector (e.g., agriculture and forestry) or in the tertiary sector (e.g., education and tourism).
<Equation (3): Treatment—Party Cell>
 $$ {\displaystyle \begin{array}{l}{\left( Per\hskip0.42em Capita\hskip0.42em GDP\hskip0.42em in\ the\ Secondary\ Sector\right)}_{i,t}\\ {}\hskip1em ={\displaystyle \begin{array}{l}\alpha +\rho {\left( Per\hskip0.42em Capita\hskip0.42em GDP\hskip0.42em in\ the\ Secondary\ Sector\right)}_{i,t-1}\\ {}+\hskip2px {\beta}_1{( Party\ Cell)}_{i,t}+{\beta}_2{\left( Subsidy\hskip0.42em per\hskip0.42em Asset\right)}_{i,t-1}+{\beta}_3{( Party\ Cell)}_{i,t}\\ {}\times {\left( Subsidy\hskip0.42em per\hskip0.42em Asset\right)}_{i,t-1}+{\zeta \delta}_{i,t}+{\varepsilon}_{i,t}\end{array}}\end{array}} $$
<Equation (4): Treatment—Public Office>
 $$ {\displaystyle \begin{array}{l}{\left( Per\hskip0.42em Capita\hskip0.42em GDP\hskip0.42em in\ the\ Secondary\ Sector\right)}_{i,t}\\ {}\hskip1em ={\displaystyle \begin{array}{l}\tau +\xi {\left( Per\; Capita\hskip0.42em GDP\hskip0.42em in\ the\ Secondary\ Sector\right)}_{i,t-1}\\ {}+\hskip2px {\beta}_4{( Public\ Office)}_{i,t}+{\beta}_5{\left( Subsidy\hskip0.42em per\hskip0.42em Asset\right)}_{i,t-1}\\ {}+\hskip2px {\beta}_6{( Public\ Office)}_{i,t}\times {\left( Subsidy\hskip0.42em per\hskip0.42em Asset\right)}_{i,t-1}+{\kappa \delta}_{i,t}+{e}_{i,t}\end{array}}\end{array}} $$
To examine H5 and H6 , this article employs equation (3) and equation (4) where the entropy balancing technique is deployed. Table 5 examines the effect of subsidies upon local economic growth conditional upon whether firm i had a Party Cell. Table 6 demonstrates the effect of subsidies upon local economic growth conditional upon whether firm i’s CEO/Chair concurrently held office in a state organization. In Models 1–2 in Tables 5–6, there is no interaction term between firm subsidy and political connectedness. By contrast, in Models 3–4, there exists an interaction term between firm subsidy and political connectedness. Figure 7 illustrates the results demonstrated in Model 4 in Tables 5–6. The figure on the top is drawn based on Model 4 in Table 5. The figure on the top describes that increased subsidies on average led to increased local economic growth when firm i had no Party Cell. The positive effects of subsidies upon local economic growth, however, disappeared when firm i had a Party Cell.
The Effect of Subsidies on Local Economic Growth Conditional on Party Cell ((2009–22) / Entropy Balancing Technique) (Treatment: Party Cell)

Note: The dependent variable is measured by GDP in the secondary sector divided by population. Standard errors are in parentheses.
* p < 0.05.
The Effect of Subsidies on Local Economic Growth Conditional on Public Office ((2009–22) / Entropy Balancing Technique) (Treatment: Public Office)

Note: The dependent variable is measured by GDP in the secondary sector divided by population. Standard errors are in parentheses.
* p < 0.05.

Secondary dependent variable: Firm-level productivity
In the previous section, the dependent variable is local economic growth, measured with GDP in the secondary sector divided by city population. In this section, the dependent variable is firm-level productivity. This article uses two indicators to measure firm-level productivity. The first indicator is net profits divided by assets, which is often called as “return on assets” (RoA). The second indicator refers to total factor productivity. We can calculate the total factor productivity by dividing the output by the weighted average value of capital and labor (It should be noted that the standard weighting of 0.7 is for labor and 0.3 is for capital) (Gordon Reference Gordon2017). Regarding firm-level productivity, some scholars note that increased subsidy can decrease financing costs, provide investment opportunities, improve operational processes, and lead to increased firm-level productivity (Du et al. Reference Du, Girma, Görg and Stepanok2023; Li, Jin, and Kumbhakar Reference Li, Jin and Kumbhakar2022; Yang Reference Yang2023).
This article expects that the positive effects of subsidy on firm-level productivity will decrease when/where connectedness increases. Firms having Party Cells and firms whose CEO/Chair are concurrently seated in party-state organs will be pressured to perform well on the tasks that the state values. They will find it difficult to care only about their own businesses (Han, Li, and Oi Reference Han, Li and Oi2022; Lim, Wang, and Zeng Reference Lim, Wang and Zeng2018). This article also expects that the effects of subsidy on firm-level productivity will increase when/where there is no political connectedness. Firms without Party Cells will be less likely to see the state as their supervisor since they are more detached from the state. These firms will care more about their own business without paying much attention to what the state prioritizes. The discussion so far informs H7 and H8:
H7: The positive effect of subsidy on productivity will decrease when firmi has a Party Cell.
H8: The positive effect of subsidy on productivity will decrease when firmi’s CEO/Chair holds office in a state organization.
Tables A20, A21, Figure A22, Tables A46, A47, and Figure A48 in the Appendix demonstrate the results using the first indicator (i.e., return on assets). These Tables and Figures confirm the validity of H7 and H8. Table A20, Figure A22, Table A46, and Figure A48 indicate that the positive effect of subsidy on return on assets decreased when firm i had a Communist Party Cell. Table A21, Figure A22, Table A47, and Figure A48 indicate that the positive effect of subsidy on return on assets decreased when firm i’s CEO/Chair held public office in a party-state organization. Tables A17, A18, Figure A19, Tables A43, A44, and Figure A45 in the Appendix demonstrate the results using the second indicator (i.e., total factor productivity). These results demonstrate that compared with when firm i was not connected to the party-state, when firm i was connected to the party-state, it experienced relatively lower total factor productivity. These results can suggest the conditions under which subsidies may undermine total factor productivity. This article notes that these results are relatively weaker compared with the results using the variable of return on assets and using the variable of city-level growth.
The results that the effects of subsidy on return on assets became relatively weaker as political connectedness rose contribute to the literature on the regulatory state. In a regulatory state, subsidy distribution is an important tool to carry out industrial policies (Tan Reference Tan2021). In this regard, many academics have made efforts to understand the effects of subsidies on productivity. Their findings, however, have been inconsistent. Some academics have suggested that increased subsidies can lead to decreased productivity (Branstetter, Li, and Ren Reference Branstetter, Li and Ren2022; Lim, Wang, and Zeng Reference Lim, Wang and Zeng2018). For instance, many recipient firms are supposed to prioritize state goals over their own business. Subsidies can also incentivize dependency on government assistance. Subsidies may also provide a crutch to those firms that do not deserve, which will undermine productivity. Other academics, however, have suggested that subsidies can ease financial constraints, improve business strategies, and thus lead to increased productivity (Du et al. Reference Du, Girma, Görg and Stepanok2023; Li, Jin, and Kumbhakar Reference Li, Jin and Kumbhakar2022; Takeuchi and McNeme Reference Takeuchi and McNeme2023; Yang Reference Yang2023). This article shows that the positive effect of subsidies on return on assets is conditioned by political connectedness.
Robustness checks and alternative explanations
In the Appendix, this article conducts additional analyses and reports the results. This section provides a brief explanation about those results reported in the Appendix. For instance, this article uses the state ownership variable as the treatment variable to test two hypotheses
H9: A state-owned manufacturing firm will receive more subsidies compared with a privately owned manufacturing firm;
H10: The effect of subsidy on local economic growth will decrease when firmi is considered as a state-owned enterprise.
In section “Extensional Analyses: State-owned Enterprises vs. Private Firms,” this article finds that ownership did not significantly matter for subsidy allocation (i.e., both state-owned and private firms received subsidies). Results also do not strongly support H10. This article also studies the effects of bribing on firm subsidies in section “Additional Analyses on the Effects of Bribing on Firm Subsidies.” The results show that increased firm bribing may not lead to increased firm subsidies. In addition, this article uses a two-way fixed effects model instead of the lagged dependent variable model.
Critics may claim that it would be necessary to study the subsidies in 2015–22 given that “Made in China 2025” was introduced in 2015. Of course, they may admit that its content developed from three earlier policy initiatives: the “12th Five-Year Plan (2011–15),” the “Medium- and Long-Term Program for Science and Technology Development, 2006–2020” (Guojia zhongchangqi kexue he jishu fazhan jihua gangyao, 2006–2020), and “Strategic Emerging Industry Development” (Jiakuai peiyu he fazhan zhanlvexing xinxing chanye de jueding) adopted in 2010. For this reason, they may recognize the usefulness of analyses in 2009–22. Yet, they may also recognize that it will be useful to conduct analyses in 2015–22. So, this article tests the hypotheses using the observations from 2015–22. The results are reported in Tables and Figures A23–A48. The Appendix section “Relationships with Mueller et al. (Reference Mueller, Wen and Wu2023),” identifies some differences between this article and a similar study in terms of coding Party Cells. Then it conducts additional analyses in line with the coding criteria of Mueller et al. (Reference Mueller, Wen and Wu2023). For more detailed discussions, readers are encouraged to read the Appendix.
Future Research
I would like to suggest some potential research questions. First, in regard to Jäger and Kim (Reference Jäger and Kim2019) and Kim (Reference Kim2025), how can the knowledge/perception about firm connectedness with the party-state influence investment decisions of stock investors inside/outside the mainland China? Second, regarding Chung and Kim (Reference Chung and Kim2023), Wang (Reference Wang2024), and Wang and Xu (Reference Wang and Xu2025), how do the US and its allies assess China’s subsidies to its domestic companies? Third, in regard to Li (Reference Li2025), how does China deal with the US-led sanctions against China’s domestic firms? Fourth, concerning Lin (Reference Lin2024) and Lin (Reference Lin2025a), how can politically non-connected and connected firms’ strategic behavior influence the state’s resource allocation? Fifth, in relations to Lin (Reference Lin2025b) and Yeo (Reference Yeo2025), how can the distribution of subsidies to domestic companies influence the operation of special guidance funds, Public–Private Partnership in China, and China’s global infrastructure initiatives? Sixth and finally, in regard to Cha, Lee, Osgood, and Park (Reference Cha, Lee, Osgood and Park2025), how can firms’ political connections influence their innovation efforts? I hope that this article will contribute to these strands of the literature on state-business relations.
Supplementary material
To view supplementary material for this article, please visit http://doi.org/10.1017/jea.2025.10010.
Acknowledgement
The author is particularly thankful for Margaret Pearson, Jae-Ho Chung, Paul Huth, Scott Kastner, John McCauley, Seungjun Kim, Yue Hou, Xiaonan Wang, Hyunki Kim, Zhenze Huang, Yajie (Robin) Wang, Sungbok Shin, and Hu Quan who read and provided comments on earlier versions of this article. An earlier version of this article was presented at APSA Annual Meeting 2023 in Los Angeles. As a non-Chinese, the author gained insights about state-business relations in China from the work of Yue Hou, Siyao Li, Zeren Li, and Shengqiao Lin.
Competing interests
The author declares none.


 Open access