





1. Introduction
Prediction is a feature of both native (i.e., L1) and non-native (i.e., L2) sentence processing (e.g., for review, see Bovolenta & Marsden, Reference Bovolenta and Marsden2022; Kaan, Reference Kaan2014; Schlenter, Reference Schlenter2023). In addition to processing language as it comes (i.e., bottom-up), comprehenders predict what will come next (i.e., top-down). However, comprehenders’ ability to predict may be impacted by a range of (e.g., situational) factors, which are only beginning to be understood, but raise important questions about whether prediction is essential to language comprehension (e.g., Huettig & Mani, Reference Huettig and Mani2016). In addition, these impacts may differ between L1 and L2. The focus of this research was speech rate, which reflects a potential source of difficulty for language comprehension that comprehenders must accommodate during real-world communication. The aim of this research was to compare L1 and L2 comprehenders’ ability to predict when hearing rapid speech. To the extent that prediction may be limited by factors such as speech rate, its involvement in language comprehension may also be limited.
Prediction is a major focus in psycholinguistics. The literature provides significant evidence of prediction in L1, including research using the visual world paradigm (e.g., Tanenhaus, Spivey-Knowlton, Eberhard, & Sedivy, Reference Tanenhaus, Spivey-Knowlton, Eberhard and Sedivy1995). For example, participants hearing predictive sentences like “The boy will eat the…,” while viewing visual scenes with predictable (i.e., edible) objects like a cake and other unrelated (i.e., inedible) objects like a ball, car and train, fixated the former before hearing “cake” (e.g., vs. “move”; Altmann & Kamide, Reference Altmann and Kamide1999). This evidence suggests that L1 comprehenders use semantics (e.g., selectional restrictions of verbs) to predict what will come next.
Prediction’s connection to language comprehension has long centred on speed, including both the speed of (e.g., sentence) processing and the speed of the linguistic signal (e.g., speech rate). For example, a classic finding from the reading literature is that predictable words are read faster (e.g., Ehrlich & Rayner, Reference Ehrlich and Rayner1981; for review, see Staub, Reference Staub2015). Comprehenders’ top-down predictions may minimise the time needed for bottom-up processing (e.g., see Kuperberg & Jaeger, Reference Kuperberg and Jaeger2016), thus linking prediction to the speed of processing. In addition, prediction may enable comprehenders to keep pace with the (e.g., rapid) time constraints and temporal dynamics of spoken language processing. This support may be essential when hearing rapid speech, which minimises the time for processing and necessitates especially fast comprehension, thus linking prediction to the speed of the linguistic signal.
Recent research provides evidence of L1 comprehenders’ ability to predict when hearing rapid speech. On the one hand, prediction is not unaffected by speech rate. For example, participants hearing predictive sentences in Dutch like “Kijk naar de afgebeelde…” (“Look at the pictured…”), while viewing visual arrays with predictable objects (e.g., consistent with the determiner “de”) like bike and other unrelated objects, fixated the former more than the latter at a slow but not normal speech rate following a one second visual preview (Huettig & Guerra, Reference Huettig and Guerra2019). On the other hand, prediction is, to a degree, resilient. For example, participants hearing predictive sentences like “What the man will ride, which is shown on this page, is the…,” while viewing visual arrays with predictable objects like a bike and other unrelated objects, made mouse cursor movements to the former before hearing “bike” at an average speech rate of up to ~9 syllables per second (e.g., vs. “spot”; Kukona, Reference Kukona2023). Estimates of typical speech rates vary considerably (e.g., see Fernandez, Engelhardt, Patarroyo, & Allen, Reference Fernandez, Engelhardt, Patarroyo and Allen2020), but Kuperman et al. (Reference Kuperman, Kyröläinen, Porretta, Brysbaert and Yang2021) provide a helpful metric: they found that comprehension was unhindered at speech rates of up to 6.5 syllables per second. They manipulated the average speech rate of narrative passages (e.g., from 4 through 9 syllables per second), which (i.e., English monolingual) participants heard followed by comprehension questions (e.g., capturing participants’ ability to keep pace). Participants’ accuracy was consistent through 6.5 syllables per second and then declined steeply. Thus, comprehenders in Kukona (Reference Kukona2023) predicted even when hearing speech that was sufficiently rapid to hinder comprehension. In addition, performance was negatively correlated with speech rate (e.g., complementing Huettig & Guerra, Reference Huettig and Guerra2019). This evidence suggests that prediction’s function includes supporting the comprehension of rapid speech by speeding processing (e.g., to the extent possible), at least in L1 comprehenders.
Prediction in non-native comprehenders is also an area of interest. The L2 literature provides significant evidence of prediction. For example, participants hearing predictive sentences like “Mary knits a…,” while viewing visual arrays with predictable objects like a scarf and other unrelated objects, fixated the former before hearing “scarf” (e.g., vs. “loses”; Dijkgraaf, Hartsuiker, & Duyck, Reference Dijkgraaf, Hartsuiker and Duyck2017). In addition, performance was similar in L1 and L2. Relatedly, participants hearing predictive sentences like “I know the friend of the dancer that will open the present,” while viewing visual scenes with predictable objects like a present and other unrelated objects, fixated the former before hearing “present” (e.g., vs. “get”; Chun & Kaan, Reference Chun and Kaan2019). In contrast, prediction was delayed in L2 compared to L1. This evidence suggests that both L1 and L2 comprehenders use semantics to predict what will come next (e.g., also see Chambers & Cooke, Reference Chambers and Cooke2009; Ito, Corley, & Pickering, Reference Ito, Corley and Pickering2018). However, prediction may also differ between L1 and L2.
Differences in prediction between L1 and L2 may relate to differences in the speed of processing. Schlenter’s (Reference Schlenter2023) review of the prediction literature highlights that “almost all studies… have reported at least subtle and sometimes substantial differences between L1 and L2 processing” (p. 253). One explanation for these findings is that bilinguals co-activate competing cross-language information, which may slow prediction in L2 (e.g., see Schlenter, Reference Schlenter2023). For example, participants hearing words like “marker” in L2 (English), while viewing visual arrays with interlingual distractor objects from L1 (Russian) like marka (stamp) or control objects, fixated the former more than the latter (Spivey & Marian, Reference Spivey and Marian1999). This evidence suggests that information is co-activated across languages, which may interfere with processes in L2. A related explanation is that bilinguals have lower quality linguistic representations in L2 due to lower exposure, which may also slow prediction in L2 (e.g., see Kaan, Reference Kaan2014). In addition, these differences may interact with (e.g., situational) factors that impact comprehenders’ ability to predict. For example, differences in processing between L1 and L2 may be made particularly acute by rapid speech, such that L2 comprehenders, in particular, may have insufficient time to achieve predictive behaviours (i.e., the temporal buffer between predictive information in the linguistic signal and a predictable word may be insufficient for processes to reach their resolution in L2).
Recent research suggests that L2 comprehenders’ ability to predict when hearing rapid speech may be diminished. For example, participants hearing predictive sentences like “The tailor trims the…,” while viewing visual arrays with predictable objects like a suit and other unrelated objects, fixated the former before hearing “suit” (Fernandez et al., Reference Fernandez, Hadley, Koç, Gamboa and Allen2025b). In addition, performance at faster speech rates (e.g., up to 5.65 syllables per second) was diminished in L2 compared to L1. This evidence suggests that in comparison to L1, prediction in L2 may be too slow to support the comprehension of particularly rapid speech. However, Fernandez et al. (Reference Fernandez, Hadley, Koç, Gamboa and Allen2025b) argue for “caution” in interpreting their findings because they “did not directly manipulate speech rate and also had few very fast or slow speech rates” (p. 1253). Relatedly, Fernandez et al. (Reference Fernandez, Engelhardt, Patarroyo and Allen2020) manipulated the speech rate of sentences with filler-gap dependencies and found that L2 participants did not make anticipatory eye movements at faster speech rates (e.g., above 3.5 syllables per second).
To summarise, prediction and speed (e.g., of both processing and the linguistic signal) are closely linked. Evidence that L1 comprehenders predict even when hearing impressively rapid speech (e.g., Kukona, Reference Kukona2023) suggests that prediction’s function includes supporting speeded comprehension, at least in L1. In contrast, evidence that prediction is delayed in L2 (e.g., Chun & Kaan, Reference Chun and Kaan2019) and diminished at faster speech rates in L2 (e.g., Fernandez et al., Reference Fernandez, Hadley, Koç, Gamboa and Allen2025b) suggests that prediction’s function may differ qualitatively in L2 (e.g., perhaps emphasising learning rather than speech rate; see Bovolenta & Marsden, Reference Bovolenta and Marsden2022). However, the link between prediction and speech rate is only beginning to be understood, especially in L2. Rather, the psycholinguistic literature has concentrated on the slow end of the speech rate continuum (e.g., see Fernandez et al., Reference Fernandez, Engelhardt, Patarroyo and Allen2020; Kukona, Reference Kukona2023).
Relatedly, evidence for prediction in L2 has relied on lab-based approaches. In contrast, mouse cursor tracking is an “online” alternative that both provides a continuous online measure of behaviour and is readily adapted to internet-mediated online data collection. An advantage of internet-mediated approaches like mouse cursor tracking is their potential to extend research beyond the lab and reach the breadth of human diversity (e.g., including language experiences). While mouse cursor tracking is sensitive to prediction in L1 (e.g., Kukona, Reference Kukona2023, Reference Kukona2025, Reference Kukona2026; Kukona & Hasshim, Reference Kukona and Hasshim2024; Schlenter & Westergaard, Reference Schlenter and Westergaard2024; Ye & Qu, Reference Ye and Qu2025), its sensitivity to prediction in L2 has not been closely addressed.
The aim of this experiment was to compare L1 and L2 prediction at speed using mouse cursor tracking. Building on Kukona (Reference Kukona2023), native and non-native participants heard predictive (e.g., “What the man will ride, which is shown on this page, is the…”) and non-predictive (e.g., “What the man will spot, which is shown on this page, is the…”) sentences at normal and fast speech rates (e.g., averaging ~3 and 9 syllables per second) while viewing visual arrays with predictable (e.g., bike) and unrelated (e.g., kite) objects (e.g., see Figure 1). Predictive and non-predictive sentences at normal and fast speech rates were randomly intermixed in this experiment. Speech rate was manipulated to encompass the faster end of the continuum (e.g., than is typical of the prediction literature), and mouse cursor movements were measured as an index of both L1 and L2 prediction. If prediction in L2 is too slow to support speeded comprehension, then non-native participants were expected to make predictive mouse cursor movements to predictable objects at normal but not fast speech rates.
Example visual array with a predictable bike and unrelated kite for the predictive sentence, “What the man will ride, which is shown on this page, is the bike.”
Note. The grey square shows the icon that participants clicked on to begin each trial.

2. Method
This experiment tested for prediction by measuring mouse cursor movements to predictable objects (e.g., bike) when L1 and L2 participants heard predictive sentences (e.g., “ride…”) at normal and fast speech rates.
2.1. Participants
Eighty-five participants were recruited from the University of Greenwich community (age M = 24.59, SD = 9.16; 63 female, 21 male, 1 no response). Participants included native L1 (n = 40) and non-native L2 (n = 45) speakers of English (i.e., as self-reported by participants). The L2 group included native speakers of a diversity of languages, including Spanish, Russian and Bengali. The sample size of both groups was adequate to detect a markedly smaller effect than in Kukona (Reference Kukona2023; e.g., d z = 0.83 for predictive vs. non-predictive sentences at the fastest speech rate).
2.2. Design and materials
Sentence type (predictive and non-predictive) and rate type (normal and fast) were manipulated within participants. Visual arrays and sentences were identical to Kukona (Reference Kukona2023). Each visual array included a predictable (e.g., bike) and unrelated (e.g., kite) object (e.g., see Figure 1), which were from MultiPic (Duñabeitia et al., Reference Duñabeitia, Crepaldi, Meyer, New, Pliatsikas, Smolka and Brysbaert2018). Visual arrays used normalised coordinates ranging from −1 to 1, with objects sized 0.30 × 0.60 and centred at (±0.85, 0.70). Each visual array was linked to a predictive (e.g., “What the man will ride, which is shown on this page, is the bike.”) and non-predictive (e.g., “What the man will spot, which is shown on this page, is the bike.”) sentence. All sentences included “which is shown on this page” between the verb (e.g., “ride”) and noun (e.g., “bike”), which extended the temporal expanse across which predictive effects could be detected. In predictive sentences, the verb was confirmed as more associated with the predictable than unrelated object based on Latent semantic analysis (e.g., Landauer & Dumais, Reference Landauer and Dumais1997), while in non-predictive sentences, the verb was as associated with the predictable as unrelated object (e.g., for details, see Kukona, Reference Kukona2023). Sentences were recorded at a natural speech rate (M = 2.98 syllables per second) in the normal condition, while the duration manipulation function in Praat (Boersma, Reference Boersma2001) was used to triple this rate (M = 8.94 syllables per second) in the fast condition. Thus, “normal” describes recordings that were not manipulated (i.e., while “fast” describes recordings that were manipulated to be faster), although the normal recordings do not necessarily reflect a typical speech rate. Four counterbalanced lists were created that included each of the 36 visual arrays once. On each list, one half of visual arrays were presented with a predictive sentence and the other half with a non-predictive sentence, and one half of sentences of each type were presented at a normal rate and the other half at a fast rate. Across lists, each visual array was included in each condition once, and on each list, nine visual arrays were included in each condition.
2.3. Procedure
The experiment was created in PsychoPy (e.g., Peirce et al., Reference Peirce, Gray, Simpson, MacAskill, Höchenberger, Sogo and Lindeløv2019), and internet mediated data collection was through Pavlovia (https://pavlovia.org). Like Kukona (Reference Kukona2023), participants were presented 36 experimental trials without practice or filler trials. The procedure was identical to Kukona (Reference Kukona2023): participants clicked on an icon at (0, −0.85) to begin each trial, they viewed a visual array like Figure 1 with a predictable and unrelated object, they heard a sentence after a 500 millisecond preview, and they were instructed to click on the object referred to in the sentence to end each trial. Trial order and object location were randomised. Finally, L2 participants completed a brief questionnaire based on the LEAP-Q (Marian, Blumenfeld, & Kaushanskaya, Reference Marian, Blumenfeld and Kaushanskaya2007) that addressed language experience and proficiency.
3. Results
One participant whose data were sampled at less than 30 Hz, three participants who used a touchscreen, and eight participants whose accuracies were near chance (<60%) were removed from the analyses. Following their removal, the L1 group included 33 participants (age M = 22.18, SD = 9.03; 23 female, 9 male, 1 no response) and the L2 group included 40 participants (age M = 27.08, SD = 9.36; 32 female, 8 male). L1 participants included 16 (48%) monolingual speakers of English, 10 (30%) participants who spoke one additional language besides English, 6 participants who spoke two or more additional languages besides English (18%), and one participant who did not respond. L2 participants learned English from an average age of 10.95 years (SD = 7.11), and their average length of exposure to English was 16.13 years (SD = 8.94). The L2 group rated their average English fluency as 9.40 (SD = 1.66) using an 11-point scale ranging from 0 = Not Proficient to 10 = Excellent. In addition, the L2 group rated their average frequency of using English with friends as 8.85 (SD = 1.99), with family as 3.95 (SD = 2.63), reading as 9.00 (SD = 2.04) and watching TV as 8.77 (SD = 1.90) using an 11-point scale ranging from 0 = Never to 10 = Always. Their frequency of using English summed over these contexts was 30.56 (SD = 5.93), which reflects an overall frequency of using English approximately midway between “Sometimes” and “Always.”
Mean accuracy was 98.65% (SD = 2.87) in the L1 group and 97.64% (SD = 6.40) in the L2 group. Inaccurate trials and trials with log RTs more than 2.5 standard deviations above the global mean by rate type were also removed from the analyses (2.85%). X-coordinates along the horizontal axis were standardised by inverting the horizontal axis for predictable objects on the left, such that a zero x-coordinate was at the centre, positive x-coordinates were towards the predictable object and negative x-coordinates were towards the unrelated object.
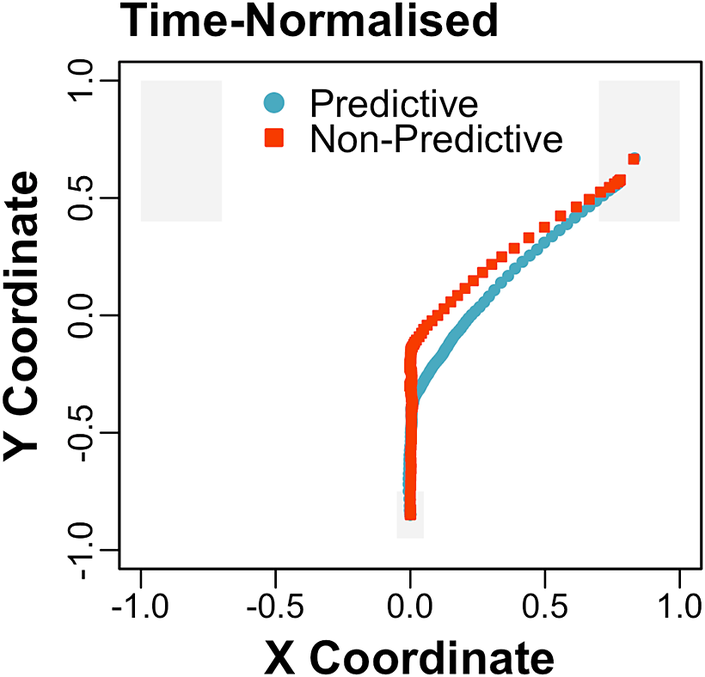
Time-normalised mean trajectories across the visual array are depicted by sentence type in Figure 2, aggregated across rate type and group (e.g., a simplified figure is presented because time-normalisation obscures the time course). Trajectories were generated for this depiction by dividing trials into 101 time slices and aggregating the time slices across trials (e.g., see Spivey, Grosjean, & Knoblich, Reference Spivey, Grosjean and Knoblich2005). In addition, x-coordinates across time are depicted by sentence type at normal and fast rates in the L1 and L2 groups in Figure 3. The plotted window spans 3 seconds before predictable word (e.g., “bike”) onset to 1 second afterwards at the normal rate, and 1 second before predictable word onset to 0.33 seconds afterwards at the fast rate. Thirteen additional trials in which a response was made before the plotted window were removed from these depictions (<1%). The plotted window contains equivalent linguistic content across rate types (e.g., approximately reflecting “which is shown on this page is the bike”).
Time-normalised mean trajectories across the visual array to predictable objects (e.g., bike) for predictive (e.g., “ride…”) and non-predictive (e.g., “spot…”) sentences, aggregated across speech rates and groups.

Figure 2. Long description
The scatter plot is titled Time-Normalised. The X Coordinate axis ranges from -1.0 to 1.0, and the Y Coordinate axis ranges from -1.0 to 1.0. Three light gray rectangular regions are positioned at the top-left, top-right, and bottom-center.
Two data series are plotted:
* Predictive: Represented by blue circles.
* Non-Predictive: Represented by orange squares.
Both trajectories begin at the bottom-center anchor (X = 0, Y = -0.8). They initially move vertically upward along the Y-axis. At approximately Y = -0.2, the trajectories diverge. The Non-Predictive orange squares curve more sharply toward the left before arcing back toward the right. The Predictive blue circles follow a more direct, linear path toward the top-right. Both series converge at the top-right gray region near X = 0.8, Y = 0.7.
Mean (shaded bands show 95% CIs) x-coordinates across time (i.e., through mean predictable word [e.g., “bike”] offset) for predictive (e.g., “ride…”) and non-predictive (e.g., “spot…”) sentences at normal (A, C) and fast (B, D) speech rates in the L1 (A, B) and L2 (C, D) groups.
Note. Mean verb (e.g., “ride”) onset at the normal speech rate was 3.62 seconds before predictable word onset. The black points and error bars show the divergence point means and 95% CIs.

Figure 3. Long description
A four-panel line graph showing X Coordinate on the y-axis (ranging from negative 0.2 to 1.0) and Time in Seconds on the x-axis. Each panel includes two data series: Predictive (blue circles with dashed line and shaded 95 percent C I) and Non-Predictive (red squares with dashed line and shaded 95 percent C I). Vertical dotted lines mark the Predictable Word onset at time 0.
* Panel A (L 1 Normal): Time ranges from negative 3 to 1. The Predictive line rises steadily from time negative 2.5, reaching 0.6. The Non-Predictive line remains near 0 until time 0.5, where it begins to rise. A black divergence point with error bars is located near time negative 2.6.
* Panel B (L 1 Fast): Time ranges from negative 1.0 to 0.2. Both lines remain near 0 until time negative 0.5. The Predictive line then rises to 0.3, while the Non-Predictive line stays flat. Divergence point is at time negative 0.3.
* Panel C (L 2 Normal): Similar trend to Panel A. The Predictive line rises to 0.5, while the Non-Predictive line stays near 0 until time 0.5. Divergence point is at time negative 2.4.
* Panel D (L 2 Fast): Similar trend to Panel B. The Predictive line rises slightly to 0.2 after time negative 0.4, while the Non-Predictive line remains flat. Divergence point is at time negative 0.1.
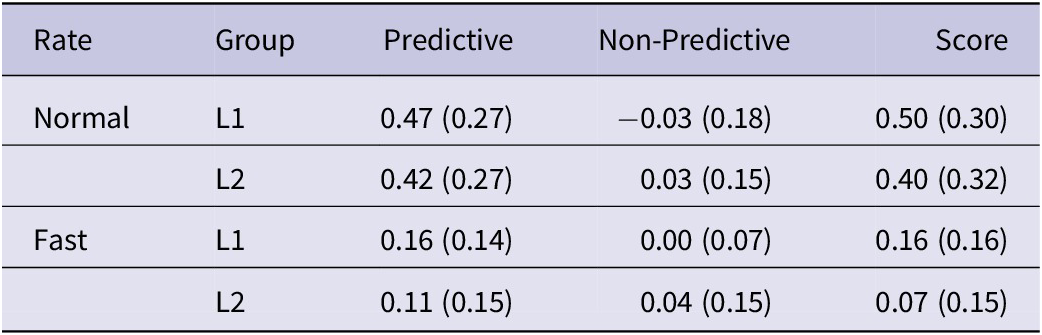
The first two analyses focused on (i.e., predictive) x-coordinates from 1 second before up to predictable word onset at the normal rate and from 0.33 seconds before up to predictable word onset at the fast rate. The analysis window captures predictive behaviours before the predictable word while including equivalent linguistic content across normal and fast rates. These analyses compared predictive and non-predictive sentences, such that differences (i.e., in x-coordinates within the analysis window) between sentence types provided an index of predictive sentence processing (e.g., significantly greater x-coordinates within the analysis window with predictive as compared to non-predictive sentences, which reflected mouse cursor movements towards the predictable object before the predictable word, provided a measure of prediction). One hundred thirty-eight additional trials in which a response was made before the analysis window were removed from the analysis of predictive x-coordinates (5.25%). Removing these trials may underestimate prediction (i.e., by removing trials in which participants respond fastest), but these reflect a minority of trials. In total, 2,415 trials (i.e., 1,092 trials from the L1 group and 1,323 trials from the L2 group) were included in the analysis of predictive x-coordinates. Trial-level mean predictive x-coordinates were computed by averaging across the time window, which yielded a single predictive x-coordinate (e.g., vs. multiple time points) per trial. Thus, time was not included as a factor in these analyses, in which complexity was introduced by the various factors of sentence type, rate type and group, as well as their interactions. Means and standard deviations are reported by sentence type, rate type and group in Table 1.
Mean (SD) predictive x-coordinates for predictive and non-predictive sentences and prediction scores (i.e., differences between these sentences) by speech rate (normal and fast) and group (L1 and L2)

Table 1. Long description
The table is organized into five columns: Rate, Group, Predictive, Non-Predictive, and Score. Values are presented as Mean with Standard Deviation in parentheses.
* Normal Speech Rate:
- L 1 Group: Predictive 0.47 (0.27), Non-Predictive minus 0.03 (0.18), Score 0.50 (0.30).
- L 2 Group: Predictive 0.42 (0.27), Non-Predictive 0.03 (0.15), Score 0.40 (0.32).
* Fast Speech Rate:
- L 1 Group: Predictive 0.16 (0.14), Non-Predictive 0.00 (0.07), Score 0.16 (0.16).
- L 2 Group: Predictive 0.11 (0.15), Non-Predictive 0.04 (0.15), Score 0.07 (0.15).
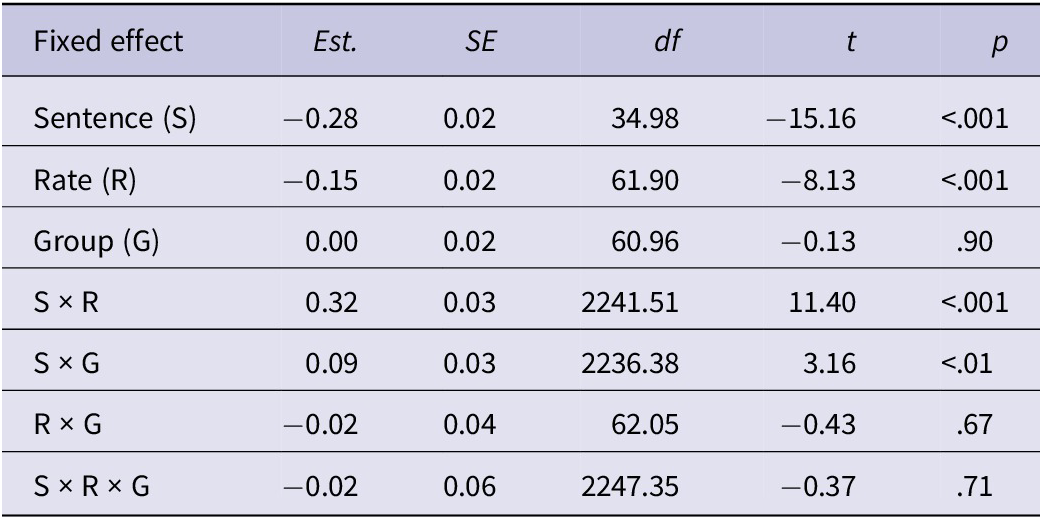
First, interactions among sentence type, rate type and group were assessed by submitting predictive x-coordinates to a mixed effects model with deviation-coded fixed effects of sentence type (predictive = −0.50, non-predictive = 0.50), rate type (normal = −0.50, fast = 0.50) and group (L1 = −0.50, L2 = 0.50), as well as their interactions. Models were run in R using lme4 (Bates, Mächler, Bolker, & Walker, Reference Bates, Mächler, Bolker and Walker2015) and lmerTest (Kuznetsova, Brockhoff, & Christensen, Reference Kuznetsova, Brockhoff and Christensen2017). In addition, models included maximal random effects structures (e.g., intercepts and slopes by participants and items), which were simplified by removing random slopes when there were issues with fit (e.g., models failed to converge; random effects are reported in full on OSF). The model estimates, SEs, t-values and p-values are reported in Table 2. The analysis revealed significant effects of sentence type and rate type and significant interactions between sentence type and both rate type and group. Thus, mouse cursor movements were not “attracted” (e.g., Spivey et al., Reference Spivey, Grosjean and Knoblich2005) to the predictable object to the same degree between predictive and non-predictive sentences across all rate types and groups. Rather, attraction was more pronounced at a normal compared to fast speech rate, as well as in L1 compared to L2.
Mixed effects model analysis of predictive x-coordinates, with fixed effects of sentence type, rate type and group

Table 2. Long description
The table consists of six columns: Fixed effect, Est. (Estimate), S E (Standard Error), d f (degrees of freedom), t (t-statistic), and p (p-value). There are seven rows of data:
* Sentence (S): Est. -0.28, S E 0.02, d f 34.98, t -15.16, p < .001.
* Rate (R): Est. -0.15, S E 0.02, d f 61.90, t -8.13, p < .001.
* Group (G): Est. 0.00, S E 0.02, d f 60.96, t -0.13, p .90.
* S times R: Est. 0.32, S E 0.03, d f 2241.51, t 11.40, p < .001.
* S times G: Est. 0.09, S E 0.03, d f 2236.38, t 3.16, p < .01.
* R times G: Est. -0.02, S E 0.04, d f 62.05, t -0.43, p .67.
* S times R times G: Est. -0.02, S E 0.06, d f 2247.35, t -0.37, p .71.
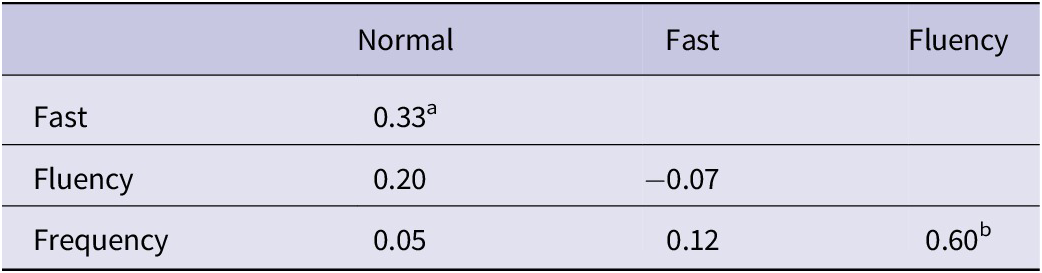
Second, group and individual differences were assessed by computing (i.e., simplified) participant-level prediction scores, which aggregated across trials and subtracted (i.e., mean) predictive x-coordinates for non-predictive sentences from predictive sentences at normal and fast rates separately. This analysis simplified detection of prediction (e.g., removing sentence type as a fixed effect) such that a significant effect of group reflected a difference in prediction between the L1 and L2 groups (e.g., rather than involving an interaction with sentence type), and a significant effect of rate reflected a difference in prediction between normal and fast rates. Means and standard deviations are reported by rate type and group in Table 1. Prediction scores were submitted to a mixed effects model with fixed effects of rate type and group, as well as their interaction. The analysis revealed significant effects of rate type, Est. = −0.33, SE = 0.04, t(71.00) = −9.11, p < .001, such that prediction scores were greater at the normal than fast rate, and group, Est. = −0.09, SE = 0.05, t(71.00) = −2.02, p < .05, such that prediction scores were greater in the L1 group than the L2 group, and a non-significant interaction of rate type and group, Est. = 0.02, SE = 0.07, t(71.00) = 0.22, p = .83. Finally, Spearman’s correlations are reported for the prediction scores and English fluency and frequency ratings in Table 3. One additional participant who did not respond to all frequency questions was removed from the correlational analysis. L2 participants’ predictive mouse cursor movements did not correlate with either their English fluency or frequency of using English. However, their predictive mouse cursor movements were correlated at normal and fast rates, which confirms the reliability of these indices of prediction.
Spearman’s correlations among prediction scores at normal and fast speech rates and English fluency and frequency ratings in the L2 group

Table 3. Long description
The table consists of four columns and three data rows. The columns are labeled Normal, Fast, and Fluency. The rows are labeled Fast, Fluency, and Frequency.
* Row 1, Fast: Correlates with Normal at 0.33 with a p-value less than .05.
* Row 2, Fluency: Correlates with Normal at 0.20 and with Fast at minus 0.07.
* Row 3, Frequency: Correlates with Normal at 0.05, with Fast at 0.12, and with Fluency at 0.60 with a p-value less than .001.
A footer note indicates that superscript a denotes p less than .05 and superscript b denotes p less than .001.
Note. ap < .05; bp < .001
The final analysis used divergence point analysis (e.g., Stone, Lago, & Schad, Reference Stone, Lago and Schad2021) to assess the time course of participants’ mouse cursor movements. This bootstrapping approach, which has been applied to eye movements in the visual world paradigm, was adapted for mouse cursor movements. This analysis assessed the (i.e., time) point of divergence between participants’ horizontal mouse cursor movements (i.e., x-coordinates) to predictable objects with predictive compared to non-predictive sentences (e.g., reflecting the divergence point of the predictive and non-predictive x-coordinate curves in Figures 3A–D). The analysis window began 3 seconds before the predictable word onset at the normal rate and 1 second before the predictable word onset at the fast rate and extended to 1 second after the predictable word onset at both rates. Thirteen additional trials in which a response was made before the analysis window were removed from the divergence point analysis (<1%). In total, 2,540 trials (i.e., 1,160 trials from the L1 group and 1,380 trials from the L2 group) were included in the divergence point analysis. Trial-level x-coordinates were assessed at 50 millisecond intervals within the analysis window. Adapting Stone et al. (Reference Stone, Lago and Schad2021), paired-sample by-participants t-tests (i.e., aggregating over items) compared x-coordinates with predictive versus non-predictive sentences at each time point for each rate type and group separately. A significant positive t-value reflected greater attraction to the predictable object with predictive than non-predictive sentences. The divergence point was the first time point in a sequence of four or more consecutive time points with a significant positive t-value (i.e., mirroring the 200 ms sequence used by Stone et al., Reference Stone, Lago and Schad2021). This analysis used a non-parametric bootstrap to resample the dataset 2,000 times, stratified by participant, time point and sentence and rate types (i.e., which were manipulated within-participants), which generated a divergence point at each resample. Predictable word onset was at time point zero (e.g., see Figure 3).
Analysis of the L1 group revealed a mean divergence point between predictive and non-predictive sentences of −2.66 seconds (95% CI = [−2.75, −2.55]) at the normal rate and −0.35 seconds (95% CI = [−0.50, −0.20]) at the fast rate (e.g., see Figure 3). Analysis of the L2 group revealed a mean divergence point between predictive and non-predictive sentences of −2.38 seconds (95% CI = [−2.50, −2.30]) at the normal rate and −0.07 seconds (95% CI = [−0.20, 0.10]) at the fast rate. In addition, analysis of the differences in divergence points between the L1 and L2 groups revealed a difference (i.e., delay for the latter) of −0.33 seconds (95% CI = [−0.45, −0.20]) at the normal rate and −0.33 seconds (95% CI = [−0.55, −0.15]) at the fast rate. Thus, mouse cursor movements diverged between predictive and non-predictive sentences before (e.g., bottom-up processing of) predictable words: all mean divergence points were negative, and although the confidence interval of the L2 group at a fast rate included zero, this confidence interval preceded the expected lag between speech and behaviour (e.g., eye movements are assumed to lag speech by approximately 200 milliseconds, which is likely even faster than mouse cursor movements). In addition, these divergence points were earlier at a normal compared to fast speech rate, as well as in L1 compared to L2.
4. Discussion
The aim of this research was to test whether both native and non-native comprehenders predict (i.e., what will come next) when hearing rapid speech. These results provide evidence of prediction in both native and non-native comprehenders at speech rates averaging ~9 syllables per second (e.g., see Figure 3 and Table 1), which is sufficiently rapid to hinder comprehension (e.g., Kuperman et al., Reference Kuperman, Kyröläinen, Porretta, Brysbaert and Yang2021). Participants hearing predictive sentences (e.g., “ride…”) made mouse cursor movements to predictable objects (e.g., bike) before hearing predictable words (e.g., “bike”). In addition, prediction was diminished at a fast compared to normal speech rate and in L2 compared to L1. However, speech rate and group did not interact significantly (e.g., see the analysis of prediction scores) such that increases in speech rate affected performance in L1 and L2 similarly. These results suggest that predictive sentence processing differs quantitatively rather than qualitatively in L2 such that prediction supports the comprehension of rapid speech by speeding both native and non-native processing.
This research closely complements the literature. These results suggest that both L1 and L2 comprehenders use semantics to predict what will come next, consistent with findings from Dijkgraaf et al. (Reference Dijkgraaf, Hartsuiker and Duyck2017) and Chun and Kaan (Reference Chun and Kaan2019). These results also suggest that prediction is quantitatively different (e.g., diminished) in L2 compared to L1, consistent with findings highlighted in Schlenter (Reference Schlenter2023). In addition, these results suggest that mouse cursor movements are sensitive to (e.g., L1) comprehenders’ predictions, consistent with findings from Kukona (Reference Kukona2023). However, this research also advances the literature by revealing that mouse cursor tracking is sensitive to L2 comprehenders’ predictions. Thus, complementing methodologies like eye tracking and ERP, which dominate the literature, mouse cursor tracking provides a powerful tool for comparing prediction in L1 and L2.
This research provides novel insight into predictive sentence processing at speed. Fernandez et al. (Reference Fernandez, Engelhardt, Patarroyo and Allen2020) report striking limits on predictive behaviours in L2 such that “L2 speakers only made anticipatory eye movements at 3.5 syllables per second” (p.2348). Thus, it was hypothesised that prediction in L2 may be too slow to support the comprehension of rapid speech. In contrast, L2 participants in this research predicted even when hearing sentences at an average speech rate of ∼9 syllables per second, which is at the fast end of the continuum. However, Fernandez et al. (Reference Fernandez, Engelhardt, Patarroyo and Allen2020) addressed a different linguistic phenomenon (e.g., filler-gap dependencies), which may explain their differing findings. Rather, these results complement more recent findings from Fernandez et al. (Reference Fernandez, Hadley, Gamboa, Allison and Allen2025a, Reference Fernandez, Hadley, Koç, Gamboa and Allen2025b), which likewise centre on (e.g., verb-related) semantic prediction and provide evidence of prediction alongside speech rate-related differences (e.g., at up to and 5.65 and 4.6 syllables per second, respectively) between L1 and L2. Thus, top-down predictions may support fast comprehension in L1 and L2 alike by minimising the time needed for bottom-up processing (e.g., see Kuperberg & Jaeger, Reference Kuperberg and Jaeger2016), which is essential when hearing rapid speech.
However, this research suggests that predictive sentence processing is not without limits. Rather, performance was diminished at a fast compared to normal speech rate, which is consistent with findings from Huettig and Guerra (Reference Huettig and Guerra2019). Moreover, Figure 3D suggests that if speech rates were increased any further, then L2 participants may not have made predictive mouse cursor movements. However, ~9 syllables per second is unlikely to reflect a precise limit on prediction in L2. Rather, we conjecture that there is a trade-off between speech rate and a range of situational factors. Among these factors, the sentences in this research included filler words (i.e., “which is shown on this page…”), which created an extended temporal buffer between the predictive information (e.g., “ride…”) and predictable word (e.g., “bike”) and provided time for processes to reach their resolution (i.e., even when hearing rapid speech). In addition, the visual arrays in this research included only two objects, which is typical of mouse cursor tracking studies (e.g., Spivey et al., Reference Spivey, Grosjean and Knoblich2005) but maximises simplicity. As well, the predictive information in this research was semantic, which may differ from other forms of prediction (e.g., see Angulo-Chavira, Castellón-Flores, Kukona, & Arias-Trejo, Reference Angulo-Chavira, Castellón-Flores, Kukona and Arias-Trejo2026). These factors may have enabled participants to achieve predictive behaviours at an especially rapid speech rate in this research. In contrast, without this extended temporal buffer, and/or with more complex visual scenes, and/or for non-semantic prediction, participants may only have made predictive mouse cursor movements at a speech rate below ~9 syllables per second. Relatedly, the studies by Fernandez et al. (Reference Fernandez, Engelhardt, Patarroyo and Allen2020, Reference Fernandez, Hadley, Gamboa, Allison and Allen2025a, Reference Fernandez, Hadley, Koç, Gamboa and Allen2025b; also see Huettig & Guerra, Reference Huettig and Guerra2019) did not include an extended temporal buffer, and their visual arrays included four objects, which may explain their participants’ diminished performance (e.g., especially in L2) at speech rates below ~9 syllables per second. Likewise, the real world is not always configured to enable comprehenders to achieve predictive behaviours (e.g., before what comes next does come), but we conjecture that prediction is an essential component of language comprehension that supports processing to the extent possible. Nevertheless, a systematic investigation of situational factors in prediction remains an important direction for future research.
The relationship between prediction and working memory is attracting growing interest. For example, participants hearing predictive sentences like “The lady will fold the…,” while viewing visual arrays with predictable objects like a scarf and other unrelated objects, fixated the former before hearing “scarf” whether under a memory load (i.e., memorising a set of words) or not (e.g., vs. “find”; Ito et al., Reference Ito, Corley and Pickering2018). In addition, performance was diminished under a memory load, but it was similar in L1 and L2 (e.g., also see Allison, Huettig, Fernandez, & Lachmann, Reference Allison, Huettig, Fernandez and Lachmann2025). Based on a resource explanation, prediction may be diminished when fewer cognitive resources are available. For example, prediction may be diminished under a memory load because the latter consumes cognitive resources that cannot be allocated to the former. Relatedly, the processing of rapid speech may consume cognitive resources that cannot be allocated to prediction, which provides an explanation for these results (e.g., diminished prediction). However, this research does not distinguish a resource explanation from an explanation focused on temporal buffering (e.g., when hearing rapid speech, comprehenders simply have less time to achieve predictive behaviours), although it may be possible to do so. Moreover, evidence linking prediction and working memory remains mixed (e.g., also see Favier, Meyer, & Huettig, Reference Favier, Meyer and Huettig2021; Kukona et al., Reference Kukona, Braze, Johns, Mencl, Van Dyke, Magnuson and Tabor2016). Thus, further investigation of working memory and cognitive resources in prediction remains an important direction for future research.
Both Kaan (Reference Kaan2014) and Schlenter (Reference Schlenter2023) draw a distinction between quantitative and qualitative differences in prediction. For example, Kaan (Reference Kaan2014) proposes that L1 and L2 comprehenders “do not differ in the nature of the predictive mechanisms or in the way these mechanisms are employed” (p.260). Rather, differences between them may stem (i.e., quantitatively rather than qualitatively) from factors that also contribute to individual differences in L1, such as language exposure, the quality of linguistic representations and/or the availability of cognitive resources. In this research, both L1 and L2 participants predicted at both speech rates, but L2 participants did so less, which supports Kaan’s (Reference Kaan2014) proposal. Interestingly, rate type did not interact with group, which suggests that L2 participants accommodated an increase in speech rate as well as L1 participants (i.e., putting aside a baseline difference between them). We conjecture that this resilience (i.e., even in L2 participants) may reflect prediction’s close connection to speed (i.e., of both processing and the linguistic signal). In other words, prediction has a resilient capacity to keep pace because its function is to support the comprehension of rapid speech by speeding processing, and this is not (e.g., mechanistically) distinct in L1 versus L2.
However, L2 comprehenders are highly diverse, which is not well captured by this research and reflects an important limitation. First, while L2 participants’ language backgrounds were assessed, a standardised measure of their language skills was not included in this research. As a confirmation of L2 participants’ language skills, their accuracy in the mouse cursor tracking task approached ceiling (97.64%). In addition, L2 participants’ English fluency and frequency of using English were strongly correlated (r = 0.60), but these subjective self-reported measures did not correlate with their predictive mouse cursor movements. This (i.e., individual differences) result is consistent with Ito et al. (Reference Ito, Corley and Pickering2018) and Chun and Kaan (Reference Chun and Kaan2019), who likewise found that prediction did not correlate with related (e.g., proficiency) measures. Second, to the extent that participants’ backgrounds were assessed, the sample in this research included highly experienced L2 comprehenders. For example, many were enrolled on a university course in their L2, and English fluency ratings approached ceiling (i.e., over 9 out of 10). In contrast, a sample of L2 participants with less experience may only have made predictive mouse cursor movements at a speech rate below ~9 syllables per second. Third, like some related studies (e.g., Ito et al., Reference Ito, Corley and Pickering2018), this research tested L2 comprehenders who differed in their L1, which may also affect (e.g., add complexity to) the results. Thus, a careful investigation of individual differences in prediction remains an important direction for future research.
To conclude, this research provides evidence of non-native comprehenders’ ability to predict when hearing impressively rapid speech. While non-native participants did not make predictive mouse cursor movements to predictable objects to the same degree as native participants, they nevertheless did so even when hearing sentences at an average speech rate of ∼9 syllables per second, which is at the fast end of the continuum. These results provide novel insight into prediction: they suggest that prediction supports the comprehension of rapid speech by speeding both native and non-native processing. Thus, this research suggests that the mechanisms that support native and non-native prediction are shared rather than qualitatively distinct (e.g., see Kaan, Reference Kaan2014; Schlenter, Reference Schlenter2023). In addition, this research reveals that mouse cursor tracking is sensitive to (e.g., differences between) native and non-native predictive sentence processing.
Data availability statement
The data that support the findings of this study are openly available in OSF at https://doi.org/10.17605/OSF.IO/ZWKSX
Acknowledgements
This work was supported by funding from the Institute for Lifecourse Development, University of Greenwich. Shazia Ameen is thanked for contributing to this work.
Competing interests
The authors declare none.



 Open access

