


I. Introduction
In recent years, political polarization in the United States has intensified, increasingly shaping the role of political values in the financial decisions of households, investment professionals, and corporations (e.g., Hong and Kostovetsky (Reference Hong and Kostovetsky2012), Gromet, Kunreuther, and Larrick (Reference Gromet, Kunreuther and Larrick2013), Di Giuli and Kostovetsky (Reference Di Giuli and Kostovetsky2014), McConnell, Margalit, Malhotra, and Levendusky (Reference McConnell, Margalit, Malhotra and Levendusky2018), Painter (Reference Painter2020), Conway and Boxell (Reference Conway and Boxell2024), and Rajgopal, Srivastava, and Zhao (Reference Rajgopal, Srivastava and Zhao2025)).Footnote 1 However, little is known about its impact on bank depositors, including their choice of banks and the resulting implications for bank operations. Political value misalignment between banks and depositors can lead to deposit outflows, thereby constraining bank funding and reducing lending. To address this gap, this article examines depositor responses to political value misalignment with banks, documenting broader consequences for bank funding and lending.
This article examines political values regarding gun policy, one of the most divisive issues in the United States.Footnote 2 I identify banks with ties to the gun industry based on their financing of major firearms manufacturers in the United States. I measure depositor political values using granular measures of local campaign contributions and voting outcomes. Depositors generally lack detailed information on bank asset portfolios (Freixas and Rochet (Reference Freixas and Rochet2008)), making it difficult for them to identify banks’ gun-related positions absent salient information. I, therefore, exploit the Feb. 14, 2018, Parkland school shooting and the subsequent wave of anti-gun financial activism as an exogenous increase in public awareness of banks’ ties to the gun industry. This activism, which pressured financial institutions to end relationships with gun manufacturers, gained unprecedented traction after Parkland, amplified by student-led movements and social media. In contrast, earlier episodes of gun-related activism focused primarily on legislative changes or public awareness campaigns against gun violence rather than targeted pressure on financial intermediaries.
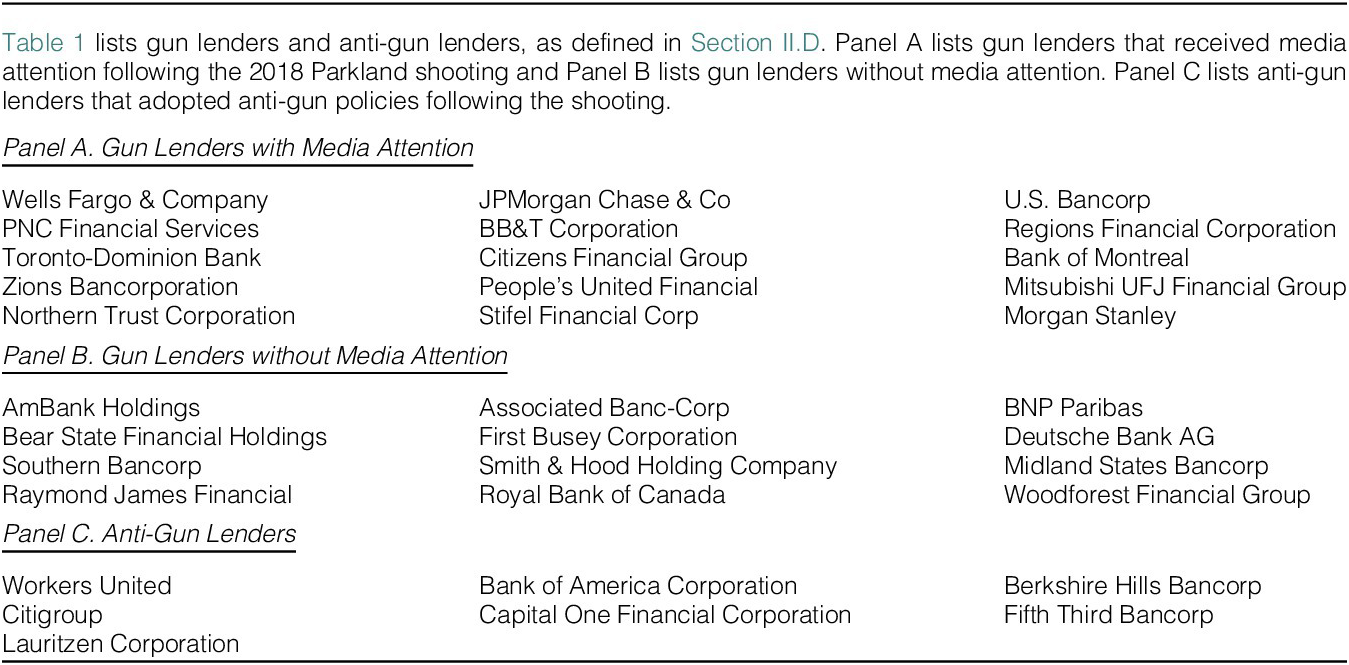
Following the Parkland shooting, activists pressured financial institutions to reduce gun violence by severing ties with the gun industry. On Feb. 26, 2018, ThinkProgress published a list of banks financing major firearms manufacturers.Footnote 3 In early 2019, Guns Down America released a widely referenced report card, “Is Your Bank Loaded?,” grading the largest U.S. banks on their relationships with the gun industry.Footnote 4 Several banks responded by adopting restrictions on business with the gun industry; for example, Bank of America Corporation and Citigroup implemented anti-gun policies, while others, such as Wells Fargo & Company, maintained their existing practices.Footnote 5 These developments also highlighted partisan differences: during an April 2019 congressional hearing, Democratic members praised banks that adopted anti-gun policies, whereas Republican Representative Sean Duffy criticized Bank of America Corporation CEO Brian Moynihan, arguing that many customers would oppose restrictions on lending to gun manufacturers.Footnote 6
Exploiting the Parkland shooting and subsequent activism as a source of exogenous variation in public awareness of banks’ ties to the gun industry, this article employs a difference-in-differences design to examine depositor responses to gun lenders—banks that financed major firearms manufacturers around the time of the Parkland shooting, did not adopt anti-gun policies afterward, and received media attention for these ties. Using a bank–county–year panel of annual deposit growth from 2015 to 2019 with granular county–year fixed effects, the analysis compares banks operating in the same local markets but differing in their gun-related positions. Following the shooting, gun lenders experience 1.8 percentage points lower annual deposit growth, representing a 25% decline relative to their preperiod mean of 7.2%. These outflows translate into approximately $2.13 billion in annual deposit losses per gun lender, more than 20 times their average exposure to the gun industry of $103 million in lending. The results document economically significant deposit outflows from gun lenders.
Consistent with sharp partisan divides on gun policy, the negative depositor response to gun lenders is more pronounced in local markets with greater exposure to Democratic-leaning depositors.Footnote 7 A 1-standard-deviation increase in this exposure is associated with an additional 1.1 percentage point reduction in annual deposit growth at gun lenders following the shooting. The results are robust to controlling for demographic characteristics—such as age, education, and income—that correlate with political values and may independently affect depositor behavior. Further, the outflows are larger for gun lenders with greater donations to Republican politicians. Taken together, the results indicate that political value misalignment between banks and depositors influences depositor behavior.
To further strengthen identification and address potential unobserved heterogeneity, the analysis explores cross-sectional variation along dimensions related to switching frictions, gun control salience, and attitudes toward gun control. Deposit outflows from gun lenders are significantly larger in markets with lower switching frictions, amounting to an additional 1.6 to 2.2 percentage point reduction in annual deposit growth, consistent with frictions attenuating the response to political value misalignment. The effects are also more pronounced in markets where gun control issues exhibit greater salience and stronger supporting attitudes, as proxied by prior exposure to public mass shootings and stronger social connectedness to the Parkland shooting. For example, gun lenders in markets that experienced at least one public mass shooting between 1998 and 2017 see an additional 3.1 percentage point decline in annual deposit growth, while a 1-standard-deviation increase in social connectedness to Parkland is associated with an additional 1.1 percentage point reduction. When these proxies are included jointly with the measure of depositor political values, all variables remain statistically and economically significant. The results indicate that salience and attitudinal factors amplify the role of political values in driving depositor responses to gun lenders.
In a symmetric analysis, the article examines depositor responses to anti-gun lenders—banks that adopted restrictions on business with the gun industry following the Parkland shooting. Anti-gun lenders experience 1.1 percentage points lower annual deposit growth following the shooting, though the estimate is statistically insignificant. The effect is somewhat more negative in markets with greater exposure to Republican-leaning depositors, where a 1-standard-deviation increase in this exposure is associated with an additional 0.3 percentage point reduction; however, this heterogeneity is also insignificant. Anti-gun lenders have depositor bases with an average Democratic exposure of 0.654—comparable to 0.65 for gun lenders. Because anti-gun policies align with the predominant political values of their depositors, deposit outflows from anti-gun lenders remain limited, in contrast to the substantial outflows from gun lenders, whose ties to the gun industry conflict with depositor values.
The analysis next examines the broader implications of deposit outflows from gun lenders for bank funding and lending. Gun lenders respond by reducing deposit spreads, particularly for longer-maturity and larger-amount products in Democratic-leaning markets—consistent with efforts to improve price competitiveness and retain depositors. Gun lenders also reduce branches, with reductions more pronounced in Democratic-leaning markets. These adjustments, combined with significant deposit outflows, tighten funding constraints for gun lenders. While large gun lenders appear resilient in transmitting these constraints to lending despite a 1.6 percentage point decline in annual deposit growth, small lenders reduce CRA loan volumes by 13.5% following a 3.0 percentage point decline in annual deposit growth. The results highlight heterogeneity in the pass-through of depositor-driven funding constraints to real activities, with stronger effects among smaller lenders that rely more heavily on retail deposits.
This article contributes to several strands of the literature. First, it adds to studies of depositor behavior, which primarily emphasize bank fundamentals and depositors’ financial incentives (Saunders and Wilson (Reference Saunders and Wilson1996), Martinez Peria and Schmukler (Reference Martinez, Soledad and Schmukler2001), Maechler and McDill (Reference Maechler and McDill2006), Egan, Hortaçsu, and Matvos (Reference Egan, Hortaçsu and Matvos2017), and Martin, Puri, and Ufier (Reference Martin, Puri and Ufier2018)). Few examine nonfinancial factors, such as corporate social responsibility or depositor political values. This article extends this work by documenting how political value misalignment between banks and depositors affects deposit flows, with implications for bank funding and lending. Second, the article contributes to research on political polarization in financial decision-making. Prior studies show that political values influence the choices of households, investment professionals, and corporations (Hong and Kostovetsky (Reference Hong and Kostovetsky2012), Gromet et al. (Reference Gromet, Kunreuther and Larrick2013), Di Giuli and Kostovetsky (Reference Di Giuli and Kostovetsky2014), McConnell et al. (Reference McConnell, Margalit, Malhotra and Levendusky2018), Painter (Reference Painter2020), Conway and Boxell (Reference Conway and Boxell2024), and Rajgopal et al. (Reference Rajgopal, Srivastava and Zhao2025)). This article extends these findings to retail depositors, providing evidence of deposit outflows driven by conflicts between depositor political values and bank practices. Third, the article relates to the literature on stakeholder responses to corporate social responsibility in banking. Recent work documents depositor discipline for socially controversial activities (Homanen (Reference Homanen2022), Chen, Hung, and Wang (Reference Chen, Hung and Wang2023)), but without emphasizing political value heterogeneity across depositors. This article complements these studies by highlighting how political polarization shapes depositor responses to contentious issues, underscoring the role of political value misalignment in depositor discipline.
The remainder of the article proceeds as follows: Section II describes data and variables. Section III presents summary statistics. Section IV discusses empirical methodologies and results. Section V examines implications. Section VI concludes.
II. Data and Variables
A. Bank–County–Year Deposit Growth Panel
Annual deposit data are obtained from the Federal Deposit Insurance Corporation (FDIC) Summary of Deposits (SOD), which provides branch-level deposit holdings as of June 30 each year for all FDIC-insured institutions, including insured U.S. branches of foreign banks.
To examine depositor responses to political value misalignment with banks, the analysis constructs a bank–county–year deposit growth panel. Branches with deposits exceeding $1 billion as of June 30, 2017, are excluded to focus on retail deposits, as large branches are primarily funded by institutional funds (Homanen (Reference Homanen2022)). Branches involved in acquisitions, entries, or exits during the sample period are also excluded to avoid confounding changes in market structure.Footnote 8 Deposits from eligible branches are aggregated to the bank–county–year level, and the variable, DEPOSIT_GROWTH, is computed as the annual percentage change, yielding a panel spanning 2015–2019.
The panel includes bank and county controls. Bank controls comprise 1-year lagged values of log bank assets and log deposits, the log number of bank branches in the county, and indicators for bank type and the Wells Fargo scandal.Footnote 9 These are derived from SOD data. County controls include 1-year lagged values of log population, log per capita income, population growth, and the unemployment rate, sourced from the U.S. Bureau of Economic Analysis and the Economic Research Service of the U.S. Department of Agriculture. Additional controls, where applicable, are incorporated into the empirical specifications. Variable definitions are provided in the Appendix.
B. Bank–County–Product–Quarter Deposit Spread Panel
Retail deposit interest rate data are obtained from the S&P Global RateWatch database, which provides weekly rates at the branch level for multiple deposit products, covering approximately 80% of FDIC-insured branches as of 2017.
To examine bank responses to deposit outflows, the analysis constructs a bank–county–product–quarter deposit spread panel. The RateWatch data are merged with FDIC SOD using branch identifiers, focusing on the most popular deposit products across all U.S. branches: certificates of deposit (CDs) with $10,000 and $25,000 accounts and maturities of 6, 12, 18, 24, 36, 48, and 60 months, as well as money market deposit accounts (MMDAs) with $10,000 and $25,000 accounts. Quarterly average rates are calculated for each bank–branch–product combination. Following evidence of rate uniformity within counties (e.g., Radecki (Reference Radecki1998), Heitfield (Reference Heitfield1999), Biehl (Reference Biehl2002), Heitfield and Prager (Reference Heitfield and Prager2004), Park and Pennacchi (Reference Park and Pennacchi2008), Avramidis and Pennacchi (Reference Avramidis and Pennacchi2025), Begenau and Stafford (Reference Begenau and Stafford2025), and Granja and Paixao (Reference Granja and Paixao2026)), rates from reporting branches are assigned to nonreporting branches of the same bank in the same county. Bank–county–product deposit-weighted average rates are then derived. Deposit spreads are computed as the difference between these rates and corresponding quarterly averaged U.S. Treasury yields matched to the product maturities, sourced from Federal Reserve Economic Data (FRED). The variable, $ \Delta $
DEPOSIT_SPREAD, is the quarterly change in the spread, yielding a panel spanning 2017–2018.Footnote
10
$ \Delta $
DEPOSIT_SPREAD, is the quarterly change in the spread, yielding a panel spanning 2017–2018.Footnote
10
C. Bank–County–Year CRA Loan Panel
Annual CRA loan origination data are obtained from the Federal Financial Institutions Examination Council (FFIEC) Community Reinvestment Act (CRA) disclosures, which report small business loans with commitment amounts below $1 million originated by institutions with assets exceeding $1 billion, aggregated at the county level.
To examine how deposit outflows affect bank lending, the analysis constructs a bank–county–year CRA loan panel. The CRA data are merged with Call Reports using the regulatory identifier. To mitigate outliers, the panel retains only bank–county pairs where the bank originates more than one loan. The variable, CRA_LOANS, is computed as the total CRA loan amount originated by the bank in the county, yielding a panel spanning 2015–2019.
D. Gun Lenders, Anti-Gun Lenders, and Control Lenders
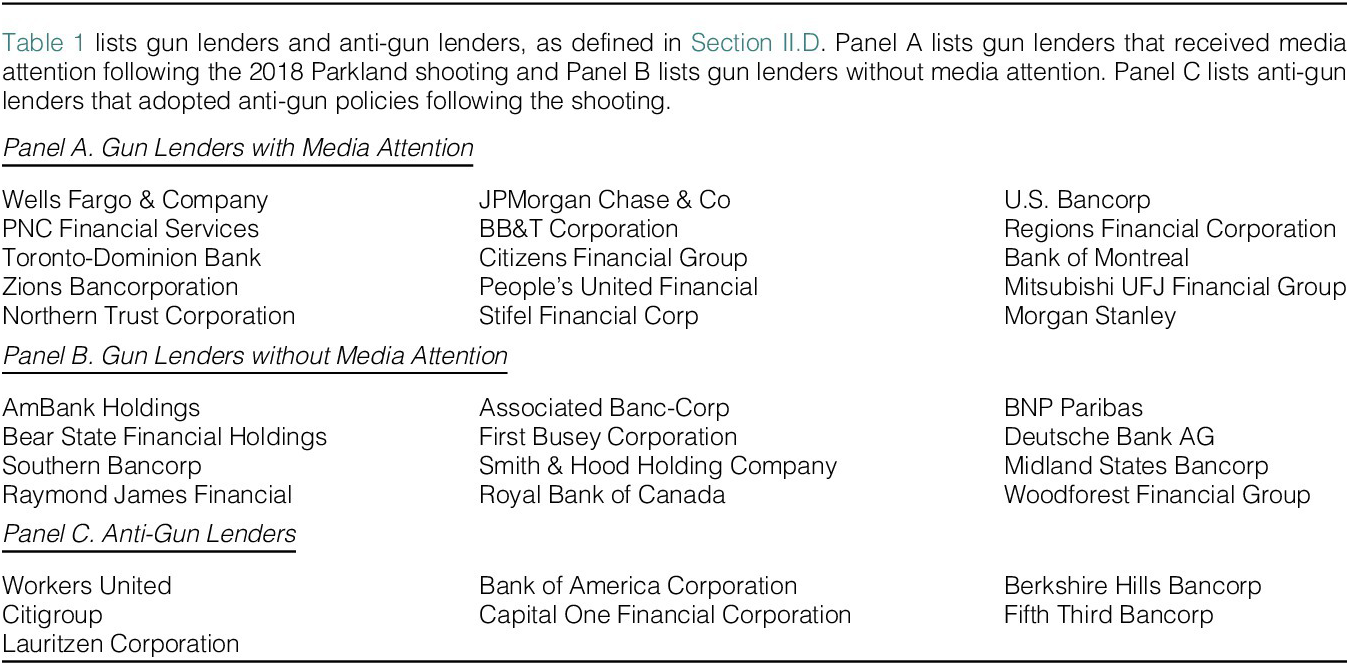
Gun lenders are defined using three criteria: i) banks that financed major firearms manufacturers around the time of the 2018 Parkland shooting,Footnote 11 ii) banks that did not adopt anti-gun policies afterward, and iii) banks that received media attention for these ties. The third criterion addresses information asymmetry, as depositors generally lack access to detailed bank asset portfolios (Freixas and Rochet (Reference Freixas and Rochet2008)).Footnote 12
Using DealScan data on historical loan contracts, the analysis identifies 31 banks that extended $3.2 billion in loans and facilities to six major firearms manufacturers around the time of the shooting. Four adopted anti-gun policies afterward: Bank of America Corporation, Berkshire Hills Bancorp, and Fifth Third Bancorp ceased business with the gun industry, while Capital One Financial Corporation restricted firearms-related transactions. Of the remaining 27, 15 received media attention from outlets such as ThinkProgress and Guns Down America. These 15 gun lenders, which are the focus of the main analysis, are listed in Panel A of Table 1. The 12 without media attention are listed in Panel B. Panel C lists seven banks that adopted anti-gun policies, including the aforementioned four and three additional banks that adopted anti-gun policies without identified firearms manufacturer financing.
Control lenders are banks active in DealScan around the time of the shooting, but without firearms manufacturer financing and anti-gun policies, yielding 351 banks. This selection minimizes confounding differences in observable lending characteristics between gun lenders and control lenders.
E. Political Values of Depositors
Depositor political values are measured using 2015–2016 individual campaign donation data from the Federal Election Commission, focusing on donations to Political Action Committees (PACs) affiliated with the two major U.S. political parties that received at least $20 million in total donations (Meeuwis et al. (Reference Meeuwis, Parker, Schoar and Simester2022)). For each zip code, the number of donors to each party is counted, excluding zip codes with fewer than 10 donors to reduce noise from areas with limited representation. The ratio of Democratic donors to total donors is then calculated for each zip code. The variable, DEMOCRAT_SHARE, is constructed as the deposit-weighted average of these zip-code ratios across bank branches in the county, using branch deposit holdings as of June 30, 2017, as weights.
For robustness, an alternative measure is constructed using county-level vote shares from the 2016 U.S. presidential election. The variable, DEMOCRAT_SHARE $ {}_{\mathrm{ELECTION}} $
, is defined as votes for the Democratic candidate divided by total votes for the two major-party candidates. As shown in Table IA.8 in the Supplementary Material, the main results remain robust to this measure, though statistical and economic significance is attenuated. This reflects the coarser granularity of DEMOCRAT_SHARE
$ {}_{\mathrm{ELECTION}} $
, is defined as votes for the Democratic candidate divided by total votes for the two major-party candidates. As shown in Table IA.8 in the Supplementary Material, the main results remain robust to this measure, though statistical and economic significance is attenuated. This reflects the coarser granularity of DEMOCRAT_SHARE $ {}_{\mathrm{ELECTION}} $
, which masks substantial within-county variation linked to bank branch locations. For example, in Cook County, Illinois—one of the most populous U.S. counties—DEMOCRAT_SHARE
$ {}_{\mathrm{ELECTION}} $
, which masks substantial within-county variation linked to bank branch locations. For example, in Cook County, Illinois—one of the most populous U.S. counties—DEMOCRAT_SHARE $ {}_{\mathrm{ELECTION}} $
is 78.1%, whereas the baseline DEMOCRAT_SHARE ranges from 35.3% to 94.4% across banks. Similarly, in Harris County, Texas, DEMOCRAT_SHARE
$ {}_{\mathrm{ELECTION}} $
is 78.1%, whereas the baseline DEMOCRAT_SHARE ranges from 35.3% to 94.4% across banks. Similarly, in Harris County, Texas, DEMOCRAT_SHARE $ {}_{\mathrm{ELECTION}} $
is 56.5%, but the baseline DEMOCRAT_SHARE varies from 38.3% to 75.9%. These examples highlight the advantages of the baseline DEMOCRAT_SHARE in capturing localized political heterogeneity relevant to depositor behavior.
$ {}_{\mathrm{ELECTION}} $
is 56.5%, but the baseline DEMOCRAT_SHARE varies from 38.3% to 75.9%. These examples highlight the advantages of the baseline DEMOCRAT_SHARE in capturing localized political heterogeneity relevant to depositor behavior.
F. Political Leanings of Gun Lenders
Political leanings of gun lenders are measured using 2015–2016 PAC donation data from the Federal Election Commission. The variable, REPUBLICAN_SHARE, is computed as PAC donations to Republican politicians divided by total donations to politicians from the two major parties. As shown in Table IA.2 in the Supplementary Material, gun lenders contributed an average of $206,210 to Republican politicians and $89,296 to Democratic politicians, yielding an average REPUBLICAN_SHARE of 0.658. These figures reveal a pronounced Republican lean among gun lenders.
G. Cross-Sectional Variables
To further strengthen the identification and address potential unobserved heterogeneity, the analysis constructs several cross-sectional variables capturing variation in depositor demographics, switching frictions, gun control salience, and attitudes toward gun control.
1. Depositor Demographics
Demographic characteristics may correlate with political values while independently influencing depositor behavior. Pew Research Center surveys document substantial partisan divides on gun policy, with age and education also associated with differences in views, though political affiliation remains the dominant factor.Footnote 13 To isolate the role of political values, three county-level variables are constructed using 2017 data. The variable, AGE_UNDER_65, is the proportion of the population under age 65, obtained from the U.S. Census Bureau. The variable, COLLEGE, is the proportion of individuals with a bachelor’s degree or higher, obtained from the U.S. Census Bureau. The variable, INCOME, is per capita income, derived from the U.S. Bureau of Economic Analysis.
2. Switching Frictions
Switching frictions may attenuate depositor responses to political value misalignment. Two complementary measures are constructed using SOD branch locations and deposit holdings as of June 30, 2017. The shortest distance from each gun lender branch to the nearest control lender branch in the same county is calculated. The variable, SWITCHING_FRICTION $ {}_{\mathrm{BANK}\hbox{-} \mathrm{COUNTY}} $
, is the deposit-weighted average of these distances across gun lender branches in the county. The variable, SWITCHING_FRICTION
$ {}_{\mathrm{BANK}\hbox{-} \mathrm{COUNTY}} $
, is the deposit-weighted average of these distances across gun lender branches in the county. The variable, SWITCHING_FRICTION $ {}_{\mathrm{COUNTY}} $
, is the deposit-weighted average of SWITCHING_FRICTION
$ {}_{\mathrm{COUNTY}} $
, is the deposit-weighted average of SWITCHING_FRICTION $ {}_{\mathrm{BANK}\hbox{-} \mathrm{COUNTY}} $
across gun lenders in the county. Market concentration, which is closely related to switching frictions and influences depositor behavior through deposit rate sensitivity (Klemperer (Reference Klemperer1995), Drechsler, Savov, and Schnabl (Reference Drechsler, Savov and Schnabl2017)), is captured by the county-level Herfindahl–Hirschman Index. The variable, HHI, is the sum of squared deposit market shares of all branches operating in the county as of June 30, 2017.
$ {}_{\mathrm{BANK}\hbox{-} \mathrm{COUNTY}} $
across gun lenders in the county. Market concentration, which is closely related to switching frictions and influences depositor behavior through deposit rate sensitivity (Klemperer (Reference Klemperer1995), Drechsler, Savov, and Schnabl (Reference Drechsler, Savov and Schnabl2017)), is captured by the county-level Herfindahl–Hirschman Index. The variable, HHI, is the sum of squared deposit market shares of all branches operating in the county as of June 30, 2017.
3. Gun Control Salience and Attitudes Toward Gun Control
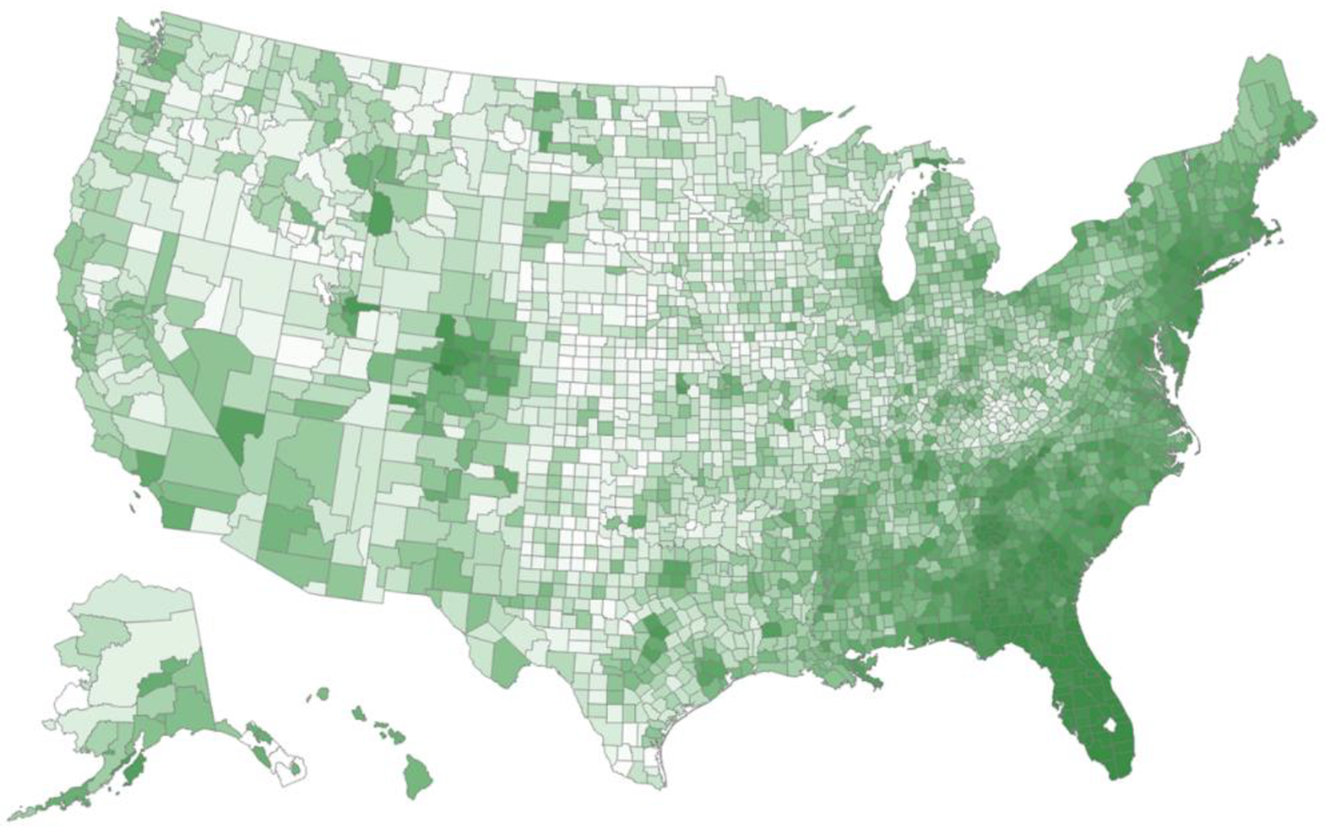
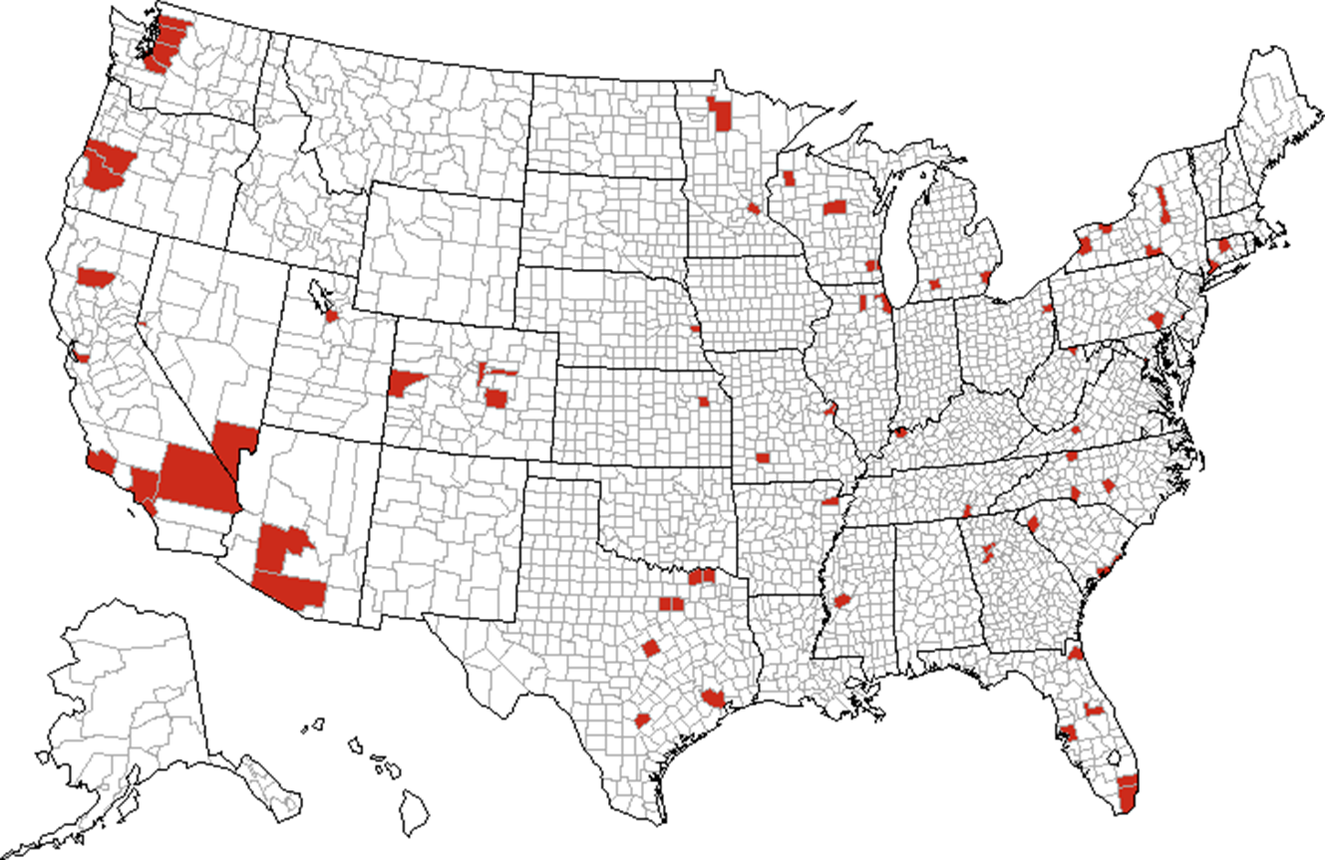
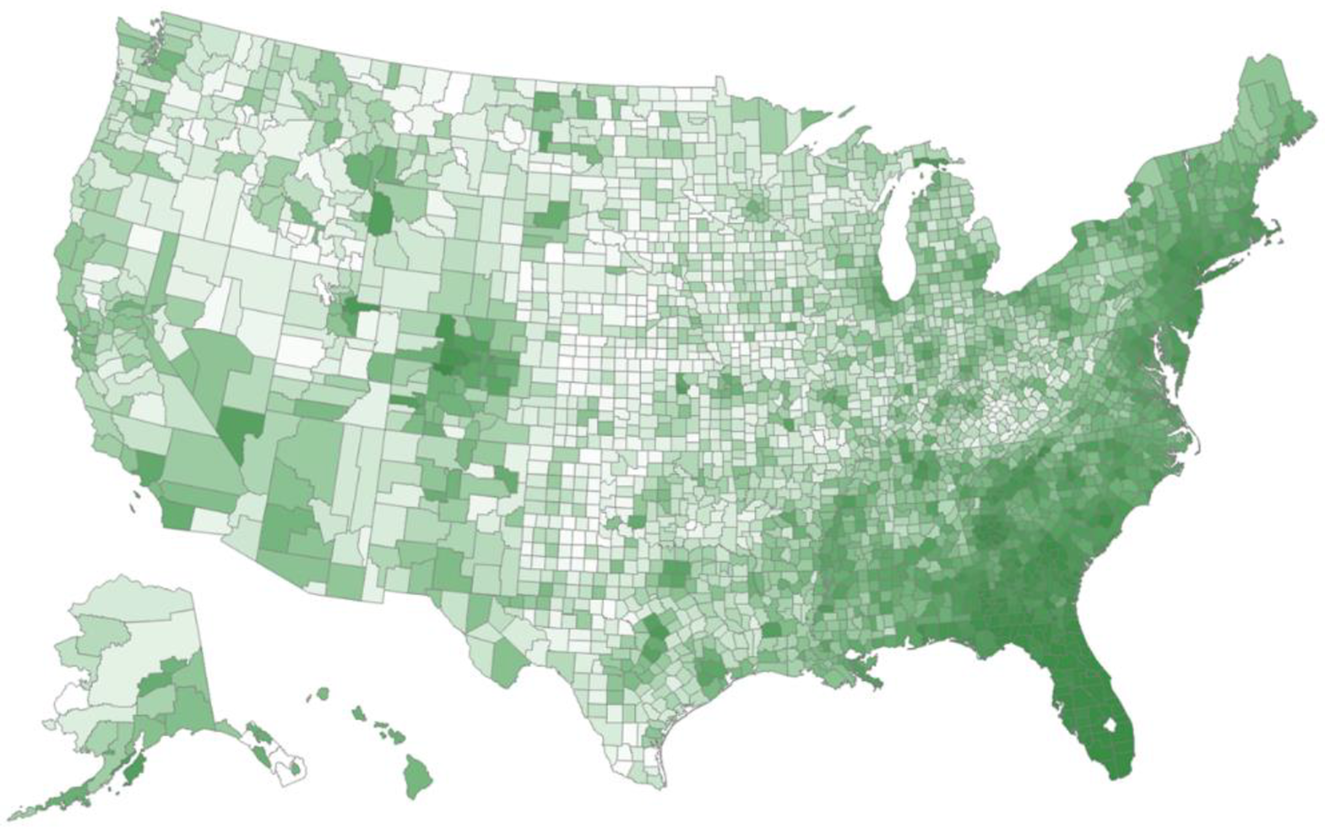
Attitudes toward gun control may be influenced by factors beyond political values and demographics. For example, Luca, Malhotra, and Poliquin (Reference Luca, Malhotra and Poliquin2020) document increased support for gun control following exposure to mass shootings. Moreover, the Parkland shooting sparked widespread social media activism, with the “Never Again MSD” movement rapidly gaining traction and the hashtag, #NeverAgain, going viral. To capture variation in salience and attitudes, two proxies are constructed. The variable, MASS_SHOOTING, is an indicator equal to 1 for counties that experienced at least one public mass shooting between 1998 and 2017, identified using data from USA Today, the Washington Post, Mother Jones, and the Stanford Mass Shootings in America database; 71 counties meet this criterion, as illustrated in Figure 1. The variable, SCI, measures social connectedness to Broward County, Florida, the site of the Parkland shooting, using the Facebook Social Connectedness Index, as illustrated in Figure 2; it is standardized to mean 0 and standard deviation 1. To control for geographic proximity, the variable, PHYSICAL_DISTANCE, measures the distance between county centroids and Broward County.
Figure 1 plots U.S. counties that experienced at least one public mass shooting between 1998 and 2017. Shaded counties are identified using data compiled from USA Today, the Washington Post, Mother Jones, and the Stanford Mass Shootings in America database.

Figure 2 plots U.S. counties shaded by their social connectedness to Broward County, Florida, the site of the Parkland shooting. Social connectedness is measured using the Facebook Social Connectedness Index. Darker shades indicate higher connectedness.
III. Summary Statistics
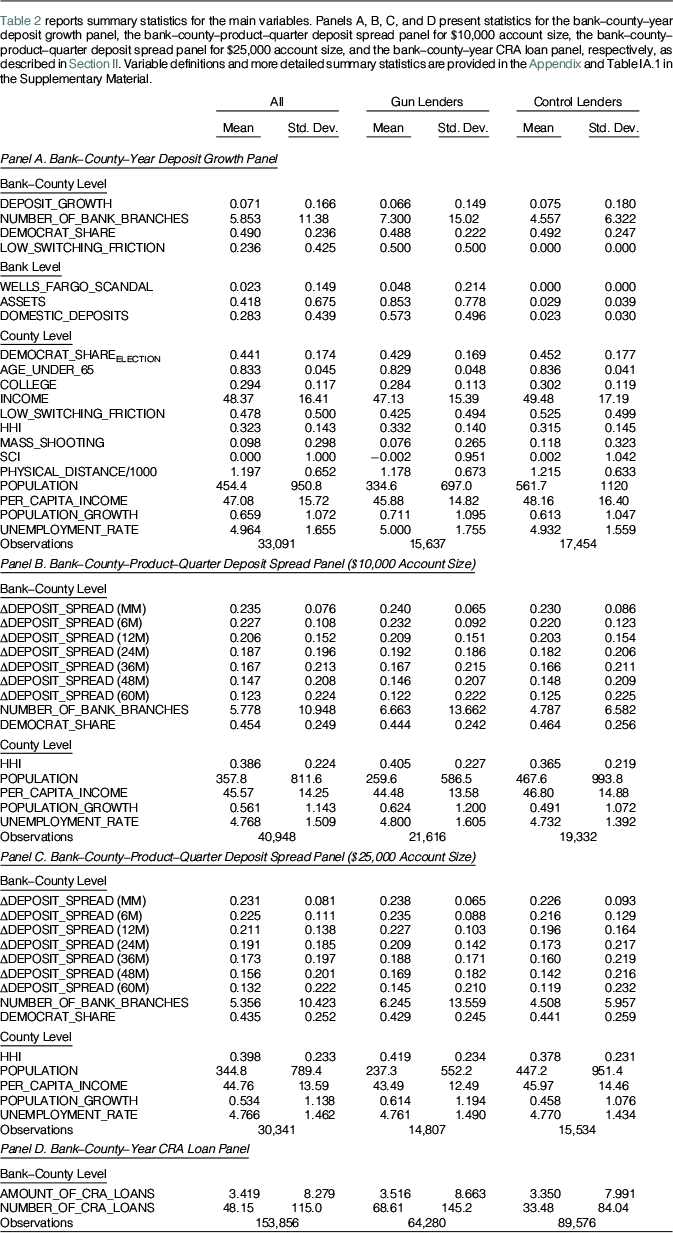
Table 2 reports summary statistics for the main variables. More detailed statistics, including mean, standard deviation, median, minimum, and maximum, are provided in Table IA.1 in the Supplementary Material.
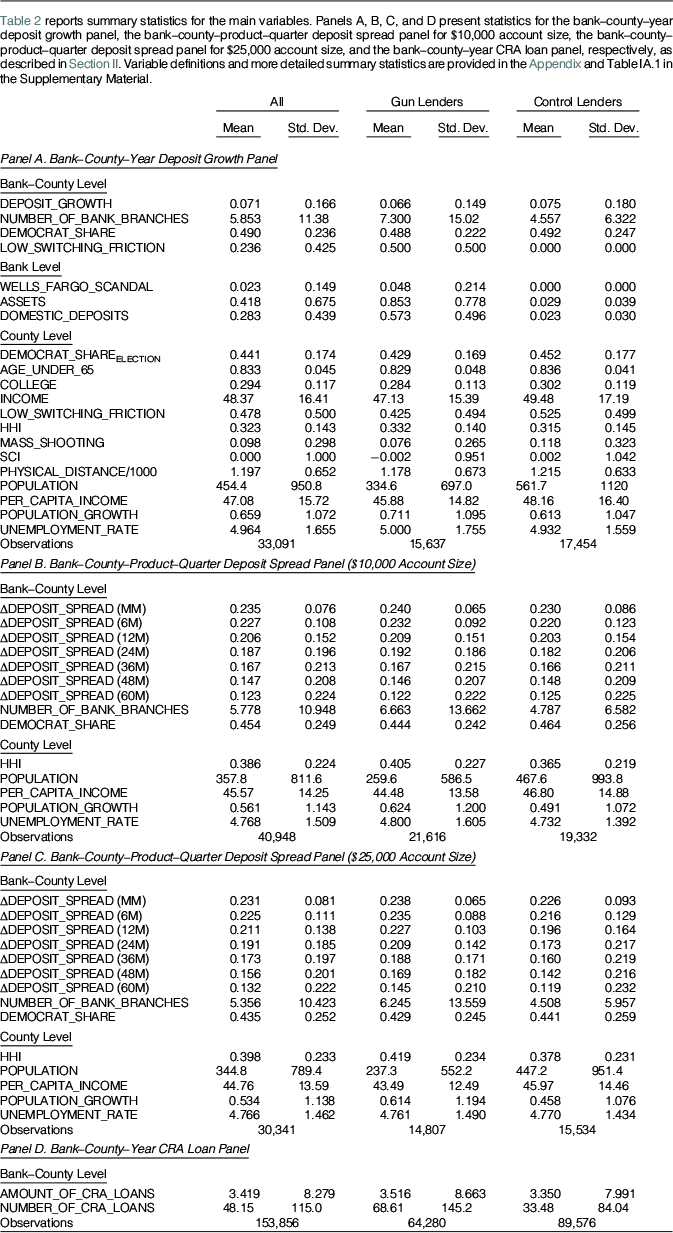
Panel A presents summary statistics for the bank–county–year deposit growth panel described in Section II.A. Gun lenders are larger than control lenders, with average assets of $853 billion and 7.3 branches per county compared to $29 billion and 4.6 branches for control lenders. Equal-weighted Democratic exposure is comparable at approximately 0.49 for both lenders. On a deposit-weighted basis, however, gun lenders exhibit higher exposure at 0.65 than control lenders at 0.54, as shown in Table IA.10 in the Supplementary Material. These differences raise potential endogeneity concerns, as unobserved factors could jointly influence bank characteristics and depositor composition. The analysis addresses these concerns by matching each gun lender to up to five nearest-neighbor control lenders drawn from the pool of DealScan-active lenders around the Parkland shooting, using 2017 bank assets, number of branches, profitability, and deposit-weighted Democratic exposure. Table IA.10 in the Supplementary Material confirms balance on observables in the matched sample. The main results remain robust, as shown in Tables IA.11 and IA.12 in the Supplementary Material.
Panels B and C report summary statistics for the bank–county–product–quarter deposit spread panel described in Section II.B, separately for $10,000 and $25,000 account sizes. Quarterly changes in deposit spreads decline with maturity, averaging approximately 23 basis points for MMDAs and 13 basis points for 60-month CDs. Gun lenders operate in slightly more concentrated markets, with an average HHI of 0.41 compared to 0.37 for control lenders. This measure of market concentration, which may correlate with depositor political values and influence depositor behavior through deposit rate sensitivity, is controlled for in the analysis.
Panel D summarizes the bank–county–year CRA loan panel described in Section II.C. Gun lenders originate more CRA loans per county on average, at 69 versus 33 for control lenders, but total loan amounts are similar at $3.5 million versus $3.4 million per county, suggesting that gun lenders extend smaller individual loans.
IV. Empirical Methodologies and Results
A. Depositor Movements Against Gun Lenders
The analysis exploits the 2018 Parkland shooting and subsequent activism as an exogenous increase in public awareness of banks’ ties to the gun industry. The Parkland shooting is well suited for identification because it was the first high-profile shooting to trigger targeted activism against gun lenders, distinguishing it from prior episodes of gun violence that generated comparable media attention but no similar pressure on financial intermediaries. For example, the 2012 Sandy Hook school shooting—which received widespread media attention—produced no comparable effects on annual deposit growth of gun lenders, as reported in Table IA.5 in the Supplementary Material. These results are consistent with its aftermath being characterized by legislative campaigns and public awareness efforts against gun violence rather than targeted pressure on banks’ relationships with the gun industry.
The baseline difference-in-differences specification, estimated on the bank–county–year deposit growth panel described in Section II.A, is
 $$ \mathrm{DEPOSIT}\_{\mathrm{GROWTH}}_{i,c,t}={\beta}_1\mathrm{GUN}\_{\mathrm{LENDER}}_i\times {\mathrm{POST}}_t+{\beta}_2{\mathbf{X}}_{i,c,t}+{\eta}_{i,c}+{\delta}_{c,t}+{\varepsilon}_{i,c,t} $$
where $ \mathrm{DEPOSIT}\_{\mathrm{GROWTH}}_{i,c,t} $
is the annual percentage change in deposits of bank
$ \mathrm{DEPOSIT}\_{\mathrm{GROWTH}}_{i,c,t} $
is the annual percentage change in deposits of bank $ i $
in county
$ i $
in county $ c $
in year
$ c $
in year $ t $
.
$ t $
. $ \mathrm{GUN}\_{\mathrm{LENDER}}_i $
equals 1 for gun lenders, as defined in Section II.D.
$ \mathrm{GUN}\_{\mathrm{LENDER}}_i $
equals 1 for gun lenders, as defined in Section II.D. $ {\mathrm{POST}}_t $
equals 1 for 2018 and later. The vector
$ {\mathrm{POST}}_t $
equals 1 for 2018 and later. The vector $ {\mathbf{X}}_{i,c,t} $
includes bank and county control variables. Bank controls comprise 1-year lagged values of log bank assets and log deposits, the log number of bank branches in the county, and indicators for bank type and the Wells Fargo scandal. County controls include 1-year lagged values of log population, log per capita income, population growth, and unemployment rate. County controls are omitted when county–year fixed effects are included. Bank–county fixed effects
$ {\mathbf{X}}_{i,c,t} $
includes bank and county control variables. Bank controls comprise 1-year lagged values of log bank assets and log deposits, the log number of bank branches in the county, and indicators for bank type and the Wells Fargo scandal. County controls include 1-year lagged values of log population, log per capita income, population growth, and unemployment rate. County controls are omitted when county–year fixed effects are included. Bank–county fixed effects $ {\eta}_{i,c} $
absorb time-invariant bank–county characteristics. County–year fixed effects
$ {\eta}_{i,c} $
absorb time-invariant bank–county characteristics. County–year fixed effects $ {\delta}_{c,t} $
control for time-varying local economic conditions that influence local deposit demand, thereby mitigating concerns that unobserved changes in local deposit demand drive the results. Standard errors are heteroscedasticity-robust and clustered by bank–state.
$ {\delta}_{c,t} $
control for time-varying local economic conditions that influence local deposit demand, thereby mitigating concerns that unobserved changes in local deposit demand drive the results. Standard errors are heteroscedasticity-robust and clustered by bank–state.
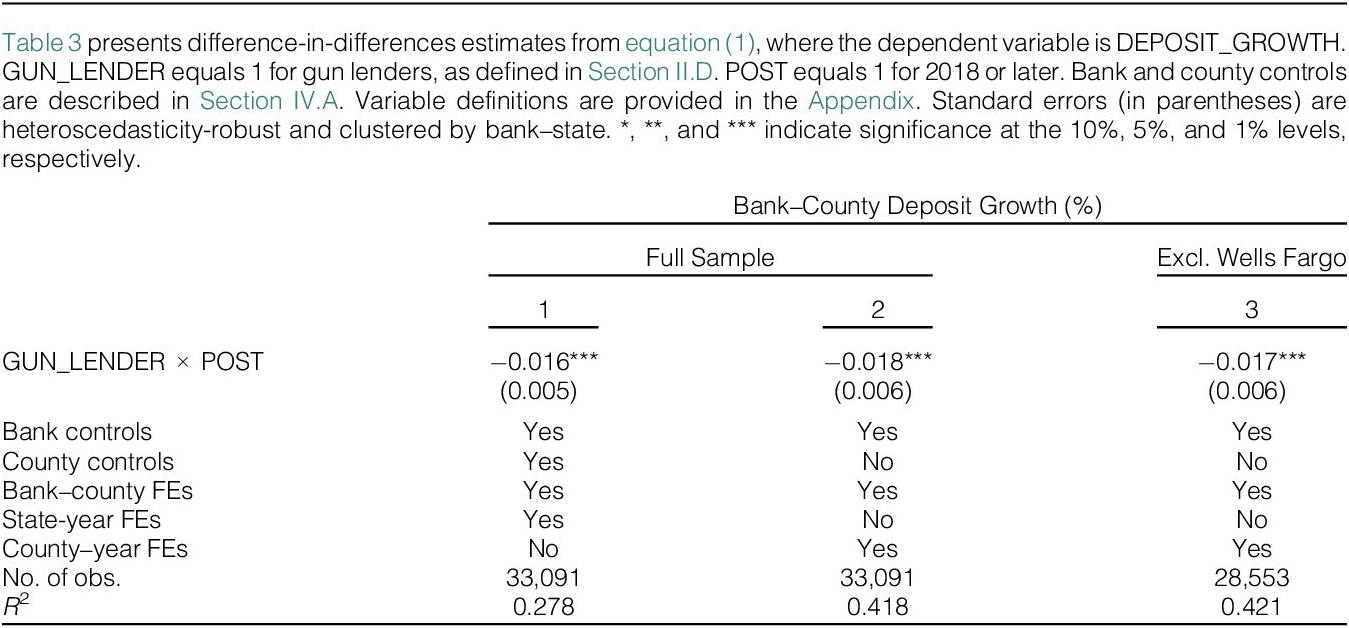
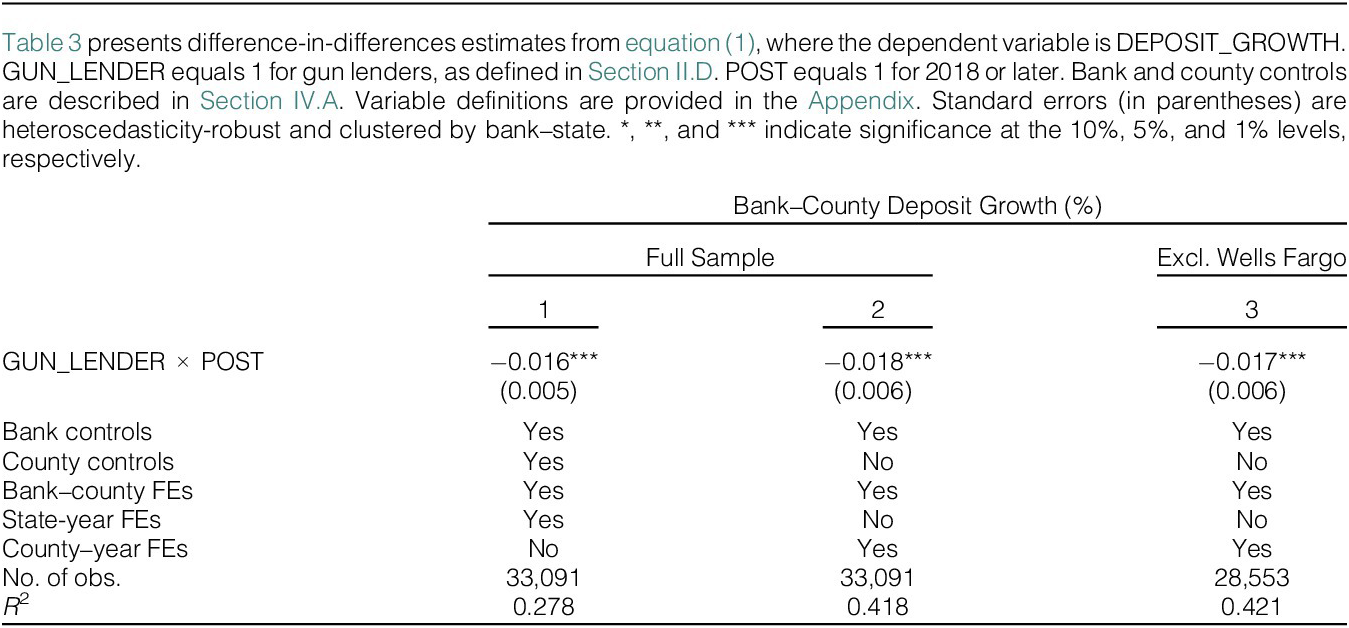
Table 3 reports baseline estimates. Column 1 includes bank–county and state-year fixed effects. Gun lenders experience 1.6 percentage points lower annual deposit growth following the shooting. Column 2 adds county–year fixed effects, yielding a 1.8 percentage point decline.Footnote 14 Relative to the preperiod mean of 7.2% for gun lenders, this represents a 25% reduction. Column 3 excludes Wells Fargo, confirming that the results are not driven by its cross-selling scandal.
The economic magnitude is substantial. The average gun lender holds approximately $431 million in deposits per county. A 1.8 percentage point slowdown implies annual losses of roughly $7.76 million per county. Across an average of 274 counties per gun lender, aggregate annual losses reach $2.13 billion per gun lender—more than 20 times their average exposure to the gun industry of $103 million in lending. Under the conservative lower-bound estimate of 0.9 percentage points, aggregate annual losses amount to approximately $1.07 billion per gun lender—still more than 10 times their average gun industry exposure.
Table IA.3 in the Supplementary Material reports dynamic estimates and confirms parallel pretrends. Deposit growth differences between gun lenders and control lenders are statistically indistinguishable from 2014 to 2017. Following the shooting, growth declines by 1.8 percentage points in 2018 and 1.9 percentage points in 2019 before fading in 2020, consistent with pandemic-related disruptions to deposit markets (Levine, Lin, Tai, and Xie (Reference Levine, Lin, Tai and Xie2021)).
B. Politically Polarized Movements
1. Political Values of Depositors
Consistent with sharp partisan divides on gun policy, deposit outflows from gun lenders are expected to be more pronounced in Democratic-leaning markets.Footnote 15 To test this prediction, the analysis augments the baseline difference-in-differences specification with interactions involving DEMOCRAT_SHARE defined in Section II.E:
 $$ {\displaystyle \begin{array}{l}\mathrm{DEPOSIT}\_{\mathrm{GROWTH}}_{i,c,t}={\beta}_1\mathrm{GUN}\_{\mathrm{LENDER}}_i\times \mathrm{DEMOCRAT}\_{\mathrm{SHARE}}_{i,c}\\ {}\times {\mathrm{POST}}_t+{\beta}_2\mathrm{DEMOCRAT}\_{\mathrm{SHARE}}_{i,c}\times {\mathrm{POST}}_t\\ {}+{\beta}_3{\mathbf{X}}_{i,c,t}+{\eta}_{i,c}+{\delta}_{i,t}+{\varepsilon}_{i,c,t}\end{array}} $$
where $ \mathrm{DEPOSIT}\_{\mathrm{GROWTH}}_{i,c,t} $
is the annual percentage change in deposits of bank
$ \mathrm{DEPOSIT}\_{\mathrm{GROWTH}}_{i,c,t} $
is the annual percentage change in deposits of bank $ i $
in county
$ i $
in county $ c $
in year
$ c $
in year $ t $
.
$ t $
. $ \mathrm{GUN}\_{\mathrm{LENDER}}_i $
equals 1 for gun lenders, as defined in Section II.D.
$ \mathrm{GUN}\_{\mathrm{LENDER}}_i $
equals 1 for gun lenders, as defined in Section II.D. $ {\mathrm{POST}}_t $
equals 1 for 2018 and later.
$ {\mathrm{POST}}_t $
equals 1 for 2018 and later. $ \mathrm{DEMOCRAT}\_{\mathrm{SHARE}}_{i,c} $
is the exposure of bank
$ \mathrm{DEMOCRAT}\_{\mathrm{SHARE}}_{i,c} $
is the exposure of bank $ i $
to Democratic-leaning depositors in county
$ i $
to Democratic-leaning depositors in county $ c $
, as defined in Section II.E. The vector
$ c $
, as defined in Section II.E. The vector $ {\mathbf{X}}_{i,c,t} $
includes a bank control—the log number of bank branches in the county—and county controls, which consists of interactions of HHI with the treatment indicators and 1-year lagged values of log population, log per capita income, population growth, and the unemployment rate. Bank–county fixed effects
$ {\mathbf{X}}_{i,c,t} $
includes a bank control—the log number of bank branches in the county—and county controls, which consists of interactions of HHI with the treatment indicators and 1-year lagged values of log population, log per capita income, population growth, and the unemployment rate. Bank–county fixed effects $ {\eta}_{i,c} $
absorb time-invariant bank–county characteristics. Bank–year fixed effects
$ {\eta}_{i,c} $
absorb time-invariant bank–county characteristics. Bank–year fixed effects $ {\delta}_{i,t} $
control for time-varying bank characteristics. Standard errors are heteroscedasticity-robust and clustered by bank–state.
$ {\delta}_{i,t} $
control for time-varying bank characteristics. Standard errors are heteroscedasticity-robust and clustered by bank–state.
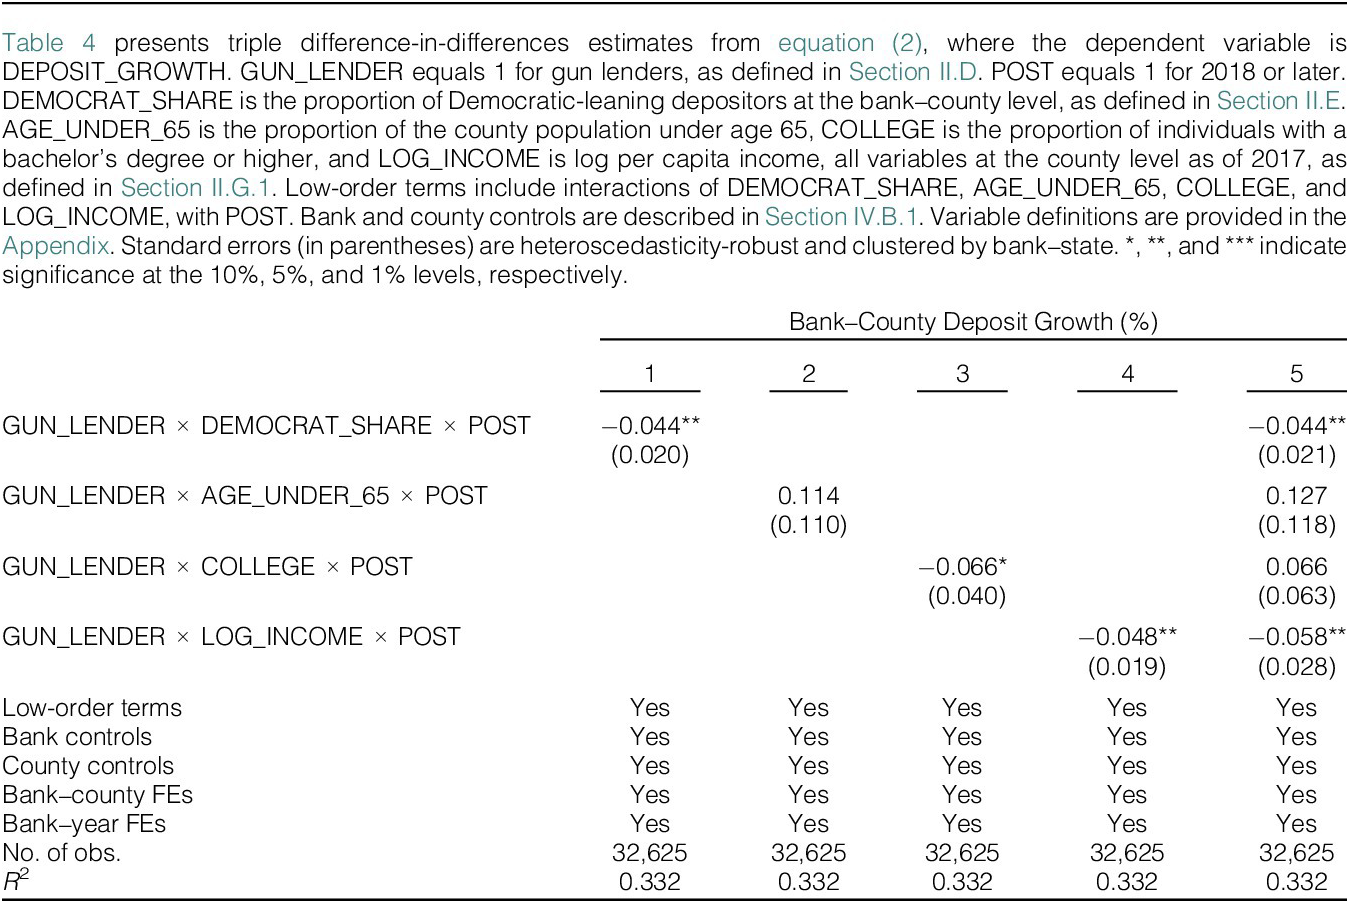
Table 4 reports estimates of heterogeneity in deposit outflows from gun lenders by depositor political values and demographics. Column 1 shows that outflows are significantly larger in markets with higher DEMOCRAT_SHARE. A 1-standard-deviation increase in DEMOCRAT_SHARE (0.24) is associated with an additional 1.1 percentage point reduction in annual deposit growth following the shooting.
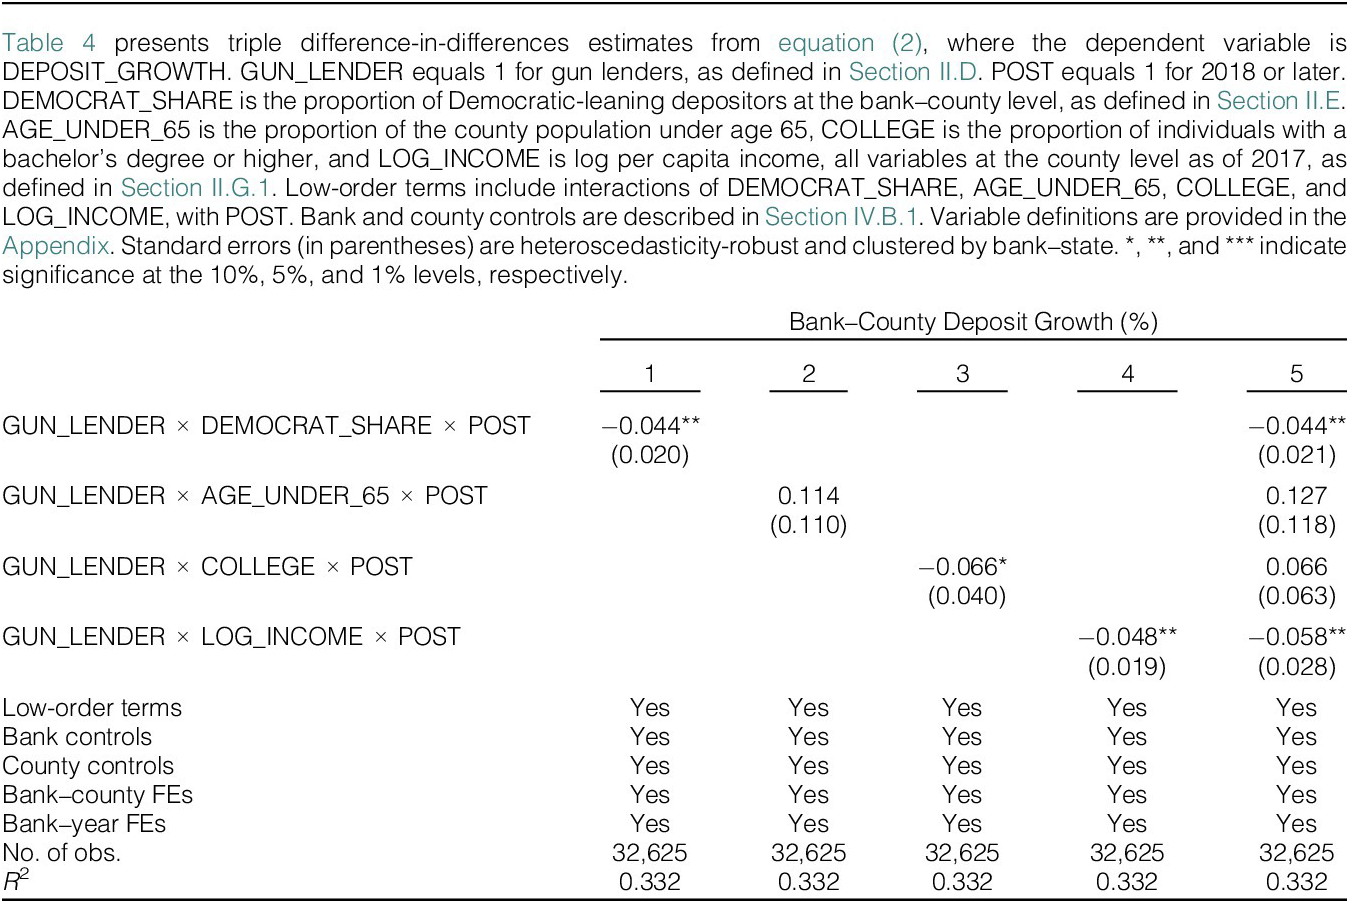
Columns 2–4 examine heterogeneity along individual demographic dimensions discussed in Section II.G.1. No significant heterogeneity is observed for age in column 2. Columns 3 and 4, by contrast, exhibit significant negative heterogeneity for education and income. These results raise the possibility that education and income correlate with depositor political values and could confound the interpretation of political values as the primary driver.
Column 5 addresses this concern by including all measures simultaneously. The coefficient on DEMOCRAT_SHARE remains statistically and economically robust, with a magnitude nearly identical to column 1. By contrast, the coefficients on AGE_UNDER_65 and COLLEGE are insignificant, suggesting that different views on gun policy by age and education, as evidenced in surveys, do not translate into independent variation in depositor responses to gun lenders. Notably, the coefficient on LOG_INCOME retains significance with a slightly larger magnitude than in column 4, presenting an additional channel contributing to depositor responses to gun lenders. Taken together, these results suggest that political values are the primary driver of heterogeneous depositor responses, amplified by income levels.
2. Political Leanings of Gun Lenders
To examine whether deposit outflows from gun lenders are stronger for Republican-leaning gun lenders, the analysis classifies the gun lenders into high and low groups based on the median REPUBLICAN_SHARE (0.637), as defined in Section II.F. The following difference-in-differences specification is estimated:
 $$ {\displaystyle \begin{array}{l}\mathrm{DEPOSIT}\_{\mathrm{GROWTH}}_{i,c,t}={\beta}_1\mathrm{HIGH}\_\mathrm{REP}\_{\mathrm{PAC}}_i\times {\mathrm{POST}}_t\\ {}+{\beta}_2\mathrm{LOW}\_\mathrm{REP}\_{\mathrm{PAC}}_i\times {\mathrm{POST}}_t\\ {}+{\beta}_3{\mathbf{X}}_{i,c,t}+{\eta}_{i,c}+{\delta}_{c,t}+{\varepsilon}_{i,c,t}\end{array}} $$
where $ \mathrm{DEPOSIT}\_{\mathrm{GROWTH}}_{i,c,t} $
is the annual percentage change in deposits of bank
$ \mathrm{DEPOSIT}\_{\mathrm{GROWTH}}_{i,c,t} $
is the annual percentage change in deposits of bank $ i $
in county
$ i $
in county $ c $
in year
$ c $
in year $ t $
.
$ t $
. $ \mathrm{HIGH}\_\mathrm{REP}\_{\mathrm{PAC}}_i $
equals 1 for gun lenders with REPUBLICAN_SHARE above the median, and
$ \mathrm{HIGH}\_\mathrm{REP}\_{\mathrm{PAC}}_i $
equals 1 for gun lenders with REPUBLICAN_SHARE above the median, and $ \mathrm{LOW}\_\mathrm{REP}\_{\mathrm{PAC}}_i $
equals 1 for those at or below the median.
$ \mathrm{LOW}\_\mathrm{REP}\_{\mathrm{PAC}}_i $
equals 1 for those at or below the median. $ {\mathrm{POST}}_t $
equals 1 for 2018 and later. The vector
$ {\mathrm{POST}}_t $
equals 1 for 2018 and later. The vector $ {\mathbf{X}}_{i,c,t} $
includes bank control variables—1-year lagged values of log bank assets and log deposits, the log number of bank branches in the county, and indicators for bank type and the Wells Fargo scandal. Bank–county fixed effects
$ {\mathbf{X}}_{i,c,t} $
includes bank control variables—1-year lagged values of log bank assets and log deposits, the log number of bank branches in the county, and indicators for bank type and the Wells Fargo scandal. Bank–county fixed effects $ {\eta}_{i,c} $
absorb time-invariant bank–county characteristics. County–year fixed effects
$ {\eta}_{i,c} $
absorb time-invariant bank–county characteristics. County–year fixed effects $ {\delta}_{c,t} $
control for time-varying local economic conditions that influence local deposit demand, thereby mitigating concerns that unobserved changes in local deposit demand drive the results. Standard errors are heteroscedasticity-robust and clustered by bank–state.
$ {\delta}_{c,t} $
control for time-varying local economic conditions that influence local deposit demand, thereby mitigating concerns that unobserved changes in local deposit demand drive the results. Standard errors are heteroscedasticity-robust and clustered by bank–state.
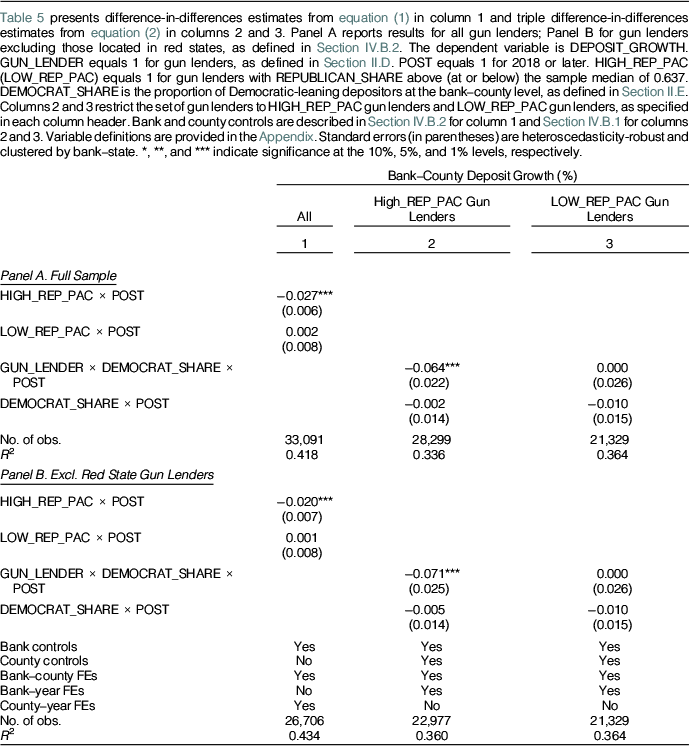
Table 5 reports estimates of heterogeneity in deposit outflows from gun lenders by the political leanings of gun lenders. Panel A presents results for the full sample. Column 1 includes all gun lenders and shows that the decline in annual deposit growth following the shooting is concentrated among HIGH_REP_PAC gun lenders at 2.7 percentage points, while the estimate for LOW_REP_PAC gun lenders is insignificant. Columns 2 and 3 interact the treatment with DEMOCRAT_SHARE while restricting the set of gun lenders to HIGH_REP_PAC gun lenders in column 2 and LOW_REP_PAC gun lenders in column 3. In column 2, a 1-standard-deviation increase in DEMOCRAT_SHARE (0.24) is associated with an additional 1.5 percentage point reduction in annual deposit growth for HIGH_REP_PAC gun lenders. Column 3 shows no significant heterogeneity across depositor political values for LOW_REP_PAC gun lenders.
Heterogeneous Effects by Political Leanings of Gun Lenders.
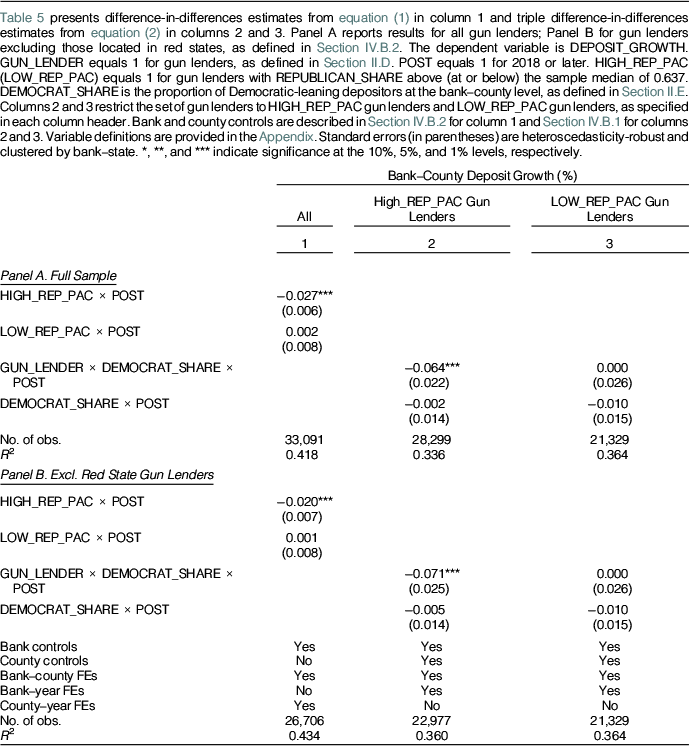
A potential concern is that REPUBLICAN_SHARE may be endogenous to geographic ties, as firms tend to direct PAC contributions to representatives with connections to their operations (Wright (Reference Wright1989)). REPUBLICAN_SHARE could thus capture regional characteristics that influence depositor behavior rather than the political leanings of gun lenders. For instance, gun lenders operating in red states may exhibit higher REPUBLICAN_SHARE because local House members are Republican, and these regional factors could drive depositor responses to gun lenders. This concern is mitigated in two ways. First, gun lenders have a high mean REPUBLICAN_SHARE of 0.66, as reported in Table IA.2 in the Supplementary Material, yet their deposit-weighted Democratic exposure is 0.65, as reported in Table IA.10 in the Supplementary Material. This contrast indicates that PAC allocations of gun lenders are not tightly linked to geographic ties—that is, political compositions of their depositor bases. Second, Panel B addresses the concern by excluding gun lenders headquartered in red states where Republicans won a majority of 2016 House seats: BB&T Corporation, PNC Financial Services, Regions Financial Corporation, Stifel Financial Corp, and Zions Bancorporation, all classified as HIGH_REP_PAC gun lenders in Panel A. The results remain robust, with HIGH_REP_PAC gun lenders experiencing a 2 percentage point decline in annual deposit growth in column 1 and significant heterogeneity based on depositor political values in column 2. These results suggest that political value misalignment between depositors and gun lenders drives depositor movements.
C. Cross-Sectional Tests
To further strengthen identification and address potential unobserved heterogeneity, the analysis estimates the triple difference-in-differences specification from equation (2) along dimensions related to switching frictions, gun control salience, and attitudes toward gun control, using the cross-sectional variables defined in Section II.G.
1. Switching Frictions
Consistent with evidence that switching frictions represent a significant barrier to shifting deposits across banks (Kiser (Reference Kiser2002)), deposit outflows from gun lenders are expected to be larger in markets with lower switching frictions.
To test this prediction, the analysis estimates equation (2) using two complementary indicators in place of DEMOCRAT_SHARE. LOW_SWITCHING_FRICTION $ {}_{\mathrm{BANK}\hbox{-} \mathrm{COUNTY}} $
equals 1 if SWITCHING_FRICTION
$ {}_{\mathrm{BANK}\hbox{-} \mathrm{COUNTY}} $
equals 1 if SWITCHING_FRICTION $ {}_{\mathrm{BANK}\hbox{-} \mathrm{COUNTY}} $
is at or below its median of 0.84 miles. LOW_SWITCHING_FRICTION
$ {}_{\mathrm{BANK}\hbox{-} \mathrm{COUNTY}} $
is at or below its median of 0.84 miles. LOW_SWITCHING_FRICTION $ {}_{\mathrm{COUNTY}} $
equals 1 if SWITCHING_FRICTION
$ {}_{\mathrm{COUNTY}} $
equals 1 if SWITCHING_FRICTION $ {}_{\mathrm{COUNTY}} $
is at or below its median of 0.80 miles. Given market concentration is closely related to switching frictions and influences depositor behavior through deposit rate sensitivity (Klemperer (Reference Klemperer1995), Drechsler et al. (Reference Drechsler, Savov and Schnabl2017)), all specifications control for market concentration by including interactions of HHI with the treatment indicators, as defined in Section II.G.2 and incorporated in the baseline controls from equation (2).
$ {}_{\mathrm{COUNTY}} $
is at or below its median of 0.80 miles. Given market concentration is closely related to switching frictions and influences depositor behavior through deposit rate sensitivity (Klemperer (Reference Klemperer1995), Drechsler et al. (Reference Drechsler, Savov and Schnabl2017)), all specifications control for market concentration by including interactions of HHI with the treatment indicators, as defined in Section II.G.2 and incorporated in the baseline controls from equation (2).
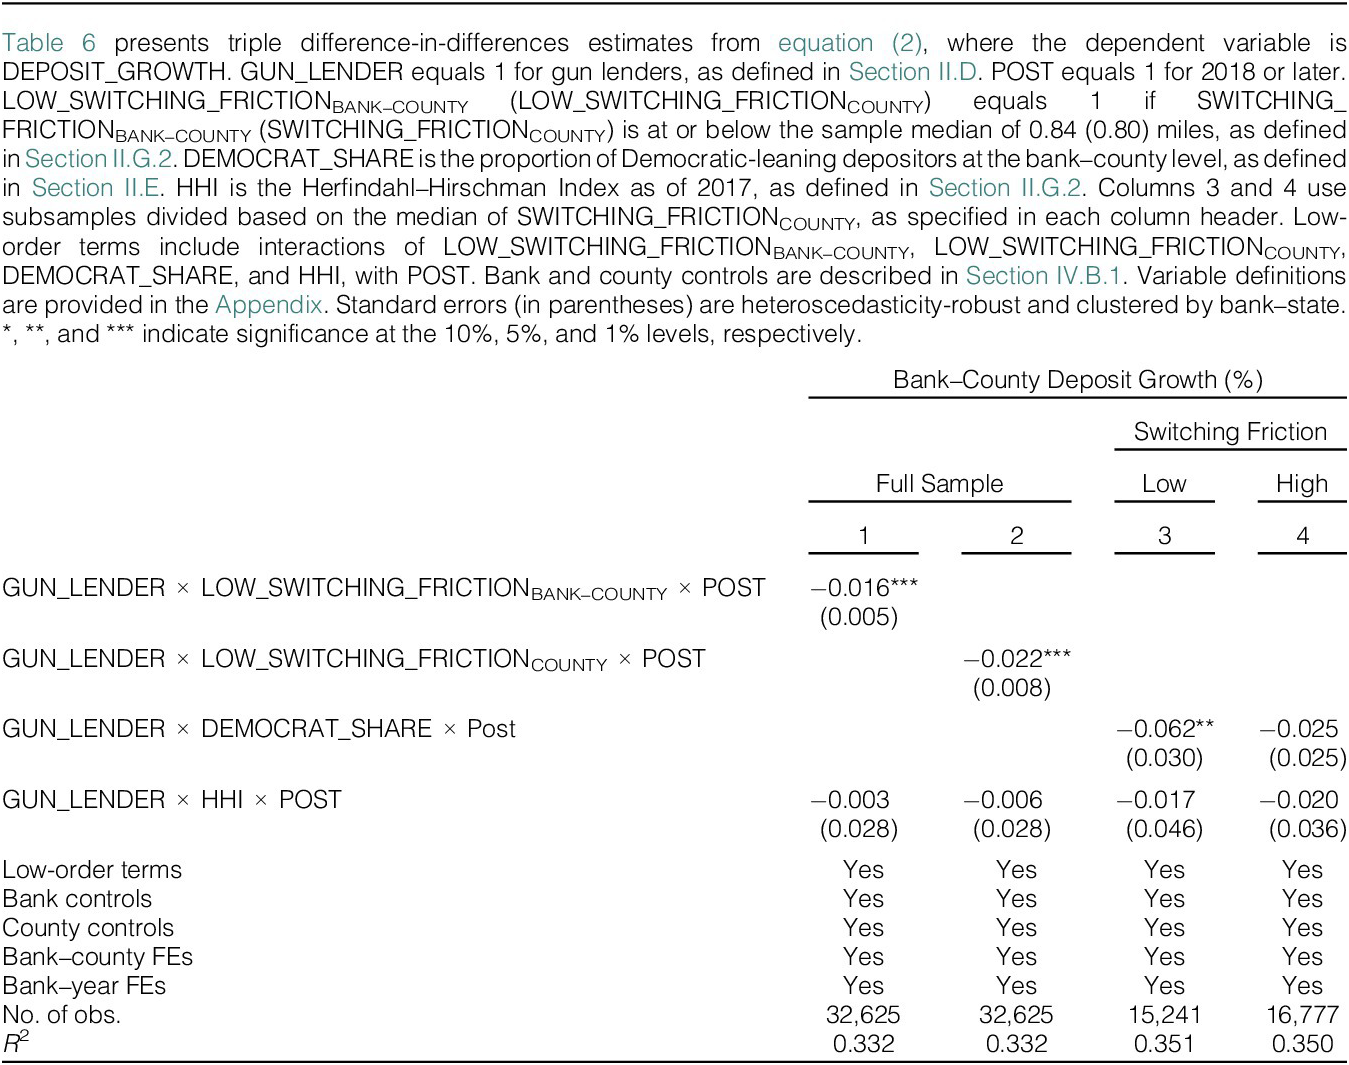
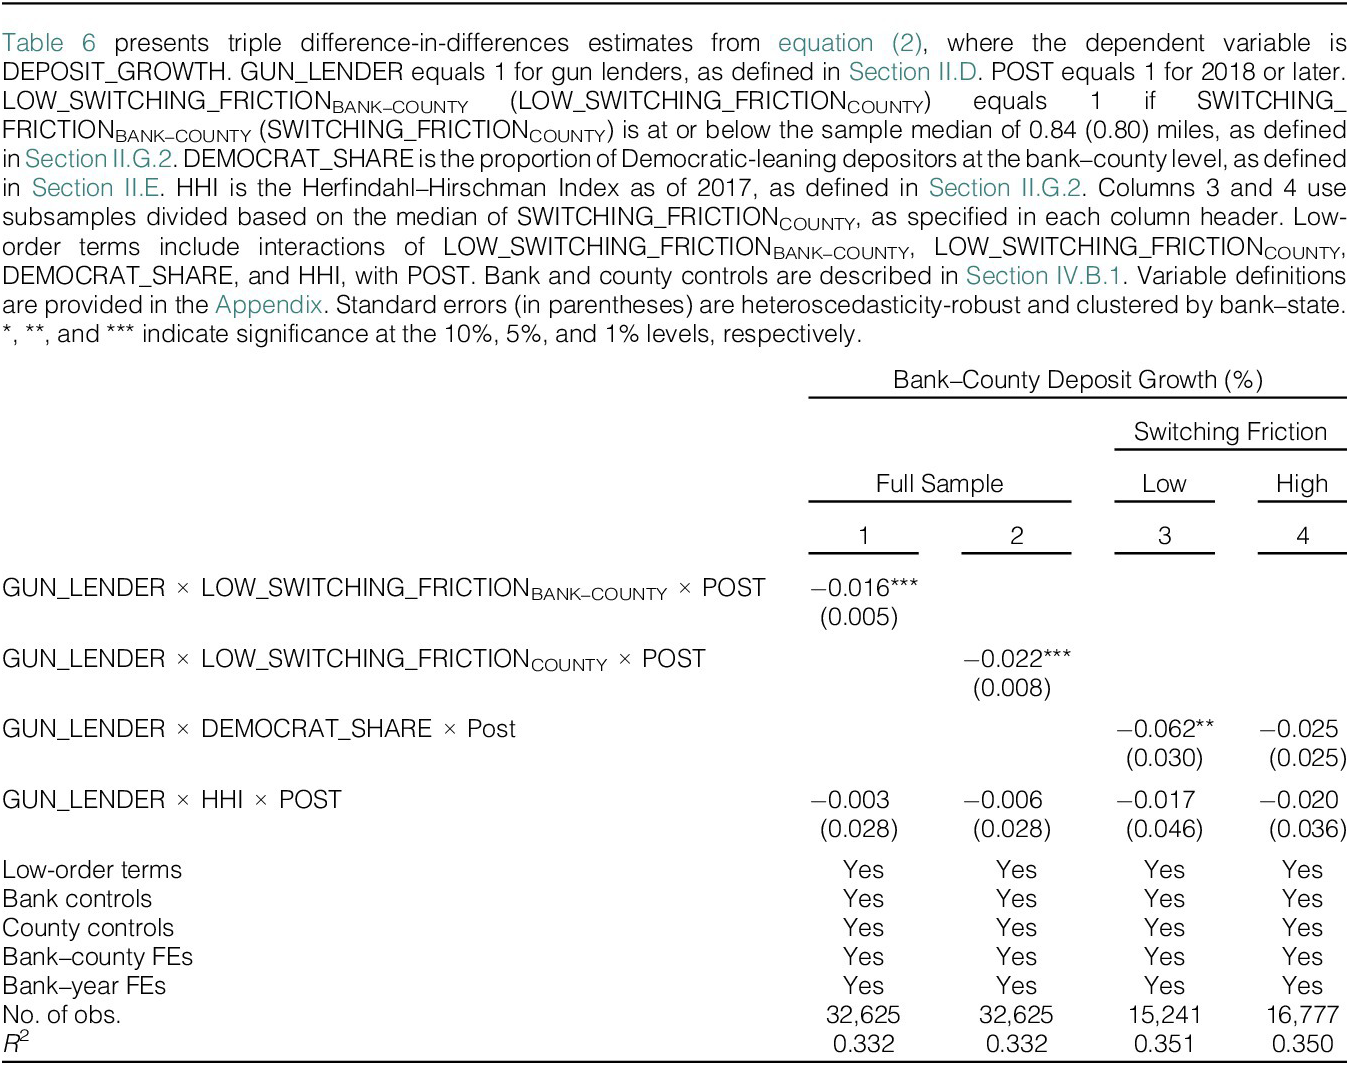
Table 6 reports estimates of heterogeneity in deposit outflows from gun lenders by switching frictions. Columns 1 and 2 show that deposit outflows from gun lenders are significantly larger when switching frictions are low. Gun lenders experience an additional 1.6 to 2.2 percentage point reduction in annual deposit growth in markets with low switching friction. Columns 3 and 4 split the sample by the median of SWITCHING_FRICTION $ {}_{\mathrm{COUNTY}} $
. In column 3, when switching frictions are low, a 1-standard-deviation increase in DEMOCRAT_SHARE (0.24) is associated with an additional 1.5 percentage point reduction in annual deposit growth at gun lenders. Column 4 shows no significant heterogeneity based on depositor political values when switching frictions are high. These results indicate that switching frictions attenuate depositor responses to political value misalignment with gun lenders.
$ {}_{\mathrm{COUNTY}} $
. In column 3, when switching frictions are low, a 1-standard-deviation increase in DEMOCRAT_SHARE (0.24) is associated with an additional 1.5 percentage point reduction in annual deposit growth at gun lenders. Column 4 shows no significant heterogeneity based on depositor political values when switching frictions are high. These results indicate that switching frictions attenuate depositor responses to political value misalignment with gun lenders.
2. Gun Control Salience and Attitudes toward Gun Control
Attitudes toward gun control may be influenced by factors beyond political values and demographics. For example, Luca et al. (Reference Luca, Malhotra and Poliquin2020) document increased support for gun control following exposure to mass shootings. Moreover, the Parkland shooting sparked widespread social media activism, with the “Never Again MSD” movement rapidly gaining traction and the hashtag, #NeverAgain, going viral. Deposit outflows from gun lenders are, therefore, expected to be larger in markets where gun control issues exhibit greater salience and stronger supporting attitudes.
To test this prediction, the analysis estimates equation (2) using MASS_SHOOTING and SCI in place of DEMOCRAT_SHARE, as defined in Section II.G.3. All specifications involving SCI include PHYSICAL_DISTANCE to control for geographic proximity.
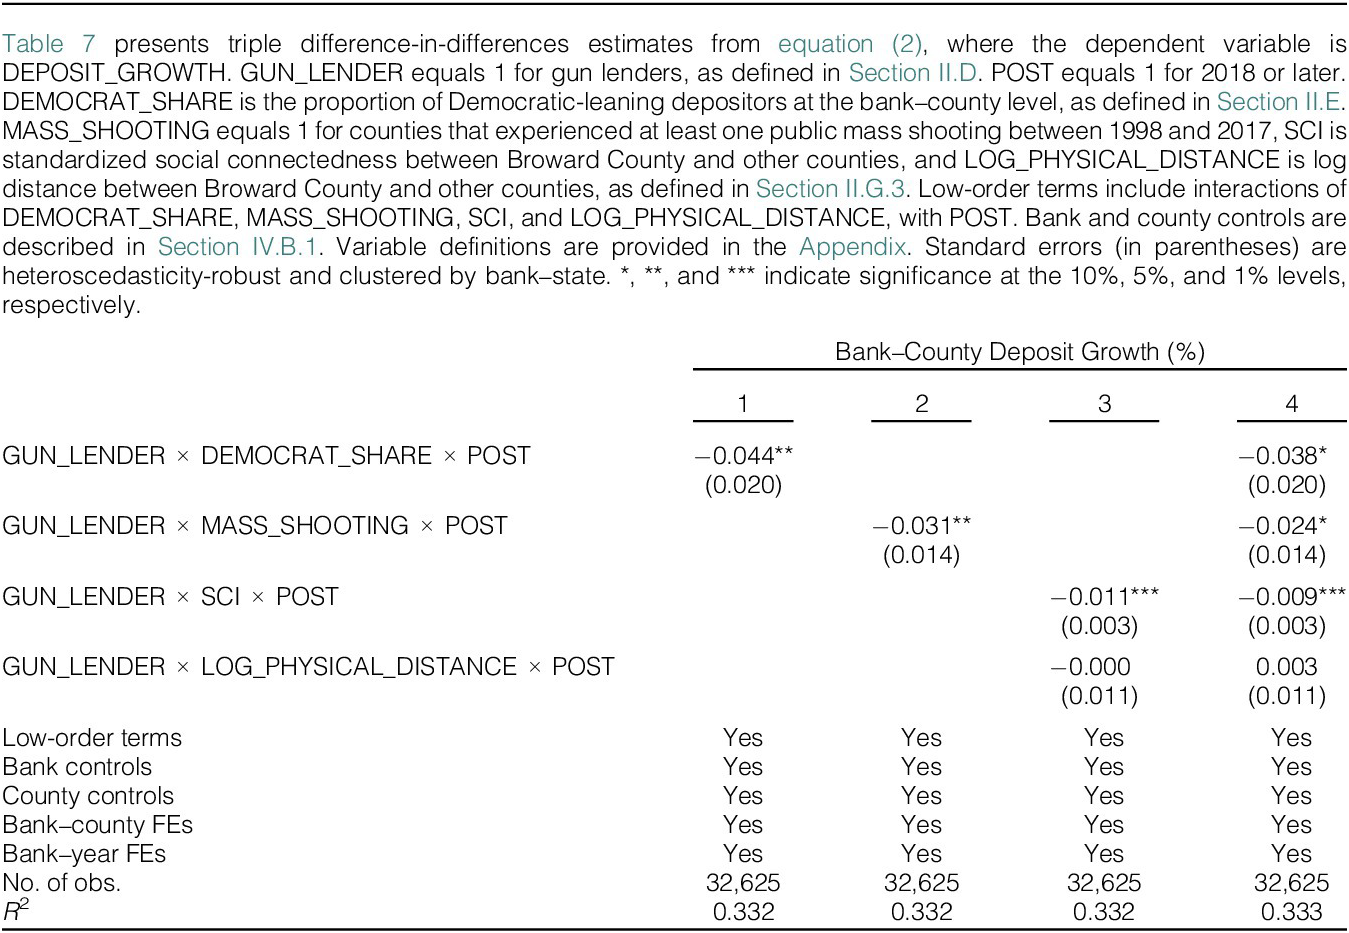
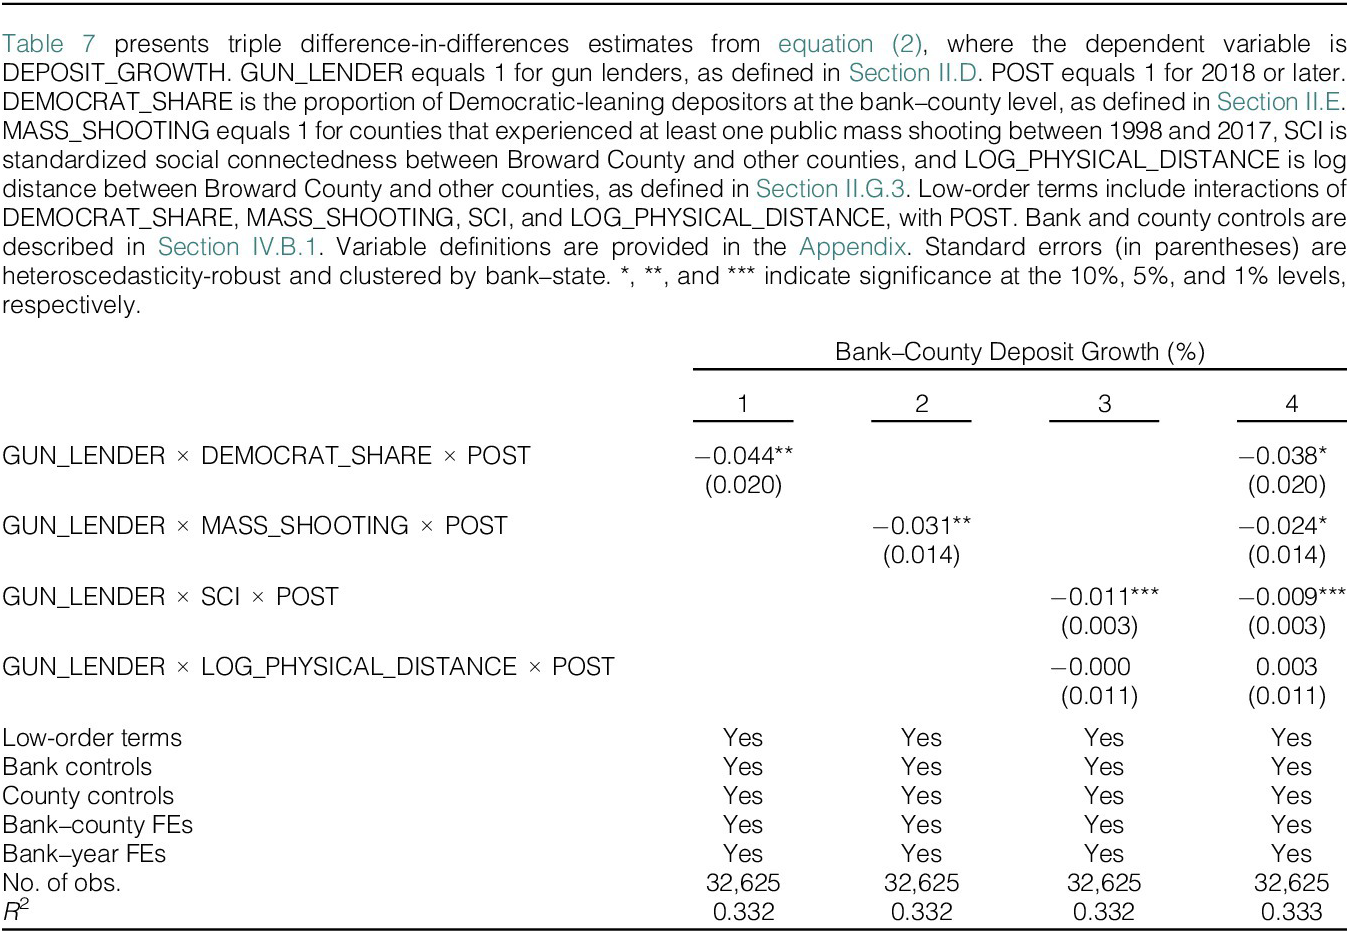
Table 7 reports estimates of heterogeneity in deposit outflows from gun lenders by gun control salience and attitudes toward gun control. Column 1 reproduces the baseline with DEMOCRAT_SHARE for comparison. Column 2 shows that the negative depositor responses to gun lenders are significantly stronger in markets that experienced at least one public mass shooting between 1998 and 2017, with gun lenders exhibiting an additional 3.1 percentage point reduction in annual deposit growth following the shooting. Column 3 shows significant negative heterogeneity for social connectedness. A 1-standard-deviation increase in SCI is associated with an additional 1.1 percentage point reduction in annual deposit growth for gun lenders. Column 4 includes all measures simultaneously; the coefficients on MASS_SHOOTING and SCI remain statistically and economically significant, as does the coefficient on DEMOCRAT_SHARE. These results indicate that salience and attitudinal factors amplify the role of political values in driving depositor responses to gun lenders.
D. Depositor Movements Against Anti-Gun Lenders
Several banks adopted restrictions on business with the gun industry following the Parkland shooting, as listed in Panel C of Table 1. For example, Bank of America Corporation ceased lending to manufacturers of military-style firearms for civilian use, and Citigroup imposed restrictions on credit to certain firearm retailers.Footnote 16 To examine depositor responses to these anti-gun lenders in parallel with those to gun lenders, the analysis estimates the baseline difference-in-differences specification from equation (1) and the triple interactions from equation (2), replacing GUN_LENDER with ANTIGUN_LENDER.
Table IA.9 in the Supplementary Material reports the estimates. Column 1 shows that anti-gun lenders experience 1.1 percentage points lower annual deposit growth following the shooting, though the estimate is statistically insignificant. Column 2 indicates modest heterogeneity by depositor political values; a 1-standard-deviation decrease in DEMOCRAT_SHARE (0.24) is associated with an additional 0.3 percentage point reduction in annual deposit growth at anti-gun lenders, but the effect is also insignificant.
Anti-gun lenders have depositor bases with a deposit-weighted Democratic exposure of 0.654, comparable to 0.65 for gun lenders. Because anti-gun policies align with the predominant political values of their depositors, deposit outflows from anti-gun lenders remain limited. In contrast, the ties of gun lenders to the gun industry conflict with depositor values, leading to substantial deposit outflows from gun lenders. These results provide further support for political value misalignment as a driver of depositor behavior.
V. Implications
A. Deposit Spreads
Deposit outflows from gun lenders impair their competitiveness in local deposit markets, prompting them to reduce deposit spreads, particularly in Democratic-leaning markets, consistent with efforts to retain depositors by improving price competitiveness.
To test this prediction, the analysis estimates the following triple difference-in-differences specification on the bank–county–product–quarter deposit spread panel described in Section II.B:
 $$ {\displaystyle \begin{array}{l}\Delta \mathrm{DEPOSIT}\_{\mathrm{SPREAD}}_{i,c,t}={\beta}_1\mathrm{GUN}\_{\mathrm{LENDER}}_i\times \mathrm{DEMOCRAT}\_{\mathrm{SHARE}}_{i,c}\\ {}\times {\mathrm{POST}}_t+{\beta}_2\mathrm{GUN}\_{\mathrm{LENDER}}_i\times {\mathrm{HHI}}_c\times {\mathrm{POST}}_t\\ {}+{\beta}_3\mathrm{DEMOCRAT}\_{\mathrm{SHARE}}_{i,c}\times {\mathrm{POST}}_t\\ {}+{\beta}_4{\mathrm{HHI}}_c\times {\mathrm{POST}}_t\\ {}+{\beta}_5{\mathbf{X}}_{i,c,t}+{\eta}_{i,c}+{\delta}_{i,t}+{\varepsilon}_{i,c,t}\end{array}} $$
where $ \Delta DEPOSIT\_{SPREAD}_{i,c,t} $
is the quarterly change in the deposit spread of bank
$ \Delta DEPOSIT\_{SPREAD}_{i,c,t} $
is the quarterly change in the deposit spread of bank $ i $
in county
$ i $
in county $ c $
in year–quarter
$ c $
in year–quarter $ t $
.
$ t $
. $ \mathrm{GUN}\_{\mathrm{LENDER}}_i $
equals 1 for gun lenders, as defined in Section II.D.
$ \mathrm{GUN}\_{\mathrm{LENDER}}_i $
equals 1 for gun lenders, as defined in Section II.D. $ {\mathrm{POST}}_t $
equals 1 if 2018.
$ {\mathrm{POST}}_t $
equals 1 if 2018. $ \mathrm{DEMOCRAT}\_{\mathrm{SHARE}}_{i,c} $
is the exposure of bank
$ \mathrm{DEMOCRAT}\_{\mathrm{SHARE}}_{i,c} $
is the exposure of bank $ i $
to Democratic-leaning depositors in county
$ i $
to Democratic-leaning depositors in county $ c $
, as defined in Section II.E.
$ c $
, as defined in Section II.E. $ {\mathrm{HHI}}_c $
is the sum of squared deposit market shares of all bank branches operating in county
$ {\mathrm{HHI}}_c $
is the sum of squared deposit market shares of all bank branches operating in county $ c $
as of June 30, 2017, as defined in Section II.G.2. The vector
$ c $
as of June 30, 2017, as defined in Section II.G.2. The vector $ {\mathbf{X}}_{i,c,t} $
includes a bank control—the log number of bank branches in the county—and county controls—1-year lagged values of log population, log per capita income, population growth, and unemployment rate. Bank–county fixed effects
$ {\mathbf{X}}_{i,c,t} $
includes a bank control—the log number of bank branches in the county—and county controls—1-year lagged values of log population, log per capita income, population growth, and unemployment rate. Bank–county fixed effects $ {\eta}_{i,c} $
absorb time-invariant bank–county characteristics. Bank–year–quarter fixed effects
$ {\eta}_{i,c} $
absorb time-invariant bank–county characteristics. Bank–year–quarter fixed effects $ {\delta}_{i,t} $
control for time-varying bank characteristics. Standard errors are heteroscedasticity-robust and clustered by bank–state.
$ {\delta}_{i,t} $
control for time-varying bank characteristics. Standard errors are heteroscedasticity-robust and clustered by bank–state.
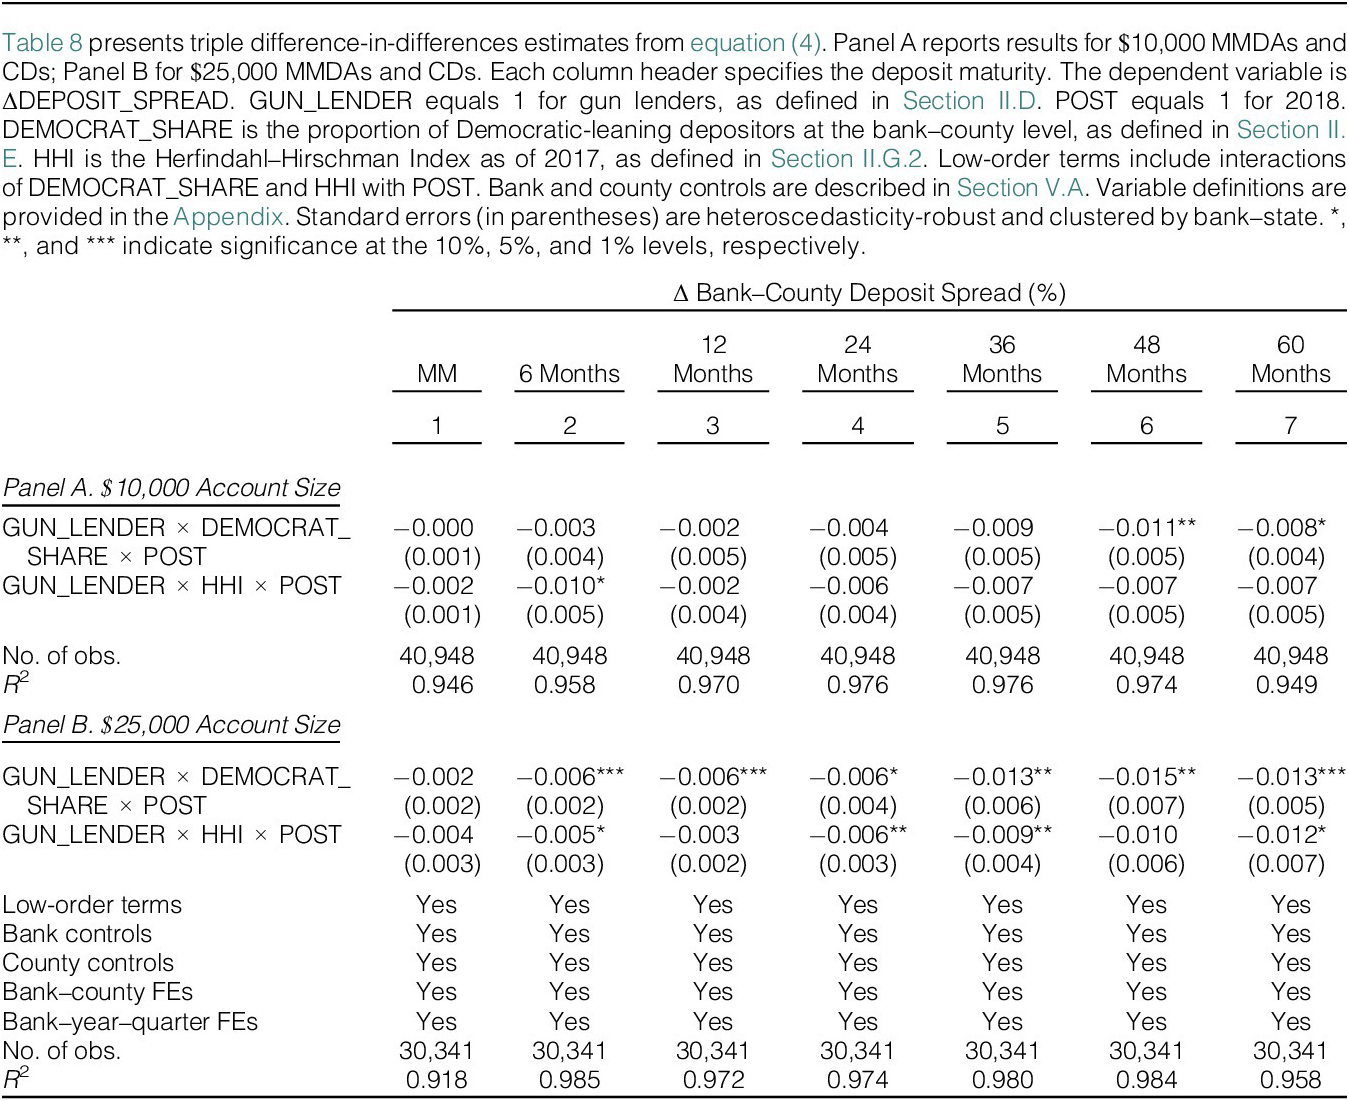
Table 8 reports estimates of heterogeneity in deposit spreads by depositor political values, separately for $10,000 and $25,000 account sizes and by maturity. For $10,000 MMDAs and CDs in Panel A, the negative effects on deposit spreads of gun lenders are stronger in markets with higher DEMOCRAT_SHARE across maturities but statistically insignificant for shorter terms up to 36 months. The effects become statistically significant for longer-term products of 48 and 60 months. For example, for 48-month $10,000 CDs in column 6, a 1-standard-deviation increase in DEMOCRAT_SHARE (0.25) is associated with an additional 0.3 basis point reduction in quarterly deposit spread, which represents 2% relative to the mean quarterly change of 14.7 basis points.
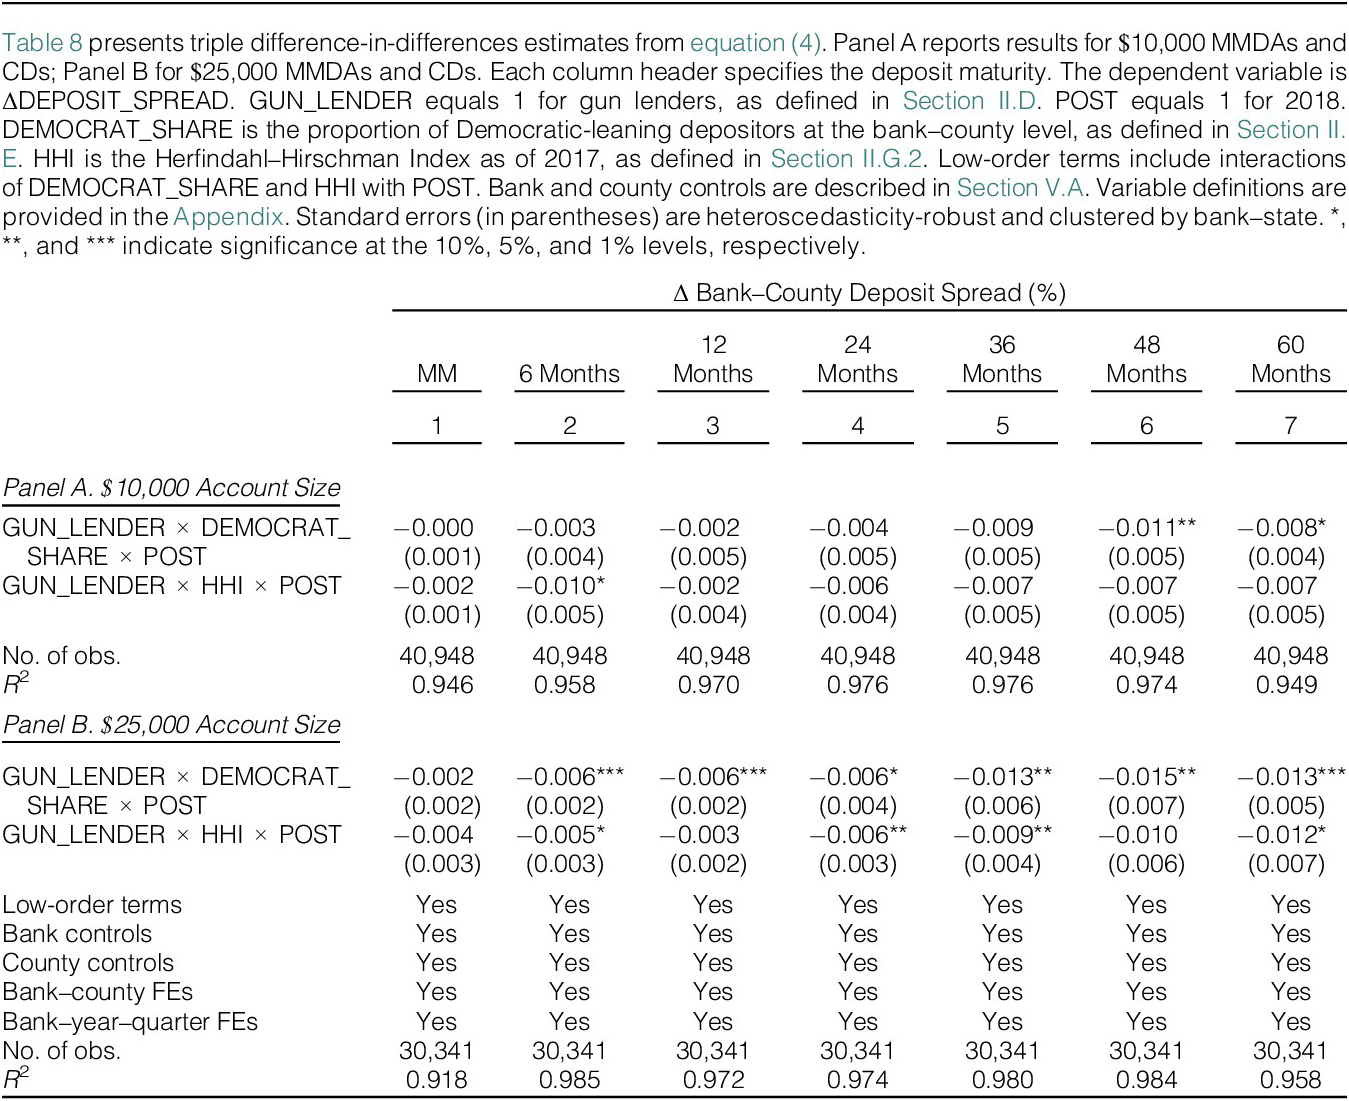
For $25,000 MMDAs and CDs in Panel B, the negative effects are larger and statistically significant across all maturities of CDs. For 48-month $25,000 CDs in column 6, a 1-standard-deviation increase in DEMOCRAT_SHARE (0.25) is associated with an additional 0.4 basis point decline in quarterly deposit spread. These results hold after controlling for market concentration and suggest that gun lenders adjust deposit spreads on longer-term and larger-account products in Democratic-leaning markets to improve price competitiveness and retain depositors.
B. Bank Branching
Deposit outflows from gun lenders may also prompt them to reduce branches, particularly in Democratic-leaning markets, consistent with efforts to reduce operational costs in markets with deteriorating deposit bases.
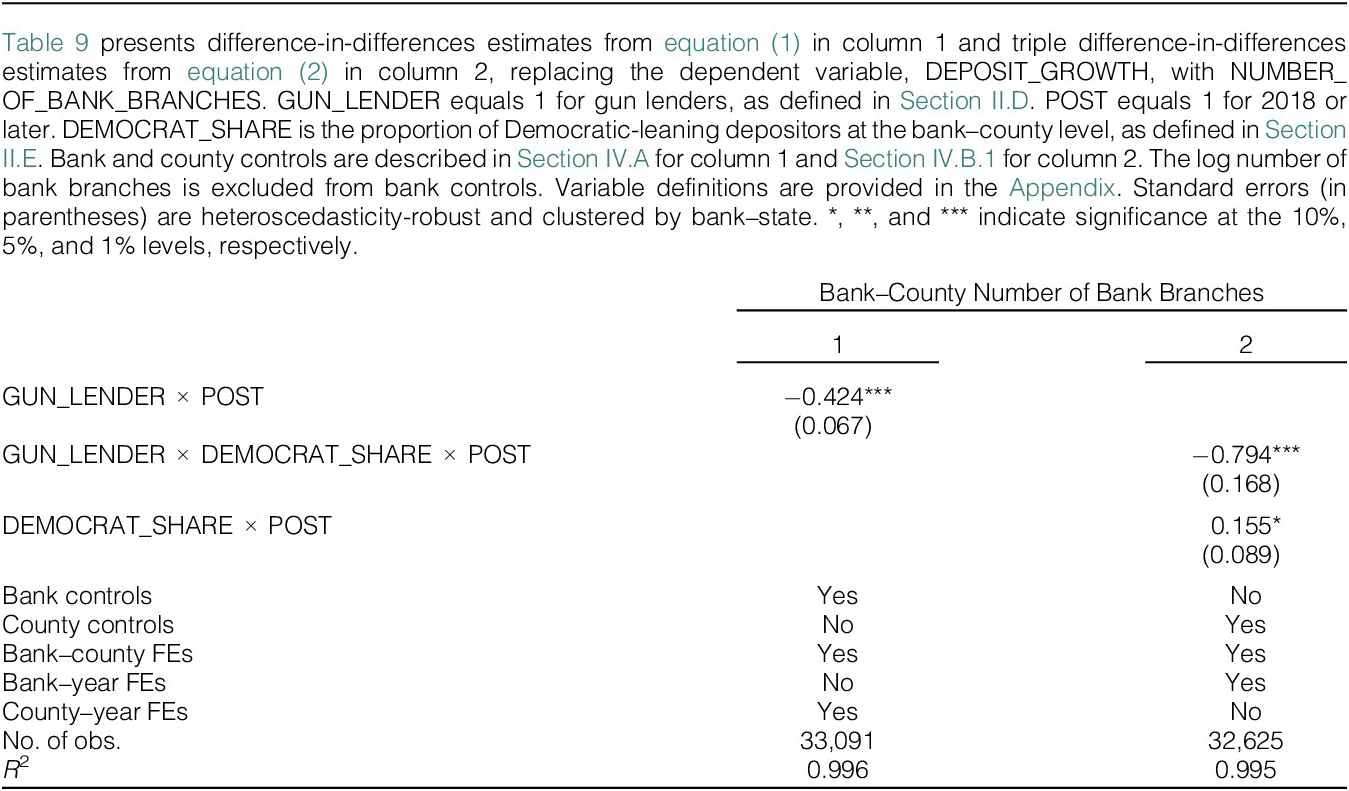
To test this prediction, the analysis estimates the baseline difference-in-differences specification from equation (1) and the triple difference-in-differences specification from equation (2), replacing the dependent variable, DEPOSIT_GROWTH, with NUMBER_OF_BANK_BRANCHES.
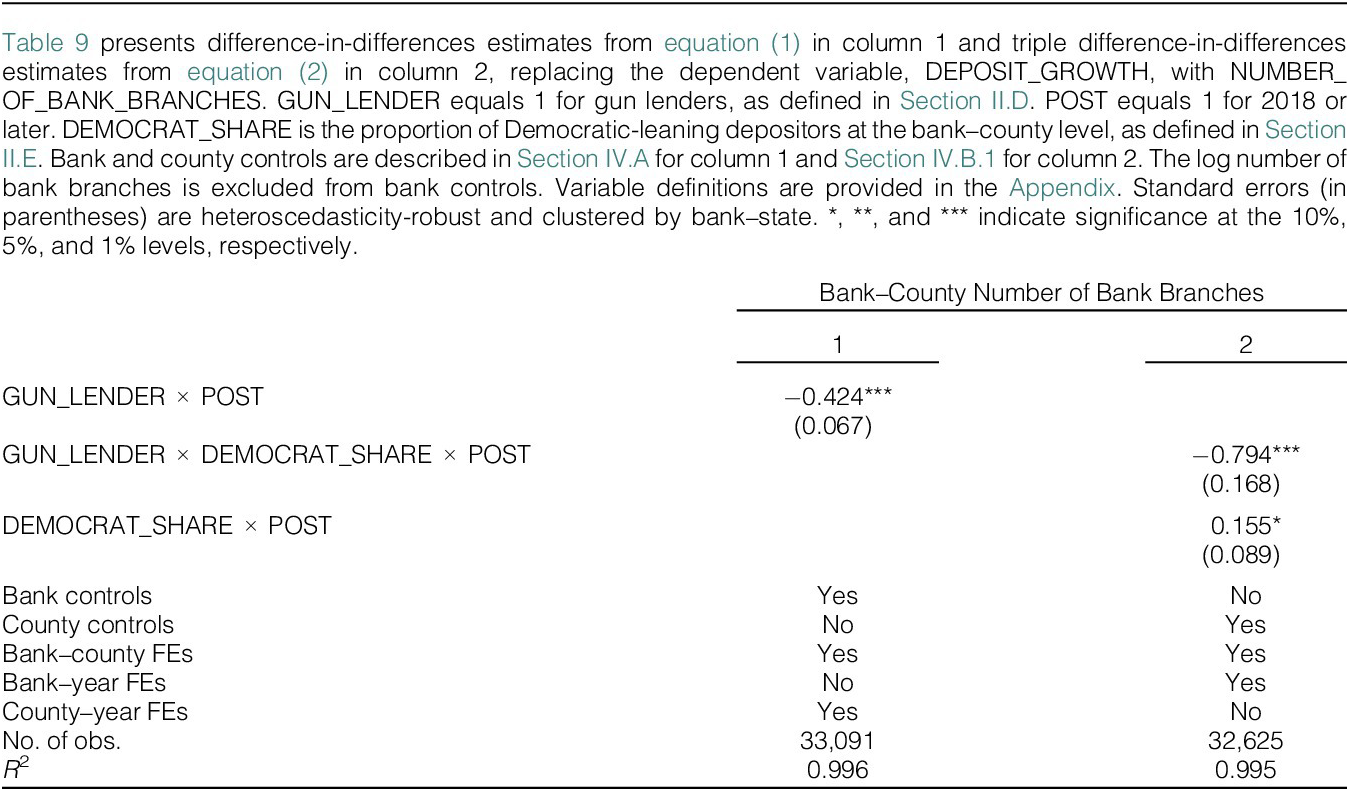
Table 9 reports the estimates. Column 1 shows that gun lenders reduce branches by 0.424 per county following the shooting, representing a 5.7% decline relative to the preperiod mean of 7.47 branches per county for gun lenders. Column 2 shows that the branch reductions are significantly larger in Democratic-leaning markets, with a 1-standard-deviation increase in DEMOCRAT_SHARE (0.24) associated with an additional 0.191 branch reduction per county. These results suggest that gun lenders reduce branches following the shooting, with reductions more pronounced in Democratic-leaning markets, reflecting operational adjustments in response to deteriorating deposit bases.
C. Bank Lending
Prior studies document heterogeneity in the transmission of funding constraints to lending across bank sizes (e.g., Iyer and Peydro (Reference Iyer and Peydro2011), Gilje, Loutskina, and Strahan (Reference Gilje, Loutskina and Strahan2016)). Large banks are typically resilient due to access to alternative funding sources, whereas small and regional banks—which rely heavily on retail deposits and have limited access to external markets—are vulnerable to these constraints and thus more likely to reduce lending.
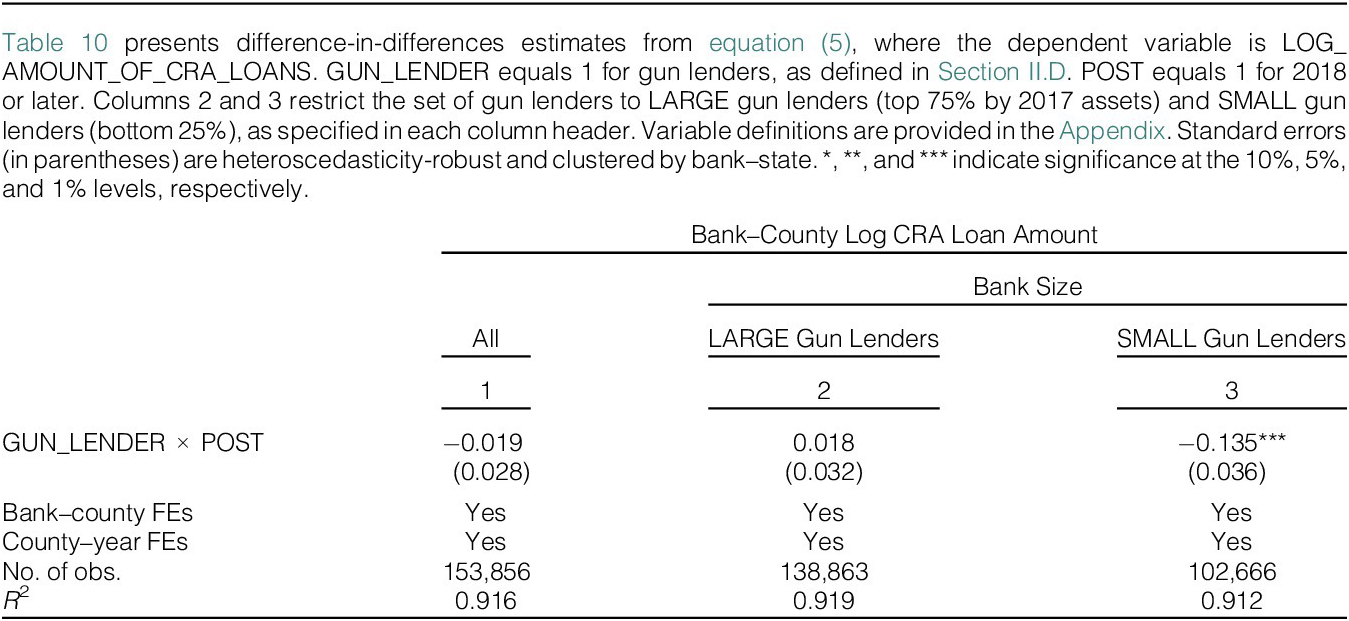
Deposit outflows from gun lenders, combined with adjustments in deposit spreads and branches, tighten funding constraints. Although gun lenders are generally large banks, they exhibit substantial variation in asset size, ranging from $37 billion to $2.1 trillion as of 2017. To examine whether these constraints transmit to lending and whether this transmission varies by bank size, the analysis classifies gun lenders into LARGE—top 75% by 2017 assets, ranging from $214 billion to $2.1 trillion—and SMALL—bottom 25%, ranging from $37 billion to $125 billion—groups, the latter broadly overlapping with the Federal Reserve classification for regional banks of $10 billion to $100 billion.
The following difference-in-differences specification is estimated on the bank–county–year CRA loan panel described in Section II.C:
 $$ \mathrm{LOG}\_\mathrm{CRA}\_{\mathrm{LOANS}}_{i,c,t}={\beta}_1\mathrm{GUN}\_{\mathrm{LENDER}}_i\times {\mathrm{POST}}_t+{\eta}_{i,c}+{\delta}_{c,t}+{\varepsilon}_{i,c,t} $$
where $ \mathrm{LOG}\_\mathrm{CRA}\_{\mathrm{LOANS}}_{i,c,t} $
is the log of total CRA loan amount originated by bank
$ \mathrm{LOG}\_\mathrm{CRA}\_{\mathrm{LOANS}}_{i,c,t} $
is the log of total CRA loan amount originated by bank $ i $
in county
$ i $
in county $ c $
in year
$ c $
in year $ t $
.
$ t $
. $ \mathrm{GUN}\_{\mathrm{LENDER}}_i $
equals 1 for gun lenders, as defined in Section II.D.
$ \mathrm{GUN}\_{\mathrm{LENDER}}_i $
equals 1 for gun lenders, as defined in Section II.D. $ {\mathrm{POST}}_t $
equals 1 for 2018 and later. Bank–county fixed effects
$ {\mathrm{POST}}_t $
equals 1 for 2018 and later. Bank–county fixed effects $ {\eta}_{i,c} $
absorb time-invariant bank–county characteristics. County–year fixed effects
$ {\eta}_{i,c} $
absorb time-invariant bank–county characteristics. County–year fixed effects $ {\delta}_{c,t} $
control for time-varying local economic conditions that influence local loan demand, thereby mitigating concerns that unobserved changes in local loan demand drive the results. Standard errors are heteroscedasticity-robust and clustered by bank–state.
$ {\delta}_{c,t} $
control for time-varying local economic conditions that influence local loan demand, thereby mitigating concerns that unobserved changes in local loan demand drive the results. Standard errors are heteroscedasticity-robust and clustered by bank–state.
Table 10 reports the estimates, with heterogeneity by bank size. Column 1 includes all gun lenders and shows no significant average effect on CRA lending, indicating that deposit outflows from gun lenders do not transmit to lending on average. Columns 2 and 3 restrict the set of gun lenders to LARGE gun lenders and SMALL gun lenders, respectively. LARGE gun lenders show no significant reduction in CRA loan volumes despite a 1.6 percentage point decline in annual deposit growth, as reported in Table IA.6 in the Supplementary Material. In contrast, SMALL gun lenders reduce CRA loan volumes by 13.5% following a 3.0 percentage point decline in annual deposit growth. These results are consistent with prior evidence that smaller banks are more likely to transmit funding constraints to lending due to greater reliance on retail deposits and limited access to alternative funding.

VI. Conclusion
A growing literature documents the influence of political values on financial decision-making. This article extends this work to the deposit market by examining depositor responses to political value misalignment with banks. Focusing on gun policy—one of the most divisive issues in the United States—and exploiting the 2018 Parkland shooting and subsequent activism as an exogenous increase in public awareness of banks’ ties to the gun industry, the analysis finds significant deposit outflows from gun lenders. These outflows are more pronounced in Democratic-leaning markets and for Republican-leaning gun lenders, amplified by low switching frictions, heightened gun control salience, and strong supporting attitudes toward gun control issues. In contrast, anti-gun lenders experience limited and insignificant outflows, consistent with alignment between their policies and the political values of their depositors.
Deposit outflows from gun lenders have implications for bank funding and lending. Gun lenders reduce deposit spreads in Democratic-leaning markets, particularly for longer-maturity and larger-account products, to improve price competitiveness and retain depositors. Gun lenders also reduce branches, with reductions more pronounced in Democratic-leaning markets. Deposit outflows, combined with adjustments in deposit spreads and branches, tighten funding constraints. While large gun lenders appear resilient, small gun lenders significantly reduce CRA loan volumes, consistent with prior evidence on heterogeneity in the transmission of funding constraints to lending across bank sizes.
These findings highlight the role of political value misalignment in shaping depositor behavior and its real effects on banks. They suggest that political values can impose economically significant costs on banks, particularly smaller banks with limited funding diversification.
Appendix. Variable Definitions
Bank–County Level
- DEPOSIT_GROWTH:
-
Annual percentage change in deposits, as defined in Section II.A
- $ \Delta $
DEPOSIT_SPREAD:
$ \Delta $
DEPOSIT_SPREAD: -
Quarterly change in deposit spread, as defined in Section II.B
- NUMBER_OF_BANK_BRANCHES:
-
Number of bank branches in a county
- DEMOCRAT_SHARE:
-
Deposit-weighted average of zip-code-level ratios of Democratic Party donors to total donors during the 2015–2016 election cycle across branches of a bank in a county, using branch deposit holdings as of June 30, 2017 as weights, as defined in Section II.E
- SWITCHING_FRICTION:
-
Deposit-weighted average of the shortest distances from branches of a gun lender to the nearest branches of control lenders in the same county, using branch deposit holdings as of 2017 as weights, as defined in Section II.G.2
- LOW_SWITCHING_FRICTION:
-
Indicator variable, equal to 1 if SWITCHING_FRICTIONBANK–COUNTY is at or below the sample median of 0.84 miles
- AMOUNT_OF_CRA_LOANS:
-
Total CRA loan amount (millions, USD) originated by a bank in a county, as defined in Section II.C
- NUMBER_OF_CRA_LOANS:
-
Total number of CRA loans originated by a bank in a county, as defined in Section II.C

Bank Level
- GUN_LENDER:
-
Indicator variable, equal to 1 for gun lenders, as defined in Section II.D
- ANTIGUN_LENDER:
-
Indicator variable, equal to 1 for anti-gun lenders, as listed in Panel C of Table 1
- ASSETS:
-
Bank assets (trillions, USD)
- DOMESTIC_DEPOSITS:
-
Bank domestic deposits (trillions, USD)
- BANK_TYPE:
-
Bank type as defined by the FDIC (e.g., national bank, state commercial banks, federal chartered stock savings bank)
- WELLS_FARGO_SCANDAL:
-
Indicator variable, equal to 1 for Wells Fargo & Company in 2017
- REPUBLICAN_SHARE:
-
PAC donations to Republican politicians divided by total PAC donations to politicians from the two major parties during the 2015–2016 election cycle, as defined in Section II.F
- HIGH_REP_PAC:
-
Indicator variable, equal to 1 for gun lenders with REPUBLICAN_SHARE above the sample median of 0.637
- LOW_REP_PAC:
-
Indicator variable, equal to 1 for gun lenders with REPUBLICAN_SHARE at or below the sample median of 0.637
County Level
- DEMOCRAT_SHAREELECTION:
-
Votes for the Democratic candidate divided by total votes for the two major-party candidates in the 2016 U.S. presidential election, as defined in Section II.E
- AGE_UNDER_65:
-
Proportion of county population under age 65 as of 2017, as defined in Section II.G.1
- COLLEGE:
-
Proportion of individuals with a bachelor’s degree or higher in a county as of 2017, as defined in Section II.G.1
- INCOME:
-
Total county income (thousands, USD) divided by the county population as of 2017, as defined in Section II.G.1
- SWITCHING_FRICTION:
-
Deposit-weighted average of SWITCHING_FRICTIONBANK–COUNTY across gun lenders in a county, using bank–county deposit holdings as of 2017 as weights, as defined in Section II.G.2
- LOW_SWITCHING_FRICTION:
-
Indicator variable, equal to 1 if SWITCHING_FRICTIONCOUNTY is at or below the sample median of 0.8 miles
- HHI:
-
Sum of squared deposit market shares of all branches operating in a county as of 2017, as defined in Section II.G.2
- MASS_SHOOTING:
-
Indicator variable, equal to 1 for counties that experienced at least one public mass shooting between 1998 and 2017, as defined in Section II.G.3
- SCI:
-
Standardized social connectedness between a county and Broward County, Florida, the site of the Parkland shooting, with mean zero and standard deviation 1, as defined in Section II.G.3
- PHYSICAL_DISTANCE:
-
Physical distance (miles) between a county and Broward County based on their centroids, as defined in Section II.G.3
- POPULATION:
-
County population (thousands)
- PER_CAPITA_INCOME:
-
Total county income (thousands, USD) divided by the county population
- POPULATION_GROWTH:
-
Annual percentage change in county population
- UNEMPLOYMENT_RATE:
-
Unemployment rate (percent) in the county
Supplementary Material
To view supplementary material for this article, please visit http://doi.org/10.1017/S0022109026102907.


 Open access

