

Since 24 h dietary recalls (24hDR) have been identified as a useful method of diet assessment among children(Reference McPherson, Hoelsher and Alexander1), a self-administered computerized 24hDR program is being developed for children, called the Food Intake Recording Software System (FIRSSt)(Reference Baranowski, Islam and Baranowski2, Reference Baranowski, Beltran and Martin3). A key issue for dietary assessment is portion size estimation(Reference Cypel, Guenther and Petot4). While there have been substantial problems in obtaining high portion size accuracy(Reference Cypel, Guenther and Petot4), use of food photographs has enhanced accuracy among adults(Reference Nelson, Atkinson and Darbyshire5). A series of eight photographs in successively larger portions resulted in only −4 % to +5 % error in portion size estimation, compared with −23 % to +9 % using a single food photograph(Reference Nelson, Atkinson and Darbyshire5). Small portion sizes tended to be overestimated while larger portion sizes tended to be underestimated(Reference Nelson, Atkinson and Darbyshire6). When using computers to present visual images of foods, adults reported greater preference for multiple food images on one screen over successive presentations of various portion sizes(Reference Subar, Crafts and Zimmerman7). Statistical research has estimated that validity coefficients of 0·9 or higher are needed to minimize misclassification error, which inhibits our ability to detect relationships with other variables or change from interventions(Reference De Moor, Baranowski and Cullen8).
Screen images of foods also show promise for accurate portion size assessment among children. Among children aged 9–19 years, four photographs of successively larger portions led to 60 % correct portion size selections(Reference Lillegaard, Overby and Andersen9). It is possible that such food images could be so discrepant from actual that children would estimate too little (e.g. from small pictures) or too much (e.g. from large pictures). This raises the question of the optimal size of images on the screen. The food portion images in one computerized program took only about one-ninth (or less) of the screen(Reference Subar, Crafts and Zimmerman7). While selection from multiple images at a time is more efficient, how this size impacts the accuracy of portion size estimation for children is not known. Perceived size is likely a complex function of proximity of the image to the eye, the presence or absence of cues (i.e. fiducial markers) against which to check size, and the size of the image on the screen. As a result there were three research questions for the present study:
1. Does the size of picture (one-ninth of screen (method 1) v. whole screen (method 2)) influence the accuracy of estimation of portion size of foods of known size?
2. Do size cues (constant utensils and checked tablecloth v. no utensils or tablecloth) influence the accuracy of portion size estimation with pictures?
3. What size of image on the screen (e.g. 70 % of real) best represents the size of that food, controlling for proximity of the eye and stable cues?
Based on cognitive information processing(Reference Baranowski and Domel10), it was hypothesized that larger pictures (close to the size of the actual foods) would facilitate more accurate estimates of portion size and that the presence of image size cues would enhance accuracy, especially with the smaller pictures.
Experimental methods
Design
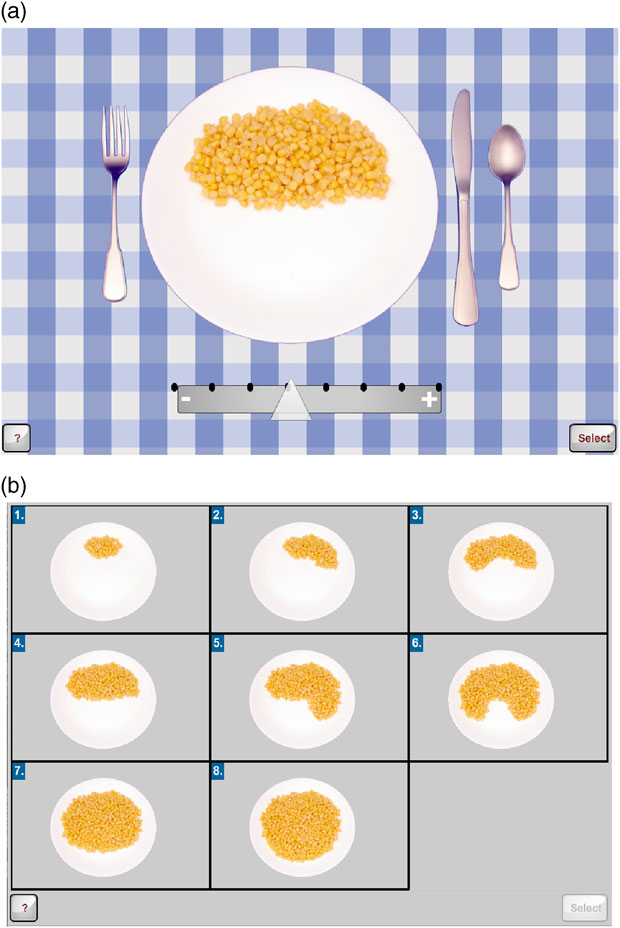
The study used an experimental design, balanced on food size cues group, gender (male/female) and age (8–13 years old). Diverse ages were used to test if there was an age at which children could not accurately and speedily conduct this task. Half the children were randomly assigned to seeing pictures with the size cues (see Fig. 1a) and half to the pictures without the size cues (see Fig. 1b). Children estimated the size of sixteen pre-specified food models twice. One time they completed the task with the larger pictures (see Fig. 1a) and one time with the smaller pictures (see Fig. 1b). To minimize an effect from fatigue, the presentation of the two tasks was randomly ordered.
Representative images of size of image on screen and presence of size cues: (a) large picture with food size cues; (b) small pictures without food size cues
The sixteen foods, the number of images and the size of the model for each food are identified in Table 1. These foods were chosen because they are commonly consumed by children in this age range, as determined from the National Health and Nutrition Examination Survey (NHANES) database(Reference Dave, Evans and Saunders11). These foods also represented different types of image on the screen (e.g. distinct units, amorphous mounds, liquids in containers) which could influence ability to accurately estimate portion size. The portion sizes in the images were based on either standard item sizes defined in the Food and Nutrient Database for Dietary Studies (Food Survey Research Group, Agricultural Research Service, Beltsville, MD, USA) or percentiles of intake from NHANES 2003–2004 (from 5th to 95th percentile). To ensure consistent size across sessions and minimize problems of spoiling and shape distortion, the foods were presented to the child by realistic food models (Nasco, Fort Atkinson, WI, USA). Since this was a food portion size perception task (i.e. to determine if the children can correctly estimate the size of a food in front of them without error introduced by memory factors)(Reference Baranowski and Domel10, Reference Foster, O’Keeffe and Matthews12), the plate, bowl or glass with the food model was placed right next to the keyboard (just to the left of the child for right-handed children or just to the right for left-handed children). The sequence of the sixteen foods within each task was randomly ordered by the computer. Some of these selections required a two-step process: (i) selection of the initial size of the container or item; and (ii) selection of the actual portion shown. For example, for banana the child first selected the size of the banana (small, medium, large) and then the amount of that size (![]() , whole). To determine if liking or more frequently eating a food enabled the child to better report the portion of that food, each child was asked to rate their preference and how frequently they consumed each of the sixteen foods. A project staff person was present throughout the task to present the food model, ensure completion and facilitate problem-solving if something malfunctioned. To minimize influence of the staff person and to simulate what a computerized recall might do, a ‘help menu’ was created to provide strategic information at each point in the process and was activated by clicking on a ‘help’ button. At the completion of each of the two tasks the staff person asked the child questions about program preferences and ease of use.
, whole). To determine if liking or more frequently eating a food enabled the child to better report the portion of that food, each child was asked to rate their preference and how frequently they consumed each of the sixteen foods. A project staff person was present throughout the task to present the food model, ensure completion and facilitate problem-solving if something malfunctioned. To minimize influence of the staff person and to simulate what a computerized recall might do, a ‘help menu’ was created to provide strategic information at each point in the process and was activated by clicking on a ‘help’ button. At the completion of each of the two tasks the staff person asked the child questions about program preferences and ease of use.
Foods in each task with the number and size of each food image and size of the food model in italics

Another task was presented to estimate the size on the screen that corresponded to perception of real size. In this task, there was a food image on the screen that corresponded to the food model. The child was asked to use a scroll bar on the right side of the screen to manipulate the size of the whole image (food size cues, tablecloth and food) from 50 % of real to 150 % of real. The child was asked to select the size of the image that directly corresponded to the size of the food model next to them. These foods were presented in random sequence and the initial size of the image on the screen was randomly selected, both by the computer.
Study sample
Children were included if they were: (i) between the ages of 8 and 13 years; (ii) able to speak English; (iii) able to read or answer questions; and (iv) did not have a physical, mental and/or visual limitation that would inhibit their ability to recall diet or use a computer. Children and their parents were recruited through the participant database of the Children’s Nutrition Research Center (CNRC), by the center’s recruiter. Families with eligible 8- to 13-year-old children, who previously indicated an interest in being contacted for studies, were identified and contacted. If they expressed interest, they were screened for inclusionary/exclusionary criteria. If they met the inclusionary criteria, they were scheduled for a visit. All data collection was completed at the CNRC in Houston, Texas. Baylor College of Medicine’s Institutional Review Board approved the study. Parents signed informed consent and all children provided verbal assent. Twenty-five dollars was provided the child for participation.
Measures
The primary variables of interest were correspondence of the size of the food image on the screen to the size of the food model (correct, over- or underestimated) and time to select the image size. The computer program recorded these variables. The percentage of correct estimation was the percentage of foods for which the child selected the right image size; underestimated was the percentage of images selected that were smaller than the correct size; and overestimated was the percentage of images selected that were larger than the correct size. The time spent utilizing the ‘help menu’ was also collected and subtracted from the time spent for any foods invoking the ‘help menu’. Aggregated child data were created by: (i) computing the percentage of the sixteen foods correctly sized by a child (0–100 %); and (ii) summing the times spent on all sixteen foods (excluding time spent with ‘help’). The cola beverage was only used in method 2 and was excluded from the aggregated data.
To answer the third research question, the size of the food item on the computer screen relative to the size of the food model on the plate/bowl was recorded as a percentage of actual size (50 % to 150 %). An aggregated percentage of food sizes was obtained by averaging the mean percentage across foods for each child.
Parent-completed information
Parents completed a family demographic questionnaire, which included their child’s status on medical conditions and medications, household membership and household socio-economic status, prior to beginning the study.
Anthropometrics
Trained and certified research staff used standardized protocols(Reference Lohman, Roche and Martorell13). Weight was measured twice using a model Alpha 882 scale from SECA Corporation (Hanover, MD, USA) and the two measurements averaged. Height was measured twice using a PE-AIM-101 stadiometer from Perspective Enterprises (Portage, MI, USA) and the two measurements averaged. BMI percentile was calculated with the Centers for Disease Control and Prevention (Atlanta, GA, USA) computerized program using the averaged height and weight measurements(Reference Kuczmarski, Ogden and Guo14). All children used a fixed standard-height chair and computer stand, and the computer’s position was standardized on the computer stand to control for differences in the distance from the child’s eyes to the screen. The child’s seated height was measured using a free-standing sitting/standing height stadiometer (custom-made for the study by Prospective Enterprises), according to a standard protocol.
Data analysis
Multivariate analyses were used to investigate differences between methods (within-person factor) and interface designs (between-person factor). Level one analyses (aggregated by person) included two models (a) unadjusted and (b) adjusted for age, gender, race/ethnicity, adiposity index and highest level of household education. Model 1 (dependent variable: percentage of correctly sized foods) and Model 2 (dependent variable: time spent in program) utilized a multivariate analysis of variance model (MANOVA). Model 3 (dependent variable: percentage incorrect) utilized a doubly MANOVA model with two within factors (cues/no cues, percentage overestimation, percentage underestimation). All models included interaction terms with each covariate to determine if the covariate moderated any differences between methods. Level two analyses included the same series of models to investigate differences between methods and interface at the food level. Therefore, food was included as an additional within-person factor.
A doubly MANOVA was utilized for Model 4 (time). Due to the binary outcome, multivariate analyses with generalized estimating equations were used for Model 5 (percentage overestimation, percentage underestimation). Similar to level one, models included interaction terms with covariates. An additional adjustment to the model was made to determine whether food preference or frequency of consumption was associated with the timing or the sizing of the food items.
A univariate ANOVA was used to investigate differences between interface designs. Similar to analyses for the primary aims, Model 6 was (a) unadjusted and (b) adjusted for covariates.
Results
Sample characteristics
One hundred and twenty children participated. The sample was constrained to have equal numbers of children by interface design (food size cues v. no cues), gender and age (see Table 2). There were more white (36·7 %) and Hispanic (37·5 %) children than African-Americans (17·5 %) or other (8·3 %); more from households with degree level of education (57·5 %); and more who were normal weight (63·3 %). There were no differences in these characteristics by interface design group.
Participant characteristics by study group: volunteer multi-ethnic children (n 120), equally distributed by gender and ages (8 to 13 years), 2008–2009

Main outcomes
A simple ANOVA with the percentage of correctly sized foods as the dependent variable, with interface design (size cues v. no cues), display method (small v. large pictures) and their interaction as factors, revealed no significant effects. Incorporating gender, race/ethnicity, household education, age, BMI, their two-way interactions with interface design and display method, and their three-way interactions with interface design by display method as factors also revealed no significant effects at P ≤ 0·05. The average percentage of correctly classified foods across display methods and interface design was 60·3 % (sd 12·6 %).
The same simple ANOVA with total time spent estimating portion size as the dependent variable revealed a main effect only for display method (P ≤ 0·000), with multiple smaller pictures on the screen taking less time (mean 2·8 (sd 0·7) min) than one larger picture on the screen (mean 4·4 (sd 1·4) min). Incorporating all the other variables into the model left this single main effect and added no others.
Percentage over- and underestimated
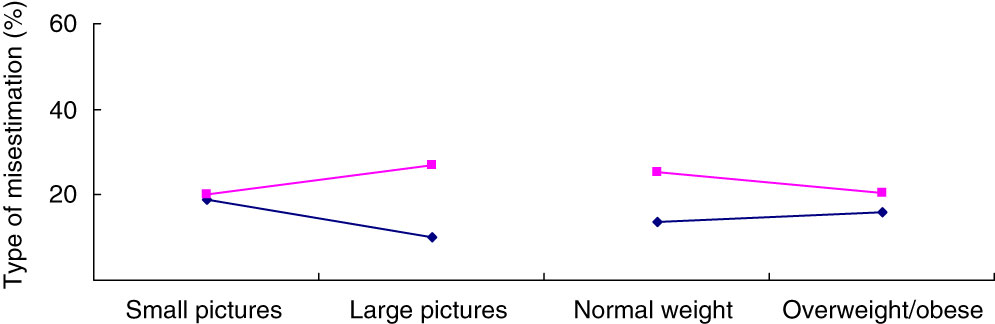
The simple doubly multivariate analysis of percentage of foods that were overestimated or underestimated revealed a significant (P ≤ 0·000) main effect for type and a method-by-type interaction term (P ≤ 0·000). Controlling for demographic characteristics and BMI did not change the type main effect (P ≤ 0·002) or the method-by-type interaction (P ≤ 0·000), but also revealed a significant type-by-BMI effect (P ≤ 0·006), as presented in Fig. 2. There was substantial convergence in over- and underestimation with the small pictures for both BMI groups, but substantial divergence with large pictures. There was more overestimation with the larger pictures. There was a convergence of over- and under-reporting among the overweight and obese (Fig. 2).
Percentage of underestimation (—⧫—) and overestimation (—▪—) of portion size by display method (small picture, large picture) and BMI among volunteer multi-ethnic children (n 120), equally distributed by gender and ages (8 to 13 years), 2008–2009
Analyses by foods
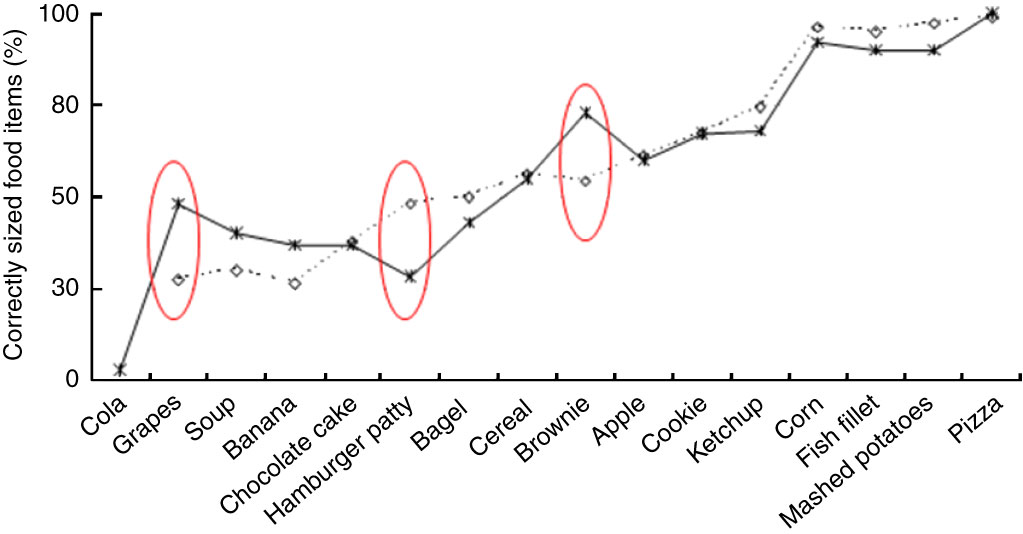
Differences were detected in the simple multivariate analysis in the percentage of correctly sized across foods and a method-by-food interaction (P ≤ 0·000), which did not change when controlling for the demographic variables and BMI (P ≤ 0·003). No additional significant effects were detected in the latter model. The percentage correct for each food item by small or large pictures is depicted in Fig. 3. For some foods the larger pictures led to more accurate estimation of portion size while the smaller pictures were more accurate for other foods. The differences were statistically significantly different for grapes, hamburger patty and brownie.
Percentage of correctly sized food items by display method (- -![]() - -, small images; —
- -, small images; — ![]() —, large images) among volunteer multi-ethnic children (n 120), equally distributed by gender and ages (8 to 13 years), 2008–2009
—, large images) among volunteer multi-ethnic children (n 120), equally distributed by gender and ages (8 to 13 years), 2008–2009
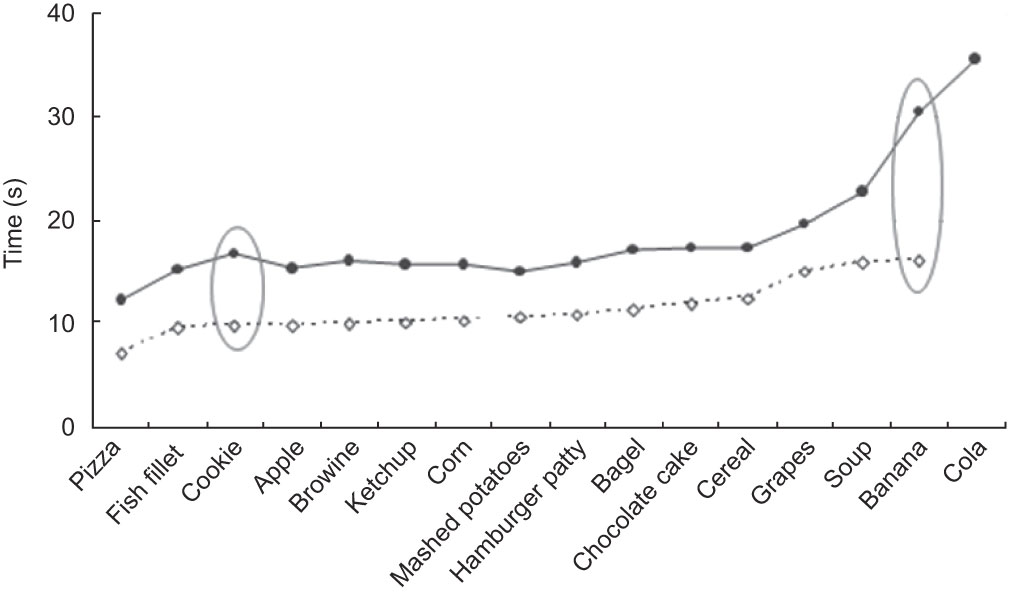
Differences were detected in the simple doubly multivariate model in amount of time used to match foods (food main effect; P ≤ 0·000) and a method-by-food interaction (P ≤ 0·000), which did not change when controlling for the demographic variables and BMI. No other significant effects were detected in the latter model. It took more time to report the size of the larger pictures, most likely due to the necessary scrolling (Fig. 4).
Time (in seconds) for reporting size of food items by display method (- -![]() - -, small images; —⧫—, large images) among volunteer multi-ethnic children (n 120), equally distributed by gender and ages (8 to 13 years), 2008–2009
- -, small images; —⧫—, large images) among volunteer multi-ethnic children (n 120), equally distributed by gender and ages (8 to 13 years), 2008–2009
Size of picture on screen
The simple ANOVA on average perceived size of food on the screen revealed no significant effect for interface design. Entering the demographic characteristics and BMI and the demographics-by-interface-design interaction term revealed a significant gender effect (P < 0·015). When the individual foods were included in a repeated-measures design, the model revealed significant differences across foods (P < 0·000), by gender (P < 0·013 as reported above) and a food-by-interface-by-BMI interaction (P ≤ 0·015; Fig. 5).
Percentage of perceived size for food items by interface design (—•—, food size cues; - -![]() - -, no food size cues) among volunteer multi-ethnic children (n 120), equally distributed by gender and ages (8 to 13 years), 2008–2009
- -, no food size cues) among volunteer multi-ethnic children (n 120), equally distributed by gender and ages (8 to 13 years), 2008–2009

Child seated height was highly significantly bivariately correlated with age (Pearson r = 0·82, P < 0·000), significantly correlated with percentage of foods correctly classified by larger pictures (r = 0·20, P ≤ 0·03) and smaller pictures (r = 0·24, P ≤ 0·009), but not significantly related to total time to complete method 1 or 2 or to percentage of under- or overestimation for either method. When seated height was centred and added to all the models, the results remained nearly unchanged.
Analysis of semi-qualitative data revealed that just over 40 % of children preferred each size picture: those who preferred the larger pictures did so because it was easier to compare to the food model, but those who liked smaller pictures was because it was easier to make a choice. Most thought it was very easy (43·3 %) or a little easy (42·5 %) to find the picture that best matched the food model.
Discussion
Correct classification of foods using images was 60·3 %. This is similar to the 60 % reported among 9- to 19-year-olds using four pictures(Reference Lillegaard, Overby and Andersen9). Different measures of agreement precluded comparisons across studies. With regard to the first two research questions, no differences in accuracy were detected by either design feature. We found more overestimation with larger images, and about equal over- and underestimation with the multiple smaller images on the screen. Children elsewhere have been found to more likely overestimate in general (e.g. by 46 %(Reference Foster, Matthews and Nelson15), 0–142 %(Reference Lillegaard, Overby and Andersen9)). In contrast to the existing literature on under-reporting of total energy by the obese(Reference Livingstone and Black16), the overweight/obese were less likely to overestimate portion size than normal-weight children. Thus under-reporting of total energy intake does not appear to be due to under-reporting of portion size.
Statistically significant differences in accuracy of size categorization between small and large pictures were obtained for grapes (large pictures more likely to be correct), hamburger patty (small pictures more likely to be correct) and brownie (larger pictures more likely to be correct). The high accuracy for size categorization of pizza was likely due to having pictures of only two servings on the screen. However, high accuracy was also obtained for corn (eight image sizes), fish fillet (four image sizes) and mashed potatoes (eight image sizes), which had many more sizes of image. None of the manipulations in the present study appeared to enhance accuracy. Further research is needed on other manipulations to increase accuracy of report of portion size beyond 60·3 %.
Substantially less time was taken to classify foods using the smaller, rather than the larger pictures, with no differences in accuracy detected. Less time was likely due to children not having to scroll across pictures and greater ease in making perceptual equivalence relationships when all possibilities were on the screens. This suggests that multiple small pictures on the screen at the same time is the preferred method for a computerized 24hDR for children, similar to the findings among adults(Reference Subar, Crafts and Zimmerman7).
Regarding research question three, the average size of the image on the screen was 83 % of actual, ranging from 76·1 % for a cookie to 93·7 % for the hamburger patty with no systematic difference by food size cues. We have seen no report of percentage size for images on screen in the literature.
There was no evidence that the younger children in this age range (8–13 years) were any less accurate or took more time to select the picture sizes, suggesting that the pictures levelled the playing field among younger children who might have difficulties with food category placements(Reference Baranowski, Beltran and Martin3). No age-related differences in accuracy were reported in other studies(Reference Lillegaard, Overby and Andersen9, Reference Foster, O’Keeffe and Matthews12, Reference Foster, Matthews and Nelson15). No significant differences in accuracy or time were detected by gender, similar to other studies(Reference Steyn, Senekal and Norris17).
The strengths of the current study include a reasonably large multi-ethnic sample of boys and girls, and controlling for several possible confounding variables. While the food images in this research should have reasonably corresponded to the size of the food models, future research may benefit from attention to child-specific portion sizes(Reference Foster, Matthews and Nelson15).
Conclusions
Multiple small food pictures on the screen at the same time decreased the time needed to make size judgements with no diminution in accuracy. Thus, multiple small pictures appear to be the preferred method. Further research is needed to identify methods that enhance children’s accuracy of report of portion size beyond 60·3 % to minimize misclassification bias in the future.
Acknowledgements
Sources of funding: This research was funded primarily by a grant from the National Cancer Institute (5 U01 CA130762-02). This work is also a publication of the United States Department of Agriculture/Agricultural Research Service (USDA/ARS) Children’s Nutrition Research Center, Department of Pediatrics, Baylor College of Medicine, Houston, Texas, and has been funded in part with federal funds from the USDA/ARS under Cooperative Agreement No. 58-6250-6001. The contents of this publication do not necessarily reflect the views or policies of the USDA, nor does mention of trade names, commercial products or organizations imply endorsement from the US government. Conflicts of interest: There are no conflicts of interest. Author contributions: T.B. conceived the study, secured the funding and wrote a first draft. J.C.B. managed the conduct of the study. K.B.W. conducted all the analyses. S.M. managed the staff and coding of all comments. N.I. contributed to the design of the study, H.D. and S.A. took the pictures, conducted beta testing of the program and collected the data. K.C. and D.T. contributed to the design of the study; D.T. trained for qualitative data collection skills. R.B. did the programming. A.S. discussed concepts and critically reviewed drafts of the design and methods of the study, and critically reviewed drafts of the manuscript. All co-authors reviewed and critiqued multiple drafts of the manuscripts.


