





Iodine is an exogenous essential micronutrient and a necessary component of thyroid hormones. As a result, iodine deficiency disorders are one of the most common micronutrient deficiencies at all life stages, with potentially irreversible consequences during pregnancy and for fetal and newborn health. While global recommendations for universal salt iodisation and fortification have contributed to reductions in iodine deficiency and iodine deficiency disorder, 35–45 % of the world’s population is still at risk(Reference Hatch-McChesney and Lieberman1). Iodine insufficiency may impair thyroid hormone production, leading to iodine deficiency disorders such as goitre, hypothyroidism and cognitive impairments, while excess iodine intake can also disrupt thyroid function, potentially resulting in hyperthyroidism or autoimmune thyroiditis(2).
The WHO currently recommends urinary iodine concentration (UIC) as the gold standard marker of recent dietary iodine intake(3). Spot UIC is a highly variable measure of recent intake and is used to assess population iodine status, while it cannot be used to assess individual intake because of large intra- and interindividual variation(Reference Ma and Skeaff4). While iodine content in a 24 h urine sample may be more reliable, it is associated with high respondent burden and is often not feasible in population surveys(Reference König, Andersson and Hotz5). As a result, general practice is to use median population levels from spot urine collections, and median UIC (mUIC) cutoff ranges exist for pregnant and non-pregnant women populations 15–49 years of age(2,Reference Rohner, Zimmermann and Jooste6) .
Thyroglobulin (Tg) is a scaffold protein in which thyroid hormones are synthesised and can be a measure of iodine status in all populations and among those with iodine deficiency and excess intake(Reference Ma, Venn and Manning7–Reference Zimmermann, Aeberli and Andersson10). Small amounts of Tg are released into circulation in iodine sufficiency and exhibit a U-shaped relationship with iodine intake. Tg levels increase in iodine deficiency due to thyroid-stimulating hormone hyperstimulation and thyroid hyperplasia(Reference Ma and Skeaff4). Excess iodine can inhibit Tg proteolysis, but persistent intake can then increase Tg since the thyroid gland fails to escape from the Wolff–Chaikoff effect(Reference Ma and Skeaff4). As a result, studies have indicated that Tg can be considered a biomarker for population iodine status and is a useful measure in iodine deficiency and excess(Reference Pearce and Caldwell11).
Median Tg (mTg) levels for iodine sufficiency were initially reported by the WHO but removed due to lack of or limited evidence(Reference Mullan, McMullan and Kayes9,12) . Currently, Tg concentrations associated with iodine status only exist for school-aged children because the current WHO biomarker guidance was developed with the premise of capturing whether a population group of school-age children is iodine-deficient or not(Reference Grossklaus, Liesenkötter and Doubek13–Reference Zimmermann, de Benoist and Corigliano15). However, there are no established Tg concentrations that correspond to published WHO mUIC thresholds for population iodine status, including deficiency and excess, which are necessary for population-level iodine status monitoring.
At a global scale, twenty-one countries had insufficient iodine intake in 2020 based on national or subnational surveys among women of reproductive age, school-aged children, adolescents and adults(Reference Zimmermann and Andersson14). The Sistema de Vigilancia Epidemiológica de Salud y Nutrición (Epidemiological Health and Nutrition Surveillance System, SIVESNU) data indicate that 79·6 and 22·1 % of women reported consuming foods prepared with coarse and refined salt, respectively, the day before the survey in 2017. In addition, mUIC was 145 μg/l among non-pregnant women, indicating population-level adequacy(16). Moreover, in assessing a country’s iodine status, it is recommended that school-age children be used as a proxy for the general population, but there are concerns that the national data in Guatemala may not reflect subnational differences or iodine status among specific subgroups of interest, such as women aged 15–49 years(Reference Brenta, Gomez and del Carmen Silva17,Reference Mioto, Gomes and de Camargo18) .
The objective of this analysis is to examine Tg levels that correspond to the current WHO published thresholds for mUIC population iodine status, using national data from non-pregnant Guatemalan women aged 15–49 years.
Study methods
Data source
Data from this study came from the SIVESNU surveillance system, which is a complex design, nationally representative, cross-sectional, continuous household survey conducted approximately annually in Guatemala since 2013. SIVESNU uses a multistage sampling approach to capture data on several health and nutrition topics, including UIC, and in 2018/2019, it also assessed Tg, among women aged 15–49 years. Detailed information on the SIVESNU surveillance system, study area, study population and sampling strategy can be found elsewhere(Reference Palmieri, Flores-Ayala and Mesarina19). In 2018–2019, thirty households were randomly selected from each of the 100 eligible clusters, and one non-pregnant woman aged 15–49 years from each household was randomly selected to participate. There was no replacement of clusters, households or selected individuals within the households for any reason(Reference Palmieri, Flores-Ayala and Mesarina19). Questionnaire, anthropometry data, blood and urine biospecimen collections occurred at the same visit for the majority of the women sampled. In isolated cases where only questionnaire data were collected, enumerators returned to the household for blood and urine sample collection at a later date, usually within 2 d of working in each cluster.
Questionnaire data collection
Data were collected using a household questionnaire and women aged 15–49 years. Trained enumerators administered the surveys in Spanish or in a local indigenous language, via an interpreter, using validated instruments. The women’s survey included questions about health status, physical activity, reproductive history and dietary diversity, among other topics. Further information on data collection for the 2018–2019 survey cycles can be found online at the Informe del Sistema de Vigilancia Epidemiológica de Salud y Nutrición (SIVESNU) (https://www.siinsan.gob.gt/siinsan/monitoreo-y-evaluacion/#).
Informed consent
The Guatemalan Ministry of Health Institutional Review Board approved the 2018–2019 SIVESNU cycle. Adults provided written informed consent prior to participating in the survey. A de-identified dataset was used for analytical purposes.
Blood sampling
Venous blood samples (approximately 500 μl) were collected to assess serum Tg (ng/ml) using electrochemiluminescence immunoassay, Cobas E411 analyser (Roche Diagnostics International Ltd). Measurement range for serum Tg was 0·04–500 ng/ml, with a limit of detection of 0·04 ng/ml. After field collection in 2017–18, the residual serum specimen was stored at −70°C until funds became available for laboratory analyses in May 2021.
Urine sampling
Urine was collected from women to assess UIC. Each woman was given a sterile wide-mouth cup to provide a small amount of urine (approximately 6 ml). Specimens were transferred to plastic tubes and stored in the field in cold boxes within clusters and later transported to the Institute of Nutrition of Central America and Panama (Instituto de Nutrición de Centroamérica y Panamá) laboratory in Guatemala City and refrigerated at 2–8°C until they were processed using the standard ammonium persulfate method(Reference Pino, Fang and Braverman20). After collection, urine specimens were transported to the Institute of Nutrition of Central America and Panama (Instituto de Nutrición de Centroamérica y Panamá) at the end of each round (3 weeks of field work) in the 2017–2018 survey cycle, with laboratory processing occurring at a later subject to the availability of funds.
Statistical methods
The analysis was restricted to non-pregnant women aged 15–49 years with both Tg and UIC measurements. All analyses were conducted in SAS (SAS Institute) and R (R Foundation for Statistical Computing). Descriptive statistics were presented as unweighted means, medians and percentages, and mTg and UIC were calculated by participant characteristics. Bivariate analyses and visual median scatter plot analyses were used to examine the monotonic relationships between Tg and UIC. Spearman correlations between Tg and UIC at the individual and population cluster levels were used to assess the strength of bivariate relations.
Analytic construct
To address challenges with the wide variability of urinary iodine concentration and Tg levels, we used a statistical approach that is based on the median, the most stable statistic of the analyte distribution(Reference Chen, Gao and Guo21).
We adopted methods in combinatorics to generate population sub-clusters, and permutation sampling to calculate population k-cluster medians of UIC and Tg that correspond to the WHO definition’s for mUIC (insufficiency (<100 μg/l), adequacy (100–199 μg/l), above adequate (200–299 μg/l) and excess (>300 μg/l))(3,Reference Hartigan and Wong22–Reference Armitage24) . This k-medians approach facilitates population-cluster analyses of Tg and UIC, rather than extrapolation at the individual level, and aligns with current WHO iodine guidance(2). In addition, K-median (cluster median) is robust to outlaying concentrations, so limits of detection or out-of-range values were not of concern and not excluded. Bootstrap sampling was used to generate finite population stratified unrestricted random samples from the original data of Guatemalan women(Reference Armitage24). The analytic inclusion criteria were women with non-missing age, UIC and Tg values. Age of the women was categorised into 15–19, 20–29, 30–40 and 40–49 years, while mUIC was categorised into the four WHO cutoffs, which resulted in 4 × 4(16) combinations; each had equal probabilities, with no specific order of selection within the sixteen finite and independent occurrences. These two classifier variables served as the strata for our stratified unrestricted random samples with replacement, which ensured that each population cluster would have women of age and UIC groupings (and resemble the original population). A total of 500 bootstrap replicates were used. The K-median estimates of UIC by each finite Tg cluster can be summarised as $k - media{n_{Tg\;or\;uic}} = \mathop \sum \nolimits_{j = i}^K \mathop \sum \nolimits_{i =1}^n |{p_i} - {u_j}|$
, where k is the number of population clusters, u
j
is the median vector of the cluster j and p is a vector of instances in the dataset with sample size n
(Reference Godichon-Baggioni and Surendran25).
$k - media{n_{Tg\;or\;uic}} = \mathop \sum \nolimits_{j = i}^K \mathop \sum \nolimits_{i =1}^n |{p_i} - {u_j}|$
, where k is the number of population clusters, u
j
is the median vector of the cluster j and p is a vector of instances in the dataset with sample size n
(Reference Godichon-Baggioni and Surendran25).
Concentration dose–response curve analysis
To identify Tg values predictive of WHO mUIC categories, non-parametric restricted cubic spline modelling, using the k-medians as the unit of analysis, a mUiC and mTg concentration curve function was fit. Ordinary differential equations were then applied to each mUIC–mTg curve function to identify the physiological inflection point value of Tg that is predictive of mUIC inadequacy, adequacy, above adequate and excess. The inflection points represent the curve minimum, denoting an instantaneous change in slope as 2nd-order derivative (ΔmUIC 2 /ΔmTg 2 ) function of mTg. Derived Tg cutoff point estimates and 95 % CI were calculated with bootstrap replication.
Results
Data used in the analyses came from the ninety-six (out of 100) eligible clusters that accepted to participate in the 2018–2019 SIVESNU cycle. A total of 2880 households were identified in the ninety-six enumeration areas, with 2424 households agreeing to participate. Among the 1989 women (both pregnant and non-pregnant) aged 15–49 years who were identified, 1755 women agreed to participate, yielding a response rate of 87·5 %. Of those, 1573 women provided urine samples for UIC assessment, while about half (845 women) provided blood samples for Tg measurement. Our final sample size for this analysis was n 730 non-pregnant women aged 15–49 years with both Tg and UIC measurements. However, our study population did include 116 lactating non-pregnant women.
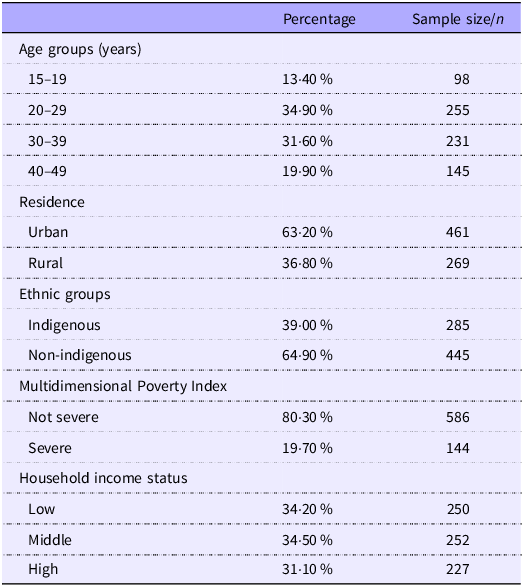
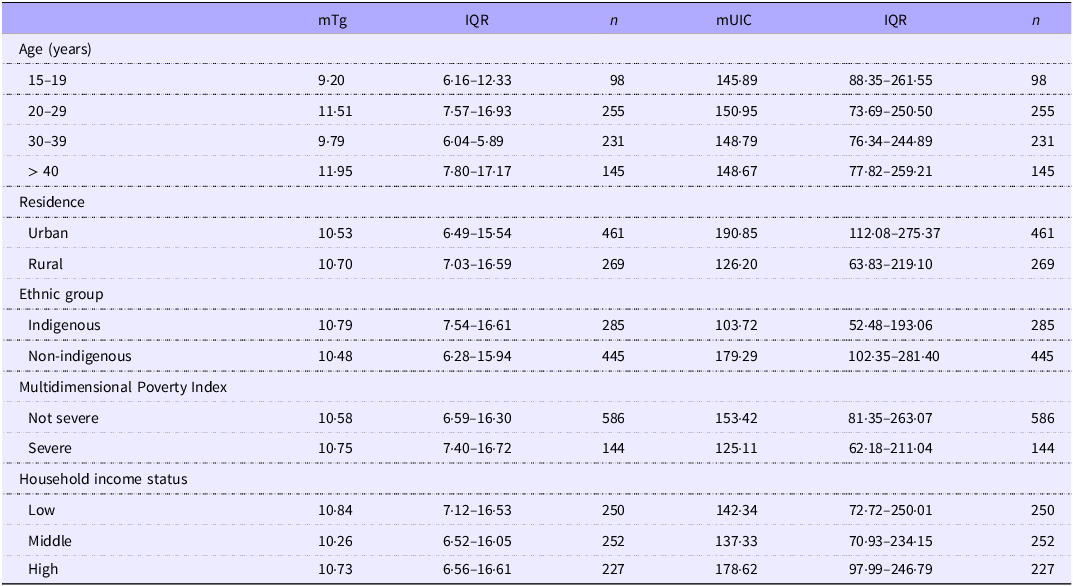
Characteristics of this study population are presented in Table 1. Mean age (sd) was 30·2 (sd 9·3) years. mTg (95 % CI) was 10·37 ng/ml (9·93, 10·84), and mUIC (95 % CI) was 148·72 μg/l (139·09, 161·01) (data not shown). The distribution of mTg and mUIC is presented in Tables 2 and 3 for non-pregnant women aged 15–49 years by sociodemographic characteristics. Women who only provided urine samples and were not included in the analysis (n 942) were comparable to women with both Tg and UIC data available who were included in the analysis (n 730) in terms of mean age, ethnicity, type of residence and socio-economic status.
Descriptive statistics of study population for non-pregnant women aged 15–49 years, Epidemiological Health and Nutrition Surveillance System, 2018–2019, Guatemala

Distribution of median (IQR) thyroglobulin (mTg) and urinary iodine concentrations (mUIC) by sociodemographic characteristics for non-pregnant women aged 15–49 years, Epidemiological Health and Nutrition Surveillance System, 2018–2019, Guatemala

Correlations (r, P-value) between thyroglobulin and WHO median urinary iodine concentration (mUIC) categories among non-pregnant women aged 15–49 years, Epidemiological Health and Nutrition Surveillance System, 2018–2019, Guatemala

* Significant at P < 0·0001.
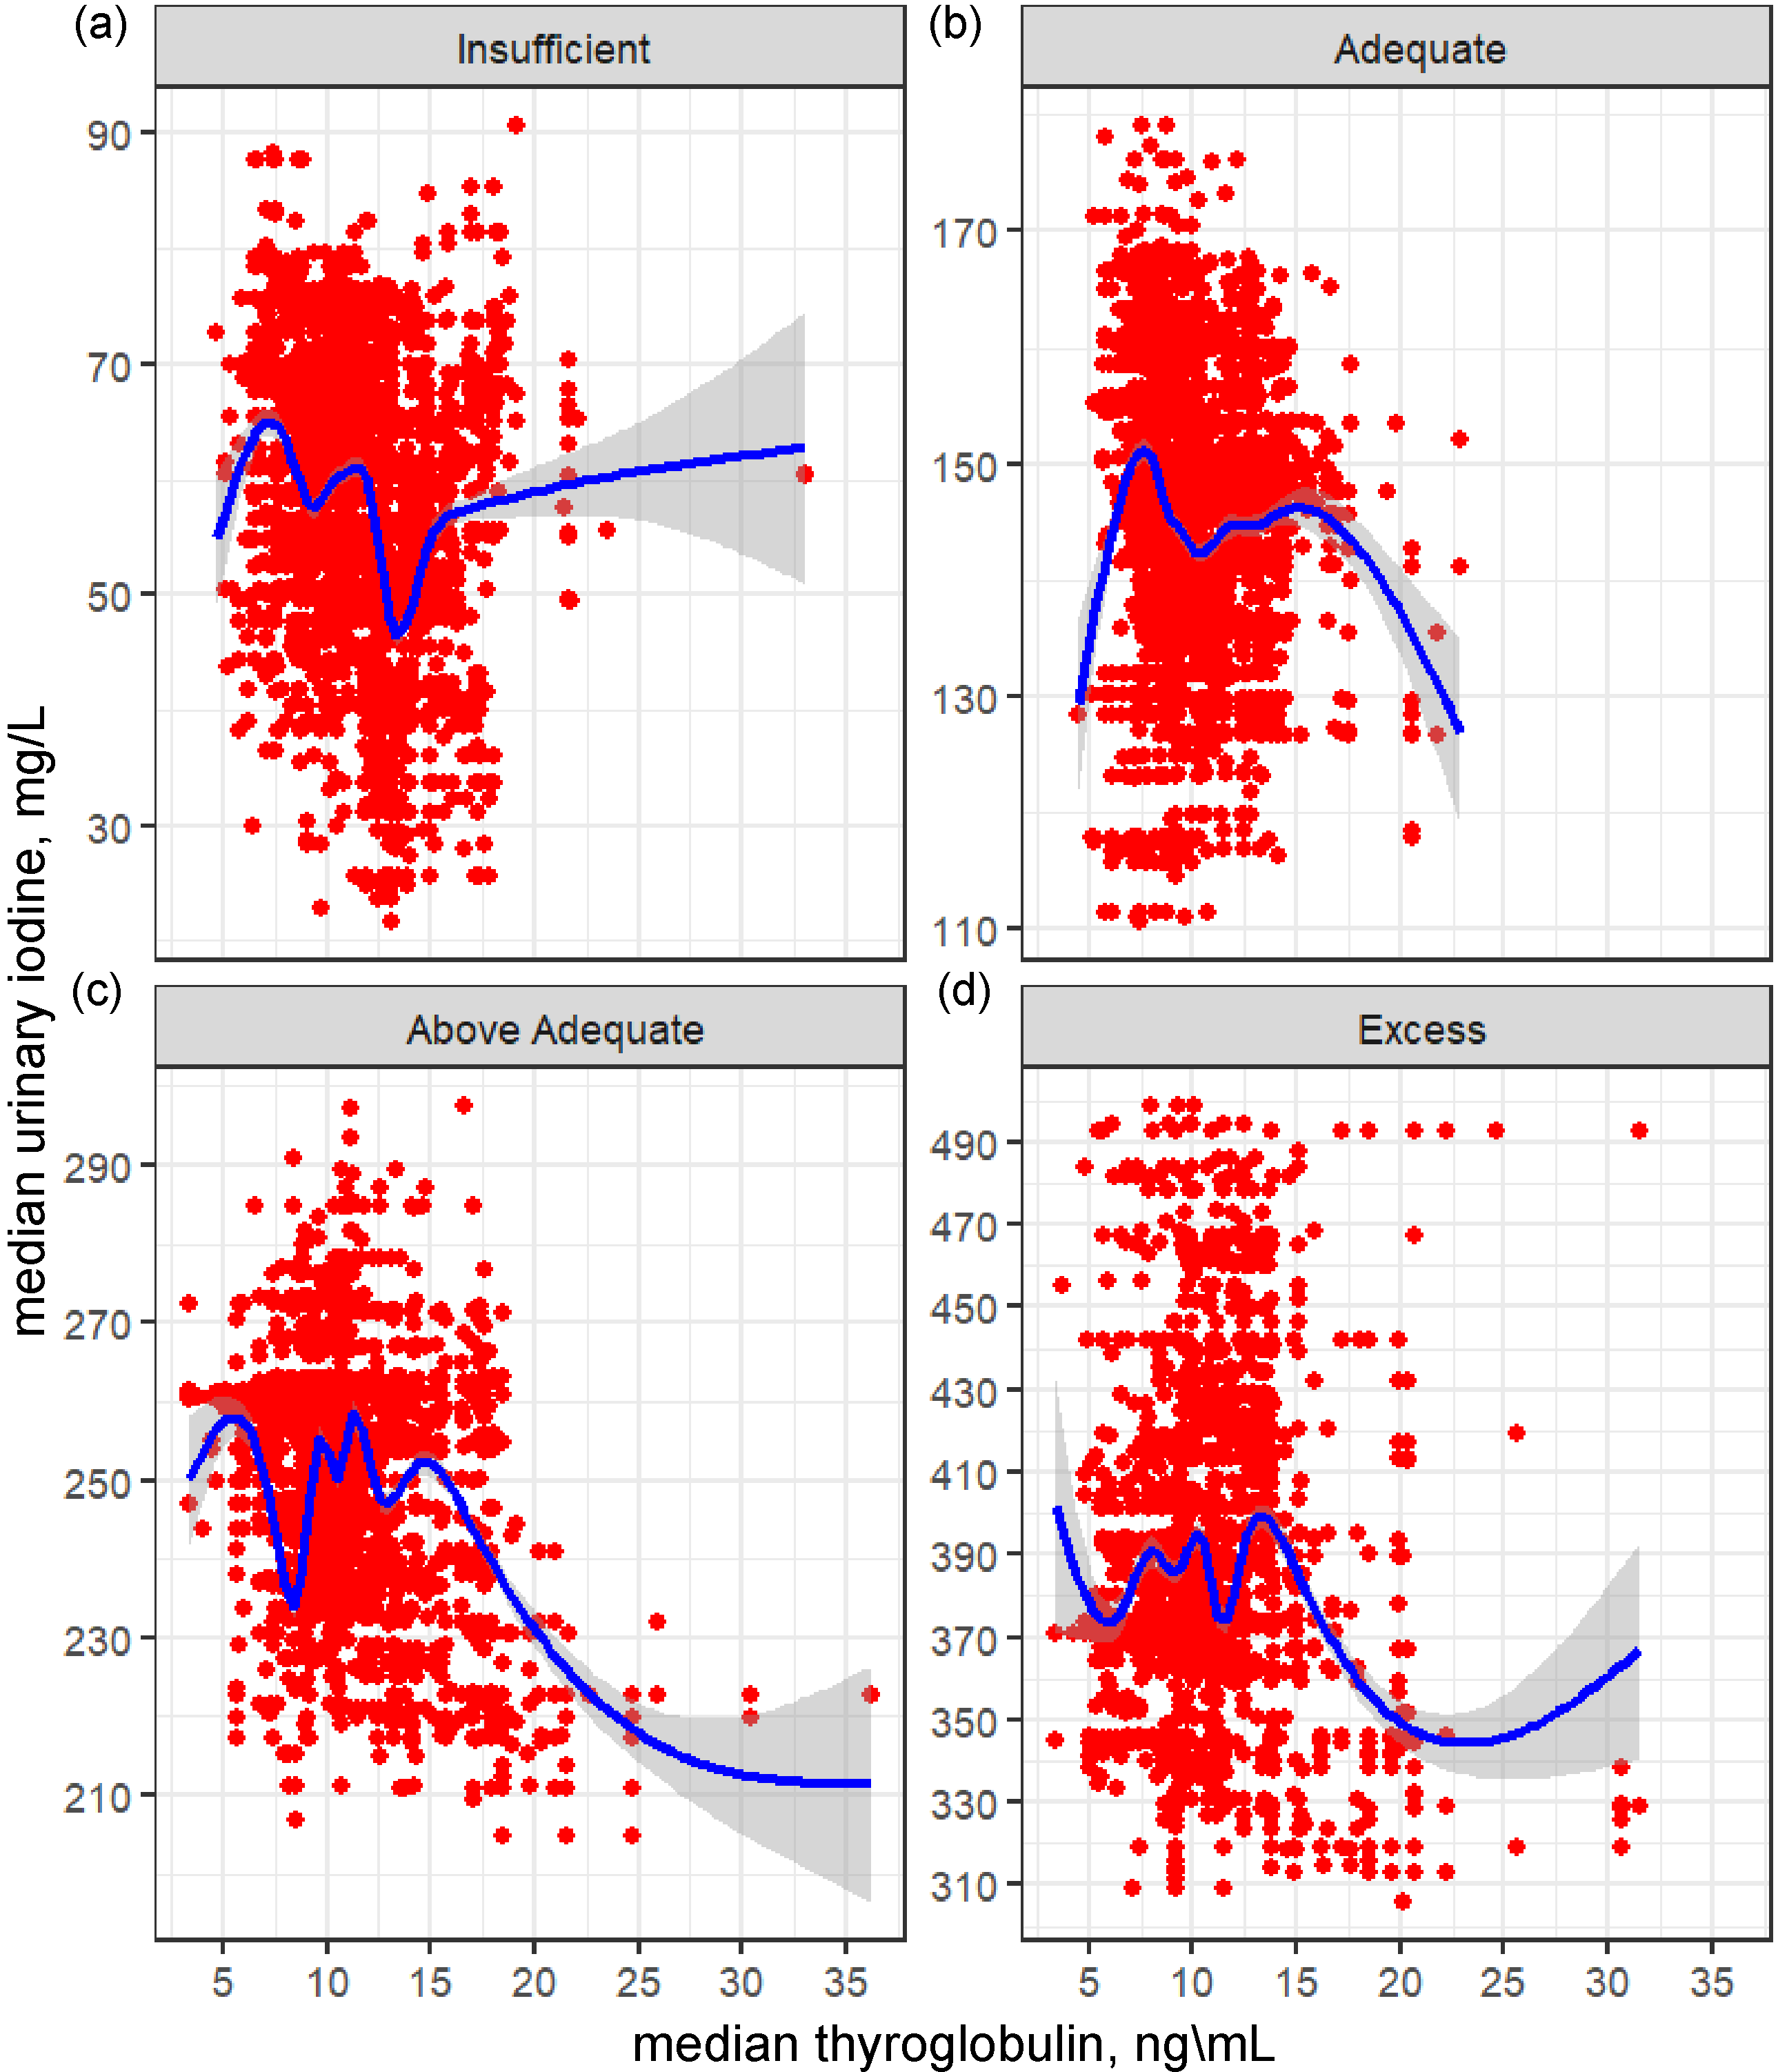
Figure 1 used exploratory data analysis of a scattergram and a median curve overlay to visualise monotonic trends for mTg and mUIC by WHO population mUIC categories(Reference Tukey26). The visual display indicated that within each mUIC category, a non-linear dose–response relationship exists between Tg and mUIC and is characterised by inflections and points of stabilisation. Because exploratory data analysis lack a closed-form equation, a statistical method that fits a curve function was applied to further explore Tg concentration associated with the inflection points. Table 4 presents the individual-level and population-level K-medians correlation between Tg and UIC for all WHO mUIC categories. Correlations were NS at the individual level but were significant (P < 0·0001) at the population level.
Monotonic trends for median thyroglobulin (mTg) and median urinary iodine concentrations (UIC) by WHO population median UIC categories among non-pregnant women aged 15–49 years, Epidemiological Health and Nutrition Surveillance System, 2018–2019, Guatemala. 1Clockwise from top left: (a) UIC insufficient population; (b) UIC adequate population; (c) UIC above adequate population; (d) UIC excess population.

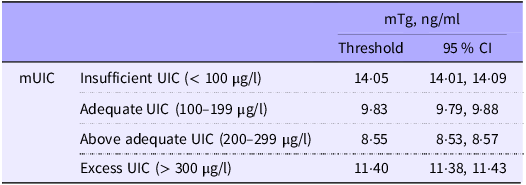
Predictive median thyroglobulin (mTg) corresponding to WHO median urinary iodine concentration (mUIC) population categories among non-pregnant women aged 15–49 years, Epidemiological Health and Nutrition Surveillance System, 2018–2019, Guatemala

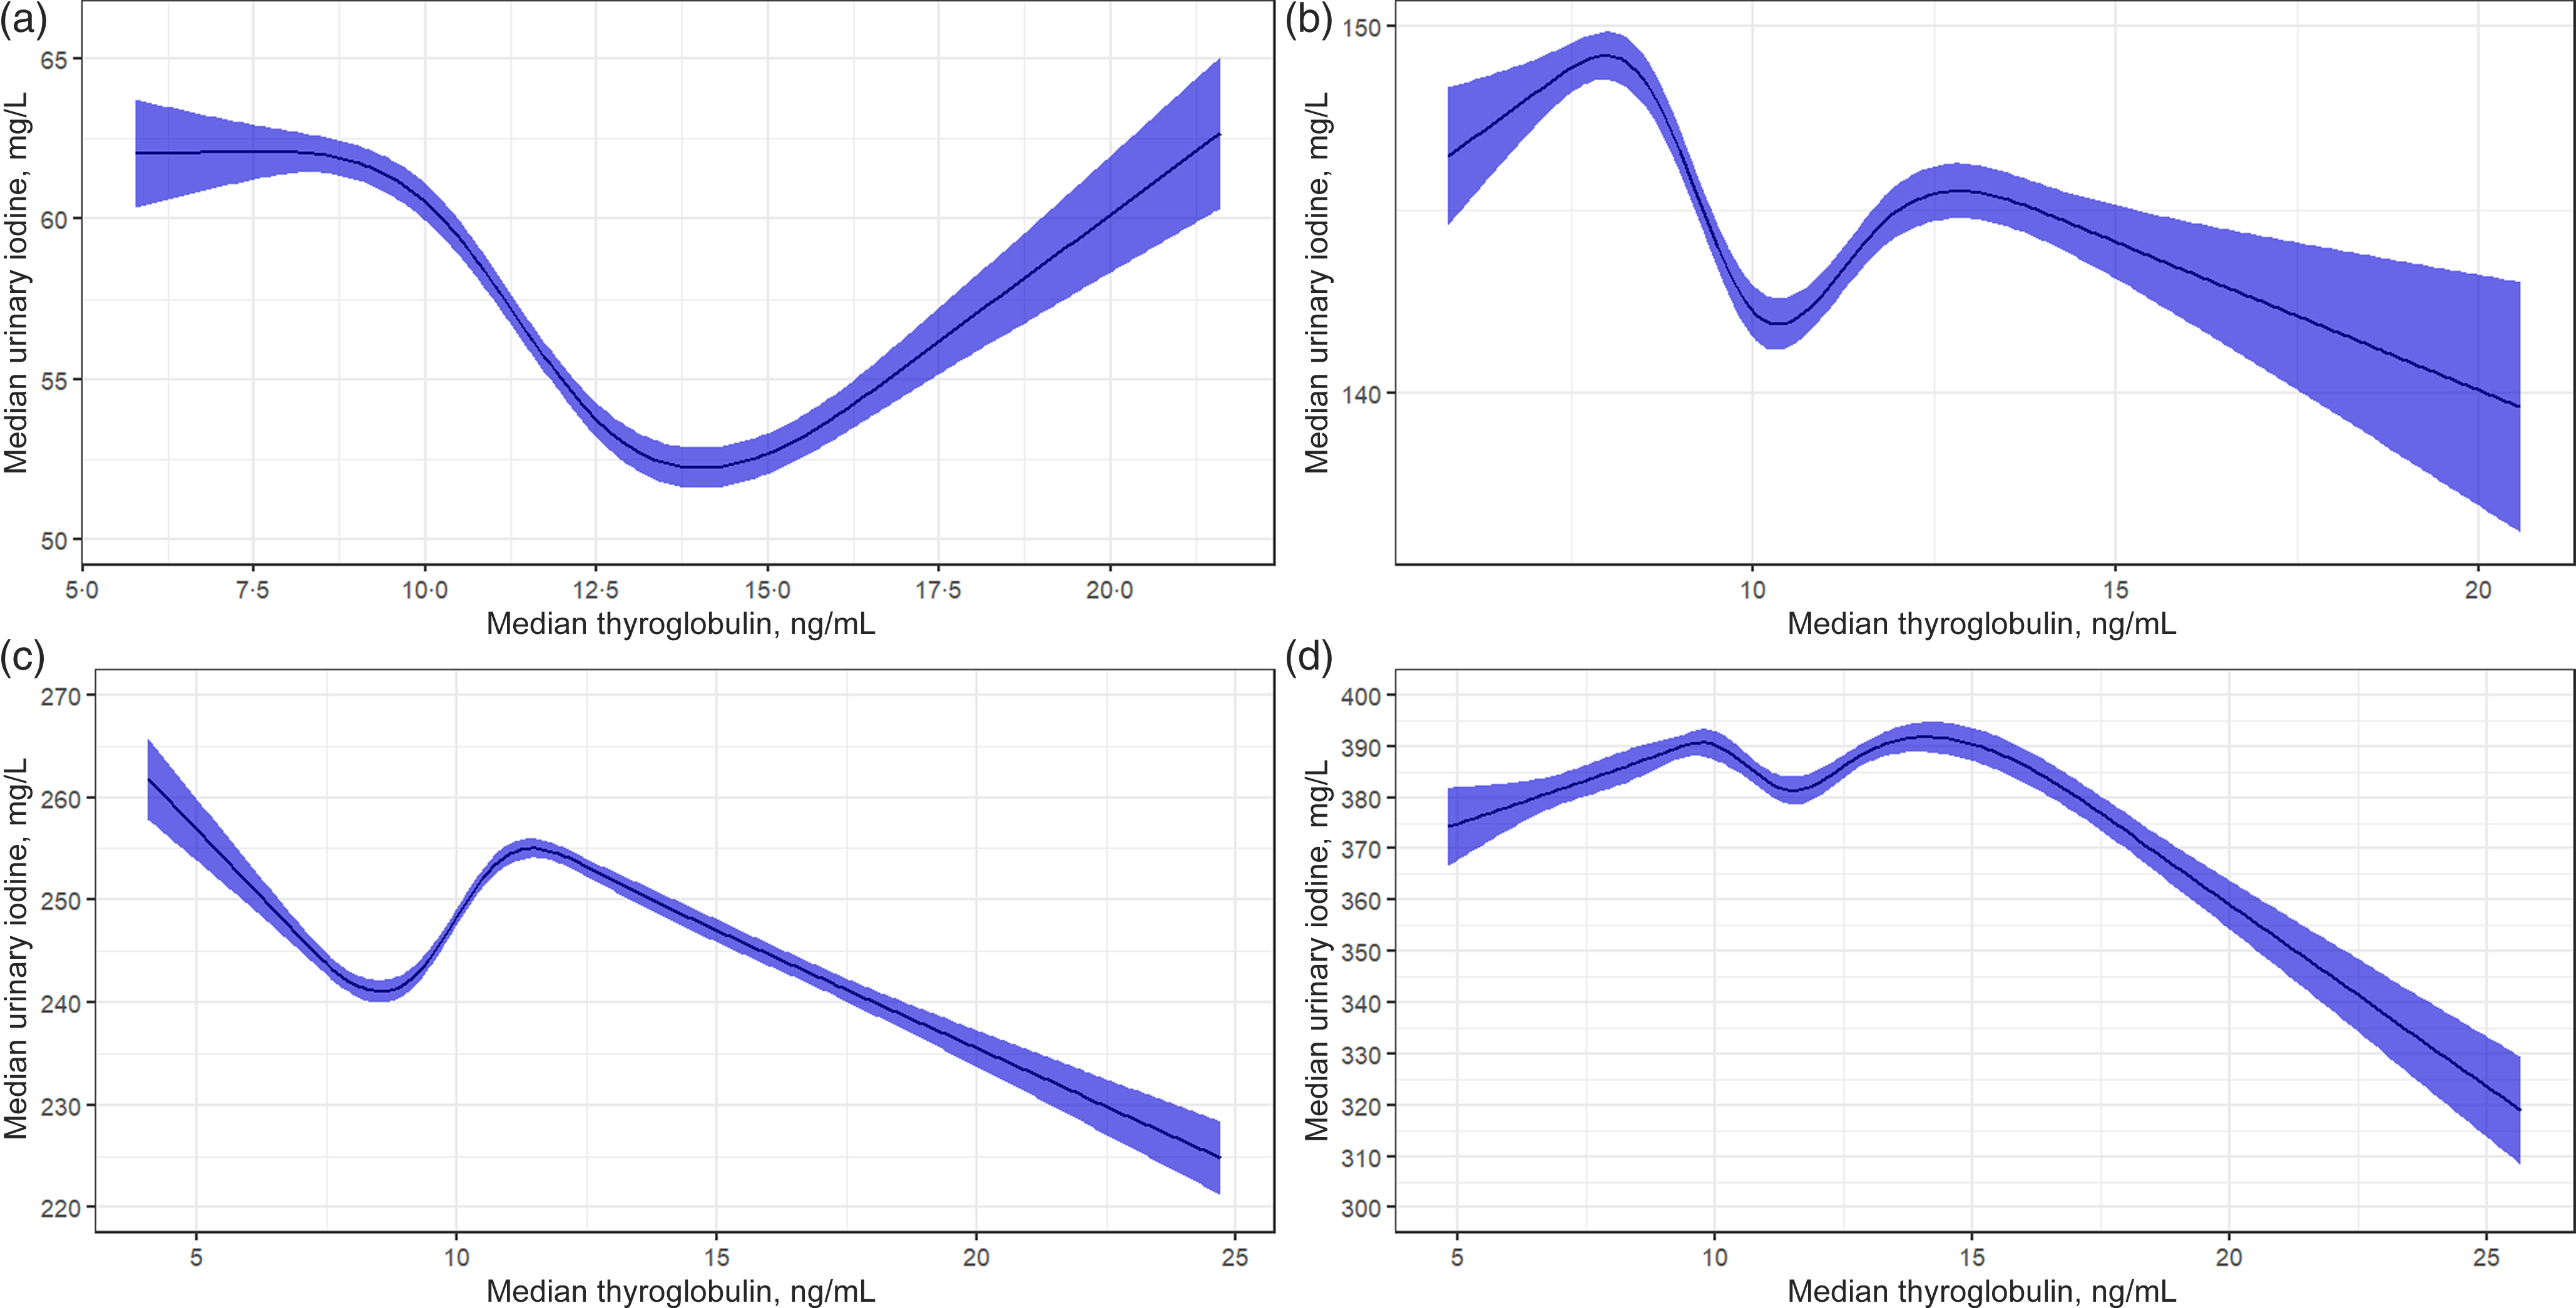
Results from the restricted cubic spline non-parametric curve function analysis are presented in Fig. 2. mTg values predictive of mUIC insufficiency, adequacy, above adequate and excess are reported in Table 4, along with 95 % CI. mTg predictive of mUIC categories are consistent with the U-shaped biological relationship between Tg and UIC. mTg values were 14·1 ng/ml for mUIC insufficiency, 9·8 ng/ml for mUIC adequacy, 8·6 ng/ml for mUIC above adequate and 11·4 ng/ml for mUIC excess.
Restricted cubic spline curve for median urinary iodine concentration categories for insufficient (a), adequate (b), above adequate (c) and excess (d) subpopulations, among non-pregnant women aged 15–49 years, Epidemiological Health and Nutrition Surveillance System, 2018–2019, Guatemala.

Discussion
This novel analysis uses innovative statistical methods to demonstrate that Tg is a functional biomarker of population iodine status and is significantly correlated with UIC at different mUIC thresholds at the population level. We were able to generate mTg values that are predictive of and correspond to WHO mUIC population categories for insufficiency, adequacy, above adequate and excess among non-pregnant Guatemalan women aged 15–49 years. In addition, these results indicate that physiological mTg thresholds are feasible and can capture the biological relationship with mUIC at different spot urinary iodine levels. mTg values were highest corresponding to mUIC insufficiency (14·1 ng/ml), decreased corresponding with mUIC adequacy (9·8 ng/ml) and above adequate (8·6 ng/ml) values and increased again when corresponding to mUIC excess (11·4 ng/ml) values. The mTg values demonstrated a U-shaped relationship with mUIC categories consistent with the literature and our understanding of Tg and iodine biology(Reference Zimmermann, Aeberli and Andersson10). Further, mTg-mUIC correlations were strongest in the mUIC insufficient (r = –0·22, P < 0·0001) category, suggesting that the newly derived mTg cutoff may be more discriminant in terms of identifying iodine insufficient women, more so than those in the UIC excess categories that had lower explained variance relative to insufficient status. As Tg is a homeostatically controlled protein, it gets expressed in both iodine-deficient and excess states(Reference Sellitti and Suzuki27,Reference Grieco, Wang and Delcorte28) . Therefore, further examination of other thyroid-related biomarkers, which were unavailable in this Guatemala database, such as triiodothyronine, thyroxine, thyroid-stimulating hormone and triiodothyronine:thyroxine ratio using similar analytical methods, may also facilitate identifying individuals with excess iodine. And finally, consumption of iodised salt foods was at 74 %, and mean iodine in household samples was 21·0 (17·2) mg/kg with a range of 0·0–120·2 mg/kg. This evidence provides support that Tg levels identified in this analysis are likely to be minimally impacted by a lack of iodised salt in the food environment(29).
Although current global recommendations endorse UIC measurement from single or spot urine samples, a physiologically based biomarker for iodine status such as Tg may be more appropriate as it is a more stable and integrative indicator of iodine status, especially in women aged 15–49 years who may have fluctuating intake or increased physiological demands. However, currently, iodine studies with Tg measurement in the literature are challenging to interpret for individual-level application and population-level assessment(Reference Bath, Pop and Furmidge-Owen30–Reference Dineva, Rayman and Levie32). First, Tg is not sensitive to recent changes in iodine intake(Reference Hlucny, Alexander and Gerow31). Second, studies investigating functional biomarkers of iodine status in the literature have used different outcomes and less robust analytical methods(Reference Dineva, Rayman and Levie32). Additionally, comparisons between Tg values in the published literature are challenging to interpret due to differences in assay methods and cut points, which can confound comparisons across studies(Reference Hlucny, Alexander and Gerow31). And finally, studies examining Tg and UIC among adults, or within specific subgroups such as women aged 15–49 years or pregnant women, tend to generate one mTg and one mUIC value for the population of interest, instead of values corresponding to the different WHO thresholds(Reference Ma and Skeaff4). For example, a systematic review of twelve observational studies in adults suggests that Tg concentrations < 13 or ≥ 13 µg/l are not an appropriate cutoff for identifying iodine-sufficient and iodine-deficient populations of adults. This was due to the fact that eight of the twelve studies reported that iodine-deficient adults had a mTg < 13 µg/l, which is quite consistent with the 14·2 ng/ml mTg threshold identified in our study(Reference Ma and Skeaff4). The 13 µg/l threshold was derived from an earlier multicentre study conducted among school-aged children, which concluded that mTg < 13 µg/l and/or < 3 % of Tg values > 40 µg/l could be used as a biomarker of adequate iodine status in children(Reference Zimmermann, Aeberli and Andersson10).
Two studies by Shi et al. (2015) and Stinca et al. (2017) further corroborate that mTg ∼10 µg/l can be used to categorise iodine sufficiency in pregnant and non-pregnant women. Shi et al. (2015) derived a 10 µg/l cutoff by assessing serum Tg concentrations across different UIC concentrations, while Stinca et al. (2017) derived their cutoff based on the median dried blood spot-Tg and 95 % CI from a reference pregnant women population with an adequate mUIC(Reference Stinca33,Reference Shi, Han and Li34) . Our approach is based on the normative biological relationship between Tg and iodine excretion. These results suggest that harmonisation of Tg cutoffs for assessing iodine status in population surveys may be warranted in the future(Reference Raverot, Bournaud and Sassolas35–Reference Mandel, Spencer and Hollowell38).
Examining additional data on Tg and UIC measures that replicate this analysis in different population groups – particularly to compare results from pregnant and non-pregnant women with varying iodine intakes and in populations with and without iodine salt fortification – may be useful to help harmonise thresholds. Universal salt iodisation mandates and the inclusion of iodised salt in processed foods have resulted in increased salt fortification and iodine intake; over-consumption of iodine has negative health implications such as hyperthyroidism or hypothyroidism(Reference Mandel, Spencer and Hollowell38,Reference Katagiri, Yuan and Kobayashi39) . Thus, reliable and accessible iodine monitoring is necessary, especially given the co-occurrence of iodine deficiency and iodine excess in some populations(Reference Vargas-Uricoechea, Pinzón-Fernández and Bastidas-Sánchez40).
There are many strengths in this analysis. This analysis was conducted using a large sample size of Guatemalan women and a wide range of UIC. In addition, the results of this analysis are a step towards micronutrient surveillance and can be used as further evidence for the use of Tg as a biomarker for iodine assessment and monitoring. Furthermore, UIC is not a clinical measure and is not available in electronic health records, but thyroid panels are routinely ordered in many settings, so it may be possible to use Tg data from electronic health records for population surveillance of iodine status. However, there is a limitation that needs to be considered in the interpretation of the results. This analysis was conducted using nationally representative survey data from non-pregnant women aged 15–49 years in Guatemala and may not be representative of other populations, including pregnant women, children, adolescents and the elderly, populations with different salt iodisation policies and/or dietary salt intake. In addition, since data came from household nutrition surveys, we were unable to examine a full immunology panel as related to Tg, as would be the case in a clinical setting.
Conclusion
In this sample of Guatemalan non-pregnant women aged 15–49 years, there was significant and graded correlations between mUIC and mTg, supporting that Tg concentrations are predictive of WHO mUIC categories. Additional validation, harmonisation of cut points and assay methods would be necessary to determine if Tg could be a potentially viable biomarker for assessing population iodine status in women.
Acknowledgements
The authors acknowledge SIVESNU participants and field staff. Tg analyses were conducted by Dr Olga Torres, QB., MSc, of Diagnóstico Molecular S.A., Laboratorio Clínico y de Investigación, Edificio Zona Médica, 7a. avenida 9-64 zona 9, Local 215, Guatemala City. Funding and in-kind technical assistance were provided by UNICEF and CDC.
The authors received no specific funding for this analysis.
M. P. provided overall programme and supervision, and K. M. managed the field work. K. S. and O. Y. A. designed the analysis plan; K. S., R. J. and O. Y. A. conducted analyses and drafted the manuscript. M. E. J. and O. Y. A. provided supervision. All authors reviewed and approved the manuscript. No copyrighted materials were used in the conduct of this research or the writing of this article. The findings and conclusions in this report are those of the authors and do not necessarily represent the official position of the US Centers for Disease Control and Prevention.
The authors report no conflicts of interest.


 Open access

