

One of the principal objectives of Sri Lanka's healthcare system has been the provision of adequate nutrition to each of its citizens. A key component to achieve this goal has been the Thriposha programme, which was established in 1973 to combat the high prevalence of childhood malnutrition and Fe deficiency anaemia. The Sinhalese word Thriposha means ‘triple nutrient’ as it provides energy, protein and micronutrients in a precooked ‘ready-to-eat’ cereal-based food. Although Thriposha has been given to nutritionally vulnerable Sri Lankan children (6–60 months) for over 30 years, its efficacy in lowering the high rates of micronutrient deficiencies has not been evaluated.
All Thriposha is manufactured in a single facility in Sri Lanka. The dry porridge of Thriposha consists of 66·0 g maize flour, 30·0 g soya powder, 3·0 g milk powder and 1·0 g of a vitamin–mineral premix (vitamin 0·1 g/mineral 0·9 g), which includes 18·0 mg Fe and 3·0 mg Zn per 100 g. The composition of the mineral–vitamin premix is described in Table 1. The manufacturing process includes extrusion processing after dehulling the soya. During the extrusion process, degermination of maize takes place when cooking at 130°C with steam at a pressure of 60 psi. The vitamin–mineral premix is added once the soya–milk blend returns to room temperature and is thoroughly mixed with the remainder of the components. The recommendation is to consume 50 g Thriposha/child per d as a meal supplement. A fortified food supplement should ideally provide the RDA of 7 mg (children 1–3 years) to 10 mg (children aged 4–8 years) elemental Fe(1). The current Fe content of Thriposha would provide 130 % of the RDA of Fe for children 1–3 years and 90 % for older children, whereas it contains only 35 % of the Zn requirement at the recommended intake levels. Because Thriposha has a low Zn:Fe ratio (1:6) and contains more than the RDA of Fe (18 mg; high Fe concentration (HiFe)), we wanted to evaluate a modified Thriposha formula in which the Fe content was reduced by 50 % in the premix yielding a Zn:Fe ratio of 1:3 (low Fe concentration (LoFe)). We hypothesised that the modified Thriposha formula (LoFe) would still provide an adequate amount of absorbed Fe, but the percent absorption of Zn would improve with a lower Zn:Fe ratio. Therefore, we designed two absorption studies using stable isotopes of Fe and Zn to assess their percent absorption at two different ratios from a Thriposha meal.
Composition of Thriposha supplement (per 100 g of supplement)*
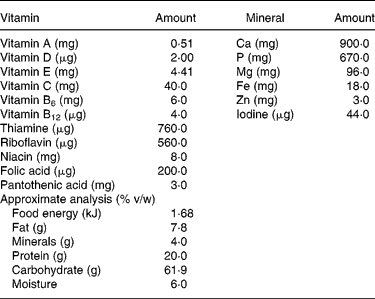
* Thriposha contains phytate (inositol hexaphosphate) 121·3 (sd 11·5) mg per 100 g of dry mix. Thriposha contains Fe in the form of ferrous fumarate and Zn in the form of zinc sulphate.
Experimental methods
The present study was conducted in accordance with the ethical guidelines specified in the Declaration of Helsinki. All aspects of the investigation involving human subjects were approved by the Ethical Review Committee of the Faculty of Medicine, University of Ruhuna, Sri Lanka, and the Institutional Review Board of Baylor College of Medicine and Affiliated Hospitals. Informed written consent was obtained from at least one parent or legal guardian of each study subject. The Fe absorption study (study I) was performed in 2005, and the Zn absorption study (study II) was accomplished in 2007. The reason that the studies were performed separately was that there was a restriction on the import and export of liquids during the time of the first study. Zn in liquid form needed to be imported, and urine samples needed to be sent to the United States for analysis. This was accomplished after the restriction was lifted.
For both studies, healthy children aged 4–7 years (an equal proportion of male and female) who had no infectious diseases, respiratory tract infections or diarrhoeal illnesses within the preceding 2 weeks were recruited from the University field training area of the Faculty of Medicine, Galle, through an announcement made to parents 2 weeks before the study. Since the RDA of Fe and Zn is similar for ages 4 years up to the age of 8 years and dosing and administration of the isotopes in this age group are much easier than for younger children, we recruited children older than 4 years for these studies. Parents were invited to a meeting at which the purpose of the study, risks and benefits were explained in detail, and the opportunity to ask questions was also given. Informed consent was obtained from those parents who agreed to participate. Each child selected was treated with 100 mg mebendazole daily for 3 d 2 weeks before the study in order to eliminate parasites. Next, 3 ml blood was drawn for baseline assessment of Hb, serum ferritin (SF) and serum Zn. Their height, weight and medical history were obtained, and a brief physical examination was performed.
Test meal preparation
In the preparation of test meals, Thriposha manufactured without added micronutrients (maize soya blend (CSB)) was obtained from the factory. The mineral–vitamin provider (Asian Chemicals, Colombo, Sri Lanka) provided the mineral–vitamin premix without Fe and Zn and supplied ferrous fumarate and zinc sulphate separately in powder form. First, the vitamin–mineral premix (an amount needed to keep the proportion of 1·0 to 99·0 g of CSB) was mixed with 100 g from the measured CSB, and then it was mixed with the rest of the CSB using a ribbon blender. The individual portions of 50 g were then separated. To keep the same molar ratio of Zn:Fe (i.e. 1:6) in 50·0 g Thriposha supplement and then to decrease it to 1:3, Fe in the form of ferrous fumarate or 57Fe (fumarate) and Zn in the form of zinc sulphate or 67Zn (sulphate) was added to each meal type as described in Table 2. In the preparation of test meals, each subject's meal was individually prepared. Thriposha powder was weighed on a calibrated scale within ± 0·1 g of the desired weight (50 g) and mixed into a ball with fresh grated coconut (20 g), sugar (5 g) and 15 ml distilled water. This is the most common method of preparation used in the local community. Next, the stable isotope doses were spread over the dough according to the type of meal. The exact dose of isotope was carefully measured and recorded with the subject's identification number. The meals were prepared just before administration on each day of testing since Thriposha is a ready-to-eat flour mixture. Each subject was required to eat all of the meal, including crumbs, and the area of the plate containing the meal was rinsed with water and given to the subject to drink. This insured consumption of all the stable isotopes.
Iron and zinc content in the test meals
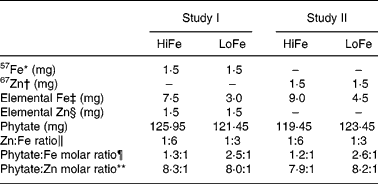
HiFe, high Fe concentration; LoFe, low Fe concentration.
* In the form of ferrous fumarate.
† In the form of zinc sulphate.
‡ In the form of ferrous fumarate (3·042 mg of ferrous fumarate = 1·0 mg of elemental Fe).
§ In the form of zinc sulphate (2·469 mg of zinc sulphate = 1·0 mg of elemental Zn).
∥ Results expressed in w/w of Zn and Fe (w = weight in mg).
¶ Phyate:Fe molar ratio = (mg phytate/phytate molar ratio (660))/(mg Fe/Fe molecular weight (55·8)).
** Phytate:Zn molar ratio = (mg phytate/phytate molecular weight (660))/(mg Zn/Zn molecular weight (65·4)).
Isotope preparation
58Fe, 67Zn and 70Zn were obtained from Trace Sciences International, Toronto, Canada. 57Fe (>97 % enrichment by mass)-labelled ferrous fumarate was synthesised by Dr Paul Lohmann GmbH KG, Emmerthal, Germany, in the powder form. 58Fe (96 % enrichment by mass) was provided in elemental metal form, and it was prepared as the sulphate at the Faculty of Medicine, Galle, using the methods described by Kastenmayer et al. (Reference Kastenmayer, Davidsson and Galan2), and stored as unit doses of 1·5 mg at a concentration of 0·6 mg elemental Fe/ml.
The 67Zn (90 % enrichment by mass) was obtained as zinc oxide powder, and it was dried at 500°C for 30 min in a muffle furnace. After cooling, the final product was resuspended in 1 m H2SO4 at 1·0 ml for every mg of Zn. The final solution supplied a unit dose of 1·5 mg elemental Zn at a concentration of 1 mg/ml. 70Zn (90 % enrichment by mass) was prepared in an aqueous solution of 0·085 mg per ml as zinc chloride at the Investigational Pharmacy of Texas Children's Hospital, Houston, TX, and then tested for sterility and pyrogenicity before use.
Study I – iron absorption
On day 1 of the feeding trial, the children (n 30) were invited to the Nuclear Medicine Unit of the Faculty of Medicine, Galle, at 07.00 hours after fasting overnight (except for water). They were given 1·5 mg ferrous sulphate (Fe as 58Fe) and 50 mg ascorbic acid orally in 200 ml orange juice as a reference dose and were served a meal 2 h later. The following day they returned after an overnight fast and were served a locally prepared test meal consisting of Thriposha for breakfast. The meal contained, as ferrous fumarate, either 9 mg supplemental Fe (HiFe, Zn:Fe ratio 1:6) or 4·5 mg supplemental Fe (LoFe, Zn:Fe ratio 1:3) of which 1·5 mg was 57Fe as ferrous fumarate. Each group consisted of fifteen subjects. They were not allowed to eat or drink (except for water) for 2 h post-test. One subject in the HiFe group vomited her meal and was therefore excluded from the study. Fifteen days later, 3 ml blood was drawn, and red cells were separated for Fe isotope analysis.
Study II – zinc absorption
On the feeding trial day, the children (n 24) were invited to the Nuclear Medicine Unit of the Faculty of Medicine, Galle, at 07.00 hours after fasting overnight (except for water). All enrolled subjects arrived, and they were served the test meal consisting of Thriposha, as either HiFe or LoFe. No labelled ferrous fumarate was included, but 1·5 mg 67Zn as zinc sulphate was added so that Zn absorption could be measured. They fasted for an additional 2 h and then a solution containing 0·5 mg 70Zn was given intravenously to each individual in order to calculate Zn absorption. The Zn:Fe ratios in the two meals were the same as in study 1. Subjects were assigned to receive either the HiFe meal (n 13) or LoFe meal (n 11) randomly. Two days later, a 15 ml sample of early morning urine was collected for Zn isotope analysis.
Sample preparation and analysis
Zn was purified from the urine sample using ion exchange chromatography. Isotope enrichments were measured by magnetic sector thermal ionisation MS. Isotope ratios were expressed with respect to the non-administered isotope, Zn-66, and corrected for differences in fractionation using the Zn-68:Zn-66 ratio(Reference Griffin, King and Abrams3). The tracer:tracee ratio (TTR) was calculated mathematically from the Zn-67:Zn-66 and Zn-70:Zn-66 ratios in the sample.
Fe absorption was calculated from incorporation of 58Fe and 57Fe into erythrocytes. Isotope ratios were also measured by thermal ionisation magnetic sector MS (Finnigan MAT 261, Bremen, Germany)(Reference Ames, Gorham and Abrams4). Ratios were expressed relative to the non-administered isotope, 56Fe, and corrected for temperature-specific differences in fractionation using the ratio of 54Fe to 56Fe. Fe isotope ratios were converted to TTR(Reference Cobelli, Toffolo and Foster5) from the 58Fe/Fe and 57Fe/56Fe ratios, as described earlier for Zn.
Hb concentration was measured spectrophotometrically by the cyanmethaemoglobin method at the Nutrition Research Laboratory, Faculty of Medicine. SF was measured by immunoradiometric assay at the Radioimmunoassay Laboratory of the Nuclear Medicine Unit, with provision of reagents from North East Thames Regional Immunoassay Center, London. Serum Zn was determined by flame atomic absorption spectrophotometry at the Industrial Technology Institute, Colombo(6). The phytate levels in Thriposha were determined by HPLC using a method described previously(Reference Sandberg and Ahderinne7). Anaemia was defined as Hb concentration < 115·0 g/l(8), Fe deficiency as SF < 15·0 μg/l(Reference Dallman, Looker, Johnson, Hallberg and Asp9) and Zn deficiency as serum Zn concentration < 9·945 μmol/l(Reference Gibson and Gibson10).
Zinc and iron absorption measurements
Zn and Fe absorption were measured as previously described(Reference Cobelli, Toffolo and Foster5, Reference Abrams11). Briefly, Zn absorption was calculated from the fractional excretion of the oral and intravenous isotope in the 48 h urine sample from the equation:

where TTR is the tracer:tracee ratio.
Erythrocyte incorporation of the oral Fe isotope was given by the equation:
where FeCirc is the total amount of Fe circulating as Hb(Reference Kastenmayer, Davidsson and Galan2, Reference Brown, Hopper and Hodges12) and is given by
Fe absorption was then estimated by assuming that 90 % of absorbed Fe was incorporated into erythrocytes.
Statistical analysis
Power calculations were based on the Zn absorption from fortified rice flour seen in a previous study in a similar population in Galle, Sri Lanka (10·9 %, sd 5·1)(Reference Hettiarachchi, Hilmers and Liyanage13). A study by Peres et al. (Reference Peres, Bureau and Neuville14) demonstrated a dose-dependent inhibition of Zn absorption when combined with Fe. Based on these data, it was assumed that halving the Fe:Zn ratio would increase Zn absorption by 2:3. A sample size of twelve would therefore give a power of 80 % to detect the difference between the Zn:Fe (1:6) group and the Zn:Fe (1:3) group at P < 0·05. Each group had three additional subjects in order to accommodate dropouts.
Statistical analysis was carried out using SPSS version 10.0 (SPSS, Inc., San Mateo, CA, USA). The prevalence of undernutrition was assessed on the basis of weight-for-age, height-for-age and weight-for-height using the Center for Disease Control 1978 reference standards. Descriptive statistics are expressed as the mean (sd). Fe and Zn absorption from the two meals were compared using a two-sided t test. Fe and Zn absorption data were also analysed using analysis of covariance with other biomarkers (SF, Hb and serum Zn), and reference dose absorption as covariates. The relationship between Fe absorption and Fe status as measured by the above parameters was assessed by linear regression analysis. SF concentrations were log10 transformed due to lack of normality. P-values less than 0·05 were considered to be significant.
Results
Iron absorption (study 1)
There were sixteen male and thirteen female subjects enrolled with ages ranging between 53·0 and 87·0 months. Anthropometric, biochemical and haematological analyses are presented in Table 3. Thirty-four percentage (n 10) of children were underweight (weight-for-age z-scores < − 2·0), six children (43 %) in the HiFe group and four children (27 %) in the LoFe group (P < 0·05). Only two children (7·0 %) were stunted (height-for-age z-scores < − 2·0), and each group had one stunted child. Baseline data from the present study showed that only one subject (3 %) in the HiFe had anaemia (Hb < 115·0 g/l), and none of the children were Fe deficient (SF < 15 μg/l). Four (14 %) children had low serum Zn ( < 9·945 mmol/l) with two in each group.
(Mean values and standard deviations)

HiFe, high Fe concentration; LoFe, low Fe concentration; WAZ, weight-for-age z-score; HAZ, height-for-age z-score; WHZ, weight-for-height z-score; SF, serum ferritin.
* All z-scores derived from the Center for Disease Control 1978 reference standards.
Reference dose Fe absorption (58Fe) was not significantly different between subjects randomised to receive the HiFe or LoFe meal (19·2 % (sd 13·4) v. 17·0 % (sd 10·5), P = 0·63; Table 4). The overall mean percent absorption of 57Fe was 6·6 % (sd 4·8) (HiFe) and 4·8 % (sd 2·6) (LoFe, P = 0·15). The percent Fe absorption ranged from 0·5 to 18·0 % in the HiFe group with a geometric mean of 4·86 %, whereas in the LoFe group it ranged from 0·7 to 10·0 % with a geometric mean of 3·59 %. There was no difference in percent Fe absorption between the two meals when Hb (P = 0·23), SF (P = 0·19) or serum Zn (P = 0·18) were used as covariates. When normalised to a reference dose absorption of 40 %, ferrous fumarate absorption in the two groups was 13·6 and 9·6 %. The percent reference dose 58Fe absorption was significantly negatively correlated with SF (r − 0·37; P < 0·05), but the 57Fe absorption did not show a significant correlation (r − 0·21; P = 0·27) with SF. There were no significant correlations in either meal between Fe absorption and the serum Zn concentration.
Absorption of Fe and Zn from the HiFe and LoFe*
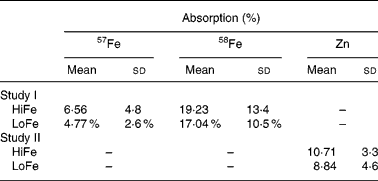
HiFe, high Fe concentration; LoFe, low Fe concentration.
* There is no significant difference between groups in Fe reference dose (58Fe) absorption (P = 0·63) or test meal Fe (57Fe) absorption (P = 0·15) or Zn absorption (P = 0·13).
Zinc absorption (study II)
There were eleven male and thirteen female subjects enrolled in the present study with ages ranging from 52·0 to 78·0 months. The anthropometric and basic biochemical analyses are found in Table 3. Seventeen percentage of the children (n 4) were underweight, but only one of these children (8 %) was in the HiFe group whereas three children (27 %) were in the LoFe group. None of the children were stunted in these groups. There were no significant differences between the groups in terms of age, anthropometrics and biochemical data. Baseline data showed that five (21 %) of the subjects were anaemic, three children (23 %) in the HiFe group and two children (18 %) in the LoFe group. None of the children were Fe deficient. Low serum Zn concentrations were seen in nine children (38 %), four children (31 %) in the HiFe group and five children (46 %) in the LoFe.
There were no differences between the two groups in the percent Zn absorption from the meal (10·7 % (sd 3·3) v. 8·8 % (sd 4·6), P = 0·13; Table 4). The Zn absorption levels ranged from 5·7 to 15·9 % in the HiFe group with a geometric mean of 10·2 %, whereas in the LoFe group, it ranged from 5·6 to 15·7 % with a geometric mean of 7·7 %. There was no difference in percent Zn absorption between the two meals when Hb (P = 0·28), serum Zn (P = 0·16) or SF (P = 0·27) were used as covariates. Zn absorption was positively correlated with serum Zn concentration (r 0·71; P < 0·001), but there were no significant correlations between Zn absorption from either meal and SF or Hb concentrations.
Total absorbed iron and zinc
Total absorbed Fe based on the quantity of Fe in the HiFe meal and the calculated percent absorption were 0·59 (sd 0·43) mg; similarly, total absorbed Zn was 0·16 (sd 0·05) mg. This was calculated by multiplying the percent absorption of each mineral by the Fe or Zn content in the meal. These amounts represent 65 and 13 % of the estimated absorbed requirement of Fe (0·9 mg) and Zn (1·2 mg)(1), respectively, for the age group studied. With the modified meal (LoFe), only 0·20 (sd 0·12) mg Fe and 0·13 (sd 0·07) mg Zn were absorbed. This would provide 22 % of the estimated absorbed requirement of Fe and 11 % of Zn in this age group.
Phytate levels in Thriposha meal
The phytate levels in a CSB sample of each meal type were analysed, and the results were presented in Table 2. The mean level was 121·3 (sd 11·5) mg phytate per 100 g of dry mix. Therefore, the HiFe meals had a 1·2:1 molar ratio of phytate:Fe and LoFe meals had a ratio of 2·5:1. Phytate:Zn molar ratio was 8·0:1 in both types of meals.
Discussion
The objectives of the present study were to determine the extent to which Fe and Zn are absorbed by young children when given a maize flour-based, pre-cooked formula as part of a national strategy to improve nutrition and to ascertain the total absorbed Fe and Zn at different molar ratios. Nearly, all the study population consisted of non-anaemic young children (only one child in study I was anaemic), and all appeared to have adequate Fe stores. However, thirteen children from both studies (26 %) were deficient in Zn (serum Zn < 9·945 μmol/l). While the fractional absorption of Fe and Zn was not significantly different at the two ratios studied, the total absorbed Fe was higher from the meal with the higher Fe content. Modifying the Thriposha product to contain less Fe should, therefore, be avoided as it reduced the total absorbed Fe content without improving fractional Zn absorption.
There are few studies that have reported the bioavailability of Fe from ferrous fumarate. A trial by Davidsson et al. (Reference Davidsson, Kastenmayer and Szajewska15) in 6–12-month formula-fed infants demonstrated a fractional absorption of 4·1 % from 2·5 mg labelled ferrous fumarate in a wheat and soya infant cereal. A second study by Davidsson et al. (Reference Davidsson, Dimitriou and Boy16) reported fractional Fe absorption of 5·5–6·2 % in Guatemalan females aged 12–13 years fed a meal based on maize tortillas and black bean paste fortified with labelled ferrous fumarate. A study done in Ghana by Tondeur et al. (Reference Tondeur, Schauer and Christofides17) with infants 6–18 months demonstrated fractional Fe absorption from labelled ferrous fumarate sprinkles of 4·48 % in Fe-deficient infants, 4·65 % in Fe-replete infants and 8·25 % in those with Fe deficiency anaemia. Although the age range of our subjects was different, these results appear to be consistent with the present findings (mean fractional absorption from fumarate of 6·6 and 4·8 % and geometric means of 4·9 and 3·6 %).
Complementary food diets in developing countries are often low in bioavailable Fe, as described by Lutter & Rivera(Reference Lutter and Rivera18). This is due to the low Fe content of the diet and the poor bioavailability of the Fe from meals. Many cereal-based complementary foods are not good sources of Fe because of their high phytate content(Reference Hurrell19). The LoFe meal had a higher phytate:Fe molar ratio (2·5:1), which may partially explain the lower fractional absorption from that meal.
Previous studies using higher doses of Fe have analysed the effect of Zn on fractional Fe absorption, but the results have been inconclusive. Crofton et al. (Reference Crofton, Gvozdanovic and Gvozdanovic20), using the Fe post-absorptive plasma curve as a surrogate measure of Fe absorption, found a reduction in fractional Fe absorption from a water solution containing 27·5 mg Zn and 23·5 mg Fe (Zn:Fe molar ratio 1:1). However, no effect on fractional Fe bioavailability was found in pregnant women receiving a prenatal supplement containing 60 mg Fe and 15 mg Zn(Reference O'Brien, Zavaleta and Caulfield21). Rossander-Hulten et al. (Reference Rossander-Hulten, Brune and Sandstrom22) reported that a fivefold excess of Zn:Fe administered in water reduced fractional Fe absorption by 56 % among adults aged 19–50 years and that the effect disappeared when Zn:Fe in the same ratio was administered in a hamburger meal in a separate group of adults. When Friel et al. (Reference Friel, Serfass and Fennessey23) administered 1200 μg/kg Zn with 300 μg/kg Fe between feedings, it resulted in an inhibition of erythrocyte incorporation of Fe in premature infants. The same relative ratio of Zn:Fe administered with feedings did not inhibit erythrocyte incorporation of Fe.
The observed low Zn fractional absorption in either meal can be attributed to the phytate content in the food as described by Chiplonkar & Agte(Reference Chiplonkar and Agte24). This group had extensively studied the effects of phytate and folic acid on Zn fractional absorption and developed a statistical model for predicting Zn bioavailability from cereal-based diets. Estimates of dietary Zn absorption as developed by WHO have been stated as 50, 30 and 15 % for diets having phytate:Zn molar ratio < 5:1, 5–15:1 and >15:1, respectively(25). However, the average phytate:Zn molar ratio was 11:1 in the study by Chiplonkar & Agte(Reference Chiplonkar and Agte24), and an average Zn absorption of 16·8 % was reported. Thriposha had a measured phytate:Zn molar ratio of 8·0:1; however, the percent Zn absorption was only 10·7 and 8·8 % in the two groups studied, demonstrating values somewhat lower than predicted by the present model.
Micronutrients such as Fe, Ca, folic acid, riboflavin and niacin have been shown to affect the bioavailability of Zn(Reference Chiplonkar and Agte24). Fortification with mineral salts has the potential to reduce the bioavailability of other minerals in the food by either changing their intestinal solubility or by competing for uptake at absorption sites, as noted by Abrams & Atkinson(Reference Abrams and Atkinson26). Data for such mineral–mineral interactions come primarily from studies of single mineral dietary supplements rather than micronutrients used as fortificants in foods. Concern has primarily centred on the effect of Ca and P fortification on Fe and Zn absorption, Zn fortification on copper absorption and Fe fortification on Zn absorption. However, several studies have shown that neither Fe absorption nor Fe stores are affected when infants are fed Ca- and P-fortified formulas(Reference Dalton, Sarget and O'Connor27) or when children are fed a Ca-fortified breakfast cereal(Reference Abrams, Griffin and Davila28). Data are not available to support recommendations on optimal dietary Ca:Zn ratios(Reference Abrams and Atkinson26).
We noted a significant inverse relationship between reference dose percent Fe absorption when given with orange juice (containing ascorbic acid that enhances absorption) and SF. This is in contrast to an earlier study where Fe absorption from orange juice (with ascorbic acid) was not related to SF, but percent Fe absorption from apple juice (without ascorbic acid) was inversely related to SF(Reference Shah, Griffin and Lifschitz29). We also found a negative relationship between percent Fe absorption from the meal and SF concentrations of the subjects, but this did not reach a level of significance (r − 0·21; P = 0·27). Similar significant inverse relationships between Fe absorption from the diet and SF have been reported(Reference Etcheverry, Hawthorne and Liang30, Reference Lynch, Griffin and Hawthorne31). Interestingly, we saw a significant positive correlation in serum Zn concentration v. percent Zn absorption from the meal. The present finding was not reported previously and merits further research, although serum Zn may not be a reliable indicator of body Zn stores. Adequate Zn stores help to maintain antioxidant capacity. One animal study demonstrated that Zn deficiency impairs intestinal antioxidant capacity by lowering the expression of metallothionein, an effective scavenger of hydroxyl radicals that can play a major role in the development of oxidative damage(Reference Bodiga and Krishnapillai32). Furthermore, increased localisation of metallothionein in the intestinal mucosa during Zn repletion among rats was seen. Zn per se can reduce Fe-mediated production of hydroxyl radicals and thereby protect against oxidative stress(Reference Sreedhar, Subramaniyan and Nair33). Hence, we speculate that improved Zn status may lead to higher Zn levels in the serum and enhanced intestinal non-enzymatic antioxidant capacity and functional integrity of the mucosa. It is possible that this could lead to increased percent Zn absorption from the meal.
We compared the present mineral and vitamin composition of Thriposha with the proposed nutrient composition in fortified complementary foods described by Lutter & Dewey(Reference Lutter and Dewey34), and noted that levels of some minerals and vitamins are not consistent with their guidelines. However, their studies focused principally on toddlers up to the age of 2 years; whereas, Thriposha has been formulated for older children as well. Recent WHO guidelines on fortification state that the goal of fortification should be to provide approximately 97·5 % of the individuals in a population with an intake that meets their estimated absorbed requirement for specific micronutrients without exceeding their tolerable upper intake levels(35). This is more realistic and safer than attempting to meet the recommended intake for the entire population(Reference Murphy and Barr36). The estimated absorbed requirement values for Fe and Zn are 4·5 mg/d(37) for this age group. We found a satisfactory total absorbed Fe content from Thriposha without hindering fractional Zn absorption. It would be useful to evaluate Fe absorption in Thriposha with twice the concentration of Zn (3·0 mg per 100 g Thriposha) while maintaining the same amount of Fe (18·0 mg) in order to optimise total absorption of Fe and Zn. In a population at high risk for severe Zn deficiency(Reference Hettiarachchi, Liyanage and Wickremasinghe38), increasing Zn content and maintaining the same Fe content may be justified.
We had in fact planned to perform both the Fe and Zn absorption studies at the same time and with the same subjects. Unfortunately, for logistic reasons, we had to complete the study with two different groups 1 year apart. This was a limitation in the study, and certainly alternative study designs could have been chosen if this constraint had been foreseen. Secondly, the fasting status of the children could have had an impact on the Zn absorption results. However, we insured close supervision of the subjects, and the difference in fasting duration between subjects varied only between 10 and 11 h. The present study used state of the art laboratory and clinical techniques to obtain the most accurate measurements possible under these conditions. We collected only a single spot urine collection at 2 d after isotope dosing to assess Zn absorption, which we believe is adequate for this purpose. Sparacino et al. (Reference Sparacino, Shames and Vicini39) have shown that this is mathematically equivalent to measuring the isotopes in a single serum sample. As such, it slightly underestimated true Zn absorption. However, the degree of underestimation is affected very little by delaying the urine collection for 2–5 d longer, and doing so results in much lower isotope enrichment in the sample and much increased measurement error. We believe that a urine collection between 2 and 3 d after isotope administrations provides a good balance between approximation of the theoretical true Zn absorption and the practical need to ensure sufficient isotopic enrichment.
Based on the present findings, we do not recommend a change in the Fe content of the current Thriposha formula (i.e. HiFe meal) since it provides 65 % of the daily total absorbed Fe requirement for this age group with each 50 g/d of supplement. However, a lower percentage (approximately 10 %) of the total absorbed Zn requirement was met. Lowering the Fe content did not improve either fractional Fe or Zn absorption. The Zn content or Zn bioavailability of Thriposha should be improved to enhance Zn absorption from the product. An intervention that should be evaluated is the effect on total absorbed Fe and Zn with an increase in the Zn content of Thriposha while maintaining the current Fe level.
Conclusions
We have shown that reducing the Zn:Fe ratio from 1:6 to 1:3 by lowering total Fe content in a cereal-based fortified food product did not significantly change the percent Fe absorption, although it significantly lowered the total absorbed Fe. The current Thriposha formula provided approximately 65 % of the daily absorbed Fe requirement. The modified ratio also did not significantly affect the total absorbed Zn or the percent absorption of Zn. In analysing absorbed micronutrients in food programmes such as Thriposha, it is important to examine total absorption as well as fractional absorption. These results demonstrate the utility of maintaining a higher Fe content in nutritional supplements such as Thriposha. Further studies to increase Zn content while maintaining a higher Fe intake are warranted.
Acknowledgements
The Thriposha supplement was received from the factory as maize soya blend premix free of charge through the coordinating officer in charge for the Thriposha programme, Nutrition Division of the Medical Research Institute, Colombo. The mineral/vitamin premix was supplied free of charge by Asian Chemicals Ltd, Colombo. The present project was sponsored with funds provided by the International Atomic Energy Agency (IAEA contract SRL – 11 958). There is no conflict of interest among authors. Contributors: M. H. was responsible for the research project and involved in all aspects including designing, sample selection, data collection, sample analysis, results and statistical analysis, and paper writing. C. L. was responsible for the research project and involved in concept designing, supervision of sample selection, paper writing and editing. D. H., I. G. and S. A. A. were responsible for the research project and were involved in designing the sample size, statistical analysis, isotope analysis and editing the paper.


