


Type 2 diabetes mellitus imposes a growing clinical and economic burden worldwide(Reference Birger, Kaldjian and Roth1,Reference Oldridge2) , affecting more than 500 million adults(Reference Bernfort, Husberg and Wirehn3,Reference Khan, Hashim and King4) . In Japan, the prevalence has steadily risen to nearly 8 % of the adult population(Reference Sengoku, Ishizaki and Goto5). Although age(6), adiposity(Reference Khan, Hashim and King4) and genetic predisposition(Reference Geng, Liu and Pan7) are established drivers, modifiable dietary factors remain critical targets for prevention.
Fruit juice is frequently discussed in this context, yet findings are inconsistent. Large prospective cohorts in Western populations have reported positive(Reference Halvorsen, Elvestad and Molin8,Reference Imamura, O’Connor and Ye9) , null(Reference Liao, Zheng and Jiang10,Reference Scheffers, Wijga and Verschuren11) or inverse associations(Reference Scheffers, Boer and Wijga12) between juice intake and incident type 2 diabetes. This heterogeneity likely reflects juice type – 100 % fruit juice rich in bioactive polyphenols v. sugar-sweetened juice drinks high in free sugars, as well as population differences in baseline diet, obesity, genetic risk and analytical approaches, including residual confounding and varying exposure metrics.
Mechanistically, two opposing pathways are plausible. Rapidly absorbable sugars in juice can promote postprandial glucose excursions, hepatic lipogenesis and weight gain, increasing the risk of type 2 diabetes(Reference Klein, Gastaldelli and Yki-Jarvinen13,Reference Xi, Li and Liu14) . Conversely, fruit-derived micronutrients (e.g. vitamin C), flavonoids and potassium may enhance insulin sensitivity and attenuate oxidative stress, potentially reducing the risk(Reference Calvano, Izuora and Oh15,Reference Hu, Hou and Yi16) . Whether these benefits offset the glycaemic load may depend on the individual’s metabolic phenotype(Reference Calvano, Izuora and Oh15).
Genetic susceptibility offers a coherent explanation for the divergent findings in literature. Polygenic risk scores (PRS) summarise thousands of common type 2 diabetes-associated variants and quantify inherited risk. Emerging evidence suggests that diet–gene interactions can magnify or blunt nutritional effects on glycaemic outcomes(Reference Heianza, Zhou and Wang17,Reference Westerman, Walker and Gaynor18) , yet no study has examined fruit juice intake across strata of type 2 diabetes polygenic risk in an East-Asian cohort. It remains unclear whether fruit juice consumption is associated with type 2 diabetes among Japanese adults and whether this association varies by genetic risk level.
Using baseline data from the Japan Multi-Institutional Collaborative Cohort study(Reference Takeuchi, Naito and Kawai19), we examined the association between fruit juice intake frequency and prevalent type 2 diabetes and tested for multiplicative interaction between fruit juice intake and a validated East-Asian PRS for type 2 diabetes. We hypothesised that moderate fruit-juice consumption would show an inverse association with type 2 diabetes exclusively in participants within the highest PRS quintile. In contrast, no association would be evident in lower-risk strata.
This study addresses a critical gap in precision nutrition research and may inform personalised dietary guidance for type 2 diabetes prevention.
Methods
Study design and population
We analysed baseline data from the Japan Multi-Institutional Collaborative Cohort (J-MICC) Study, an ongoing prospective, multi-centre cohort established in 2005 to investigate gene–environment associations with chronic disease(Reference Takeuchi, Naito and Kawai19). Between 2005 and 2014, fourteen regional centres across Japan recruited approximately 100 000 community-dwelling adults aged 35–69 years through health check-up venues and postal invitations. At enrolment, participants completed a comprehensive self-administered questionnaire (including socio-demographics, medical and family history, lifestyle and a semi-quantitative FFQ), underwent standardised anthropometric measurements and provided venous blood specimens for genomic and biochemical assays. The detail of the J-MICC study is described elsewhere(Reference Koyama, Ozaki and Kuriyama20–Reference Ohashi, Miura and Takashima22). The current study made secondary use of anonymised data from approximately 14 539 individuals provided by the J-MICC central office, which includes laboratory data, questionnaire data and follow-up epidemiological dataset (mortality and morbidity)(Reference Fujii, Hishida and Nakatochi23). A total of 13 769 individuals without missing data on fruit juice consumption frequency or potential confounding covariates (e.g. age, sex and parents’ history of diabetes) were included in the final analysis (online Supplementary Figure 1). The study was approved by the ethics committees of Tokyo Medical and Dental University (approval number: M2022-113) and by each participating institution. All research procedures were conducted according to the Ethical Guidelines for Human Genome and Genetic Sequencing Research and the Ethical Guidelines for Medical and Health Research Involving Human Subjects in Japan.
Questionnaire
Participants answered a self-administered questionnaire assessing lifestyle, height, weight, family history (parents and siblings) and medical information. Physical activity was measured using a short format of the International Physical Activity Questionnaire(Reference Craig, Marshall and Sjostrom24). Additionally, we used a semi-quantitative FFQ that has been previously reported, to estimate food intake(Reference Ishihara, Yamamoto and Iso25,Reference Nanri, Fujiwara and Miyake26) . The consumption of 100 % vegetable and 100 % fruit juice was asked as ‘do not drink,’ ‘less than 2 cups per week’, ‘3–4 cups per week’, ‘5–6 cups per week’, ‘1–2 cups daily’, ‘3–4 cups daily’ or ‘more than 5 cups daily’. We grouped these into two categories: ‘do not drink’ or ‘Drink at least once per week.’ For disease information, trained staff verified the consistency of the questionnaires. For example, if a participant reported having a disease but did not indicate taking oral medication, they checked to confirm medication use. Type 2 diabetes was defined based on participants’ self-reported physician diagnosis through a questionnaire.
Genotyping, imputation and quality control
Among all participants of the J-MICC study, a total of 14 068 individuals were genotyped with the HumanOmniExpressExome ver 1.2 platform (Illumina) at the RIKEN Center of Integrated Medical Sciences (Yokohama, Japan). The details of quality control were followed as described(Reference Fujii, Hishida and Nakatochi23). Genotype imputation was performed using SHAPIT(Reference Delaneau, Marchini and Zagury27) and Minimac3(Reference Das, Forer and Schonherr28) software based on the 1000 Genomes reference panel (phase 3)(Reference Genomes Project, Abecasis and Auton29). After genotype imputation, strict quality control filters were applied. Specifically, variants with a ${R^2}$
< 0·3(Reference Forer, Taliun and LeFaive30) were excluded, resulting in 12 617 547 variants.
${R^2}$
< 0·3(Reference Forer, Taliun and LeFaive30) were excluded, resulting in 12 617 547 variants.
Polygenic risk score selection and calculation
Two East-Asian polygenic scores (PGS001294(31); 3496 SNPs and PGS002379(32); 920 930 SNPs) were identified in the PGS Catalog(33) for type 2 diabetes. PGS002379 was chosen for primary analyses because it offers far broader genomic coverage, and > 99 % of its variants (913 550/920 930) were present or imputable in our dataset. We used the Python library hail(34) to calculate PRS. For each participant j, an individual score was computed as
 $$PR{S_j} = \mathop \sum \limits_{i = 1}^m {\beta _i}{G_{ij}}$$
where m = 920 930, ${G_{ij}}$
is the imputed risk-allele dosage (0–2) for SNP i, and
${G_{ij}}$
is the imputed risk-allele dosage (0–2) for SNP i, and ${\beta _i}$
is the published per-allele log-OR. Variants with imputation
${\beta _i}$
is the published per-allele log-OR. Variants with imputation ${R^2}$
< 0·30 were excluded. The raw PRS was standardised to a Z-score (mean 0, sd 1). When treated as a continuous variable, OR correspond to a one-sd increase in this score. For descriptive and stratified analyses, the Z-score was divided into quintiles (low, middle-low, middle, middle-high and high), with the top quintile (≥ 80th percentile) defined as the ‘high genetic-risk’ group.
${R^2}$
< 0·30 were excluded. The raw PRS was standardised to a Z-score (mean 0, sd 1). When treated as a continuous variable, OR correspond to a one-sd increase in this score. For descriptive and stratified analyses, the Z-score was divided into quintiles (low, middle-low, middle, middle-high and high), with the top quintile (≥ 80th percentile) defined as the ‘high genetic-risk’ group.
Statistical analysis
We used t tests to compare the averages of continuous variables (such as age), and χ 2 tests to compare the proportions of categorical variables (such as sex) between the groups. We fitted multivariate logistic regression models to calculate OR and 95 % CI for diabetes mellitus. The following models were constructed: (1) model 1 was adjusted for sex, age and site (place of residence of study participants); (2) in model 2, dyslipidaemia, hypertension, paternal and maternal history of DM and educational attainment were added to model 1 and (3) in model 3, average hours of sleep per day, frequency of physical activity, smoking and alcohol were added to model 2. In addition, we re-analysed fruit juice intake using the original seven FFQ categories to characterise the dose–response pattern. OR for each category and the corresponding linear trend and spline tests are reported in online Supplementary Table 1. In the model, we put an interaction term between PRS as a continuous variable and fruit juice consumption to conduct a gene–environmental interaction analysis. As the interaction term showed marginal effect modification (P< 0·2)(Reference Thiese, Ronna and Ott35), we further analysed the association stratified by high, middle-high, middle, middle-low and low PRS score. P value of < 0·05 was considered significant. All data were analysed with Stata version 16.1 (Stata Corp.)
Results
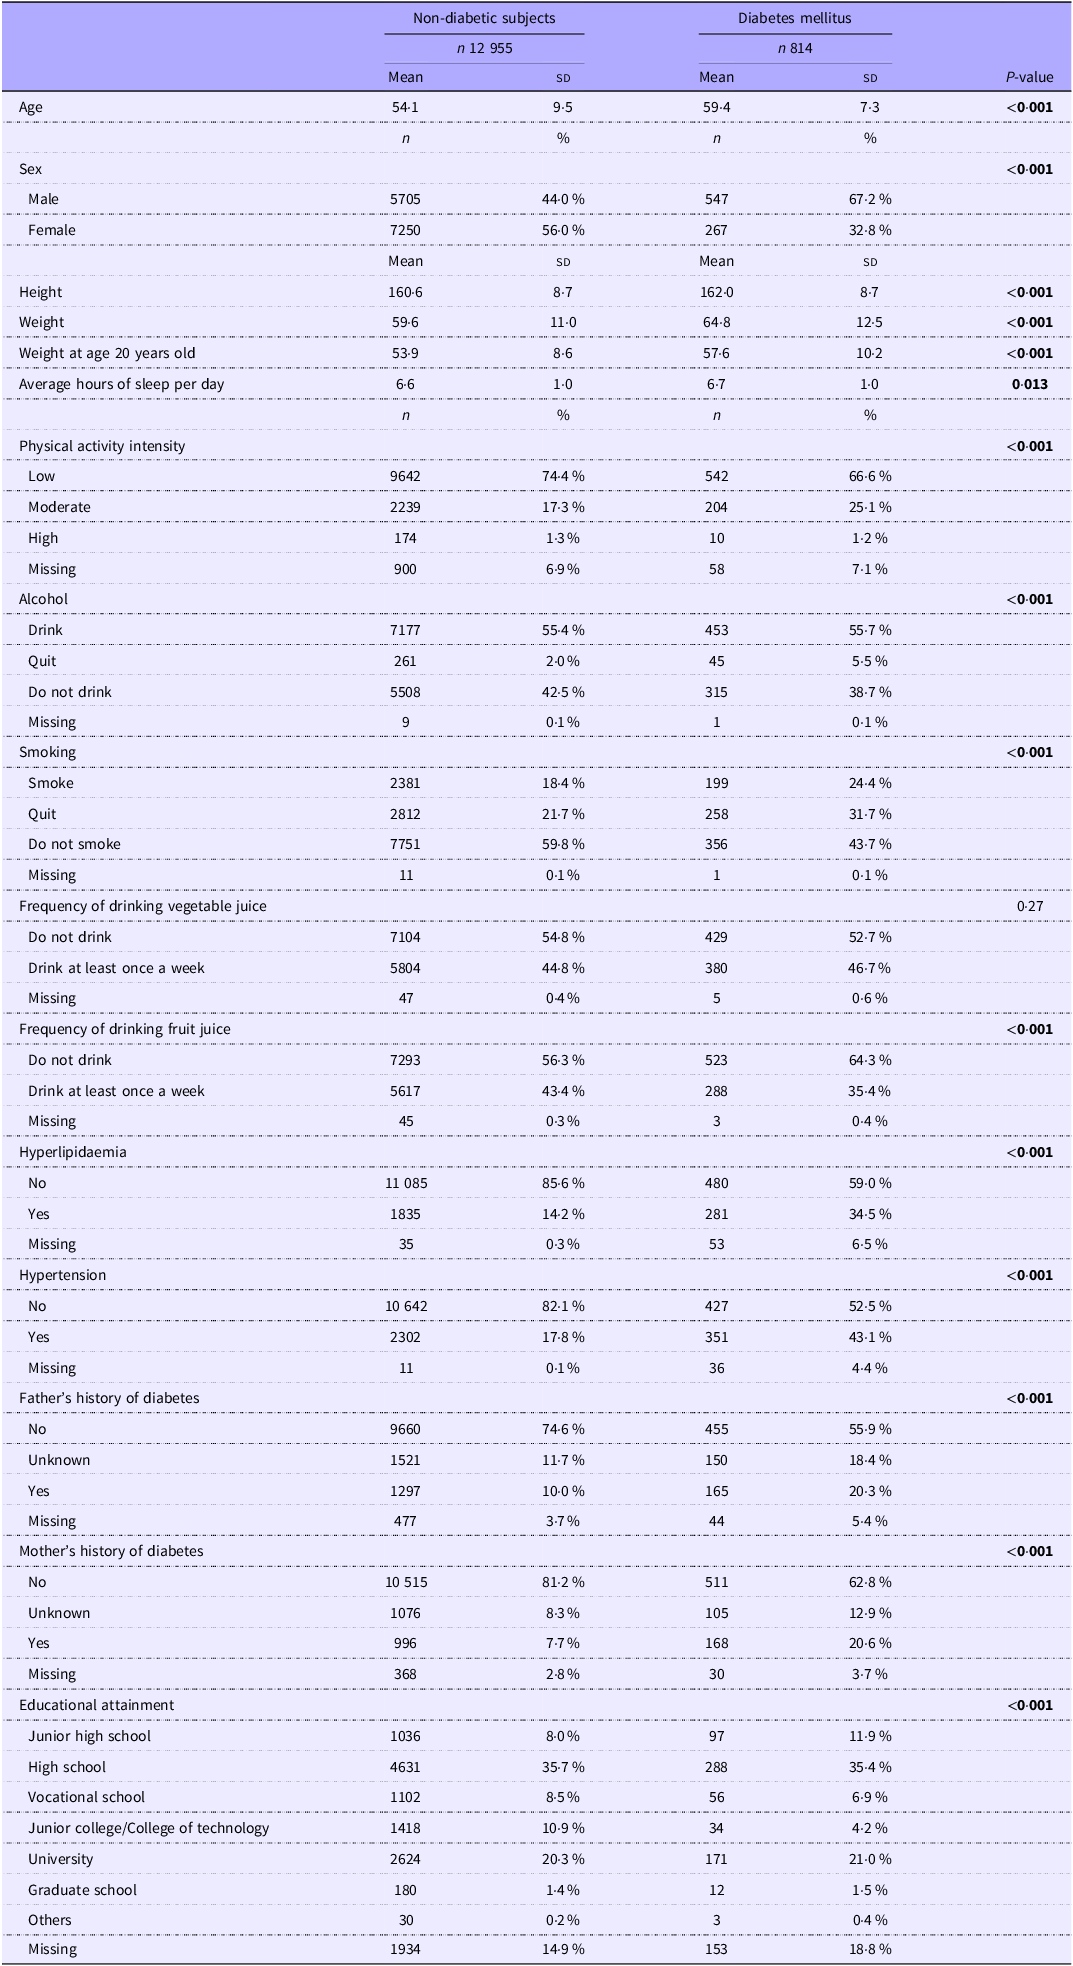
Table 1 shows the basic socio-demographic characteristics of the study participants. Of the 13 769 participants, 814 (5·9 %) were diagnosed with DM. Between the non-diabetic and DM groups, the DM group was significantly older (54·1 (sd 9·5) years old in the non-diabetic subjects and 59·4 (sd 7·3) years old in the DM group) and had significantly more males. Also, the DM group was significantly taller (160·6 (sd 8·7) cm) in the non-diabetic subjects and 162·0 (sd 8·7) in the DM group) and heavier (59·6 (sd 11·0) kg in the non-diabetic group and 64·8 (sd 12·5) kg in the DM group) and weighed significantly more at age 20 (53·9 (sd 8·6) kg in the non-diabetic subjects and 57·6 (sd 10·2) kg in the DM group). The DM group slept for significantly longer hours daily compared with the non-diabetic group, but the difference was marginal. In addition, physical activity intensity was significantly lower in the DM group. Alcohol drinking and smoking were more common in the DM group; however, more participants in the DM group quit both alcohol and smoking. There was no significant difference in vegetable juice intake, but fruit juice intake was significantly lower in the DM group. Both hyperlipidaemia and hypertension were more prevalent in the DM group. Parents’ history of DM was significantly higher in the DM group. Regarding educational attainment, the DM group was significantly more likely to have a junior high school education.
The socio-demographic characteristics of the study participants (Mean values and standard deviations; numbers and percentages)

Bold indicates P< 0·05.
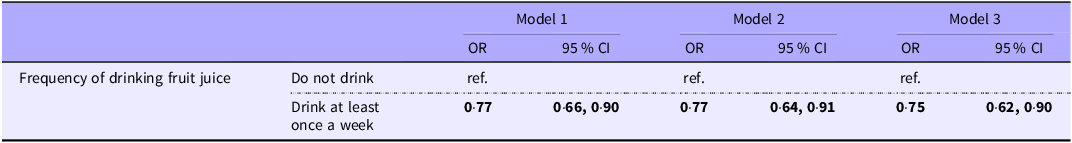
Table 2 shows the association between the frequency of drinking fruit juice and DM. Compared with those who did not drink fruit juice, those who did were significantly less likely to have DM (model 1: OR 0·77 (95 % CI 0·66, 0·90). This significant difference remained after adjustment for potentially confounding variables (model 2: OR 0·77 (95 % CI 0·64, 0·91), model 3: OR 0·75 (95 % CI 0·62, 0·90)). A category-specific analysis (online Supplementary Table 1) showed a monotonic inverse pattern: compared with non-consumers, the multivariable OR ranged from 0·79 (< 2 cups per week) to 0·47 (1–2 cups per day). The linear trend was significant (P= 0·024), and the spline test indicated no statistically significant departure from linearity (P= 0·052).
Association between frequency of drinking fruit juice and diabetes mellitus (Odds ratios and 95 % confidence intervals)

Model 1: Adjusted for sex, age, and site (place of residence of study participants).
Model 2: model 1 + dyslipidaemia, hypertension, father and mother’s history of diabetes mellitus and educational attainment adjusted.
Model 3: model 2 + average hours of sleep per day, frequency of physical activity, smoking and alcohol adjusted.
Bold indicates P< 0·05.
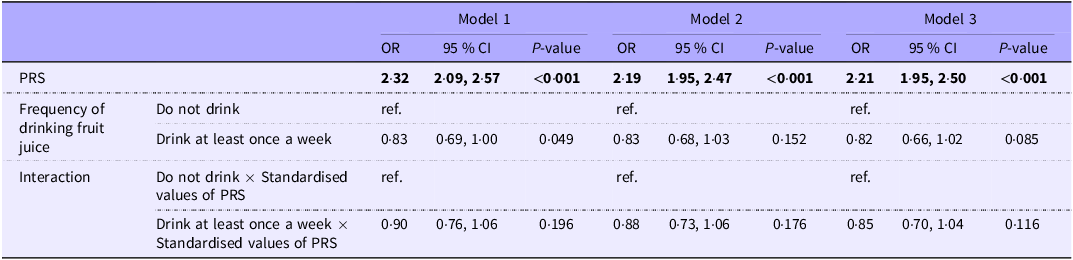
Table 3 examines the effect of the interaction term between PRS and the frequency of fruit juice consumption on DM. The interaction between consumption of fruit juice and high PRS was associated with DM (OR 0·90, 95 % CI: 0·76, 1·06). This was confirmed by model 1 (OR 0·88, 95 % CI: 0·73, 1·06) and model 2 (OR 0·85, 95 % CI: 0·70, 1·04), with no attenuation of the effect.
Association of drinking fruit juice frequency and genetic vulnerability in the onset of diabetes mellitus (Odds ratios and 95 % confidence intervals)

PRS, polygenic risk score (Z-score); ORs for PRS reflect the odds of diabetes per 1-sd increase in the score.
Model 1: Adjusted for sex, age, and site (place of residence of study participants).
Model 2: model 1 + dyslipidaemia, hypertension, father and mother’s history of diabetes mellitus and educational attainment adjusted.
Model 3: model 2 + average hours of sleep per day, frequency of physical activity, smoking and alcohol adjusted.
Bold indicates P< 0·05.
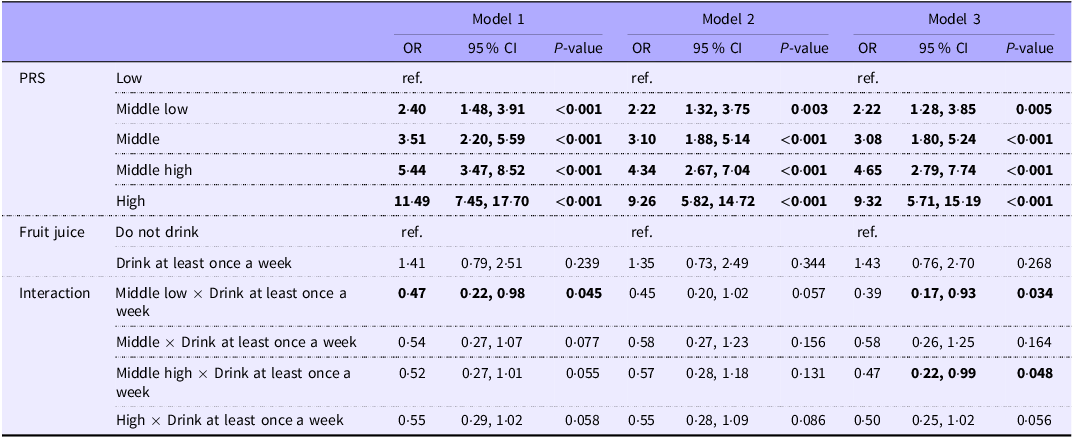
In Table 4, we set the PRS to quintile and checked the interaction term with fruit juice intake. We identified interaction between the consumption of fruit juice and middle-low and middle-high PRS. All interaction terms with PRS met the criteria of P< 0·2.
Association of drinking fruit juice frequency and genetic vulnerability in the onset of diabetes mellitus (Odds ratios and 95 % confidence intervals)

PRS, polygenic risk score.
Model 1: Adjusted for sex, age, and site (place of residence of study participants).
Model 2: model 1 + dyslipidaemia, hypertension, father and mother’s history of diabetes mellitus and educational attainment adjusted.
Model 3: model 2 + average hours of sleep per day, frequency of physical activity, smoking and alcohol adjusted.
Bold indicates P< 0·05.
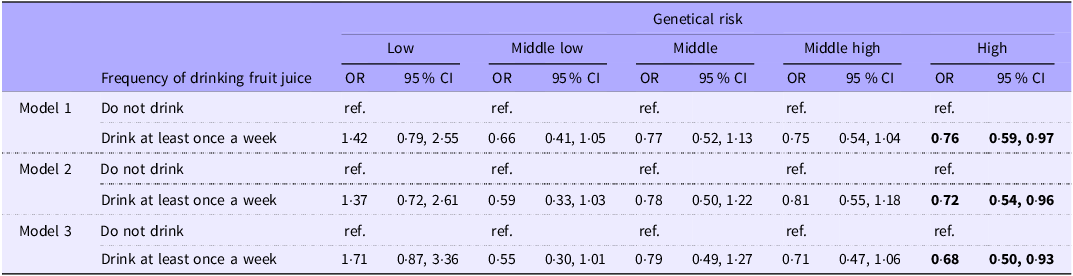
After confirming interaction effects between PRS and the frequency of fruit juice consumption, we further investigated the association between frequency of fruit juice consumption on DM, stratified by genetic risk in Table 5. DM was significantly lower among individuals with high genetic risk who consumed fruit juice (model 3, OR: 0·68 (95 % CI: 0·50, 0·93)). No significant association was observed between the frequency of drinking fruit juice and DM in the groups with low/middle- low/middle/middle-high genetic risk of developing DM (model 1–model 3).
Association between frequency of drinking fruit juice and diabetes mellitus stratified by the genetic risk (Odds ratios and 95 % confidence intervals)

Model 1: Adjusted for sex, age, and site (place of residence of study participants).
Model 2: model 1 + dyslipidaemia, hypertension, father and mother’s history of diabetes mellitus and educational attainment adjusted.
Model 3: model 2 + average hours of sleep per day, frequency of physical activity, smoking and alcohol adjusted.
Bold indicates P< 0·05.
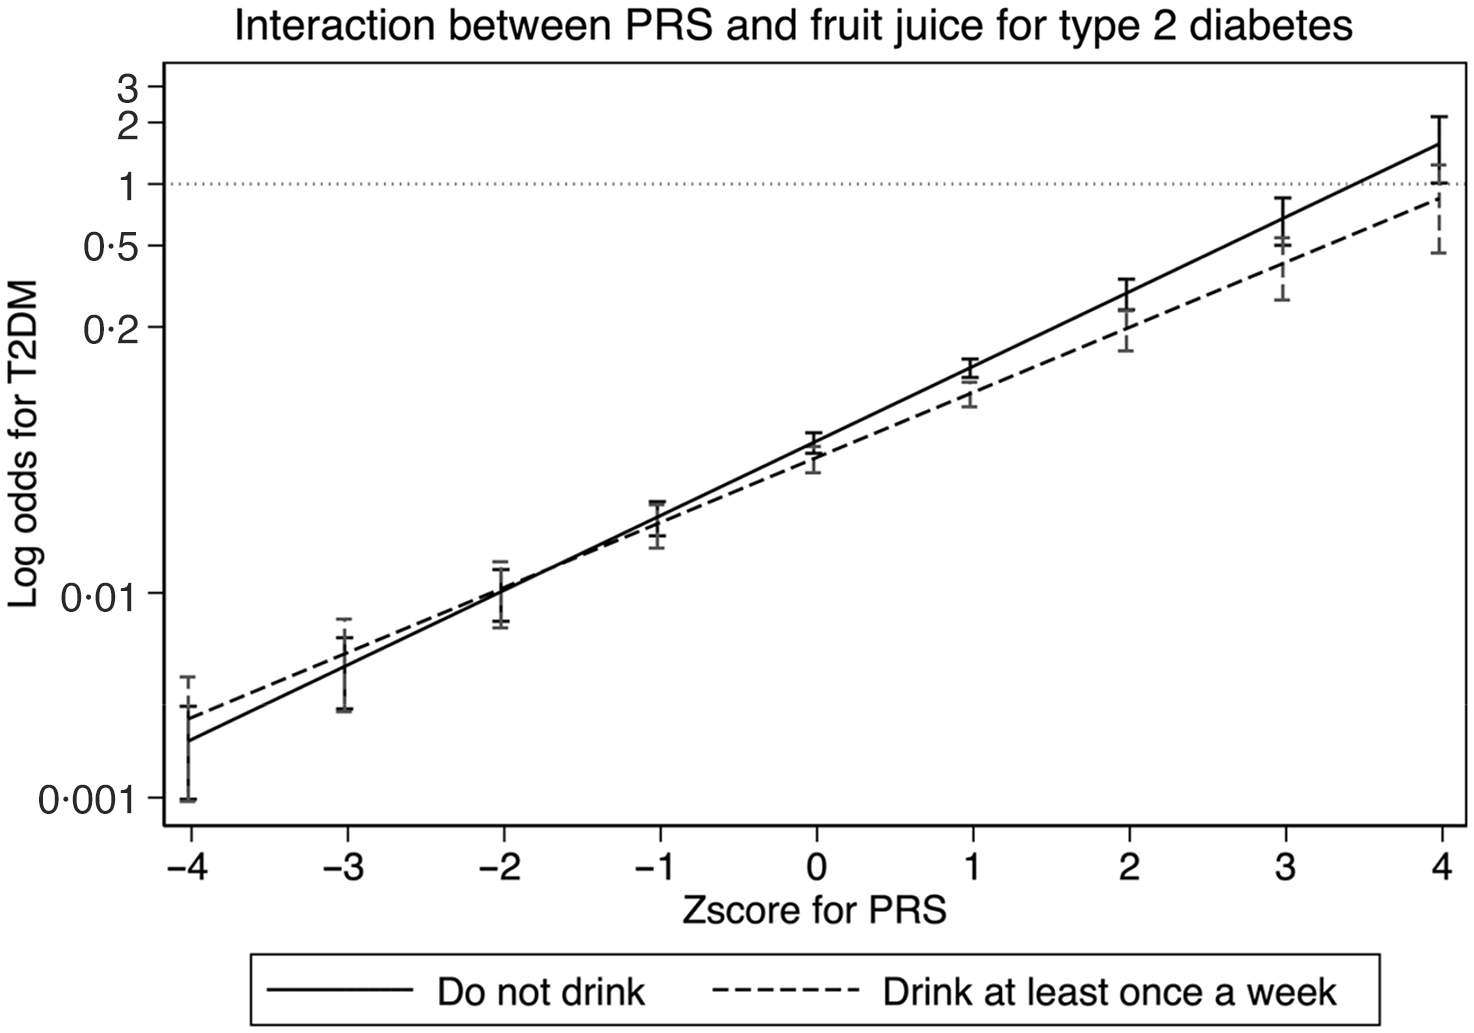
Figure 1 shows the association between PRS and odds of type 2 diabetes. Using ‘Do not drink’ as reference, we could confirm that the intake of fruit juice interacts with PRS in reducing the odds of type 2 diabetes.
Interaction between polygenic risk score and fruit juice for type 2 diabetes. The x-axis represents the Z-score of PRS, and the y-axis represents the log odds of type 2 diabetes. PRS: polygenic risk score. Adjusted for sex, age, and site (place of residence of study participants) as model 1.

Discussion
In the J-MICC study, the association between fruit juice consumption and the incidence of type 2 diabetes was analysed with respect to PRS for type 2 diabetes among Japanese individuals. The findings demonstrated a notable inverse association in individuals with high PRS for type 2 diabetes, indicating that fruit juice consumption was associated with a lower occurrence of type 2 diabetes in this genetically susceptible group. Dose–response modelling across seven intake categories (online Supplementary Table 1) supported a largely linear inverse association, with no material evidence of non-linearity (P non-linear = 0·052). This association was not observed in individuals with low PRS for type 2 diabetes, suggesting a potential interaction between genetic predisposition and dietary factors.
Our study contributes to the ongoing debate regarding the association between fruit juice consumption and the risk of type 2 diabetes, particularly within the Japanese population. Consistent with prior research, our findings indicate that confounding factors, such as overall diet quality, physical activity and genetic predispositions, play a crucial role in interpreting the association between fruit juice intake and type 2 diabetes risk(Reference Scheffers, Wijga and Verschuren11). This aligns with the previous study, which reported similar challenges in controlling for these variables(Reference Imamura, O’Connor and Ye9). However, our study stands apart by examining a homogenous population, exclusively focusing on Japanese individuals. This specific demographic focus may explain some of the variations observed in other studies that included a more ethnically diverse cohort(Reference Xi, Li and Liu14), or examined women(Reference Bazzano, Li and Joshipura36) exclusively. Our research suggests that genetic factors prevalent in the Japanese population could modulate the impact of fruit juice consumption on type 2 diabetes risk differently from other populations(Reference Kimura, Yoshida and Hirakawa37). Furthermore, our application of PRS to evaluate individual susceptibility to type 2 diabetes presents an advancement in understanding the genetic–environmental interplay. This approach corroborates a previous study(Reference Padilla-Martinez, Collin and Kwasniewski38), which first posited the potential of PRS in elucidating the multifactorial nature of type 2 diabetes, offering a more personalised risk assessment.
Our study’s outcomes contrast a previous study, which found a significant association between fruit juice consumption and type 2 diabetes risk within a diverse ethnic cohort(Reference Imamura, O’Connor and Ye9). This divergence may stem from factors beyond differences in fruit juice type. For instance, the dietary patterns inherent to the Japanese population, which may include different consumption habits and varying accompaniments with fruit juice, could influence the assimilation and metabolic impact of the sugars present in fruit juices(Reference Akter, Nanri and Pham39,Reference Tanisawa, Ito and Kawakami40) . Additionally, our study might reflect cultural and behavioral nuances specific to the Japanese context. The interaction of fruit juice consumption with other lifestyle factors prevalent in Japan, such as lower rates of obesity and higher overall physical activity levels, might modulate type 2 diabetes risk differently and could contribute to the observed association(41). This underscores the need for culturally and regionally sensitive research to discern the role of dietary factors in the development of type 2 diabetes(Reference Jannasch, Kroger and Schulze42,Reference Xue, Liu and Wang43) . Our study enhances the existing literature by providing further evidence of the complex interplay between diet, genetics and lifestyle factors. It underscores the necessity for comprehensive, multi-faceted research approaches to accurately elucidate the role of fruit juice consumption in type 2 diabetes risk.
The observed inverse association between fruit juice consumption and type 2 diabetes among individuals with high PRS could be attributed to several factors. First, bioactive compounds in fruit juices, such as flavonoids, vitamin C and other antioxidants, may have beneficial effects on glucose metabolism and insulin sensitivity(Reference Murphy, Barrett and Bresnahan44). These compounds could interact with genetic factors that predispose individuals to type 2 diabetes, possibly mitigating the risk conferred by such genetic profiles. Additionally, consuming fruit juice in moderation may reflect a broader pattern of healthier eating and lifestyle choices, which could also contribute to the inverse association observed(Reference Auerbach, Dibey and Vallila-Buchman45). It is also plausible that individuals with a known genetic risk for type 2 diabetes might engage in more proactive health behaviours, including carefully selecting dietary components like fruit juice(Reference Li, Rahman and Wu46). The implications of these findings are significant for public health and clinical practice. They suggest that dietary recommendations for prevention of type 2 diabetes could benefit from a more personalised approach, considering an individual’s genetic risk. This aligns with precision nutrition, which emphasises customising dietary advice to improve health outcomes based on genetic, environmental and lifestyle factors. The study’s results also highlight the potential for integrating PRS into clinical assessments to refine the prediction of type 2 diabetes risk. Such integration could lead to more targeted interventions aimed at those most likely to benefit, thereby enhancing the efficiency of preventative strategies and potentially reducing the burden of type 2 diabetes on the healthcare system. In conclusion, the inverse association between fruit juice consumption and type 2 diabetes in individuals with high genetic risk suggests that the interplay between diet and genetics is complex but significant. This finding invites further investigation into the mechanisms underlying the gene–nutrient interactions and supports the advancement of genomics in public health nutrition strategies.
The study presents several limitations that warrant cautious interpretation of the results. First, the cross-sectional design restricts establishing causality between fruit juice consumption and type 2 diabetes. Longitudinal studies would be necessary to determine the temporal sequence and infer causative associations. Second, reliance on self-reported dietary intake could introduce recall and reporting biases, potentially affecting the accuracy of the associations observed. Objective measures of dietary intake would enhance the validity of the findings. Third, despite using a robust tool for capturing genetic predisposition, the PRS may not encompass all genetic variants associated with type 2 diabetes risk. Additionally, due to genetic variation, PRS is calculated based on known associations that may not be comprehensive or entirely applicable across different populations. Moreover, environmental and lifestyle factors such as physical activity, socioeconomic status and other dietary patterns were controlled for, but could still confound the association between fruit juice consumption and type 2 diabetes risk. Lastly, the study population was exclusively Japanese, which may limit the generalisability of the findings to other ethnic groups or populations with different dietary habits and genetic backgrounds. Further research is necessary to validate these findings across diverse cohorts.
In conclusion, this study contributes to the understanding of the complex interplay between fruit juice, genetic predisposition and type 2 diabetes. The inverse association between fruit juice consumption and type 2 diabetes observed in Japanese individuals with a high polygenic risk score for type 2 diabetes suggests that fruit juice consumption may affect the link between genetic predisposition and type 2 diabetes. Future work should move beyond aggregate PRS to pinpoint causal variants that may modulate the metabolic response to fruit-juice constituents. Large, consortium-based gene–diet interaction GWAS, followed by locus-specific fine-mapping and Mendelian-randomisation, could clarify whether variants in carbohydrate-handling genes (e.g. SLC2A2, GCKR) or polyphenol-metabolism loci drive the effect modification seen here. With biobanks now exceeding one million sequenced or imputed genomes, such efforts are increasingly feasible and will inform precision-nutrition strategies. These findings underscore the potential benefits of incorporating genetic profiling into dietary guidelines and public health strategies for type 2 diabetes prevention. However, given the study’s limitations, including its cross-sectional design and reliance on self-reported data, the results should be interpreted cautiously. Future longitudinal research is warranted to confirm these associations and further explore how genetic and dietary factors influence type 2 diabetes risk. Such research could ultimately inform the development of personalised dietary recommendations, enhancing the effectiveness of type 2 diabetes prevention efforts in genetically susceptible populations.
Supplementary material
For supplementary material/s referred to in this article, please visit https://doi.org/10.1017/S0007114525103863
Acknowledgements
We gratefully acknowledge Ms. Floret Owusu for her meticulous English-language editing and insightful comments, which substantially strengthened the manuscript; any remaining errors are solely our responsibility.
This study was supported by Grants-in-Aid for the Scientific Research from the Japan Society for the Promotion of Science (JSPS KAKENHI Grant Number 21H04848) and National Institutes of Health (NIH) (grant R21 HD101778).
All authors contributed to the study conception and design. Conceptualisation: T. Kawahara, N. Nawa and T. Fujiwara. Data curation: T. Tamura, K. Matsuo. Formal analysis: T. Kawahara and N. Nawa. Funding acquisition: T. Fujiwara. Methodology: T. Kawahara, N. Nawa, I. Oze. Software: T. Kawahara. Supervision: K. Matsuo and T. Fujiwara. Writing – original draft: T. Kawahara. Writing – review & editing: K. Matsuo, T. Fujiwara. All authors read and approved the final manuscript.
The authors declare no conflicts of interest.
The datasets generated during and/or analysed during the current study are not publicly available due to ethical restrictions but are available from the co-author upon reasonable request after review by the Ethics Committee.


 Open access