


Introduction
Since the signing of the Convention on Biological Diversity (CBD) in 2002, signatory nations have attempted to stem the loss of biodiversity, albeit with little success. Failures in the first decade of the CBD led to the introduction of a wider set of 20 ‘Aichi’ targets (COP10, 2010), which, by 2020, were intended to address direct and indirect aspects of biodiversity loss. Other drivers for conservation in the UK have included targets in European or national legislation. These include for example descriptors 1–4 of good environmental status for the Marine Strategy Framework Directive (MSFD), biological elements of good ecological status for the Water Framework Directive (WFD) and indicators in sections C–E of the UK biodiversity indicators (UKBI) (JNCC, 2020). Despite these good intentions, in many cases in the UK at least, progress towards these targets occurred too slowly for them to be successful or complete (JNCC, 2019, 2020).
Recognition of this ongoing failure has led researchers of biodiversity and conservation to focus on development of datasets and analytical tools that can (i) adequately and robustly measure differences and change in biodiversity so change against targets can be gauged (Buckland et al., Reference Buckland, Magurran, Green and Fewster2005; Gregory et al., Reference Gregory, van Strien, Vorisek, Meyling, Noble, Foppen and Gibbons2005; Butchart et al., Reference Butchart, Walpole, Collen, van Strien, Scharlemann, Almond, Baillie, Bomhard, Brown, Bruno, Carpenter, Carr, Chanson, Chenery, Csirke, Davidson, Dentener, Foster, Galli, Galloway, Genovesi, Gregory, Hockings, Kapos, Lamarque, Leverington, Loh, McGeoch, McRae, Minasyan, Morcillo, Oldfield, Pauly, Quader, Revenga, Sauer, Skolnik, Spear, Stanwell-Smith, Stuart, Symes, Tierney, Tyrrell, Vie and Watson2010), (ii) assess risk of extinction (e.g. IUCN threat classification; Mace & Lande, Reference Mace and Lande1991; IUCN, 2020) and (iii) detect change in relation to shifting climate (Burrows et al., Reference Burrows, Schoeman, Buckley, Moore, Poloczanska, Brander, Brown, Bruno, Duarte, Halpern, Holding, Kappel, Kiessling, O'Connor, Pandolfi, Parmesan, Schwing, Sydeman and Richardson2011; Maclean & Wilson, Reference Maclean and Wilson2011; Spencer et al., Reference Spencer, Birchenough, Mieszkowska, Robinson, Simpson, Burrows, Capasso, Cleall-Harding, Crummy, Duck, Eloire, Frost, Hall, Hawkins, Johns, Sims, Smyth and Frid2011). One valuable measure for each of these is population trends, i.e. how the distribution and abundance of a population changes through time.
The UK has a long and enviable history of biological recording (Allen, Reference Allen1976; Pocock et al., Reference Pocock, Roy, Preston and Roy2015). Despite this, at a national scale in the UK, detailed assessment of population status has historically been biased towards taxa that are charismatic, easy to see or recognize and consequently has been limited almost entirely to groups such as bats, birds, large invertebrates and some priority species (e.g. in England, from Section 41 of the NERC Act 2006; Hayhow et al., Reference Hayhow, Eaton, Stanbury, Burns, Kirby, Bailey, Beckmann, Bedford, Boersch-Supan, Coomber, Dennis, Dolman, Dunn, Hall, Harrower, Hatfield, Hawley, Haysom, Hughes, Johns, Mathews, McQuatters-Gollop, Noble, Outhwaite, Pearce-Higgins, Pescott, Powney and Symes2019; Outhwaite et al., Reference Outhwaite, Powney, August, Chandler, Rorke, Pescott, Harvey, Roy, Fox, Roy, Alexander, Ball, Bantock, Barber, Beckmann, Cook, Flanagan, Fowles, Hammon, Harvey, Hepper, Hubble, Kramer, Lee, MacAdam, Morris, Norris, Palmer, Plant, Simkin, Stubbs, Sutton, Telfer, Wallace and Isaac2019) through production of atlases that map distributions of species on a grid (Powney & Isaac, Reference Powney and Isaac2015; Hayhow et al., Reference Hayhow, Eaton, Stanbury, Burns, Kirby, Bailey, Beckmann, Bedford, Boersch-Supan, Coomber, Dennis, Dolman, Dunn, Hall, Harrower, Hatfield, Hawley, Haysom, Hughes, Johns, Mathews, McQuatters-Gollop, Noble, Outhwaite, Pearce-Higgins, Pescott, Powney and Symes2019). Opportunistic and unstructured biological records (Pocock et al., Reference Pocock, Roy, Preston and Roy2015) collected by citizen scientists (Eitzel et al., Reference Eitzel, Cappadonna, Santos-Lang, Duerr, Virapongse, West, Kyba, Bowser, Cooper, Sforzi, Metcalfe, Harris, Thiel, Haklay, Ponciano, Roche, Ceccaroni, Shilling, Dörler, Heigl, Kiessling, Davis and Jiang2017) cover many more taxa than this, but are beset with sources of bias. These include uneven detectability of species through space or time, uneven spatial or temporal coverage and variation in sampling effort or expertise per recording event (Boakes et al., Reference Boakes, McGowan, Fuller, Chang-qing, Clark, O'Connor and Mace2010; Issaris et al., Reference Issaris, Katsanevakis, Salomidi, Tsiamis, Katsiaras and Verriopoulos2012; Isaac et al., Reference Isaac, van Strien, August, de Zeeuw and Roy2014; Isaac & Pocock, Reference Isaac and Pocock2015). Such ‘noise’ may mask any real patterns of change, or erroneously show change where none actually exists. Consequently, opportunistic records have been used to show coarse changes in biodiversity (Thomas et al., Reference Thomas, Telfer, Roy, Preston, Greenwood, Asher, Fox, Clarke and Lawton2004; Carvalheiro et al., Reference Carvalheiro, Kunin, Keil, Aguirre-Gutierrez, Ellis, Fox, Groom, Hennekens, Van Landuyt, Maes, de Meutter, Michez, Rasmont, Ode, Potts, Reemer, Roberts, Schaminee, WallisDeVries and Biesmeijer2013), but have seldom been used to investigate population trends for single species (Pescott et al., Reference Pescott, Walker, Pocock, Jitlal, Outhwaite, Cheffings, Harris and Roy2015). A lack of standardization for recording protocols also poses challenges for robust and detailed predictions of population trends. Novel analytical methods have, however, recently been developed that can overcome some of the limitations imposed by such biases and limitations. These techniques include using Bayesian occupancy models, to extract information from records of occurrence and improve estimates of population trends (van Strien et al., Reference van Strien, van Swaay and Termaat2013; Eaton et al., Reference Eaton, Burns, Isaac, Gregory, August, Barlow, Brereton, Brooks, Al Fulaij, Haysom, Noble, Outhwaite, Powney, Procter and Williams2015; Outhwaite et al., Reference Outhwaite, Powney, August, Chandler, Rorke, Pescott, Harvey, Roy, Fox, Roy, Alexander, Ball, Bantock, Barber, Beckmann, Cook, Flanagan, Fowles, Hammon, Harvey, Hepper, Hubble, Kramer, Lee, MacAdam, Morris, Norris, Palmer, Plant, Simkin, Stubbs, Sutton, Telfer, Wallace and Isaac2019). Occurrence records consist of presence-only data for observations of species (or higher taxa) at known dates and places.
The ability to estimate species occurrence and population trends on an annual basis has great value over the production of species atlases (typically done on a decadal scale), although biases can become more extreme with decreasing temporal granularity (Pescott et al., Reference Pescott, Humphrey, Stroh and Walker2019a). Value is derived here because more frequent reporting is a legal requirement (e.g. reporting for the Habitats Regulations 2017 and for the status of Marine Conservation Zones is every 6 years). When assessing change against arrival of non-native species, or against sudden anthropogenic threats or when evaluating the effects of changes in management, annual estimates are of far greater use than comparisons of coarse maps made 10 years apart. The spatial grain of such atlases can, however, be finer than the scale at which occupancy models can provide information.
Citizen science programmes that generate these unstructured data have greatly increased the volume of data available (Dickinson et al., Reference Dickinson, Shirk, Bonter, Bonney, Crain, Martin, Phillips and Purcell2012) providing great potential for better and broader assessment of how biodiversity is changing (Tulloch et al., Reference Tulloch, Mustin, Possingham, Szabo and Wilson2013). Thus, population trends can now be modelled for a far greater range of terrestrial and freshwater invertebrates, plants and lichens (Outhwaite et al., Reference Outhwaite, Chandler, Powney, Collen, Gregory and Isaac2018, Reference Outhwaite, Powney, August, Chandler, Rorke, Pescott, Harvey, Roy, Fox, Roy, Alexander, Ball, Bantock, Barber, Beckmann, Cook, Flanagan, Fowles, Hammon, Harvey, Hepper, Hubble, Kramer, Lee, MacAdam, Morris, Norris, Palmer, Plant, Simkin, Stubbs, Sutton, Telfer, Wallace and Isaac2019; Hayhow et al., Reference Hayhow, Eaton, Stanbury, Burns, Kirby, Bailey, Beckmann, Bedford, Boersch-Supan, Coomber, Dennis, Dolman, Dunn, Hall, Harrower, Hatfield, Hawley, Haysom, Hughes, Johns, Mathews, McQuatters-Gollop, Noble, Outhwaite, Pearce-Higgins, Pescott, Powney and Symes2019; Pescott et al., Reference Pescott, Powney and Walker2019b). Analyses of citizen science data are unlikely, however, to be a panacea for diversity studies. For instance, comparisons between structured and unstructured sampling of population trends for birds in Denmark showed a general correlation, but that declines identified by structured sampling were not always picked-up by unstructured citizen science records (Kamp et al., Reference Kamp, Oppel, Heldbjerg, Nyegaard and Donald2016).
As with many aspects of research, data collection and knowledge for the marine environment lag far behind that of terrestrial equivalents (Ostrom, Reference Ostrom1990; Townsend et al., Reference Townsend, Davies, Hanley, Hewitt, Lundquist and Lohrer2018). Broadly speaking, described terrestrial diversity at the species-level is greater than that in the sea (Briggs, Reference Briggs1994; Benton, Reference Benton2001), but the waters around the UK support a very rich variety of habitats and species, much of it as yet undescribed. This diversity is due to there being a coastline with complex geology and topography, sharp gradients for exposure to waves and tidal currents, all within a context of a gradient of increasing water temperature from south-west to north-east creating biogeographic zones with affinities ranging from Lusitanian to Boreal (Helmuth et al., Reference Helmuth, Mieszkowska, Moore and Hawkins2006; Mieszkowska et al., Reference Mieszkowska, Kendall, Hawkins, Leaper, Williamson, Hardman-Mountford and Southward2006; Burrows et al., Reference Burrows, Hawkins, Moore, Adams, Sugden, Firth and Mieszkowska2020). These seas support over 10,000 accepted species (MEDIN, 2021), but aside from fisheries of commercial value, some marine mammals, seabirds and a few plankton (collected by fisheries agencies and research organizations) there are very few estimates of population trends for marine species (Hayhow et al., Reference Hayhow, Eaton, Stanbury, Burns, Kirby, Bailey, Beckmann, Bedford, Boersch-Supan, Coomber, Dennis, Dolman, Dunn, Hall, Harrower, Hatfield, Hawley, Haysom, Hughes, Johns, Mathews, McQuatters-Gollop, Noble, Outhwaite, Pearce-Higgins, Pescott, Powney and Symes2019). I am not aware of any population trends for benthic marine species estimated from unstructured, opportunistic data collected by volunteers at the scale of the UK, component countries or for smaller areas, such as counties.
This is largely because it is much more difficult to collect records from in the sea. There are far fewer initiatives for volunteer recording and these have been running for far less time than those on land. One of the larger citizen-science datasets from the marine environment is that of the Seasearch programme. Seasearch is a partnership of organizations led by the Marine Conservation Society that collects data on seabed species and habitats. The Seasearch programme is for volunteer scuba divers and snorkellers who record benthic marine species and habitats around the British Isles and adjacent seas. Seasearch as a distinct entity celebrated its 30th anniversary in 2018, although records extend back to the late 1970s. Now consisting of in excess of 800,000 spatial records for benthic species, it truly is an extensive, long-term time-series. Early records (pre-2000) were made mainly by members of the Marine Conservation Society (MCS) and associated organizations with some variation in survey protocol. Since the early 2000s, records have been collected in a consistent fashion with standardized protocols by volunteers managed through a team of regional coordinators. Data undergo a careful and robust quality assurance review (Bolton, Reference Bolton2018b) and are entered to the Joint Nature Conservation Committee (JNCC) Marine Recorder database from where all records are distributed under a Creative Commons ‘Attribution’ (CC-BY) licence via the National Biodiversity Network (NBN) Atlas.
Although commercial fisheries contribute only 0.12% of the UK economic output (Kemp et al., Reference Kemp, Froese and Pauly2020), they are regionally important for economy and culture (Durán et al., Reference Durán, Farizo and Rodríguez2015; Khakzad & Griffith, Reference Khakzad and Griffith2016). Fish stocks in the UK's seas have been depleted by over 120 years of industrial fishing (Dunkley & Solandt, Reference Dunkley and Solandt2021) and implementation of fisheries management has struggled to maintain stocks of key fish such as cod (ICES, 2019). Other species have fared even less well.
For example, in south-west England, Palinurus elephas (European spiny lobster or crawfish) became locally extinct in many places. It was easy to catch in inshore fisheries and commanded high prices (45–50 € kg−1), particularly in France and Spain (Goñi & Latrouite, Reference Goñi and Latrouite2005; Babbucci et al., Reference Babbucci, Buccoli, Cau, Cannas, Goni, Diaz, Marcato, Zane and Patarnello2010). The collapse during the 1970s and 1980s was likely due to a shift from using pots to unselective trammel nets and to excessive collection by divers (Hepper, Reference Hepper1977; Goñi et al., Reference Goñi, Quetglas and Reñones2004; Amengual-Ramis et al., Reference Amengual-Ramis, Vazquez-Archdale, Canovas-Perez and Morales-Nin2016; Hiscock, Reference Hiscock2019). Consequently, in the first 15 years of this century, very few fisheries targeting crawfish remained in the UK (Whomersley et al., Reference Whomersley, Van der Molen, Holt, Trundle, Clark and Fletcher2018).
There have been no formal stock assessments in the UK, so the current status is uncertain, but long-term patterns in landings do not tell a happy story. Landings in the NE Atlantic declined by > 50% from the mid 1990s to 2009 (FAO FishStatJ: Berger et al., Reference Berger, Sibeni and Calderini2020), in Atlantic France they dropped from a peak of >2600 t in 1947 to < 15 t y−1 during 2010–2015, with a slight recovery more recently (Latrouite & Lazure, Reference Latrouite and Lazure2005; Martial Laurans pers. comm.) and in England they peaked in 1969 at >100 t (Hepper, Reference Hepper1977) dropping to less than 5 t in 2005. Consequently, the species is classed as vulnerable by the IUCN and has been designated as a species of principal importance (as a Section 41 species in England (NERC Act 2006); as a Section 7 species in Wales (Environment (Wales) Act 2016); and as a priority marine feature in Scotland). It is a Species of Conservation Importance and a designated feature, with objectives to recover populations and spatial distribution to ‘favourable condition’ within several Marine Protected Areas (MPAs) in south-west England, including Lundy Marine Conservation Zone (MCZ), parts of the Isles of Scilly MCZ, The Manacles MCZ, Skerries Bank and Surrounds MCZ, Padstow Bay and Surrounds MCZ and Bideford to Foreland Point MCZ (Natural England, 2021). It is also rated at the worst end of the sustainability scale in the MCS Good Fish Guide (MCS, 2021). Two other Crustacea of economic value, similar size and with overlapping distributions are Cancer pagurus (edible or brown crab) and Homarus gammarus (European lobster). In England, stocks of these species are reported on biennially and, although there may be concerns about the fisheries and their management (Mesquita et al., Reference Mesquita, Dobby, Pierce, Jones and Fernandes2020), these have not shown the same catastrophic declines (CEFAS, 2020a, 2020b). On a much more positive note, however, there is good anecdotal evidence that crawfish have been undergoing a resurgence since 2014 (Bolton, Reference Bolton2018a; Hiscock, Reference Hiscock2019).
There is an increasing demand from fisheries managers and stakeholders to obtain information on stock status of exploited marine species (Mesquita et al., Reference Mesquita, Dobby, Pierce, Jones and Fernandes2020). Organizations with a vested interest in the crawfish fishery and its management met to discuss the situation at a workshop in April 2019. Participants agreed on a need to establish more firmly the spatial extent of the recovery and whether it was being sustained. Fisheries-dependent data may be difficult to interpret due to problems in standardizing catch rates (Miller et al., Reference Miller, Hooker and Fricke1990). Such problems may be avoided by using data that are independent of fisheries (Hilborn & Walters, Reference Hilborn and Walters1992). Thus alternative data, such as citizen science records, may provide a valuable source of information that could be used to support better assessment and management of fisheries and for species of conservation concern.
The present study applies a recently developed Bayesian occupancy model to unstructured citizen science data collected from coastal waters of Britain and Ireland over the period 2000–2020 focussing on Cancer pagurus, Homarus gammarus and Palinurus elephas. This was done in order to determine whether:
(i) Seasearch records from the UK can be used to provide informative estimates of population growth rates and trends in occupancy for three economically valuable Crustacea, at the spatial scales of countries or for smaller areas, thereby allowing comparisons among spatial units and among species;
(ii) anecdotal reports of recovery by P. elephas are borne out by formal analysis;
(iii) any population trends obtained are comparable with trends in fishery landings data;
(iv) trends differ between areas that are or are not designated as MPAs;
(v) they may help supplement formal, structured sampling programmes.
Materials and methods
Occupancy models
Occupancy models allow analysis of ‘presence-absence’ data from a set of sites through time. Repeated visits (survey events) within a sampling period (typically a year) are used to estimate the probability that a species is recorded if it is actually present at a site. There are two hierarchically coupled sub-models: one dealing with occupancy (presence vs absence), the other handling probability of observation (i.e. detection or non-detection) on repeat visits within the sampling period. For each species, the probability of detection is inferred from the records of other species in the assemblage. This allows generation of detection histories for use in occupancy models with what would otherwise be presence-only data (Kéry et al., Reference Kéry, Royle, Schmid, Schaub, Volet, Häfliger and Zbinden2010). Detection histories are sequences of presences or absences of a given species for a series of visits during a sampling period.
The occupancy model used here is that available within the Sparta software package (August et al., Reference August, Powney, Outhwaite, Harrower, Hill, Hatfield, Mancini and Isaac2021) developed and provided by the Centre for Ecology and Hydrology (CEH). The original approach developed by Isaac et al. (Reference Isaac, van Strien, August, de Zeeuw and Roy2014) was refined and improved by Outhwaite et al. (Reference Outhwaite, Chandler, Powney, Collen, Gregory and Isaac2018). Description and tests of these improvements and the specific details of the model are provided in Outhwaite et al. (Reference Outhwaite, Chandler, Powney, Collen, Gregory and Isaac2018), but briefly, the improvements included: (i) introduction of a random walk component for the occupancy priors to allow more precise estimates of occurrence and smoother trends, particularly where data are sparse, because information is shared between adjacent time periods in a biologically meaningful way; and (ii) replacement of prior estimates taken from a uniform distribution to those from a half-Cauchy distribution (Outhwaite et al., Reference Outhwaite, Chandler, Powney, Collen, Gregory and Isaac2018).
The base model used in Sparta (Isaac et al., Reference Isaac, van Strien, August, de Zeeuw and Roy2014) is split into two distinct sub-models: a state model and an observation model. The temporal precision of the model specified by the ‘closure period’ is one year. The observation sub-model estimates the probability of detection based on repeat visits to a site within years. The per-visit detection history of each species is inferred from records of other species in the assemblage.
The state model (equations (1) and (2)), describes the true occupancy state, zit, of site i in year t. This will be 1 if occupied or 0 if unoccupied. ψ it is the probability that a site is occupied and zit has a Bernoulli distribution:

where the logit of the probability of occurrence ψ it, varies with year and site:

with bt and ui denoting year- and site-effects, respectively.
According to the spatial scale of interest, the state model year-effect was partitioned in different ways to allow the estimation of occupancy for different areas within the UK. For instance, the year effect was split into components representing England, Wales and Scotland when considering the scale of ‘country’. Similarly, when considering smaller scales, the year effect was split into areas representing Isles of Scilly, Cornwall, North Devon, South Devon and Dorset. A third division separated visits by designation status, i.e. whether they occurred inside or outside MPAs in SW England (i.e. in the waters of Cornwall, Devon and Dorset). Visits were coded by the different categories by using ‘join by location’ in QGIS with polygons representing the different territorial waters, areal waters or MPA boundaries.
This means that, instead of having a single year effect in the state model as shown in equation (2), there is a year effect associated with each country, area or designation status. In the case of countries, let r(i) be the country (England, Scotland or Wales) in which site i is located, then:

where b tr(i) is the year effect for year t in country r in which site i occurs.
The observation sub-model describes the data collection process and is conditional on the true occupancy state zit. pitv denotes the probability that a species will be observed on a single visit, given that it is present at the site (zit = 1). Then the observation parameter yitv is described as being drawn from a Bernoulli distribution conditional on the true occupancy state:

According to this model, species may only be detected if they are present at a site, so if zit equals zero, then yitv will always be 0. If a site is occupied (i.e. zit = 1) then equation (4) gives y itv ~ Bernoulli(p itv).
Variation in detection probabilities (pitv) per site, per year and between visits is then modelled as follows:

where at is a year effect and Litv is the list length, defined as the number of taxa recorded during a single visit v to site i in year t. Parameter c represents the relationship between overall sampling effort and the detection probability of the focal species. List length is used as a proxy for sampling effort per visit (Franklin, Reference Franklin1999; Szabo et al., Reference Szabo, Vesk, Baxter and Possingham2010), and it is assumed that the detectability of a species will co-vary with sampling effort (i.e. generally c > 0). In a previous application of this approach (Outhwaite et al., Reference Outhwaite, Powney, August, Chandler, Rorke, Pescott, Harvey, Roy, Fox, Roy, Alexander, Ball, Bantock, Barber, Beckmann, Cook, Flanagan, Fowles, Hammon, Harvey, Hepper, Hubble, Kramer, Lee, MacAdam, Morris, Norris, Palmer, Plant, Simkin, Stubbs, Sutton, Telfer, Wallace and Isaac2019), list length was included using a categorical specification, with lists of length 1, 2–3 or 4+. In the present study, a continuous specification was retained due to the typically large list-lengths (often up to 50) relative to samples from the terrestrial environment, where the three categories of short list length seemed inappropriate.
For Bayesian models, each of the unknown parameters to be estimated needs to be assigned a prior distribution that reflects our understanding of the system, in advance of data collection. When analysing ecological data, we often know very little about the system and so vague priors are typically used. With the exception of the year effect (b t), all parameters were assigned vague priors. The parameters describing the distributions of these priors (i.e. hyperpriors, e.g. σ 2) were assigned half-Cauchy distributions based on Cauchy distributions with location 0 and scale parameter 1 (which is the same as the modulus of Student's t distribution with 1 degree of freedom (d.f.)), as recommended by Outhwaite et al. (Reference Outhwaite, Chandler, Powney, Collen, Gregory and Isaac2018).


and

The year effect, b t, uses a ‘random walk’ prior, which improves the precision of occupancy estimates by allowing for yearly variation among probability distributions. Thus:

where,

The Sparta occupancy model selected (using ‘random walk’ design, with half-Cauchy distribution of priors) gives greater precision than other models applied previously (Outhwaite et al., Reference Outhwaite, Chandler, Powney, Collen, Gregory and Isaac2018, Reference Outhwaite, Powney, August, Chandler, Rorke, Pescott, Harvey, Roy, Fox, Roy, Alexander, Ball, Bantock, Barber, Beckmann, Cook, Flanagan, Fowles, Hammon, Harvey, Hepper, Hubble, Kramer, Lee, MacAdam, Morris, Norris, Palmer, Plant, Simkin, Stubbs, Sutton, Telfer, Wallace and Isaac2019). This approach appears to be the most appropriate for estimating population trends, particularly where the number of records is not large (as happens where sampling intensity is not great and/or areas of interest are small) or inhabited range is small. This model also provides estimates of uncertainty (Outhwaite et al., Reference Outhwaite, Chandler, Powney, Collen, Gregory and Isaac2018, Reference Outhwaite, Powney, August, Chandler, Rorke, Pescott, Harvey, Roy, Fox, Roy, Alexander, Ball, Bantock, Barber, Beckmann, Cook, Flanagan, Fowles, Hammon, Harvey, Hepper, Hubble, Kramer, Lee, MacAdam, Morris, Norris, Palmer, Plant, Simkin, Stubbs, Sutton, Telfer, Wallace and Isaac2019). The models were implemented in the R programming environment (version 4.0.3, R Core Team, 2021) and fitted with the JAGS programme for analysis of Bayesian hierarchical models (Plummer, Reference Plummer2003).
One assumption of an occupancy model is that recording one taxon tells you something about a taxon that was not recorded. In terrestrial recording, records are typically made within restricted taxonomic contexts (e.g. dragonflies or water-beetles or lichens). This is not so within Seasearch. During Seasearch surveys, as many organisms as possible that can be reliably identified in situ are recorded, irrespective of taxonomic classification. This provides a ‘complete list’ on each visit (Isaac & Pocock, Reference Isaac and Pocock2015). A ‘complete list’ is where a record is made for each species observed (rather than just incidental records of ‘interesting’ species). This is not the same as saying that all species present and observable were actually observed, but rather just that all species observed were reported. This means that a very large pool of records for many taxa are available to be used by the model when estimating probabilities of detection.
The focus of this study was crawfish, brown crab and lobster. The model was fitted and population trends generated for each of these species with 30,000 Markov chain Monte Carlo (MCMC) iterations for three Markov chains, with a thinning rate of three. The first 10,000 iterations were discarded as ‘burn-in’ since early values of the chain can be influenced strongly by the initial values chosen for parameters (Outhwaite et al., Reference Outhwaite, Chandler, Powney, Collen, Gregory and Isaac2018). Whether or not estimates of occurrence had converged by the end of the iterations was determined using the Gelman-Rubin statistic (Rhat), which compares within-chain variance to between-chain variance (Gelman & Rubin, Reference Gelman and Rubin1992). Convergence was considered acceptable when the Rhat value was below 1.1 (Kéry & Schaub, Reference Kéry and Schaub2012).
This analysis allowed, to my knowledge, the first estimation of species occupancy for any benthic marine species in the UK.
Data collection and processing
The raw data used here were occurrence records collected by Seasearch volunteers, held by Seasearch and available through the NBN Atlas (https://nbnatlas.org/; https://doi.org/10.15468/kywx6m; https://doi.org/10.15468/0hyjxi; https://doi.org/10.15468/4us2hk; https://doi.org/10.15468/pyugge; https://doi.org/10.15468/0ppp4p; https://doi.org/10.15468/mxkbcg). For some taxa, publicly available data are provided at a resolution coarser than the original records used here. Data collection protocols have remained unchanged since the start of this century. This means all taxa can be treated in the same analysis and that Seasearch records from 2000 onwards can be used in their entirety, with consequent greater ability to estimate detectability of the modelled species (than if smaller taxonomic subsets were used).
The dataset was first filtered for desired spatial and temporal coverage and standardized to meet the requirements of the model such that:
• The location of the record was within the waters of the British Isles and adjacent seas (i.e. including England, Scotland, Wales, Ireland, Isle of Man and the Channel Isles).
• Only records more recent than 01/01/2000 were used.
• Taxonomic determinations above the level of Family were eliminated.
• All records were marked as being ‘alive’ and ‘certain’.
• The date of the record was known to the day (true for all Seasearch records).
• The position of the record was known to at least 1 × 1 km precision (true for all Seasearch records).
• Veracity of taxonomic determinations was reviewed by regional experts as per the Seasearch QC process (Bolton, Reference Bolton2018b).
• When, within any monospecific genus (according to Marine Species for the British Isles and Adjacent Seas – MSBIAS; www.marinespecies.org/msbias/), there existed some records determined only to genus, all entries were altered to the species.
• Seasearch surveys often include multiple samples (from different habitats) at a single location. Occupancy models tend not to resolve this level of detail yet, so all records from a site are treated together, with duplicate records from a dive being eliminated (i.e. where the same taxon was recorded in multiple samples). If data are finely enough resolved then it may be possible to fit models that treat sites and habitat independently.
• Multiple visits to the same site on the same day (i.e. multiple divers submitted separate records from the same 1 × 1 km grid square on the same day) were treated as ‘replicates’ in the model.
Data-fields used were the simple ‘what, when, where’ required by the Sparta model, with ‘what’ being the taxon recorded, ‘when’ the calendar date it was recorded and ‘where’ was the position. Recorded positions are considered accurate to about 70 m, but were scaled-up to 1 × 1 km grid cell resolution in order to maximize the number of visits to a ‘site’ within a sampling period (i.e. year) whilst retaining spatial resolution fine enough to be useful. These 1 × 1 km cells coincided with those of the British National Grid, but were extended offshore where necessary.
Tools within Sparta were then used to create detection histories from the standardized data for each site. Annual estimates of occupancy were extracted separately for countries (England, Wales and Scotland), for areas in the south-west of England (Isles of Scilly, Cornwall, North Devon, South Devon and Dorset) and for areas in south-west England that were or were not designated as MPAs.
Changes in the probabilities of annual occupancy through time define trends in species occupancy, where occupancy is the proportion of surveyed grid-cells where the modelled species is present. Species trends were estimated as the annual percentage growth-rate using the first and last years for which that species had records. As ψ it is the annual occupancy estimate for a site i in year t, the mean occupancy for all (n) sites in year t is ψ¯ t = $( \mathop \sum \nolimits_{i = 1}^n$ ψ it/n), the yearly growth rate for a site is λit = (ψ it/ψ it−1), the average growth-rate for a given year is λ¯t = (ψ¯ t/ψ¯ t−1), the total growth-rate is λT = (ψ f/ψ s) and the annual growth-rate as a percentage is λ = ((ψ f/ψ s)1/y − 1) × 100, where f was the occupancy in the final year, s was the occupancy in the starting year and y was the number of years. The calculation for annual growth-rate assumes a monotonic change in growth, where occupancy changes by the same proportion each year.
For each country or area, annual growth-rate in species occupancy was calculated for the time-period between the first and last records for each of 1000 samples from the posterior distribution of estimates for annual occupancy. These were then used to calculate mean annual growth-rates, an equal-tailed 95% credible interval (C.I.) and a measure of precision (estimated as the inverse of the variance of the 1000 values for growth-rate). Credible intervals (rather than confidence intervals) are used, as appropriate for Bayesian analyses. Using first and last records for a species rather than always using the full 21 years (i.e. 2000–2020) avoided extrapolation beyond the actual data. The mean estimated occupancies (with 95% C.I.) for each year were then plotted to show the population trend for that species in that area. Samples of the posterior distribution of occupancy for each area per species per year are provided (Supplementary materials 1; one file per species per set of areas).
To help reduce temporal bias in geographic coverage caused by uneven sampling, sites can be filtered according to the number of years when records were made. Such filtering will increase spatial bias, which may or may not be preferable depending on the goal of the modelling. Early studies using this method required sites to have records in at least 3 years (Isaac & Pocock, Reference Isaac and Pocock2015; Powney & Isaac, Reference Powney and Isaac2015). Kamp et al. (Reference Kamp, Oppel, Heldbjerg, Nyegaard and Donald2016) analysing trends in populations of Danish birds demonstrated, however, that precision is greater when using unfiltered data. So, to maximize the extractable information whilst excluding sites with no information about change, a minimal threshold of 2 years of data was set when selecting sites (following Outhwaite et al., Reference Outhwaite, Powney, August, Chandler, Rorke, Pescott, Harvey, Roy, Fox, Roy, Alexander, Ball, Bantock, Barber, Beckmann, Cook, Flanagan, Fowles, Hammon, Harvey, Hepper, Hubble, Kramer, Lee, MacAdam, Morris, Norris, Palmer, Plant, Simkin, Stubbs, Sutton, Telfer, Wallace and Isaac2019).
To help ensure that ‘adequate’ data are used by the model, criteria were set, which if not met, precluded the model from running. In previous studies (Outhwaite et al., Reference Outhwaite, Chandler, Powney, Collen, Gregory and Isaac2018, Reference Outhwaite, Powney, August, Chandler, Rorke, Pescott, Harvey, Roy, Fox, Roy, Alexander, Ball, Bantock, Barber, Beckmann, Cook, Flanagan, Fowles, Hammon, Harvey, Hepper, Hubble, Kramer, Lee, MacAdam, Morris, Norris, Palmer, Plant, Simkin, Stubbs, Sutton, Telfer, Wallace and Isaac2019) these criteria were a maximal gap in records of 10 years and a minimum of 50 records in the area of interest. These may be perceived as rather low thresholds. Although low thresholds provide access to more data, more stringent criteria are used here, i.e. a maximal gap in records of 5 years and a minimum of 100 records in the area of interest. This is justified because smaller amounts of good quality data are better than lots of poor data (Meng, Reference Meng2018) and can offset somewhat the biases prevalent in citizen science data which greatly reduce the effective sample size.
Graphical checks were used to increase confidence in the suitability of the model selected and of the trends produced. These included inspection of:
(i) patterns of potential bias in when or where records were collected;
(ii) patterns in simulations of probabilities of occupancy;
(iii) traceplots of individual chains to check that parameters have converged.
Patterns in data collection can mask, enhance or otherwise confound any observed trends in occupancy. To assess whether different forms of spatial or temporal bias in collection of Seasearch records were explored using the R package occAssess (Boyd et al., Reference Boyd, Powney, Carvell and Pescott2021). Forms of bias considered were variation in: sampling intensity through time, taxonomic coverage, proportion of records made to species, taxonomic bias, spatial coverage and spatial clustering. Simulations of occupancy and traceplots were inspected for a subset of model outputs, specifically those showing notable and interesting trends (details provided in Supplementary materials 2 & 3).
Using a desktop PC with Intel® Core™ i7-8700 CPU @ 3.20 GHz, 32 GB RAM, 64-bit operating system, ×64-based processor, running Windows 10 Pro, the code to run models for three species partitioned into three different sets of spatial scales (countries, areas or MPAs) took just under 14 h to complete. Supplementary materials 1 contains the raw data, supporting files and code to run the model, plus key outputs from the model (e.g. posterior estimates of occupancy, population growth-rates and Rdata files used for Supplementary materials 3).
Results
The standardized Seasearch dataset consisted of 535,043 records from 19,763 visits to 5232 unique 1 × 1 km grid cells around Great Britain, Ireland and adjacent seas, covering 2450 taxa over 21 years (2000–2020) (Figure 1). Distributions of records for each of H. gammarus, C. pagurus and P. elephas revealed marked differences in the spatial distribution of where they were observed by Seasearch (Figure 2). These maps do not reflect temporal change in numbers of records or of distribution and are simply cumulative totals of records for each grid-square. Homarus gammarus and C. pagurus are distributed throughout the area, whereas records for P. elephas are concentrated mainly in the south-west of England, with populations in the Channel Isles and Pembrokeshire, scattered records round southern and western Ireland and right up the west coast of Scotland to the Orkney Islands and occasional, isolated records from north-east Scotland and Northumberland (Figure 2). The total numbers of records for H. gammarus (5435) and C. pagurus (10,172) are also much greater than that for P. elephas (618).
The number of taxonomic records collected by Seasearch at sites visited between 2000 and 2020. The map is plotted at 10 × 10 km resolution but data exist and were modelled at a scale of 1 × 1 km grid cells. The apparently erroneous point in eastern England is actually a record for a harbour seal in the River Nene in Peterborough.

The total number of taxonomic records collected by Seasearch for three focal species, at sites visited more than twice between 2000 and 2020. The maps are plotted at 10 × 10 km resolution but data exist and were modelled at a scale of 1 × 1 km grid cells. Species name, the number of records and the number of 10 × 10 km cells with records are shown above each map.

Population trends are plotted (Figures 3–5) and summary data (Tables 1–3) provided for three different regional scales (countries in Great Britain, areas in south-west England and protected area status in south-west England). Population trends and growth-rates for C. pagurus and H. gammarus could be estimated using Seasearch records for countries and areas other than those presented here, but as the focus was on contrasting with P. elephas (which is not abundant in other areas), are not included in the present study. Plots are missing where there were insufficient data (with >5 years between records or fewer than 100 records in each country or area). The rug plot at the top of each grid indicates years with records (marker present) and a measure of sampling effort (darker markers indicate more records). Points in light grey on the population trends have a Gelman-Rubin statistic (Rhat) considered too large for the model to have converged and for the estimate to be robust (Gelman & Rubin, Reference Gelman and Rubin1992; Kéry & Schaub, Reference Kéry and Schaub2012). These values should be disregarded. Estimates of occupancy should also be treated cautiously where the C.I. is large. Credible intervals are typically wider at the start of the time-series because there are fewer records and because prior values will have a relatively greater effect on estimates. In each case presented here, the C.I. was greatest at the start, but had narrowed and stabilized after about 5 years. There is no guidance about the size of C.I. where estimates decrease in their usefulness, but for any two time-points, if the C.I. do not overlap, it is clear that there has been an appreciable change in occupancy.
Estimated proportions of occupied sites from 2000 to 2020 after 30,000 iterations of the random-walk, half-Cauchy occupancy model (Outhwaite et al., Reference Outhwaite, Chandler, Powney, Collen, Gregory and Isaac2018) comparing three species of large Crustacea (C. pagurus, H. gammarus and P. elephas) in three different countries (England, Wales, Scotland). The points represent mean occurrence and the grey ribbon shows 95% credible intervals. Dark-grey points indicate a Gelman and Rubin statistic (Rhat) of <1.1 (models have converged). The presence of markers in the rug plot along the top of each grid shows whether or not records were present in each year, where the darkness of the mark is correlated with the number of records in that year. Where plots are missing, there were insufficient records to run the model. Countries are ordered by decreasing numbers of records and species are ordered alphabetically.

Estimated proportions of occupied sites from 2000 to 2020 after 30,000 iterations of the random-walk, half-Cauchy occupancy model (Outhwaite et al., Reference Outhwaite, Chandler, Powney, Collen, Gregory and Isaac2018) comparing three species of large Crustacea (C. pagurus, H. gammarus and P. elephas) in five areas in south-west England (Isles of Scilly, Cornwall, North Devon, South Devon and Dorset). The points represent mean occurrence and the grey ribbon shows 95% credible intervals. Points are coloured according to Gelman and Rubin statistic (Rhat): Dark-grey for values <1.1 (converged) and light-grey for values >1.1 (not converged). The presence of markers in the rug plot along the top of each grid shows whether or not records were present in each year, where the darkness of the mark is correlated with the number of records in that year. Where plots are missing, there were insufficient records to run the model. Areas are ordered from west to east and species ordered alphabetically.

Estimated proportions of occupied sites from 2000–2020 after 30,000 iterations of the random-walk, half-Cauchy occupancy model (Outhwaite et al., Reference Outhwaite, Chandler, Powney, Collen, Gregory and Isaac2018) comparing three species of large Crustacea (C. pagurus, H. gammarus and P. elephas) in areas either inside or outside marine protected areas in south-west England. The points represent mean occurrence and the grey ribbon shows 95% credible intervals. Dark-grey points indicate a Gelman and Rubin statistic (Rhat) of <1.1 (models have converged). The presence of markers in the rug plot along the top of each grid shows whether or not records were present in each year, where the darkness of the mark is correlated with the number of records in that year. Where plots are missing, there were insufficient records to run the model. Species are ordered alphabetically.

Summary data for annual growth-rates for occupancy in three countries (England, Wales, Scotland) for three species of Crustacea (C. pagurus, H. gammarus and P. elephas) including the number of years of data, the first and last years used to estimate growth-rate, and the number of records of this species contributing to the occupancy estimates

The median annual growth-rate in occupancy and 95% credible intervals (C.I.) are supplied along with the precision of the estimate. Gaps occur where the number of records has not reached the threshold (100) for occupancy growth-rates to be calculated or where there is a gap of more than 5 years in the records.
Summary data for annual growth-rates for occupancy in five areas in south-west England (Isles of Scilly, Cornwall, North Devon, South Devon and Dorset) for three species of Crustacea (C. pagurus, H. gammarus and P. elephas) including the number of years of data, the first and last years used to estimate growth-rate, and the number of records of this species contributing to the occupancy estimates
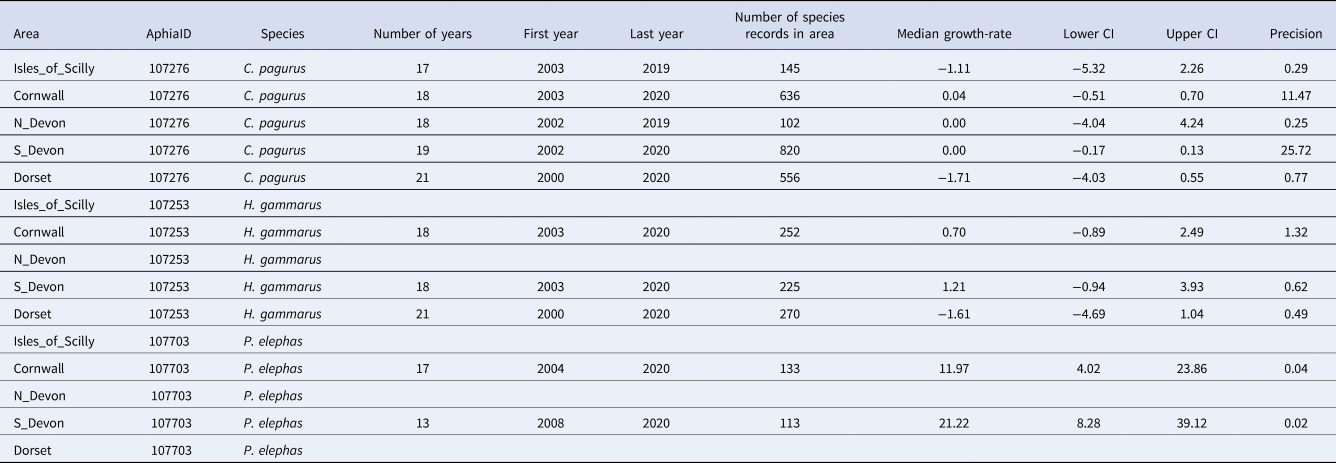
The median annual growth-rate in occupancy and 95% credible intervals (C.I.) are supplied along with the precision of the estimate. Gaps occur where the number of records has not reached the threshold (100) for growth-rates to be calculated or where there is a gap of more than 5 years in the records.
Summary data for annual growth-rates for occupancy in areas that are or are not designated as a marine protected area in south-west England (MPA or NOT MPA) for three species of Crustacea (C. pagurus, H. gammarus and P. elephas) including the number of years of data, the first and last years used to estimate growth-rate, and the number of records of this species contributing to the occupancy estimates
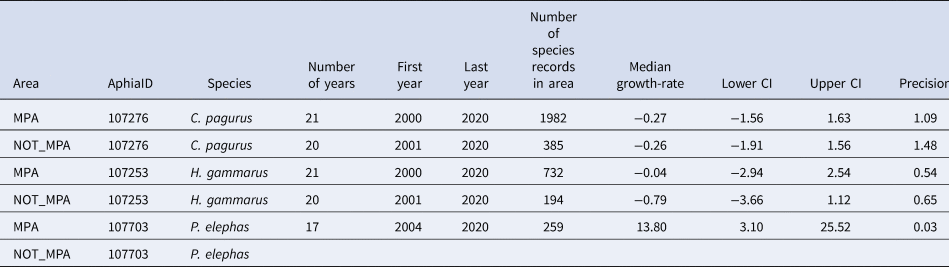
The median annual growth-rate in occupancy and 95% credible intervals (C.I.) are supplied along with the precision of the estimate. Gaps occur where the number of records has not reached the threshold (100) for growth rates to be calculated or where there is a gap of more than 5 years in the records.
Estimates of population trends at the scale of countries revealed major differences in trajectories among species and among countries. Homarus gammarus and C. pagurus have much greater occupancy than does P. elephas (Figure 3), a pattern entirely consistent with the distribution of H. gammarus and C. pagurus round the whole coastline (Figure 2).
In England, the population of P. elephas showed a marked upturn since 2014, increasing from an occupancy of close to 0 up to 0.25–0.3 (Figure 3). The growth-rates in occupancy observed would lead to a population increase of >100% over 25 years and is far greater than the threshold of 2.81% per annum used to define a strong increase (Hatfield et al., Reference Hatfield, Powney, Outhwaite, August and Isaac2019). For C. pagurus occupancy was large (>0.8) and more consistent, with no clear trends. Occupancy for H. gammarus varied strongly among countries, with no marked increases or decreases. Occupancy was greatest in Wales (~0.75), less in England (~ 0.6) and least in Scotland (~ 0.3).
When considering trends at the scale of areas in south-west England, the changes in occupancy by P. elephas were even more extreme, increasing in Cornwall from < 0.2 to >0.8, with very few Cornish records prior to 2013 causing large variability in estimates of occupancy for these years (Figure 4, Table 2). A similar, although less pronounced pattern was apparent for records from South Devon during these 21 years. After 2017, there was some suggestion of levelling-off in South Devon, but occupancy continued to increase in Cornwall. Whilst there were records of P. elephas from the Isles of Scilly, North Devon (mostly Lundy) and Dorset, they were not sufficient to exceed the minimum threshold (100) required to run the models. Cancer pagurus was the species with greatest occupancy, although in the Isles of Scilly and in Dorset, there was a declining trend over the last 10 years of records, each going from ~0.9 to 0.75 occupancy (Figure 4). In North Devon, occupancy from 2010–2020 (0.85–0.95) was greater than the previous decade (0.75–0.85). The credible intervals were very large, particularly for the earlier decade, suggesting that occupancy estimates lack sufficient precision to be informative and should be treated with caution. Trends for H. gammarus varied among counties, decreasing over the last 10 years in Dorset, remaining roughly constant in Cornwall and increasing over the last decade in South Devon (Figure 4).
If population trends in south-west England are considered in relation to protected area status, it is clear that, for C. pagurus and H. gammarus, there were more records within MPAs than without (Figure 5, Table 3). For each, there was little perceivable difference in trend depending on whether or not sites are in protected areas. For P. elephas, there are as yet, inadequate numbers of records to estimate occupancy for P. elephas outside of MPAs. An increase in occupancy was obvious in MPAs since 2014, with a dip in the last 2 years (Figure 5).
Sources of potential bias in collection of Seasearch data are presented and explained in detail (Supplementary materials 2). There were no obvious patterns in data collection that might prevent actual change in occupancy being the most parsimonious explanation for the population trends observed. In particular, there was little evidence of strong recent change in the spatial footprint of recording, over the periods when there were changes in estimates of occupancy.
In addition to satisfactory values of Rhat, there was little suggestion from trace plots of MCMC chains that parameters had not converged (Supplementary materials 3). It is also important to consider whether the assumed model is appropriate and whether estimated trends in occupancy are unlikely under the random walk model. Supplementary materials 3 contains some discussion around this issue.
Discussion
Conservation planning for species that live on the seafloor is challenging because (1) data on population-size and distribution may be insufficient to assess current status, (2) collection of such data may be difficult due to inaccessible habitat, cryptic and/or nocturnal behaviours, or uncertain identification, (3) meaning that understanding of ecology and potential threats may be inadequate to prescribe appropriate management actions (Gillespie et al., Reference Gillespie, Fukuda and McDonald2020). Organizations responsible for biodiversity conservation need to collect or have access to appropriate data such that they are able to manage better and thereby conserve important species.
Multiple options are available when parameterizing occupancy models in Sparta. The selections used here (Methods: occupancy models) are considered appropriate given the characteristics of Seasearch data. In particular, there was little evidence of spatial bias (geographic distribution of records was fairly consistent through time; Supplementary material 2). List-length is assumed to be a good proxy for sampling effort (within a sample) and inclusion of this term in the detection sub-model should help mitigate the increasing sampling intensity (number of samples) over time. The random walk component of the model (where estimates of occupancy are influenced by those in the adjacent years) is considered appropriate since the three species studied are long-lived and populations are unlikely to feature large proportions of annual immigrants or emigrants. That said, the first recruits in the recovery of P. elephas must have come from somewhere. Populations in the south-west were so depauperate that it seems unlikely that it was a result of self-seeding, although a study modelling dispersal of P. elephas larvae suggested that given a suitable starting population, this would be possible in some locations, but not others (Whomersley et al., Reference Whomersley, Van der Molen, Holt, Trundle, Clark and Fletcher2018). Genetic studies may be able to determine whether the source was from deeper waters around Britain and Ireland or from further afield.
Because records collected by Seasearch include any readily identifiable organisms, irrespective of taxonomic affiliation, it is difficult to make comparisons with the Low-Medium-High levels of sampling intensity described by Isaac et al. (Reference Isaac, van Strien, August, de Zeeuw and Roy2014). It is clear, however, that the total number of records (535,043) is very large and the number of records per species depends very much on which species and the area being considered (for example in England there were 4423 records for C. pagurus, but 689 in Wales, and for P. elephas there were 303 records in England, but <100 in Wales or Scotland).
The increasing trend in P. elephas occupancy is heartening, and it would clearly be undesirable for harvesting of crawfish to return to earlier unsustainable levels and for populations to be decimated again. In order to ensure a viable population with sustainable contribution to fisheries, careful management will be required. In England, fisheries within the 6-nautical mile limit are managed by the Inshore Fisheries Conservation Authorities (IFCAs). A range of regulations are already in place to protect P. elephas, including minimal landing size (varies among regions from 95–110 mm carapace length), return of berried females and a permitting scheme for commercial capture of C. pagurus, H. gammarus and P. elephas with mandatory reporting (CIFCA, 2016). Voluntary tag and release programmes by Cornwall and Isles of Scilly IFCAs are in place for undersized specimens. Fishermen and citizen scientists (e.g. Seasearch participants) are encouraged to report information about size of individuals caught. Other conservation initiatives exist, such as the ‘Hands off our crawfish’ campaign by Cornwall Wildlife Trust, which encourages divers and dive operators not to collect P. elephas. Palinurus elephas are listed as designated features with conservation objectives in several MPAs in south-west England, including Lundy Marine Conservation Zone (MCZ), parts of Isles of Scilly MCZ, The Manacles MCZ, Skerries Bank and surrounds MCZ, Padstow Bay and surrounds MCZ, Bideford to Foreland Point MCZ, with objectives to recover populations to favourable condition.
Since 2014, these five MPAs have had the following numbers of Seasearch records for crawfish: Lundy MCZ (6), Isles of Scilly MCZ (13), The Manacles MCZ (15), Skerries Bank and surrounds MCZ (10), Padstow Bay and surrounds MCZ (12), Bideford to Foreland Point MCZ (1). Whilst some of these numbers are encouraging, they will partly reflect varying survey effort among the MPAs and the numbers as yet, fall well below the minimal threshold required to consider running an occupancy model at the scale of a single MPA.
A new UK Fisheries Policy, to be implemented as one of the consequences of Brexit, that provides emphasis on maximum sustainable yield, coherent management and enforcement of protection in a network of MPAs (Kemp et al., Reference Kemp, Froese and Pauly2020) could contribute to greater security of many fisheries. If the population of P. elephas continues to expand eastwards to Dorset and Hampshire, there may be a case for including it as a feature in other MCZs with suitable habitat. In 2018 and 2019, there were increasing numbers of crawfish recorded by Seasearch right through Lyme Bay and to the east of Portland. Crawfish records have now been made in each of Lyme Bay & Torbay SAC, Studland to Portland SAC, Chesil Beach and Stennis Ledges MCZ and Purbeck Coast MCZ, some with more recent records than in MPAs designated for the species. Not all of these records were collected using the Seasearch survey methods and some came from commercial fishers or from posts on social media, which may be less reliable and were not included in the dataset used for occupancy models. The most easterly record was of three large adults caught in a net from Christchurch Ledge, Dorset in 2019.
As it stands, there is already concern about a lack of stability in the P. elephas population (CGSG, 2021). The occupancy trends presented here, in several instances (e.g. England, South Devon and in MPAs) show a levelling off of population growth in the last couple of years. This may just be populations reaching ‘natural’ maxima or may be a function of renewed interest and effort from fishers. The lack of good data about population size and distribution from prior to the crash in the 1970s makes it difficult to assess reliably, the extent and completeness of the present recovery. Whilst landings of P. elephas to UK ports have increased steadily, more than doubling since 2005 (MMO, 2020), there are indications of recent declines in catch per unit effort in Cornwall (Trundle et al., Reference Trundle, Jenkin, Sturgeon, Owen and Naylor2018).
Whilst H. gammarus and C. pagurus are not themselves designated features of any MPA, they are influential components of benthic assemblages, particularly in reef habitat, which is itself often a designated feature of MPAs. Methods for recording landings of crab and lobster have been consistent since 2009 (CEFAS, 2020a, 2020b). Annual stock assessments in the Western English Channel indicate a decline in landings for C. pagurus since 2014 (CEFAS, 2020a), which is consistent with the patterns of occupancy observed in Dorset, North Devon and Isles of Scilly, but not Cornwall (Figure 4). Landings for H. gammarus in the south-west have shown a gradual increase over the last 10 years (CEFAS, 2020b), a pattern recorded by Seasearch divers in South Devon, but not elsewhere (Figure 4). It is reassuring (from a methodological standpoint) that in several cases, similar trends for an area are being observed from very different methods of data collection (i.e. fisheries landings and observations by citizen scientists). There are, of course, numerous good reasons why patterns in landings may not match those in records from divers. Shellfish landed may have been caught in other areas, landings or effort may be mis-reported, shellfish landed may have come from depths not accessible to divers, standardization of catch-rates can be difficult (Mesquita et al., Reference Mesquita, Dobby, Pierce, Jones and Fernandes2020) and regulations in the EU Common Fisheries Policy governing landings also make it difficult to determine trends in underlying stocks (Thurstan et al., Reference Thurstan, Brockington and Roberts2010; Catchpole et al., Reference Catchpole, Ribeiro-Santos, Mangi, Hedley and Gray2017).
An original intention of the study was to make comparisons in population trends for P. elephas between those recorded inside MPAs in south-west England (several of which are designated specifically for this species or are at least designated for reef habitat where the species often occurs) and those in undesignated areas within the same region. Unfortunately, the number of records from undesignated areas did not meet the requisite threshold and comparisons were not possible. For the other two species, smaller numbers of records were also obtained for areas outside of MPAs, likely to be due to some combination of: a greater proportion of seabed in the region being inside than outside MPAs, MPAs being designated for habitats associated with these taxa, popular dive sites often being inside MPAs. The smaller numbers of records from outside MPAs is reflected in the broader credible intervals (Figure 5). Dates of designation vary among MPAs, so the area of designated seabed varies through time and records from nominally designated areas also include those from before the MPA was designated. The model does not account for these complexities, so additional care is required when interpreting any similarities or differences in trends between designation statuses.
Levels of precision (inverse of the variance in estimates of occupancy) can form an important component when interpreting trends, but there is no clear framework by which to judge when levels of uncertainty around outputs exceed some level of acceptability such that they no longer provide useful information. Levels of acceptability may, in fact, vary from circumstance to circumstance. The most data-poor scenarios are already excluded from the model (i.e. for taxa with fewer than 100 records and/or gaps of more than 5 years between records). Where precision is small (i.e. where credible intervals span a large proportion of the possible range of occupancy), estimates of occupancy should be treated with caution, particularly during early years of the trend. Forms of bias other than temporal variation in detection probabilities are prevalent in unstructured citizen-science data. An important aspect of studies using occupancy models, is to assess patterns in data collection that may influence trends in occupancy. Tools to do this (e.g. occAssess) are increasingly available.
Citizen science records such as those in Seasearch, are increasingly recognized to have value which has not yet been fully exploited. Occupancy models using data from the Seasearch programme clearly have the potential to be able to provide information about population trajectories of benthic organisms on an annual basis. The wide spatial coverage of this programme will offer many advantages over the limited remit of commercial or targeted surveys. Whilst such citizen science data may not be a direct analogue of structured data collection nor produce estimates that are as close to reality, in the absence of other sources of equivalent data, they should provide a valuable source of information. Much fuller use should be made of the Seasearch dataset in order to provide population trends for a wide variety of taxa, and for development of biodiversity indicators, much akin to the approach used for terrestrial and freshwater organisms in the State of Nature report (Hatfield et al., Reference Hatfield, Powney, Outhwaite, August and Isaac2019; Hayhow et al., Reference Hayhow, Eaton, Stanbury, Burns, Kirby, Bailey, Beckmann, Bedford, Boersch-Supan, Coomber, Dennis, Dolman, Dunn, Hall, Harrower, Hatfield, Hawley, Haysom, Hughes, Johns, Mathews, McQuatters-Gollop, Noble, Outhwaite, Pearce-Higgins, Pescott, Powney and Symes2019). Such trends will have broad relevance and applicability for fisheries managers, statutory nature conservation bodies, government agencies and conservation non-governmental organizations.
Conclusions
Seasearch data are demonstrably suitable for application to Bayesian occupancy models.
(1) The data are collected with appropriate spatial and temporal precision.
(2) There is a careful curation process such that taxonomic determinations are believable.
(3) For the three taxa considered here (and likely for very many more), numbers of records are adequate to estimate population trends at the scale of country within Great Britain. In some cases, data are sufficiently plentiful to produce trends at smaller spatial scales. Whilst trends can be estimated, in isolation, their believability is uncertain and it is important to consider and assess sample size and potential sources of bias (which are strongly related; Meng, Reference Meng2018) alongside them.
Application of the ‘random walk’ occupancy modelling framework using half-Cauchy distribution of priors based on Outhwaite et al. (Reference Outhwaite, Chandler, Powney, Collen, Gregory and Isaac2018, Reference Outhwaite, Powney, August, Chandler, Rorke, Pescott, Harvey, Roy, Fox, Roy, Alexander, Ball, Bantock, Barber, Beckmann, Cook, Flanagan, Fowles, Hammon, Harvey, Hepper, Hubble, Kramer, Lee, MacAdam, Morris, Norris, Palmer, Plant, Simkin, Stubbs, Sutton, Telfer, Wallace and Isaac2019), has produced a 20-year dataset of annual occupancy estimates for three economically important crustaceans. Rapid and large increases in occupancy by P. elephas in Devon and Cornwall over the last 5 years reflect patterns described in anecdotal reports and there is good evidence thatthe species had made a strong start to recovery from catastrophic decline towards the end of the last century. This fishery-independent method for assessing populations often, but not always, matches trends from fishery landings data.
Kamp et al. (Reference Kamp, Oppel, Heldbjerg, Nyegaard and Donald2016) warn of limitations to the utility of unstructured citizen science data to produce the same trends detected by planned, structured recording schemes. Recent improvements to the modelling framework applied to citizen science data (Outhwaite et al., Reference Outhwaite, Chandler, Powney, Collen, Gregory and Isaac2018, Reference Outhwaite, Powney, August, Chandler, Rorke, Pescott, Harvey, Roy, Fox, Roy, Alexander, Ball, Bantock, Barber, Beckmann, Cook, Flanagan, Fowles, Hammon, Harvey, Hepper, Hubble, Kramer, Lee, MacAdam, Morris, Norris, Palmer, Plant, Simkin, Stubbs, Sutton, Telfer, Wallace and Isaac2019) will help to mitigate some but not all of these limitations. The Seasearch sampling methods also avoid one of the main deficiencies of many datasets collected by the public. Virtually all records are part of ‘complete lists’ of species (sensu Isaac & Pocock, Reference Isaac and Pocock2015 – see Methods), which allow inference about non-detection of species rather than being incidental records of a sub-set of species actually observed (Kéry et al., Reference Kéry, Royle, Schmid, Schaub, Volet, Häfliger and Zbinden2010; Tulloch et al., Reference Tulloch, Mustin, Possingham, Szabo and Wilson2013; Isaac et al., Reference Isaac, van Strien, August, de Zeeuw and Roy2014). The greater information content of such datasets should improve the probability that estimates of occupancy derived from them actually reflect reality (Kéry et al., Reference Kéry, Royle, Schmid, Schaub, Volet, Häfliger and Zbinden2010; Isaac & Pocock, Reference Isaac and Pocock2015). Employment of robust statistical methods to citizen science records such as the Seasearch dataset may open the door to large amounts of ecological information not previously available and not derivable from other datasets (since they do not exist at similar spatial or temporal extents). Such analyses will broaden our understanding of and taxonomic coverage of changes in biodiversity.
Supplementary material
The supplementary material for this article can be found at https://doi.org/10.1017/S002531542200008X.
Acknowledgements
I am pleased to acknowledge the contribution of the very many dedicated volunteers who contribute their records to Seasearch, and the coordinators and data enterers who give their time and effort to maintain the high quality of the dataset. A special thanks goes to Dr Charlotte Bolton, the Seasearch National Coordinator, who keeps the whole show on the road. I thank Dr Lin Baldock, Lucy May, Lisa Curtis, Dr Matthew Spencer and an anonymous reviewer who offered extensive, helpful suggestions on a previous version of the manuscript. I am very grateful to Dr Tom August for his willing provision of advice on using SPARTA and to Dr Rob Boyd for help with occAssess.
Financial support
This work was supported by funding from Natural England (order # 10070022261) and the Marine Conservation Society.


 Open access