

Sensory properties from foods are important in the regulation of food intake. In theory, people learn to associate sensory properties from foods with the metabolic consequences of ingesting these foods(Reference Yeomans, Leitch and Gould1, Reference Brunstrom2). As a result of this learning, sensory properties give rise to expectations about foods, and they become signals, which drive subsequent food selection(Reference Stubbs, Johnstone and Mazlan3, Reference Johnson and Vickers4).
Sensory signals mainly originate from the taste, smell, texture and vision. First of all, these signals inform us whether a particular item is indeed a potential food. So the evaluation of these signals serves as a primary gatekeeper to identify what we are about to ingest(Reference Scott5). Next, when the item is identified as a food, these signals, and taste in particular, are expected to represent some of the foods’ components(Reference Yarmolinsky, Zuker and Ryba6). Bitter tastes, for example, may signal toxic compounds, whereas sourness may signal a low pH or unripe foods(Reference Yarmolinsky, Zuker and Ryba6, Reference Temussi7). Similarly, it is assumed that a sweet taste signals the carbohydrate and energy content, whereas a savoury taste signals the protein content(Reference Scott, Harris and Mattes8). The latter suggests that taste serves as a nutrient-sensor. Clearly, however, not all nutrients are signalled through taste. Most vitamins and minerals, for example, have no obvious association with taste, although these components are essential for health. So far, it seems that taste in its function as nutrient-sensor mainly serves as a signal for macronutrients, with carbohydrates and proteins in particular, and Na, which are essential for human survival in the short term.
To our knowledge there are no data available, showing that there is indeed a link between taste and nutrient content. Especially in our current food environment, where up to 60 % of all consumed foods is highly processed(Reference Slimani, Deharveng and Southgate9), sensory signals may not be in accordance anymore with the nutrient content, due to technological processes. These technological processes are applied, for instance, to enhance palatability by adding flavours and aromas, or to reduce energy content by using fat replacers or non-nutritive sweeteners, without changing the sensory properties. The discrepancy between sensory signals and nutrient content that may occur because of these technological processes would then undermine the predictive power of the sensory signals(Reference Davidson and Swithers10). As such, this may affect food intake regulation.
The objective of the present study was to investigate associations of taste with the nutrient content of commonly consumed foods. This provides knowledge on whether we can still rely on taste as a signal for nutrient content within the context of our current food environment.
Subjects and methods
Design
Subjects rated the intensity of the five basic tastes (sweetness, saltiness, savouriness, sourness and bitterness) of fifty commonly consumed foods. The five tastes were rated in separate sessions. So in one session, the sweetness of all fifty foods was rated; in another session, the saltiness of all foods was rated, and so on. The tastes were tested in a random order for each subject. In addition, the order in which the food items were tested within a session was at random as well. This study was conducted according to the guidelines laid down in the Declaration of Helsinki. Written informed consent was obtained from all subjects, who received financial compensation for their participation.
Subjects
Men and women, aged 18–35 years, were recruited in Wageningen. Potential subjects were screened with a questionnaire to determine whether they met the following inclusion criteria: they had a BMI of 18·5–25 kg/m2, were in good physical and mental health, did not smoke, and were not pregnant or lactating. Subjects who had food allergies or disliked the foods they had to test were excluded. In total, four men (aged 20·8 (sd 1·5) years, BMI 21·4 (sd 2·2) kg/m2) and fifteen women (aged 21·1 (sd 1·8) years, BMI 21·6 (sd 2·1) kg/m2) participated in the study. The propylthiouracil (PROP) status of each subject was established using a method described elsewhere(Reference Bartoshuk11–Reference Tepper, Christensen and Cao13). In total, there were seven super tasters, ten normal tasters and two non-tasters.
Foods
The fifty food items used in this study were selected to represent a range of commonly consumed foods within the Netherlands, using the National Food Consumption Survey, 2003(Reference Hulshof, Ocké and van Rossum14). This survey contained several food groups and from each relevant food group (fats and oils, alcoholic drinks, and herbs, spices and sauces were not considered), we selected those foods that were often consumed. We were careful to select foods that were normally consumed at breakfast, lunch, dinner and between meals. Of the fifty food items, twenty-eight were those items that were most often consumed within their food group, seven foods were the second most and six foods were the third most often consumed foods within their food group. In addition, the items were consumed by a mean of 45·5 (sd 21·3)% of the users of the food group the items belong to. So, for example, the food group ‘potatoes’ had in total 752 users and of these 752 users, 454 users consumed boiled potatoes. This means that 60·4 % of the users of the food group ‘potatoes’ consumed boiled potatoes.
The foods were grouped according to their level of processing into ‘highly processed’ (n 35) or ‘raw and moderately processed’ (n 15), using the definition of Slimani et al. (Reference Slimani, Deharveng and Southgate9). An exception to this definition is roasted, unsalted peanuts, which we considered as moderately processed, comparable with boiled potatoes, while Slimani et al. considered peanuts as highly processed. Raw and moderately processed foods were grouped together because of the low number of food items in these categories.
Experimental procedure
We used the Spectrum Method(Reference Meilgaard, Civille and Carr15) to obtain an anchored rating of the taste intensity of sweetness, saltiness, savouriness, sourness and bitterness for the fifty food items. Subjects evaluated the taste intensity of a food item according to five reference solutions for each taste. These reference solutions contained increasing concentrations of sucrose for sweetness, NaCl for saltiness, monosodium glutamate (MSG) for savouriness, citric acid for sourness and caffeine for bitterness, dissolved in demineralised water. The actual concentrations we used and the taste intensity it represents on a scale of 0–15 are shown in Table 1. The taste intensity of the reference solutions was indicated on the serving cups.
(Mean values and standard deviations)

Su, sucrose; MSG, monosodium glutamate; CA, citric acid; Caff, caffeine.
* For saltiness, intensity ratings are 0, 2·5, 5, 8·5 and 15.
† Data are shown as mol/l.
‡ Ratings were made on a scale of 0–15.
Because there were no reference solutions available for MSG/savouriness, we developed a psychophysical function (perceived taste intensity v. concentrations of MSG). First, subjects rated the taste intensity of the reference solutions of sucrose and NaCl to familiarise themselves with intensity ratings. Then, to create the actual psychophysical function, the subjects tasted in a random order thirty solutions of MSG, with concentrations ranging from 0 to 0·887 mol/l (or 0–15 weight/weight %). Ratings on taste intensity were made on a scale of 0–20. The MSG concentrations that corresponded most with an intensity rating of 2, 5, 10 and 15 (actual ratings were 2·0 (sd 1·6), 5·4 (sd 4·4), 9·8 (sd 4·2) and 15·3 (sd 3·3)) were selected for the reference solutions.
Before the actual food items were evaluated, subjects first participated in two training sessions to get acquainted with the testing procedure and the evaluation of taste intensities in mixed solutions and in food items, other than the fifty test food items. In the second training session, the intensities of the reference solutions with defined intensities of 5 and 10 were rated by the subjects as well, as a measure of the performance of the subjects (Table 1).
The five sessions in which the taste intensities of the fifty food items were rated, lasted for 1 h and took place at the same time of day for each subject. Subjects were instructed to consume their habitual breakfast and lunch on the day of a test session and to refrain from eating or drinking anything else than water one hour before the start of a session, to standardise appetite ratings. During a session, the five reference solutions were tasted first, which were then available throughout the entire session. Then, subjects placed the food item in the mouth, tasted and expectorated the sample, compared the intensity with the reference solutions and rated the taste intensity on a scale from 0 to 15. Before and after each food item was tested, subjects neutralised their mouth with a cracker and by rinsing with demineralised water. Approximately 10 g of each food item was offered.
Data analyses
The mean intensity ratings of the food items were calculated and used in the analyses. The content of macronutrients (g/100 g), dietary fibre (g/100 g) and Na (mg/100 g) were based on the Dutch Food Composition Table of 2006(16). Total flavonoid content was based on the Dutch Food Composition Table of 1995(17).
Analyses were performed using SAS version 9.1.2 (SAS Institute, Inc., Cary, NC, USA). Simple and multiple regression analyses were performed using PROC REG to test associations of taste intensity ratings with nutrient content. The nutrient content was treated as the independent variable and the intensity ratings or taste patterns were treated as the dependent variable. In the simple regression analyses, food items were left out of the analyses in case these food items did not contain the independent variable of interest. So, for example, when foods did not contain any fat, these foods were not considered in the analyses with fat content as the independent variable. Data were analysed for all food items together and separately for the level of processing. To investigate whether the associations between nutrient content and taste intensity depended on the PROP status of subjects, analyses were also performed separately for PROP status. Because there were no differences in the associations according to PROP status, these data are not shown.
In addition, a cluster analysis was performed using PROC CLUSTER to identify groups of food items, based on the five taste intensities. Ward's method was used to form clusters and the pseudo t 2 was used to estimate the number of clusters. As such, four main clusters were identified, which accounted for 71 % of the variance (R 2 0·71). The advantage of the cluster analysis is that the five tastes are considered together, as they occur in different combinations within foods, and not as independent of each other. Next, ANOVA was performed using PROC GLM to investigate the differences in nutrient content between the identified clusters or food groups. Tukey's test was used for post hoc analyses. P-values < 0·05 were considered significant.
Results
Sweetness
The intensity ratings of sweetness and saltiness are shown in Fig. 1. A positive association was found between sweetness and mono- and disaccharide content, with β = 0·16 (P < 0·01) and R 2 0·45, n 41. The association was stronger in the raw and moderately processed foods, with β = 0·36 (P < 0·01) and R 2 0·71, whereas in highly processed foods the association was less pronounced, with β = 0·15 (P < 0·01) and R 2 0·42 (Fig. 2).
The mean sweetness and saltiness intensity ratings of fifty food items and the five reference solutions. * Raw or moderately processed foods.

The (a) associations between sweetness and mono- and disaccharide content (with R 2 0·71 (P < 0·01) for raw and moderately processed foods (▲, black line), and with R 2 0·42 (P < 0·01) for highly processed foods (○, dotted line)) and the (b) associations between sweetness and protein content (with no significant association for raw and moderately processed foods (▲, ![]() ), and with R 2 0·14 (P = 0·04) for highly processed foods (○,
), and with R 2 0·14 (P = 0·04) for highly processed foods (○, ![]() )).
)).
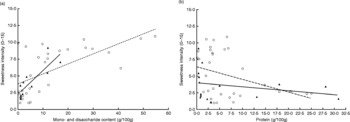
An inverse association was found between sweetness and protein content, with β = − 0·12 (P = 0·04) and R 2 0·09, n 47. This association was only significant in highly processed foods, with β = − 0·19 (P = 0·04) and R 2 0·14, and not in the raw and moderately processed foods (Fig. 2).
Within the highly processed foods, sweetness was best predicted by both mono- and disaccharide and protein content, with β = 0·16 (P < 0·01) for mono- and disaccharide content and β = − 0·15 (P = 0·02) for protein content, with R 2 0·55 for the total model.
Saltiness
Saltiness was positively associated with Na content, with β = 0·0062 (P < 0·01) and R 2 0·33, n 49. In raw and moderately processed foods, the association was stronger, with β = 0·0051 (P < 0·01) and R 2 0·51 (Fig. 3). In highly processed foods, the association was less pronounced, with β = 0·0064 (P < 0·01) and R 2 0·29.
The (a) associations between saltiness and sodium content (with R 2 0·51 (P < 0·01) for raw and moderately processed foods (▲, black line), and with R 2 0·29 (P < 0·01) for highly processed foods (○, dotted line)) and the (b) associations between saltiness and protein content (with R 2 0·63 (P < 0·01) for raw and moderately processed foods (▲, ![]() ), and with R 2 0·25 (P < 0·01) for highly processed foods (○,
), and with R 2 0·25 (P < 0·01) for highly processed foods (○, ![]() )).
)).

Saltiness was also positively associated with protein content with β = 0·19 (P < 0·01) and R 2 0·27, n 47. The association was stronger in raw and moderately processed foods, with β = 0·14 (P < 0·01) and R 2 0·63 (Fig. 3). In highly processed foods, the association was less pronounced, with β = 0·25 (P < 0·01) and R 2 0·27.
Saltiness was best explained by a model containing both independent variables, only in the raw and moderately processed foods. In this combined model, with R 2 0·90, Na content had a regression coefficient of β = 0·0039 (P < 0·01) and protein content of β = 0·11 (P < 0·01).
Savouriness
In general, all food items were rated low on savouriness intensity: twenty-eight food items were rated below an intensity of 2, and sixteen items were rated between 2 and 5. The remaining six food items (potato chips, smoked salmon, tomato soup, meatball, vegetable soup and cheese) were rated between 5 and 10. No food items were rated above an intensity rating of 10. Savouriness was strongly correlated with saltiness, with r 0·92 (P < 0·01). Savouriness was positively associated with Na content, with β = 0·0043 (P < 0·01) and R 2 0·33, n 49. Similar results were obtained with analyses separately for the level of processing, with β = 0·0032 (P = 0·02) and R 2 0·37 for raw and moderately processed foods and β = 0·0049 (P < 0·01) and R 2 0·34 for highly processed foods (Fig. 4).
The (a) associations between savouriness and sodium content (with R 2 0·37 (P = 0·02) for raw and moderately processed foods (▲, black line), and with R 2 0·34 (P < 0·01) for highly processed foods (○, dotted line)) and the (b) associations between savouriness and protein content (with R 2 0·64 (P < 0·01) for raw and moderately processed foods (▲, ![]() ), and with R 2 0·31 (P < 0·01) for highly processed foods (○,
), and with R 2 0·31 (P < 0·01) for highly processed foods (○, ![]() )).
)).

Savouriness was also positively associated with protein content with β = 0·15 (P < 0·01) and R 2 0·33, n 47. In raw and moderately processed foods, the association between protein content and savouriness was stronger, with β = 0·11 (P < 0·01) and R 2 0·64 (Fig. 4). In highly processed foods, the association was less pronounced, with β = 0·19 (P < 0·01) and R 2 0·31.
Savouriness was best explained by a model containing both independent variables, only in the raw and moderately processed foods. In this combined model, with R 2 0·80, Na content has a regression coefficient of β = 0·0023 (P < 0·01) and protein content of β = 0·09 (P < 0·01).
Sourness
The majority of the food items were not considered as sour: thirty-four items were rated below an intensity of 2 and ten items were rated between 2 and 5. From the remaining food items, five were rated between 5 and 10 (pineapple, yoghurt drink, fruit and fibre juice, apple juice and apples), while only one item (yoghurt) was considered as very sour, with a rating above 10. Sourness was inversely associated with carbohydrate content, with β = − 0·04 (P < 0·01) and R 2 0·20, n 44. Considering the type of carbohydrates, we found that it was mainly the polysaccharide content that was responsible for the association, with β = − 0·032 (P = 0·01) and R 2 0·19 (n 32). This association was only significant in highly processed foods, with β = − 0·04 (P < 0·01) and R 2 0·25.
Bitterness
None of the food items were considered as bitter, with thirty-two items rated below an intensity of 2 and the other eighteen items between 2 and 5. An inverse association was found between bitterness and carbohydrate content, with β = − 0·018 (P < 0·01) and R 2 0·24 (n 44). Considering the type of carbohydrates, we found that it was the polysaccharide content that was inversely associated with bitterness, with β = − 0·014 (P = 0·03) and R 2 0·15 (n 32). When analysing the data separately for level of processing, there were no significant associations anymore between polysaccharide content and bitterness intensity. In addition, no associations were found between bitterness and flavonoid content of foods.
Cluster analysis: food groups
The cluster analysis indicated four main clusters or food groups, based on the taste intensities of the foods: cluster 1 (neutral foods) contained mainly foods without a predominant taste; cluster 2 (salty and savoury foods) contained foods with high saltiness and savouriness intensities; cluster 3 (sweet–sour foods) contained foods with high sweetness and sourness intensities; and cluster 4 (sweet foods) contained foods that were only rated high on sweetness intensity (Table 2). When comparing the nutrient content between the four food groups, this revealed that mono- and disaccharide content of the ‘sweet foods’ was significantly higher than the other food groups (P < 0·01; Table 2). In addition, protein content was highest in the ‘salty and savoury foods’, which was significantly different from the ‘sweet–sour foods’ (P = 0·01), but not from the ‘neutral foods’ and the ‘sweet foods’. Na content of the ‘salty and savoury foods’ was significantly higher than the other food groups (P < 0·01 for ‘neutral foods’ and ‘sweet–sour foods’ and P = 0·02 for ‘sweet foods’).
(Mean values and standard deviations)

a,b,c Mean values within a row with unlike superscript letters were significantly different (P < 0·05).
* Foods in the ‘neutral foods’ cluster were brown and white rice, (whole-meal) macaroni, egg, rice waffle, whole-meal and white bread, cucumber, lettuce, mashed and boiled potatoes, cashewnuts, shrimps, milk, rusk, boiled and raw carrots, peas, crackers, chicken breast filet, peanuts, tomato, tea and liquorice. Foods in the ‘salty and savoury foods’ cluster were meat ball, vegetable and tomato soup, smoked salmon, potato chips and cheese. Foods in the ‘sweet–sour foods’ cluster were pineapple, yoghurt, yoghurt drink, (diet) coke, (pureed) apple, apple juice, fruit and fibre juice. Foods in the ‘sweet foods’ cluster were banana, custard, chocolate, chocolate milk, toffee, waffle, ginger biscuits, ice cream, cake and gingerbread.
† Data represent taste intensity ratings on a scale of 0–15.
‡ Data are shown as g/100 g, except for Na, which is shown as mg/100 g.
Discussion
In the present study, we investigated the associations of taste with the nutrient content of commonly consumed foods. We found that a large part of sweetness could be explained by the mono- and disaccharide content. In addition, both saltiness and savouriness were associated with Na and protein content. In line with these observations, the analyses that were performed on the four identified food groups indicated that sweet foods, which formed a separate food group, had a high mono- and disaccharide content, and that the salty and savoury foods, which formed another food group, had a high protein and Na content. These observations point towards a nutrient-sensing function of a sweet, salty and savoury taste for the simple sugars, protein and Na. The lack of clear associations between nutrient content and a bitter and sour taste may indicate that these tastes have other functions than to signal the presence of nutrients. Because these tastes are often associated with toxins or compounds with a low pH, these tastes, particularly at high intensities, may rather serve as a warning to avoid ingestion, and to prevent illness or damage to the body(Reference Yarmolinsky, Zuker and Ryba6, Reference Temussi7).
The taste system is a guardian of the human body, which should predict how an item would affect the body: does it provide nutrition or will it cause illness(Reference Scott5). But it is not only a matter of deciding whether or not to actually ingest a food. For instance, it has been demonstrated that when protein intake is low, we tend to increase protein intake, to prevent a shortage(Reference Gibson, Wainwright and Booth18). This suggests that we are not only capable of identifying an item as a food, but we are even capable of estimating the macronutrient content of foods. Our data now confirm that mono- and disaccharides, protein and Na, which are essential for health, are indeed linked with the taste system, suggesting that we should be capable of estimating the presence of these nutrients in foods, based on their taste. Although not investigated in the present study, it should be mentioned that the taste system is probably not sufficient in regulating the intake of all essential nutrients: many micronutrients for instance have no clear taste qualities and appear not to be linked with the taste system. To nevertheless ensure a sufficient intake of these essential nutrients, other regulatory mechanisms may be operating in the body. One such system is the occurrence of sensory-specific satiety, which is responsible for a variety-seeking behaviour, leading to a nutritionally varied diet(Reference Rolls19).
The observed associations between taste and nutrient content were systematically more pronounced in the raw and moderately processed foods than in the highly processed foods. Although this needs to be confirmed in future studies, this suggests that within highly processed foods, the ability to sense nutrient content based on taste is more limited compared to within raw and moderately processed foods. The smaller associations in highly processed foods may result from technological processes, which are applied to increase palatability, to reduce energy content or to preserve foods. The use of additives can provide foods with additional tastes, which may suppress other tastes(Reference de Graaf and Frijters20, Reference Green, Lim and Osterhoff21). Particularly sweetness appears to be the dominant taste, which suppresses other tastes. Ice cream or chocolate, for example, can contain a large amount of NaCl (195 and 250 mg/100 g, respectively, whereas, for example, mashed potatoes contain approximately 190 mg/100 g) without having a salty taste, because of its sugar content. This suppressive effect on tastes may potentially be harmful, if we cannot adequately recognise the nutrient content. The suppressive effect on saltiness, for example, may lead to high intakes of NaCl, which may have adverse effects on blood pressure(Reference Savica, Bellinghieri and Kopple22).
At this time, we do not know to what extent the associations between taste and nutrient content influence food intake regulation. One can imagine that the predictability of a sensory signal gets compromised when, for example, sweetness is followed by the delivery of carbohydrates at some, but not all occasions(Reference Davidson and Swithers10). This may ultimately force us to rely on other signals to determine our food intake(Reference Woods23). So far, however, consuming foods with non-nutritive sweeteners or fat replacers has been demonstrated to reduce energy intake(Reference Raben, Vasilaras and Moller24–Reference Stubbs27), although not all review studies have been able to demonstrate such an effect (Reference Mattes and Popkin28–Reference Swithers, Martin and Davidson30). Nevertheless, this may indicate that we are rather successful in deceiving our regulatory system and that we still base our food intake on sensory signals, whether they are appropriate or not. This can simultaneously have adverse consequences on energy intake, when, for example, the fat content of foods is covertly high, which has been shown to increase energy intake(Reference Viskaal-van Dongen, de Graaf and Siebelink31). It remains to be investigated what it means for the regulation of food intake when more and more foods provide sensory signals that do not represent the nutrient content.
The present study demonstrated that savoury taste was not only associated with protein, which was expected, but also with Na. The high correlation we observed between salty taste and savoury taste (r 0·92) suggests that either these tastes occur side-by-side or that subjects were not able to clearly distinguish between a salty and a savoury taste. The latter seems surprising, considering the clear distinction between taste receptors for salt (Na+ channels) and MSG (G-protein coupled receptors)(Reference Yasuo, Kusuhara and Yasumatsu32, Reference Chandrashekar, Hoon and Ryba33). Another possible explanation for the correlation between salty and savoury taste is that MSG, which is supposed to represent a true savoury flavour, also contains Na, which may have increased the perceived salty taste intensity. It should therefore be confirmed whether savouriness truly signals Na content, preferably with other compounds than MSG as reference, or that the observed association rather reflects the inability to discriminate savouriness from saltiness.
Because there are indications that there is a taste component in signalling fat(Reference Mattes34), we considered collecting data on fatty taste. The difficulty with fat is that this macronutrient has no clear taste quality(Reference Stewart, Feinle-Bisset and Keast35), but can exert very diverse oral sensations, ranging from creaminess to crunchiness. It is therefore very hard to obtain standardised intensity ratings of a fatty taste for different foods. In addition, it is not clear yet whether subjects would be capable of judging a fatty taste, irrespective of textural aspects(Reference Mattes36). It was therefore decided not to collect data on fatty taste, within the present study.
It should be mentioned that we excluded foods from the simple regression analyses in case the foods did not contain the nutrient of interest. In case of sweetness, this means that foods sweetened with non-nutritive sweeteners, that did not contain simple sugars, but did have a sweet taste, were not considered in the analyses. In this case, there was only one product, diet coke, which was sweetened with non-nutritive sweeteners. Excluding this one product would not have influenced the observed association to a great extent. Including all fifty foods (so also non-sweet foods without simple sugars) would result in an explained variance of 0·47 instead of the observed 0·42.
There are some limitations to this study. The performance of our subjects was somewhat limited, as can be seen in Table 1. Because we saw an increase in performance over the training sessions, additional training sessions would have been necessary to train our subjects more adequately. The implications for our results are nevertheless limited, because the effects of this performance on taste intensity ratings would probably be similar for each food item. We therefore do not think that this would have changed the associations between taste intensity and nutrient contents. Another limitation is that besides taste, there are also other sensory properties that may be involved in signalling the nutritious contents of foods, like texture and smell. These properties were not studied here, although they might have explained the additional variation in our data. It should also be mentioned that our findings depend on the foods we selected. But because we took great care of selecting foods that are often consumed in the Netherlands, where 82 % of the foods were in the top three of the most-often consumed foods within their food group, we nevertheless think that our findings accurately represent the situation as it occurs in everyday life.
In conclusion, the observed associations between taste and nutrient content suggest that a sweet, salty and savoury taste serve as a signal for the nutrient content of a food, particularly for simple sugars, proteins and Na. In highly processed foods, the associations between taste and nutrient contents were less pronounced than in raw or moderately processed foods. This suggests that within highly processed foods, the ability to sense nutrient content based on taste is limited. Nevertheless, considering the fact that taste perception not only depends on the nutrient content, but also on other food properties, like the physical structure of foods(Reference Ruijschop, Boelrijk and de Graaf37), we consider the explained variances we observed as reasonable and we therefore suggest that, within our total food pattern, we are capable of estimating the nutrient content of foods, particularly the simple sugars, protein and Na. It is important to consider though, that on a product level, there can still be a large discrepancy between nutrient content and taste intensity, as can be seen in food items like ginger biscuits and bread, which are relatively high in Na content, but low in salty taste intensity.
Acknowledgements
The present study was carried out with the financial support of the Netherlands Nutrition Center, The Hague, the Netherlands. The contributions of the authors were as follows: M. V. v. D., M. C. v. d. B., N. V. and C. d. G. designed the research; M. C. v. d. B. and N. V. conducted the research; M. V. v. D. analysed the data; M. V. v. D., C. d. G. and F. J. K. wrote the paper. All authors read and approved the final manuscript. The authors declare that there are no conflicts of interest.


