

Introduction
One of the most intriguing questions in the comparative study of early complex societies relates to the circumstances that led to the emergence of large-scale human aggregations (Birch Reference Birch2013). In later prehistoric Europe, such aggregations flourished on the southern Iberian Peninsula around 3000 cal BC, only half a millennium after the demise of its eastern Trypillian counterparts (with Trypillia being the other outstanding process of human aggregations in mega-sites known for late prehistoric Europe) (Müller et al. Reference Müller, Rassmann and Videiko2016). Characterised by massive communal labour investments in building fortifications and ditches, Iberian mega-sites persisted for several centuries. All were subject, however, to radical reorganisation or collapse by the late third millennium BC (Balsera et al. Reference Balsera, Bernabeu, Costa-Caramé, Díaz-del-Río, García Sanjuán and Pardo2015: 149).
The extent to which these aggregations resulted from local, regional or extra-regional human mobility is an issue of critical importance for understanding the complexity of mega-sites and their place in regional networks (e.g. Nocete et al. Reference Nocete, Lizcano, Peramo and Gómez2010; Díaz-del-Río Reference Diaz-Del-Río2013; Díaz-Zorita Bonilla Reference Díaz-Zorita Bonilla2017; García Sanjuán et al. Reference García Sanjuán, Vargas Jiménez, Cáceres Puro, Costa Caramé, Díaz-Guardamino Uribe, Díaz-Zorita Bonilla, Fernández Flores, Hurtado Pérez, López Aldana, Méndez Izquierdo, Pajuelo Pando, Rodríguez Vidal, Wheatley, Bronk Ramsey, Delgado-Huertas, Dunbar, Mora González, Bayliss, Beavan, Hamilton and Whittle2018). Fortunately, the extensive mortuary component of many Iberian Copper Age mega-sites allows for the study of human mobility through the direct analysis of human skeletal remains.
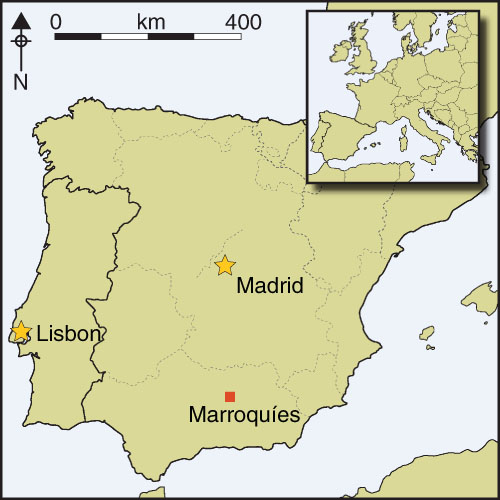
In this paper we present results of carbon, strontium and oxygen isotope analyses conducted on human and faunal remains from the site of Marroquíes in Jaén, Spain (Figure 1). It is, to date, the largest sampled collection for a single context of this nature in Iberia. This bioarchaeological and isotopic evidence allows us to answer important questions about mobility in Iberian prehistory. These include assessing the dynamics of population movement into large-scale centres and evaluating the degree to which migrants were fully integrated into the social and ritual spheres of their new communities. Our results thus provide a major contribution to understanding population history at the site of Marroquíes, and to the comparative study of large-scale aggregation processes in Iberia and beyond.
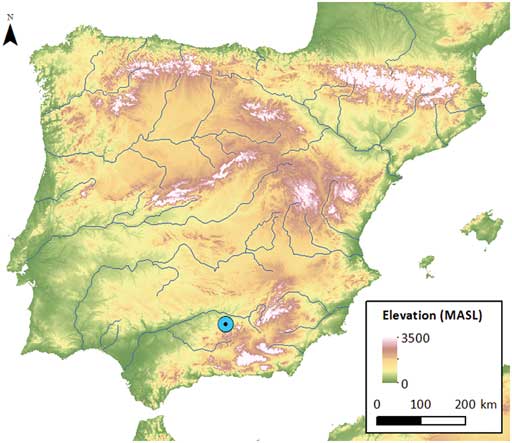
Figure 1 Location of Marroquíes (Jaén, Spain). Base cartography: SRTM 90m digital elevation data (Jarvis et al. Reference Jarvis, Reuter, Nelson and Guevara2008). Mapa Digital de Andalucía 1:100.000 Junta de Andalucía. Courtesy of Antonio Uriarte, Instituto de Historia, CSIC.
The mega-site of Marroquíes
At 113ha, the ditched enclosure settlement of Marroquíes is the second largest mega-site known in Copper Age Iberia (Zafra et al. Reference Zafra, Hornos and Castro1999, Reference Zafra, Castro and Hornos2003), after Valencina-Castilleja (García Sanjuán et al. Reference García Sanjuán, Vargas Jiménez, Cáceres Puro, Costa Caramé, Díaz-Guardamino Uribe, Díaz-Zorita Bonilla, Fernández Flores, Hurtado Pérez, López Aldana, Méndez Izquierdo, Pajuelo Pando, Rodríguez Vidal, Wheatley, Bronk Ramsey, Delgado-Huertas, Dunbar, Mora González, Bayliss, Beavan, Hamilton and Whittle2018). The site is located in the foothills of the Sierra de Jaén, in an ecotone between the low hills of the campiña to the north and the steeper mountain range of the Sierra Mágina to the south (Figure 1). Geologically, Marroquíes is situated in the northern External Zone of the Baetic System, where the bedrock comprises Jurassic limestone and Cretaceous loam.
Discovered in 1957 during construction work (Espantaleón Reference Espantaléon1957, Reference Espantaléon1960), the full extent of the Marroquíes site was not appreciated until the northward expansion of the modern city in the 1990s precipitated a wave of over 270 archaeological excavations (Zafra et al. Reference Zafra, Castro and Hornos2003). These investigations uncovered a series of six concentric ditches (ranging from 6–10m in width and 2–5m in depth), portions of an adobe wall accompanying the fifth ditch, and extensive evidence for domestic architecture and mortuary features (Figure 2).
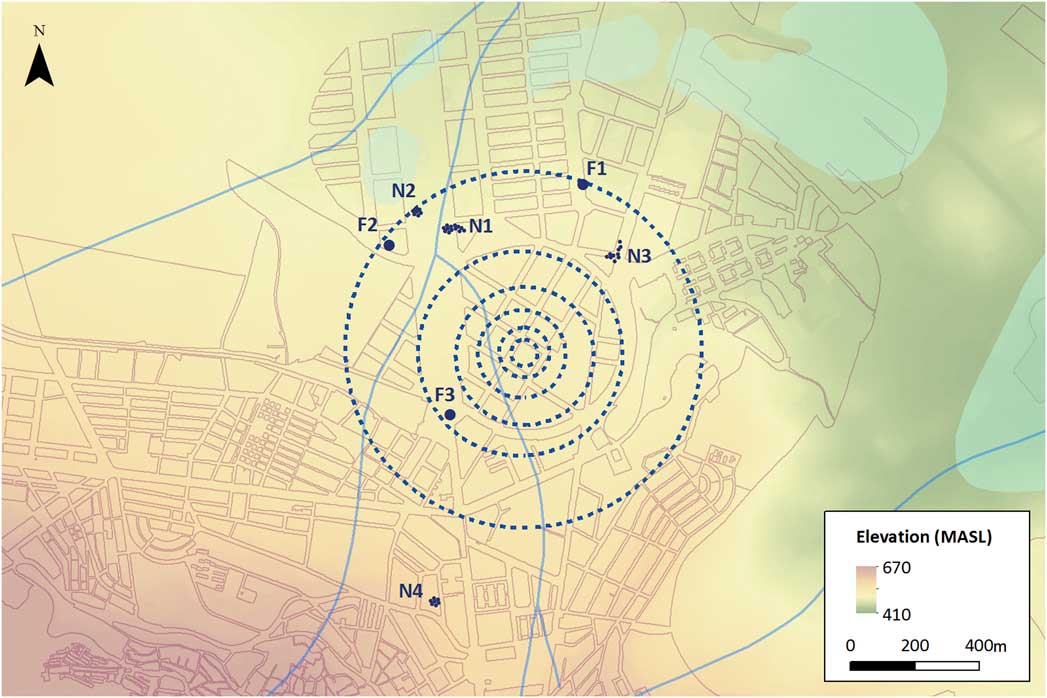
Figure 2 Schematic map of Marroquíes with the distribution of mortuary areas (necropolises 1–4; F1–3: Fosa común or ‘common grave’) and enclosures (Narciso Zafra pers. comm.). Base cartography: CartoCiudad and Modelo Digital del Terreno MDT05 provided by © Instituto Geográfico Nacional. Courtesy of Antonio Uriarte, Instituto de Historia, CSIC.
Ninety-five radiocarbon dates from the prehistoric occupation contexts suggest an initial foundation of the two inner enclosures by 2800–2450 cal BC (covering 1.1ha), a peak in activity c. 2450 cal BC that triggered sequential construction of the remaining enclosures (covering 113ha), and a steep decline in human activity by 2100 cal BC (Cámara et al. Reference Cámara, Spanedda, Sánchez, García, González and Nicás2012a & Reference Cámara, Sánchez, Laffranchi, Martín, Riquelme, Spanedda, García, González, Jímenez and Nicásb; Aranda Jiménez et al. Reference Aranda Jiménez, Lozano Medina, Escudero Carrillo, Sánchez Romero, Alarcón García, Fernández Martín, Díaz-Zorita Bonilla and Barba Colmenero2016; Beck Reference Beck2016). During the most active phase of the site, multiple huts with circular trench foundations were clustered in dispersed ‘neighbourhoods’ (Zafra et al. Reference Zafra, Castro and Hornos2003), with no clear evidence for community-level organisation of households. The density of such huts at one of the most thoroughly investigated areas of excavation allows for an initial estimation of population size (Junta de Andalucía 2010). Taking into account the 677m2 of hut surface per hectare and one person per 6.9m2 (Porčić Reference Porčić2012) of the 34ha within ditch 4, we estimate that, at its peak, Marroquíes may have had a mean population of 3300 inhabitants.
This local history of labour investment is paralleled by regional settlement dynamics. Results of the Upper Guadalquivir Valley Survey Project show a decrease in the number of settlements throughout the Guadalbullón River Valley by 2500 cal BC (Nocete Reference Nocete1994). Díaz-del-Río (Reference Diaz-del-Río2004) interprets this as a direct consequence of the rise of the Marroquíes mega-site. The survey also identified a later increase in the number of sites in the river valley by 2200 cal BC—a pattern that probably resulted from the subsequent steep decline in activity at Marroquíes. The exponential intensification in labour investment by 2450 cal BC suggests that the location and population of Marroquíes acted as an incentive for newcomers, whose incorporation into the settlement would have required new forms of integrative social mechanisms.
Since 2013, the Marroquíes Bioarchaeological Project has combined bioarchaeology, mortuary archaeology, isotopic analyses of diet (δ 13C, δ 15N) and mobility (87Sr/86Sr, δ 18O), and radiocarbon dating to investigate social organisation, patterns of aggregation and funerary activity at the site. Here, we present carbon (δ 13Cap), strontium (87Sr/86Sr) and oxygen (δ 18O) isotope analyses of human skeletal remains from 115 individuals interred in three different mortuary areas at Marroquíes. Samples were selected taking into account spatial distribution, minimum number of individuals (MNI) estimates and chronological variability in mortuary practices (Beck Reference Beck2016).
The mortuary record
Seven mortuary areas are identified at Marroquíes (Figure 2). Other than the artificial caves of the Marroquíes Altos necropolis, these locations are characterised by clusters of circular subterranean structures or amorphously defined pits excavated into bedrock. The burials encompass different mortuary treatments, including primary burials, secondary burials and commingled interments. Grave goods include complete animal burials and occasional ceramics, shell, worked bone implements and metal objects. MNI estimates range from five (at F1) to over 200 (at necropolis 4 (N4)). Most of the AMS radiocarbon dates from two previously analysed mortuary areas fall in the mid to late third millennium BC (c. 2500–2000 BC) (Sánchez et al. Reference Sánchez, Bellón and Rueda2005; Cámara et al. Reference Cámara, Spanedda, Sánchez, García, González and Nicás2012a & Reference Cámara, Sánchez, Laffranchi, Martín, Riquelme, Spanedda, García, González, Jímenez and Nicásb). Necropolises 1 (N1), 2 (N2) and 4 (N4) were analysed most recently (Beck Reference Beck2015, 2016, Reference Beck2017).
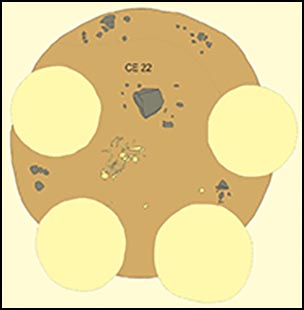
N1 was excavated in 1998–1999 and contained at least 42 individuals (Serrano et al. Reference Serrano, Cano, Jimenez and Alcala2000) (Figure 3). Its mortuary structures included type 1 tombs, comprising a series of bell-shaped features 6m in diameter and 1.5–2m in depth. These were dug into the marl, with multiple burials clustered in a circular arrangement around a central tomb containing a single probable male burial. N1 also contained smaller pits (type 2) 2–3m in diameter and 0.5m in depth, which were also dug into the marl. Grave goods were limited or absent, although type 1 tombs contained burials of whole animals. All type 1 tombs experienced domestic or utilitarian re-use during the Late Copper Age or Early Bronze Age. AMS dates for nine human samples suggest that these mortuary structures were in use between 2690 and 2300 cal BC (Beck Reference Beck2016) (online supplementary material (OSM) Table S1; Figure 4).
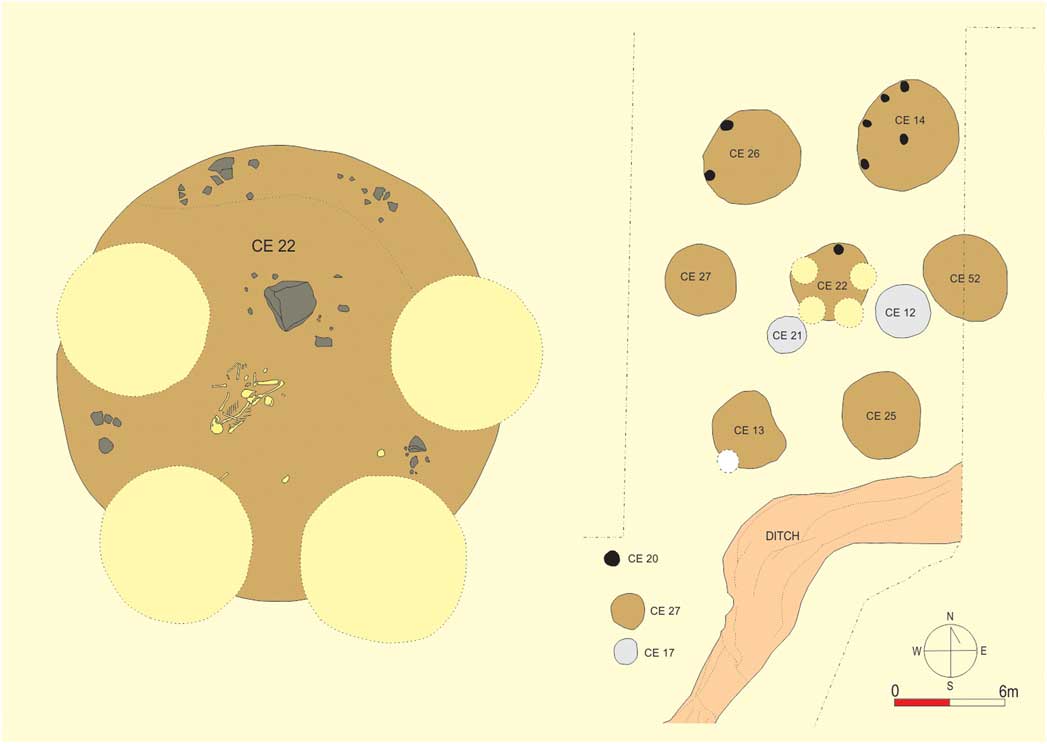
Figure 3 Necropolis 1. Map of mortuary structures and detail of central burial structure CE22. Black dots represent hearths (modified from site map by José Luis Serrano Peña).
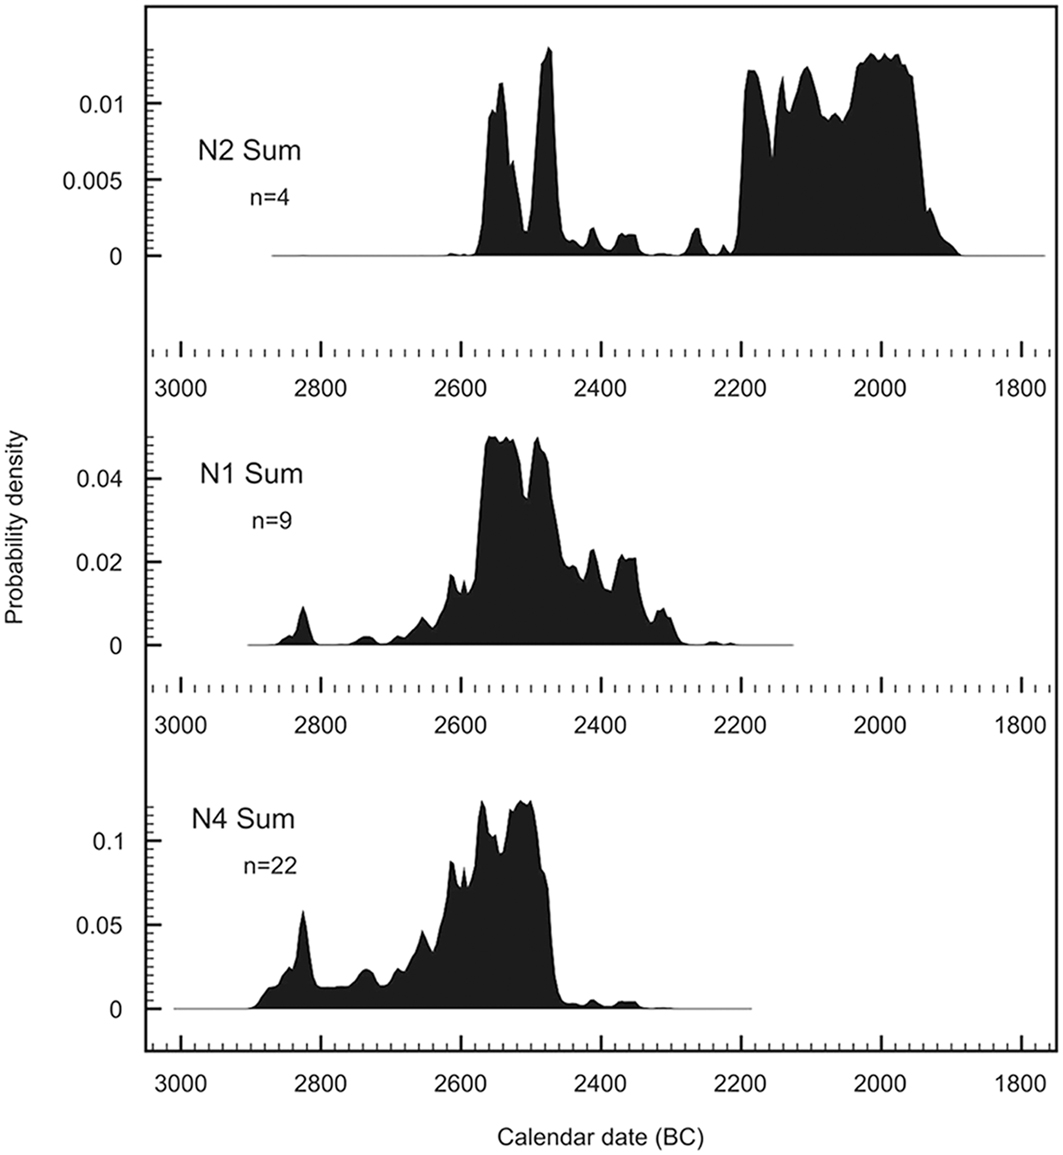
Figure 4 AMS radiocarbon dates from necropolises 1, 2 and 4.
Excavated in 2006, N2 contained at least 33 individuals. It comprised seven mortuary structures containing disarticulated human remains distributed along the internal edge of ditch 5, and a cranium recovered from within the ditch (Pérez Reference Pérez2005). Here, mortuary structures included: 1) oval or irregular structures with burials in shallow 0.3–0.4m-deep graves, with dimensions ranging from 0.9–1.6m in length and 1–2.7m in width; 2) structures of oval or irregular shape (100mm in depth, 3–5m in length and 2–5m in width), with burials interred directly on the natural clay substrate; and 3) circular structures 1.7m in diameter, with stone covers and burials interred directly on the clay substrate. N2 also contained large and often well-preserved ceramics, bone awls/hairpins and one sword blade with rivets. AMS dates from human mandibles show two distinct periods of use: a phase of Late Copper Age mortuary activity (2580–2340 cal BC), followed by an Early Bronze Age phase (2180–1960 cal BC) (Beck Reference Beck2016).
N4 was discovered during construction work in 1957 and is known as Marroquíes Altos (Espantaleón Reference Espantaléon1957). It is the only mortuary area situated outside of the enclosures (Figure 1), located about 500m south on the slope of the hill of Santa Catalina. At least seven artificial caves have been discovered in this area, distributed in a complex that covers approximately 0.1ha (Espantaleón Reference Espantaléon1957, Reference Espantaléon1960; Lucas Reference Lucas1968) (Figure 1). All but one cave contained human burials and associated artefacts suggesting a Late Copper/Early Bronze Age chronology. Two burial caves (tombs I and II) were partially excavated in the 1950s (Espantaleón Reference Espantaléon1957). Due to further construction at the site in 2001, these tombs were re-excavated (Manzano & Martínez Reference Manzano and Martínez2001). Archaeologists discovered the prehistoric entryways and antechambers for tombs I and II—important components of the site left undisturbed by the earlier excavations. They also discovered a new undisturbed tomb (tomb III), the only artificial cave excavated entirely in situ (Figure 5). The three mortuary caves are oriented north-east to south-west and share a similar plan, with a vertical access shaft, antechamber and chamber. Fragmentary and commingled human remains, sometimes mixed with broken artefacts, completely fill the caves.
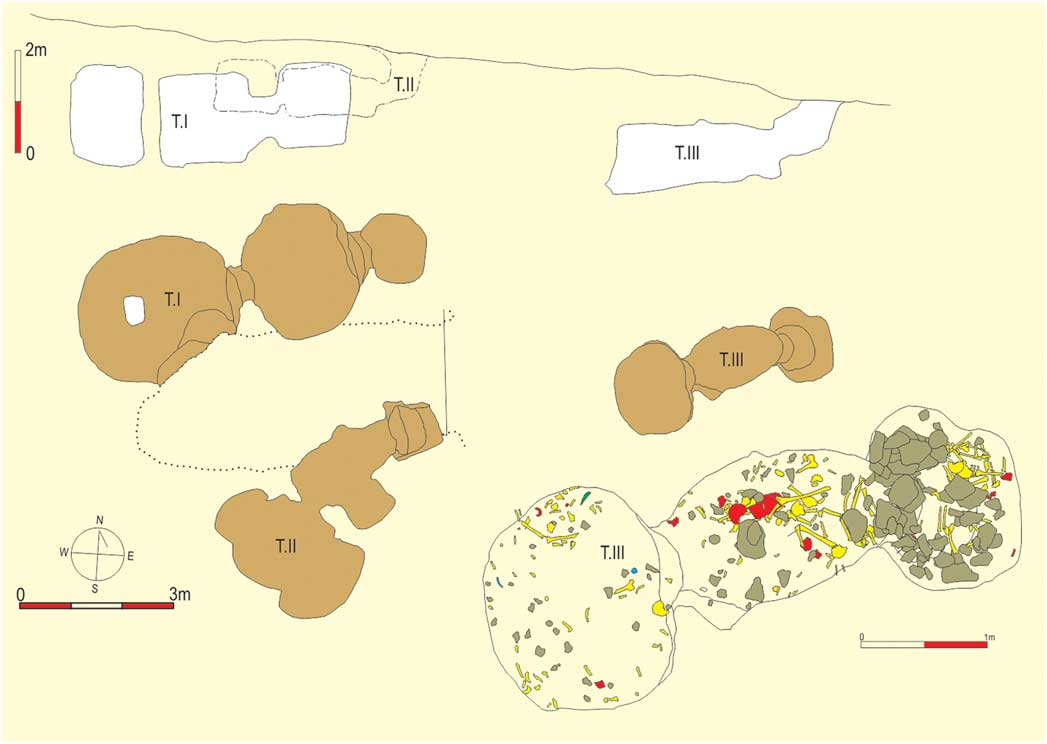
Figure 5 Necropolis 4 (Marroquíes Altos). Plan and section of the three analysed artificial caves and detail of the distribution of human remains in tomb III (modified from site maps by Ana Manzano Castillo and José Luís Martínez Ocaña).
Our project has analysed human remains from all three caves (Beck Reference Beck2016). Tombs I and II were combined in analysis due to the potential admixture of human remains over the course of multiple excavations, and contained at least 165 individuals. Tomb III contained at least 40 individuals. AMS dates from individuals interred in tombs I and III suggest that both caves were used during the same period, with mortuary activity beginning by c. 2720 BC and ending by c. 2460 cal BC (Beck Reference Beck2016). This chronology makes the first burials at N4 contemporaneous with the construction and use of the two inner enclosures at Marroquíes.
Methods and dataset
Bioarchaeological analysis of the newly analysed human remains produced an MNI estimate of 280 (201 adults, 79 subadults), while estimations of sex (OSM Appendix 2) in adults yielded 47 females and 31 males (Beck Reference Beck2016). One hundred and fifteen human tooth samples were collected from mortuary areas N1, N2 and N4, as well as two lagomorph (e.g. rabbit) teeth, one lagomorph tibia and one ovicaprid tibia from N4. The human sample represents respectively 52, 34 and 40 per cent of the MNI per burial area. To prevent the double-counting of individuals, sub-adult samples were selected based on the presence of the Rdm2 (lower right deciduous second molar), and adult samples were selected based on the presence of the RM2 (lower right permanent second molar). Approximately 12mg of enamel was extracted from each tooth. The human isotopic sample reflects the overall MNI distribution, with comparable proportionality of age categories, sexes and mortuary areas. Samples were extracted and processed at the Department of Geosciences (University of Tübingen) (see the OSM for specific laboratory methodology). Due to the dearth of faunal tooth enamel, bone samples from lagomorphs and ovicaprids were analysed to assess the local range for 87Sr/86Sr.
Results
All 115 human tooth samples collected from N1, N2 and N4 were suitable for strontium (87Sr/86Sr) isotope analysis (Table S2). Price et al. (Reference Price, Bentley, Lüning, Gronenborn and Wahl2001) recommend the use of a 2σ confidence interval around the mean to establish a local human range. As the N1, N2 and N4 human strontium isotope ratios departed significantly from a normal distribution (Shapiro-Wilks W test for non-normality=0.62185, p-value=1.742e-15), however, both a 1σ (0.70761–0.70934) and a 2σ (0.70675–0.71020) local range were employed to avoid underestimating the number of non-local individuals at Marroquíes. Nine non-local individuals were identified at 1σ, and six non-local individuals were identified at 2σ (Figure 6). Here, we follow a more conservative approach using the 2σ boundary, treating only six individuals (samples 11, 12, 20, 51, 78 and 80) as non-local; we are aware, however, that three additional individuals show values distinct from the local range at 1σ (68.2% confidence). These individuals may also have been of non-local origin, but further data are needed to assess their status more accurately.
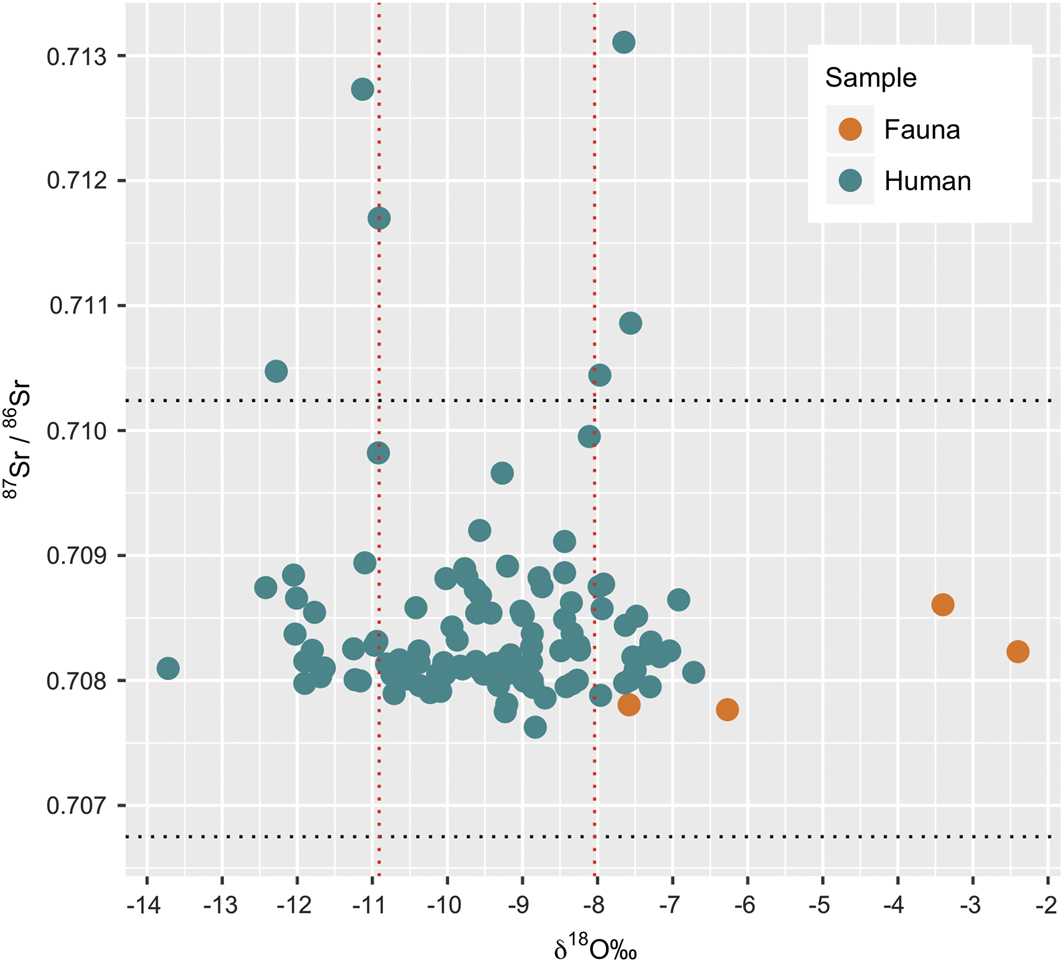
Figure 6 87Sr/86Sr and δ18Odw values for human and faunal samples from Marroquíes. Black dotted lines represent ±2σ (95.4% confidence) from the human mean for 87Sr/86Sr; red dotted lines represent ±1σ (68.2% confidence) from the human mean for δ18Odw.
These 119 human and faunal samples were also analysed for oxygen (δ 18O) and carbon (δ 13Cap) of the carbonate fraction of enamel and bone bioapatite (OSM Appendix 1 & Table S3; Figure 7). Due to the fractionation that occurs when humans consume water (Chenery et al. Reference Chenery, Pashley, Lamb, Sloane and Evans2012), δ 18O values were converted to reflect drinking water using the Daux et al. (Reference Daux, Lécuyer, Héran, Amiot, Simon, Fourel, Martineau, Lynnerup, Reychler and Escarguel2008) formulae. Results for all humans showed an average δ 18Odw value of −9.47‰±1.43 (1σ), ranging from −13.72‰ to −6.72‰, with sub-adult values ranging from −10.65‰ to −9.11‰. Human δ 18Odw values had a range of 11‰, while faunal values had a range of ~5‰. Values of drinking water δ 18O calculated from human δ 18O were compared to modern precipitation values to establish a range for local water sources using nearby locations with similar environmental conditions (available at: http://waterisotopes.org; WaterIsotopes Database 2017). Averages were available for Jaén (EuroHair_38594) −7.3‰±0.2 (1σ), Montejícar (EuroHair_38594) −8.0‰±0.2, Granada (EuroHair_38595) −9.36‰±0.2 and Guadix (EuroHair_38596) −8.73‰±0.2 (Bowen & Revenaugh Reference Bowen and Revenaugh2003; Bowen et al. Reference Bowen, Wassenaar and Hobson2005). Bowen and Revenaugh (Reference Bowen and Revenaugh2003) suggest that local δ 18O values for the site area range from −7.5‰ to −11.4‰, which coincides with the human δ 18Odw average (−9.47‰). As a result, we established a local δ 18O value range of −10.91‰ to −8.04‰. Thirty-four values for human samples from all burial sites (N1=9; N2=2; N4=24) fall out of this range. Five of them are also outliers according to the 87Sr/86Sr results (N1=3; N4=2) (Figure 6).
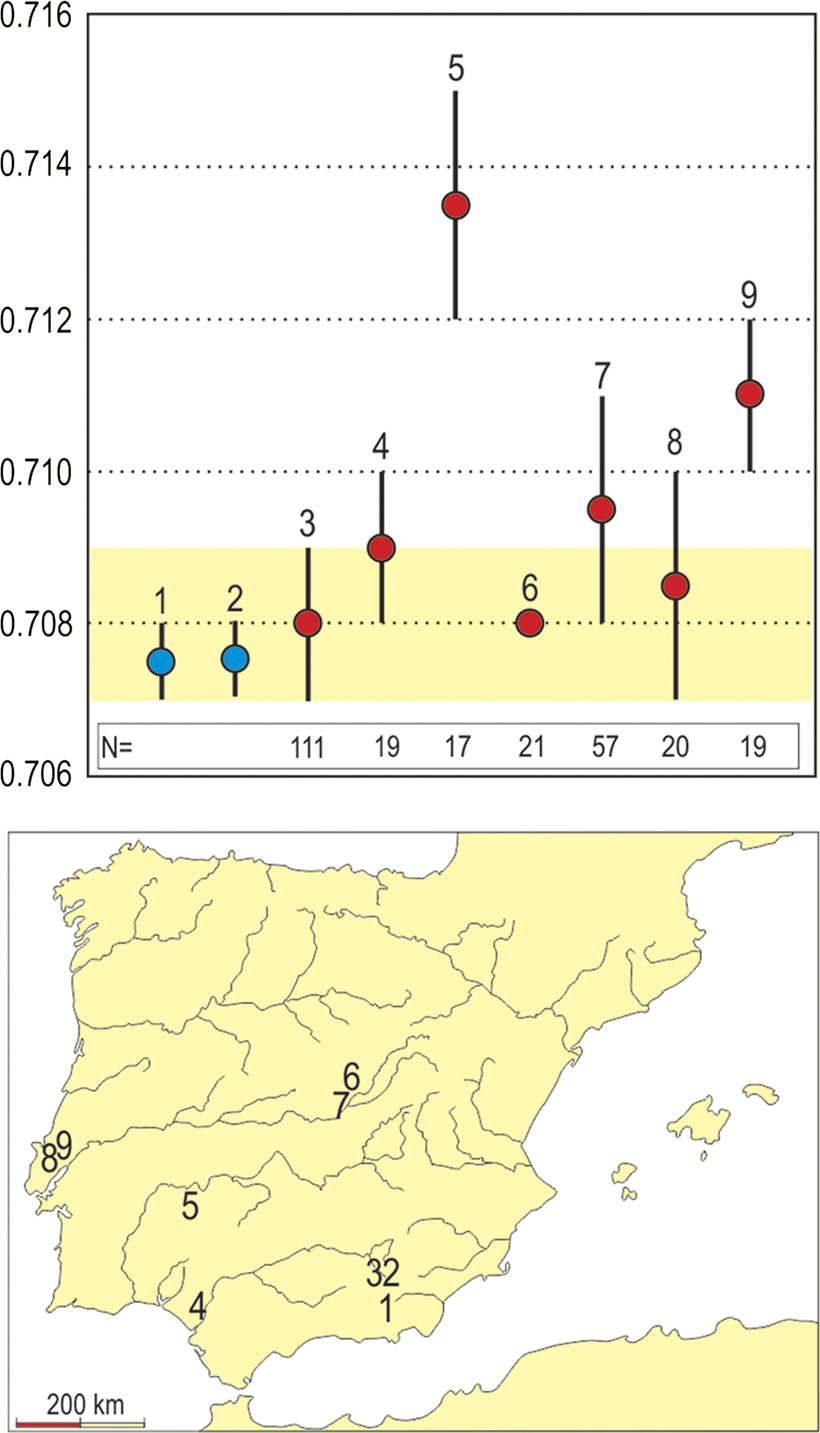
Figure 7 Above: mean averages (filled circles) and 1σ range for 87Sr/86Sr values: 1) Baetic System external; 2) Baetic System internal; 3) Marroquíes; 4) Valencina; 5) La Pijotilla; 6) El Rebollosillo (Madrid); 7) Madrid Basin; 8) Zambujal; 9) Bolores. Sample sizes are shown in the white box at the bottom of the plot. Geological samples are shown in blue, archaeological samples are shown in red. Below: location of referenced sites.
The human sample (n=115) showed a δ 13Cap average of −12.30‰±0.5 (1σ), while fauna (n=4) averaged −12.12‰±1.7 (1σ). Values from human enamel samples ranged from −13.68‰ to −11.14‰. Faunal remains for enamel ranged from −14.06‰ to −11.26‰ and from −13.04‰ to −10.15‰ for bone apatite. There is a difference of 4‰ among humans and of ~4‰ among faunal remains. The human sample mean of −12.30‰ is consistent with the consumption of C3 plants or animal products from C3-plant foodwebs (van der Merwe Reference van der Merwe1982).
Discussion
The northern geological limits of this region are the Subbetic olistostrome unit, the Neogene and Quaternary Basin of the Guadalquivir, and the Iberian Massif. Southwards, the Internal Zone of the Baetic System includes metasedimentary Mesozoic and pre-Mesozoic rocks (Sanz et al. Reference Sanz, García-tortosa, Peláez, Alfaro, Azañon, Galindo-Zldívar, López-Casado, López-Garrido, Rodríguez-Fernándes and Ruano2012). Available 87Sr/86Sr values provide an 87Sr/86Sr range of 0.70710–0.70798 for the former, and 0.70744–0.70819 for the latter (n=25) (Nieto et al. Reference Nieto, Ruiz-Ortiz, Rey and Benito2005; Ortí et al. Reference Ortí, Pérez López, García Veigas, Rosell, Cendón and Pérez-Valera2014). The local 87Sr/86Sr range obtained for the prehistoric human population interred at Marroquíes (0.70675–0.71019) is thus consistent with these environmental results, while the slightly higher values probably relate to Marroquíes’ location in an ecotone between the Baetic System and the Neogene and Quaternary formations immediately north of the site. When compared to other 87Sr/86Sr ranges (1σ) from third- and second-millennium BC archaeological sites and geological samples in Iberia, Marroquíes shows low values—similar to Cretaceous areas, such as the contemporaneous central Iberian burial cave of El Rebollosillo (average 87Sr/86Sr of 0.708) (Díaz-del-Río et al. Reference Díaz-del-Río, Consuegra, Audije, Zapata, Cambra, Gonzalez, Waterman, Thomas, Peate, Odriozola, Villalobos, Bueno and Tykot2017a). It is also lower than most other sampled archaeological sites, including the mega-site of Valencina-Castilleja (87Sr/86Sr values range from 0.708–0.710) (Díaz-Zorita Bonilla Reference Díaz-Zorita Bonilla2017)—Marroquíes’ western counterpart in the Lower Guadalquivir Valley, with which its Sr isotopic values partially overlap.
With regard to their spatial distribution, one of the six Sr outliers belongs to N4, and five belong to N1, representing 1 per cent and 23 per cent of the sampled mortuary populations, respectively. Only two individuals with non-local values are subadults, and both are from N1. Four of these individuals have been radiocarbon dated (Table S1). The distribution of these dates throughout the main use-period of the site suggests that this small influx of non-local individuals most probably occurred throughout the history of the aggregation process. Nevertheless, a Bayesian model (at 1σ) of the nine radiocarbon dates from N1 suggests that the burial site was in use for approximately 200 years, starting 2610–2495 cal BC and ending by 2465–2390 cal BC. This coincides with the suggested period of maximum construction activity at Marroquíes (c. 2500–2400 cal BC). That is, the entire mortuary area—including all non-local individuals—temporally overlaps with the period during which the majority of the construction activity was in progress at the settlement. This finding is consistent with the settlement pattern data, which imply that by 2500 cal BC, the number of contemporaneous settlements in the Guadalbullón Valley dropped to the lowest level in the entire late prehistoric sequence due to the aggregation at Marroquíes (Díaz-del-Río Reference Diaz-del-Río2004). If the detected non-local individuals did not grow up in close proximity to the site (e.g. the Guadalbullón Valley), our Sr isotopic results showed that at the peak of labour investment in enclosure construction, Marroquíes may have incorporated a substantial influx of non-local individuals. Although the chronological spread and sample size must be taken into account when considering the magnitude of this influx, the trends in population movement suggested by our isotopic dataset conform to archaeological evidence for regional population dynamics and radiocarbon dating of local labour investments at the site.
A more detailed approach to the spatial distribution of these non-locals at N1 is revealing. Six mortuary structures encircled CE22 (‘Complejo Estructural’, a complex of structures stratigraphically related to each other), the central burial of a probable male adult of local origin (Figure 3). Three adult and two sub-adult newcomers were buried without formal distinction in structures CE14 (2), CE13 (2) and CE27 (1). Both CE14 and CE13 included 15 other individuals, and CE27 included seven. This pattern reveals an important aspect of the aggregation process at Marroquíes: the social mechanisms by which newcomers were incorporated and integrated into the pre-existing social network. If mortuary treatment at N1 is part of a general pattern, by 2500 cal BC the incoming non-local population did not comprise an autonomous social group; instead, newcomers were assigned privileges and obligations through their inclusion in pre-existing constituent social structures, be these lineages or clans.
The δ 18O results for the sampled human population (Figure 6) show a δ 18Odw average of −9.47‰±1.43 (–10.91 to –8.04 at 1σ). This high standard deviation is only reduced slightly when taking into account those who exhibit local 87Sr/86Sr together with subadults, presumably of local origin (δ 18Odw −10.65‰ to −7.57‰). Children exhibit the lowest standard deviation (−8.71‰±1.25; (δ 18Odw −9.96‰ to −7.46‰)) compared to all the sampled humans, or to each necropolis individually. Thus, there seems to be a correlation between age and standard deviation, where younger individuals show less variability than adults. Many factors can contribute to variability in oxygen isotope values in individuals from the same region, including seasonality during the enamel formation time, climate change during tooth formation, altitude, the ingestion of different types of water and food preparation (or by individual archaeological projects using different drinking water conversion formulae) (Pellegrini et al. Reference Pellegrini, Pouncet, Jay, Parker Pearson and Richards2016: 2). The high variability observed in our sample may result from a combination of such factors. The inhabitants of Marroquíes would have had access to a wide selection of both local and regional water sources. The site was surrounded by a water-rich environment, including the immediate sierras, Mágina and Cazorla, to the east, local lakes and watercourses cutting through the actual enclosure system (Figure 2), and the lower Guadalquivir River Basin some 20km north that receives water from tributary sources originating in the northern Sierra Morena. In fact, when compared to the available prehistoric samples, δ 18O variability at Marroquíes almost doubles that observed in regions such as Madrid (Díaz-del-Río et al. Reference Díaz-del-Río, Waterman, Thomas, Peate, Tykot, Martínez-Navarrete and Vicent2017b), where the main water sources all lie in the Central Iberian System mountain range. Consequently, logistical mobility (Binford Reference Binford1980) could be behind the observed variability as much as food preparation in an historical period where boiled food may have been the staple. Both conditions would explain the higher δ 18O values and lower variability of infants vs the adult population at Marroquíes.
Plotting δ 18O values against the 87Sr/86Sr isotope ratios provides an opportunity to identify whether newcomers emigrated from the same home region (Figure 6). Five of the six individuals identified as non-local using strontium isotope ratios (2σ, or 95.4% confidence) are also outliers based on their δ 18O V-SMOW values. Two of these outliers have similar δ 18O values, but markedly different strontium isotope ratios, which would suggest different regional origins. Additionally, six individuals have strontium isotope ratios that fall within the local range, but significantly different δ 18O values, which suggest that they may be consuming different water sources (Figure 6). When comparing the 87Sr/86Sr and δ 13C values, some individuals considered non-local based on strontium isotope ratios showed significantly lower values for δ 13C, revealing dietary differences that may be related to different geographic contexts (Figure 8).
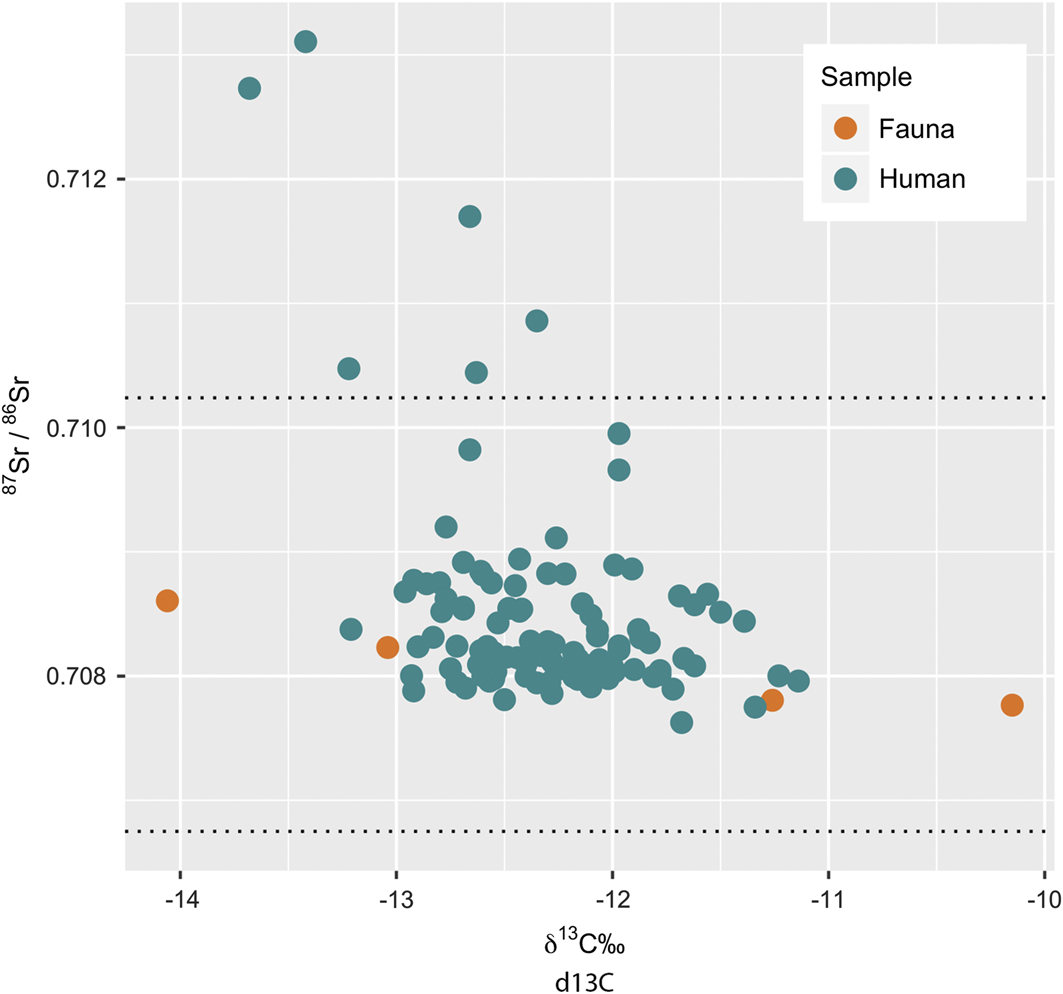
Figure 8 87Sr/86Sr and δ13C values for human and faunal samples from Marroquíes. Black dotted lines represent ±2σ from the human mean for 87Sr/86Sr.
Combined with the δ 13C values, the δ 18O V-SMOW values also offer insights about the palaeoecosystem (Figure 9). Lower values for δ 13C and δ 18O represent a wetter and denser vegetation. Therefore, those individuals considered non-local based on 87Sr/86Sr and δ 18O, who spent their childhood in a more radiogenic and higher altitude area, could have come from areas that are relatively close to Marroquíes, such as the Baetic Zone (Figure 6).
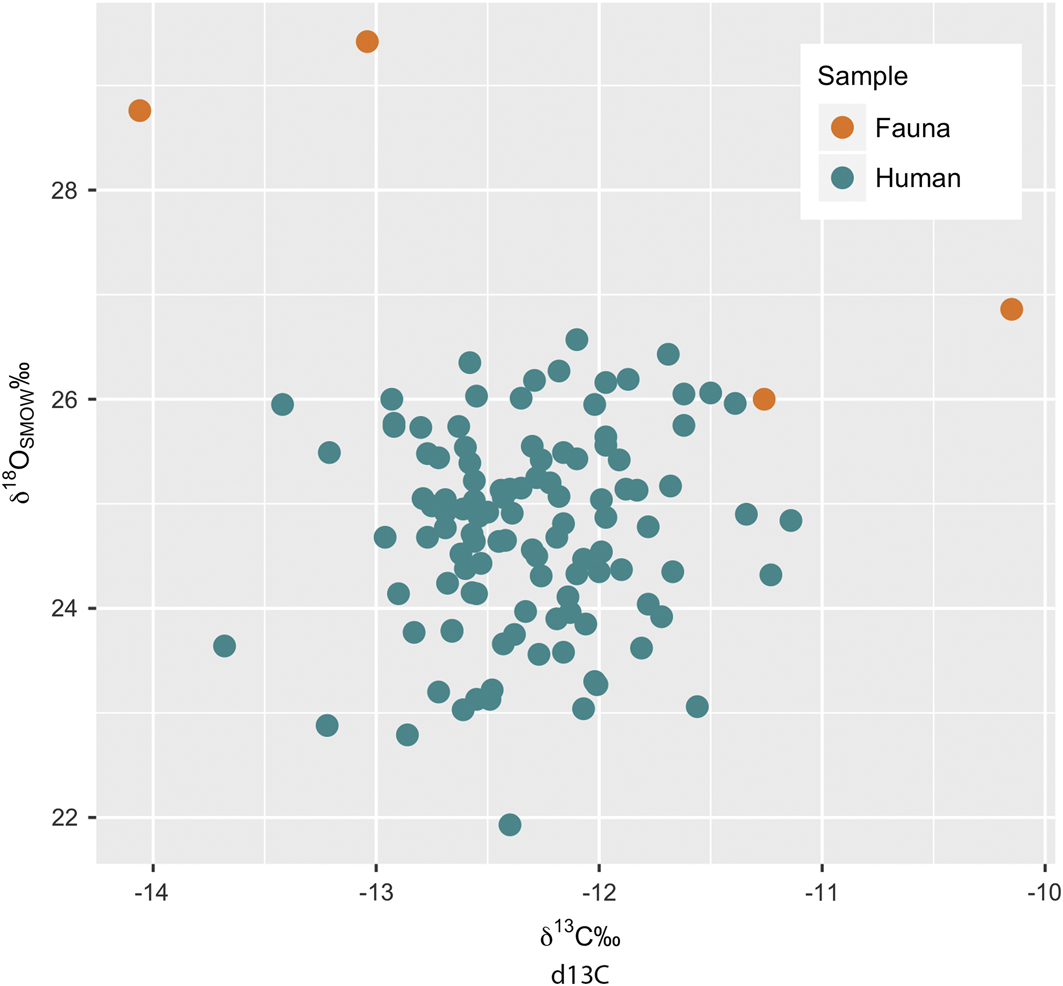
Figure 9 δ18OV-SMOW and δ13C values for human and faunal samples from Marroquíes.
To summarise, the results of δ 18O and 87Sr/86Sr analyses suggest that at least six of the 115 individuals sampled from the Marroquíes mortuary population can be considered non-locals. Strontium isotope ratios show 1/78 (1 per cent) non-local individuals at N4—the earliest in the sequence—5/22 (23 per cent) at N1—contemporaneous with the peak of the aggregation process—and none at N2, at a time when the site shows signs of depopulation. One child (birth–6.9 years of age), one juvenile (7–12.9 years of age), two young adults (21–40 years of age) and two middle adults (41–60 years of age) show non-local strontium isotope ratios. For oxygen, it was only possible to assess sex for three of the non-local adults, and all three estimates were female. Although the sample size is small, the results are consistent with research on sex and mobility in central Spain (Díaz-del-Río et al. Reference Díaz-del-Río, Waterman, Thomas, Peate, Tykot, Martínez-Navarrete and Vicent2017b) and late prehistoric Europe more broadly, where females are shown to be the more mobile sex (Knipper et al. Reference Knipper, Mittnik, Massy, Kociumaka, Kucukkalipci, Maus, Wittenborn, Metz, Staskiewicz, Krause and Stockhammer2017). The non-local subadults present a particularly intriguing case because at 5–7.5 years of age, these individuals were probably relatively recent additions to the Marroquíes community. Despite growing up outside of the local area, both subadults were given typical mortuary treatment, buried in close proximity to local adults in CE13 and CE14. Regardless of where newcomers originated, it appears that local institutions at Marroquíes were socially inclusive, developing mechanisms that integrated these individuals in both life and death.
Conclusions
The isotopic evidence presented here suggests that at the peak of mega-site activity in third-millennium BC Iberia, Copper Age social institutions developed inclusive mechanisms that allowed for the incorporation of both regional and extra-regional immigrants into such communities. Newcomers appear to have been incorporated into the social fabric as full members of the community through pre-existing structuring principles, an inclusion that was overtly sanctioned in death through their incorporation into the local mortuary landscape. The flexibility and inclusiveness of these principles, frequently recognised as a fundamental quality of kinship-based groups, were combined with a resource-rich environment and simple but effective technologies to create conditions that permitted such large-scale aggregation. For several centuries, the social, economic and ideological benefits outweighed the costs of living together. When these ceased—perhaps prompted by prolonged cycles of bad harvests during the 4.2 ka cal BP event—the commitment to these norms and institutions disintegrated. This led to the radical reorganisation of the Iberian mega-sites and their constituent populations at the turn of the second millennium BC.
Acknowledgements
Francisca Hornos (Museo de Jaén) and Narciso Zafra (Delegación Territorial de Cultura, Turismo y Deporte, Jaén) facilitated access to the collections and archival information. Research was made possible by the University of Michigan, Museum of Jaén, the Briggite-Schlieben-Lange programme, the Ministerio de Economía y Competitividad de España (HAR2013-47776-R), the National Science Foundation (BCS-1440017), the SFB 1070 ‘Ressourcenkulturen’ at Tübingen University and Proyectos conjuntos CSIC—Fundación Presidente de Rusia para la Investigación Fundamental (2010RU0086) and a Marie Sklodowska-Curie European Fellowship (746216). Elmar Reitter and Ilka Schoenberg measured the 87Sr/86Sr, and Bernd Steinhilber the δ13C and δ18O values. Thanks are also due to the two anonymous reviewers whose suggestions contributed to this manuscript.
Supplementary material
To view supplementary material for this article, please visit https://doi.org/10.15184/aqy.2018.33


 Open access