

Recent studies highlight the increasing prominence of non-communicable diseases in the global burden of disease, and poor dietary quality as a key risk factor( Reference Lozano, Naghavi and Foreman 1 ). Ten per cent of total global disability-adjusted life years lost in 2013 were attributed to dietary risk factors and physical inactivity( Reference Forouzanfar, Alexander and Anderson 2 ). The widespread shift from communicable to non-communicable diseases is now concentrated in low- and middle-income countries, and has been accompanied by a global trend towards increased consumption of energy-dense, processed foods, known as the nutrition transition( Reference Popkin 3 ).
Recently, a study investigated dietary quality and trends among adults both within and across countries, but evidence on evolving dietary patterns for children and adolescents is lacking, particularly for low- and middle-income countries( Reference Imamura, Micha and Khatibzadeh 4 – Reference Adair and Popkin 6 ). Considering the global increase of non-communicable diseases such as type 2 diabetes and hypertension, and of overweight and obesity during childhood and adolescence, this is a critical gap limiting effective policy design( Reference Wang and Lim 7 – Reference Ng, Fleming and Robinson 9 ).
Adolescence constitutes a key entry point for interventions aiming to build healthy diets over the life course, as evidence shows that dietary patterns ‘track’ to adulthood( Reference Sawyer, Afifi and Bearinger 10 – Reference Mikkilä, Räsänen and Raitakari 14 ). Such policies could potentially avert the onset of non-communicable diseases. Additionally, as individuals under 15 years of age constitute a quarter of the global population and almost half of the population in sub-Saharan Africa, interventions that reduce non-communicable diseases may entail substantial cost savings for global health systems( Reference Forouzanfar, Alexander and Anderson 2 , 15 ).
The limited evidence on adolescents’ diets is mostly attributable to scattered data availability and quality( Reference Ochola and Masibo 5 ). Dietary intake studies are typically confined to one country and based on small cross-sectional samples, usually from urban populations, which limits comparability within and across countries, as well as over time. A further challenge is the comparability of dietary assessment methods across studies( Reference Ochola and Masibo 5 , Reference Barnett, Ariana and Petrou 16 ).
The present study documents changes in dietary diversity and dietary composition among adolescents in Ethiopia, India, Peru and Vietnam between 2006 and 2013. We investigated the degree to which convergence in dietary diversity occurred across countries as well as within countries along three dimensions: gender, urban residence and household wealth. The prevalence in the consumption of foods with added sugars was also assessed.
The study is unique in that it draws from large-scale, cross-country data of the Young Lives study. Two cohorts were sampled and assessed using the same standardized approach in each country. Findings from the analysis can inform our understanding of the changes entailed by the nutrition transition and the speed at which they are taking place among adolescents in developing countries.
Participants and methods
Young Lives Study
The investigation draws on Young Lives, a longitudinal study of childhood poverty conducted in four countries: Ethiopia, India (Andhra Pradesh and Telangana), Peru and Vietnam over 15 years (www.younglives.org.uk)( Reference Barnett, Ariana and Petrou 16 ). A multistage sampling approach was used to select the study participants. First, within each country, twenty ‘sentinel sites’ were selected in order to reflect the diversity of geographical, socio-economic and cultural contexts of the country, but which were not intended to be necessarily nationally representative. Second, within each sentinel site, about 100 households with a child aged between 6 and 18 months (younger cohort, YC) and about fifty householdsFootnote * with a child aged between 7 and 8 years (older cohort, OC) were randomly selected( Reference Barnett, Ariana and Petrou 16 ). Therefore, the two cohorts are comparable in terms of both sampling approach and the communities in which they live. More information on country-specific sampling procedures have been documented elsewhere( Reference Alemu, Asgedom and Liebenberg 17 – Reference Tuan, Lan and Harpham 20 ).
Child, household and community survey data were collected over four rounds (2001/02, 2006–2007, 2009–2010 and 2013–2014); a fifth round is planned. Our analysis focused on Round 2 data from the OC collected between January and July 2006, and Round 4 data from the YC collected between August 2013 and March 2014, when adolescents from both cohorts were about 12 years of age. In each round, informed consent was given by the caregivers and assent obtained from the adolescents( Reference Barnett, Ariana and Petrou 16 ).
Following the FAO guidelines on individual dietary diversity, a structured questionnaire probing foods eaten during the past 24 h was developed and administered by trained fieldworkers to both the OC and the YC( Reference Kennedy, Ballard and Dop 21 ). This allowed us to investigate cross-cohort changes in dietary quality in two populations of 12-year-olds living in the same communities at two different points in time.
Attrition in Young Lives is extremely low, both in absolute terms and relative to similar studies conducted in low- and middle-income countries( Reference Outes-Leon and Dercon 22 ): between Rounds 1 and 2, an estimated 1·8 % of the OC children were lost to follow up (Ethiopia: 1·9 %; India: 1·3 %; Peru: 3·6 %; Vietnam: 0·7 %), while the attrition (excluding deaths) of the YC between Rounds 1 and 4 was 3·7 % (Ethiopia: 2·2 %; India: 2·6 %; Peru: 6·3 %; Vietnam: 3·6 %)( 23 – 26 ). As the present study compares two cohorts at a specific point in time, attrition is only a concern to the degree that it is differential across cohorts and affects their comparability in terms of the sampling. For this reason, attrition patterns were examined for both cohorts by adolescent’s gender, caregiver’s education and household wealth index at Round 1 (see online supplementary material, Supplemental Table 1). Consistent with previous research( Reference Outes-Leon and Dercon 22 ), overall differences between the children who dropped out and the ones who remained in the study were minimal although some non-random patterns of attrition were found in the case of India and Vietnam OC (for which the number of dropped-out children was extremely low).
Study settings
The four study countries vary greatly in terms of socio-economic development, urbanization and stage in the nutrition transition. Of the four countries, Ethiopia had the lowest per capita income and experienced the highest rate of economic growth over the period (Table 1). The other countries also underwent significant economic development. Undernutrition and micronutrient deficiencies are widespread in all the countries, while overweight and obesity are emerging concerns, particularly in Peru and in urban areas of India, Ethiopia and Vietnam( Reference Chaparro and Estrada 27 – Reference Bishwajit, Ide and Hossain 29 ).
Study settings: national data
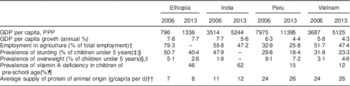
GDP, gross domestic product; PPP, purchasing power parity.
Data on GDP, GDP growth, employment in agriculture, stunting and overweight were retrieved from the World Bank( 43 ); data on vitamin A deficiency were sourced from the WHO(44); and data on protein supply were sourced from the FAO( 45 ).
† Data for Ethiopia relate to 2005 (latest available), for India to 2005 and 2012, for Peru to 2006 and 2011, and for Vietnam to 2006 and 2012.
‡ Percentage of children under age 5 years whose height-for-age is below –2 sd from the median height-for-age of the WHO reference population of the corresponding age.
§ Data for Ethiopia relate to 2005 and 2014, for India to 2006 (latest available), for Peru to 2005 and 2012, and for Vietnam to 2006 and 2010.
|| Percentage of children under age 5 years whose weight-for-height is more than 2 sd above the median weight-for-height of the international reference population of the corresponding age.
¶ Latest data available: Ethiopia 1996–1997, India 2001–2003, Peru 2001, Vietnam 2001.
†† Data relate to the average 2005–2007 and 2009–2011 (latest available).
Outcome measures
Individual dietary diversity and consumption of specific food groups were the outcome measures for the analysis and were derived from the dietary diversity module of the Young Lives study. Dietary diversity was defined as the number of food groups eaten by the adolescent during the past 24 h from a predefined list of food groups( Reference Ruel 30 – Reference Mirmiran, Azadbakht and Esmaillzadeh 33 ).
OC and YC adolescents were asked to describe all the meals and snacks they had eaten in the previous 24 h with further probing using country-specific lists of commonly eaten foods in order to determine, for each food group, whether at least one food item had been eaten. Fieldworkers were specifically instructed to ask about the intervals between meals in order to accurately reconstruct the respondent’s dietary diversity during the previous day and limit exclusion of meals, particularly snacks. The specific food items used as examples for the food groups were adapted in order to reflect the local diets in each country. For example, items such as chapattis or injera, both common items in the ‘grains group’, were specifically mentioned in the India and Ethiopia versions of the questionnaire, respectively.
The eleven and fifteen food groups listed in 2006 and 2013 respectively were collapsed into seven food groups as follows to construct individual dietary diversity scores( Reference Ruel 30 , Reference Swindale and Bilinsky 31 ): (i) grains, roots and tubers; (ii) fruits and vegetables; (iii) meat, offal and fish (generically called ‘meat and fish’); (iv) eggs; (v) pulses, legumes and nuts; (vi) milk and milk products; and (vii) food cooked in oil or fat. In the OC data, it was not possible to disaggregate between ‘vitamin A-rich plant foods’ and ‘other fruits and vegetables’ and so only seven food groups, instead of eight, were generated to allow for comparability with the YC sample. Foods with added sugars are not included in the dietary diversity measure as they do not contribute to healthy diets( Reference Ruel 30 , Reference Swindale and Bilinsky 31 ). Nevertheless, this food group was also analysed due to its association with overweight and obesity( 34 ).
Data cleaning and statistical analysis
Some data cleaning was necessary in order to compute the dietary diversity scores. For the grains, roots and tubers food group for Vietnam YC, the Round 3 responses were used instead of the Round 4 responses as rice was not translated into the local language during the Round 4 data collection and therefore this food group was likely under-reported.Footnote * Consumption of meat, fish and eggs was coded as missing values in the raw data if the adolescent declared that he/she was vegetarian. These values were recoded as zero if they were missing in the case of vegetarian adolescents. Most replacements were done in India, where forty and fifty-seven vegetarian adolescents were found in the OC and YC, respectively. Three OC and twelve YC adolescents were vegetarian in Ethiopia, while fifteen YC adolescents were vegetarian in Vietnam and were therefore replaced. No vegetarian adolescents were identified in Peru.
Dietary diversity scores could not be computed for adolescents who did not respond to any of the questions in the module. After these exclusions and the above-mentioned cleaning, data on dietary diversity and consumption of food groups were available for 978, 994, 683 and 990 adolescents in the OC in Ethiopia, India, Peru and Vietnam, and for 1867, 1909, 1724 and 1891 adolescents in the YC in Ethiopia, India, Peru and Vietnam, respectively. The final analytic sample represented about 99 % of the original sample.
Descriptive statistics and the differences in covariates by cohort and country were assessed using t tests. Covariates included the following: adolescent’s gender and age in months; main caregiver’s age, gender and years of schooling; head of the household’s age and gender; household size and place of residence (urban/rural); and a wealth index constructed on the basis of the household’s access to services (sanitation, water, electricity, cooking fuel), quality of housing (number of rooms, quality of roofing, walls and floors) and ownership of durable assets( Reference Alemu, Asgedom and Liebenberg 17 – Reference Tuan, Lan and Harpham 20 ). The wealth index ranges from 0 to 1. Similar indices have been used in other studies from low-resource settings as a proxy for socio-economic status( Reference Di Cesare, Bhatti and Soofi 35 ).
Descriptive statistics and the differences in the outcome variables by cohort were estimated for each country using t tests. For each country, multivariate linear regression models on pooled cohort data were fitted by adjusting for the covariates outlined above with clustered standard errors at the sentinel site level. In addition, each model included a cohort dichotomous variable and interactions between this variable and adolescent gender, place of residence and wealth index tertile. The interaction terms allowed us to model potentially non-linear relationships. Predicted margins of the outcome variables for each country were then computed to adjust for the covariates and unconditional standard errors were assumed. Margins provide the predicted value of dietary diversity (or consumption of the food group) of the adolescent after adjusting for background characteristics. In the case of the interactions (e.g. urban/rural), those adjusted predictions provide the value of dietary diversity for an ‘average’ adolescent living in an urban area and compare it with the value estimated for a rural adolescent, after adjusting for all the other characteristics. We investigated differences by gender, place of residence (rural/urban) and household wealth. The statistical software package Stata version 13 was used for the analysis.
Results
How do the two cohorts compare in terms of background characteristics?
Table 2 presents the covariate means from each country and cohort. The gender composition of the sample was comparable across cohorts and within country, except for India, where more males were present. Statistically significant differences by age between the cohorts were noted. In all countries except Peru, the wealth index improved over the 2006–2013 period, suggesting improved standards of living (Table 1). The finding related to Peru may be a result of the sampling, as only twenty-five households (instead of fifty) were recruited from some rural sites in Round 1( Reference Escobal, Lanata and Madrid 19 ). In the other countries, the proportion of urban households was fairly stable across the two cohorts.
Descriptive statistics for covariates used in the analysis and P values of differences in mean values, by country and cohort, Young Lives study

OC, older cohort (born 1994/95); YC, younger cohort (born 2001/02).
† Wealth index is a composite asset index which ranges from 0 to 1.
‡ The definition of urban/rural is based on each country’s National Statistical Office definition.
§ A substantively larger proportion of the OC in Peru is urban, because only twenty-five children were recruited in some of the provincial sites towards the end of the enrolment in the first round of the study.
Are there cross-cohort differences in dietary diversity and consumption of food groups?
Table 3 presents the predicted values of dietary diversity by cohort and country, as well as consumption of each of the food groups and added sugars, after adjusting for the covariates (see online supplementary material, Supplemental Table 2 for the raw means). Over the 8 years, dietary diversity increased in Ethiopia and Peru although different food groups were responsible for the observed change (P<0·001). In Ethiopia, the YC had higher consumption of fruit and vegetables by +36 % (P<0·001) and foods cooked in oil by +18 % (P=0·002) compared with the OC at the same age. In Peru the YC consumed more animal-source foods, specifically meat and fish (+72 %, P<0·001) and milk and dairy products (+16 %, P=0·004) compared with the OC. Meat, rather than fish, drove this significant increase in the meat and fish group in the YC (result not shown).
Predicted margins (multi-adjusted means) and unconditional standard errors in outcome variables, and pairwise comparisons of cross-cohort differences in predicted margins, by country, Young Lives study

OC, older cohort (born 1994/95); YC, younger cohort (born 2001/02).
Estimations adjusted for adolescent’s gender and age in months, caregiver’s age, gender and educational level, head of the household’s age and gender; household size, wealth tertiles, place of residence (urban/rural), cohort, and interactions between cohort and gender, cohort and wealth tertiles, and cohort and place of residence.
While dietary diversity was stable across cohorts in India and Vietnam, some significant changes by individual food groups occurred. As compared with the OC, a larger proportion of YC adolescents consumed eggs (India: +32 %, P=0·038; Vietnam: +50 %, P<0·001) and milk and dairy products (India: +12 %, P=0·029; Vietnam: +46 %, P<0·001). The YC in Vietnam was less likely to consume foods cooked in oil (−68 %, P=<0·001), while in India YC consumption of pulses, legumes and nuts decreased by 57 % (P=0·02).
During the period considered, the intake of added sugars grew substantially in Ethiopia (+35 %, P<0·001) and Vietnam (+44 %, P<0·001). Compared with these countries, the prevalence of consumption was higher in Peru and India and stable across the cohorts.
Are there subgroup differences in dietary shifts?
Figures 1 to 3 present predicted values of dietary diversity by gender, household wealth, place of residence and cohort. There were no marked disparities by gender (Fig. 1). In contrast, dietary diversity varied significantly by tertile of household wealth for both cohorts (Fig. 2). In 2006, Ethiopia and Vietnam exhibited the widest difference between the top and the lowest wealth tertiles in dietary diversity (inter-tertile gap, Ethiopia: 0·72, P<0·001; Vietnam: 0·61, P<0·001), followed by India (inter-tertile gap: 0·31, P=0·004). Over the 2006–2013 period, inequalities in food consumption based on household wealth tertiles disappeared in Ethiopia and India, and decreased in the case of Vietnam (inter-tertile gap: 0·26, P=0·029). Finally, Fig. 3 presents disparities by place of residence. Urban/rural gaps in dietary diversity were not apparent in India and Ethiopia at either point in time. By contrast, pro-urban differences were evident in 2006 and waned over time in Peru and Vietnam. In Peru, this result was driven by an increase in dietary diversity in both urban and rural areas (P<0·001, result not shown).
Differences in dietary diversity by adolescent gender (![]() , girls;
, girls; ![]() , boys), country and cohort (OC, older cohort (born 1994/95); YC, younger cohort (born 2001/02)), Young Lives study. Predicted margins, with their standard errors represented by vertical bars, adjusted for adolescent’s gender and age in months, caregiver’s age, gender and educational level, head of the household’s age and gender, household size, wealth tertile, urban residence, cohort, and interactions between cohort and gender, cohort and wealth tertiles, and cohort and urban residence. *P<0·1, **P<0·05.
, boys), country and cohort (OC, older cohort (born 1994/95); YC, younger cohort (born 2001/02)), Young Lives study. Predicted margins, with their standard errors represented by vertical bars, adjusted for adolescent’s gender and age in months, caregiver’s age, gender and educational level, head of the household’s age and gender, household size, wealth tertile, urban residence, cohort, and interactions between cohort and gender, cohort and wealth tertiles, and cohort and urban residence. *P<0·1, **P<0·05.

Differences in dietary diversity by household wealth (![]() , poorest tertile, equivalent to the lowest household wealth tertile;
, poorest tertile, equivalent to the lowest household wealth tertile; ![]() , least poor tertile, equivalent to the highest household wealth tertile), country and cohort (OC, older cohort (born 1994/95); YC, younger cohort (born 2001/02)), Young Lives study. Predicted margins, with their standard errors represented by vertical bars, adjusted for adolescent’s gender and age in months, caregiver’s age, gender and educational level, head of the household’s age and gender, household size, wealth tertiles, urban residence, cohort, and interactions between cohort and gender, cohort and wealth tertiles, and cohort and urban residence. **P<0·05, ***P<0·01
, least poor tertile, equivalent to the highest household wealth tertile), country and cohort (OC, older cohort (born 1994/95); YC, younger cohort (born 2001/02)), Young Lives study. Predicted margins, with their standard errors represented by vertical bars, adjusted for adolescent’s gender and age in months, caregiver’s age, gender and educational level, head of the household’s age and gender, household size, wealth tertiles, urban residence, cohort, and interactions between cohort and gender, cohort and wealth tertiles, and cohort and urban residence. **P<0·05, ***P<0·01

Differences in dietary diversity by place of residence (![]() , rural;
, rural; ![]() , urban), country and cohort (OC, older cohort (born 1994/95); YC, younger cohort (born 2001/02)), Young Lives study. Predicted margins, with their standard errors represented by vertical bars, adjusted for adolescent’s gender and age in months, caregiver’s age, gender and educational level, head of the household’s age and gender, household size, wealth tertiles, urban residence, cohort, and interactions between cohort and gender, cohort and wealth tertiles, and cohort and urban residence. **P<0·05, ***P<0·01
, urban), country and cohort (OC, older cohort (born 1994/95); YC, younger cohort (born 2001/02)), Young Lives study. Predicted margins, with their standard errors represented by vertical bars, adjusted for adolescent’s gender and age in months, caregiver’s age, gender and educational level, head of the household’s age and gender, household size, wealth tertiles, urban residence, cohort, and interactions between cohort and gender, cohort and wealth tertiles, and cohort and urban residence. **P<0·05, ***P<0·01

Which food groups drove within-country variation over time in dietary diversity?
We investigated whether these overall shifts occurred homogeneously across socio-economic groups within countries. Figure 4 illustrates uneven trends in the consumption of the food groups that represent the principal sources of protein (pulses, legumes and nuts; meat and fish; eggs; and milk and dairy products) by wealth tertiles for the four countries( Reference Ochola and Masibo 5 ). In Ethiopia, predicted consumption of pulses, legumes and nuts among adolescents from less wealthy households converged over time to the prevalence exhibited by adolescents from more affluent households, which remained relatively stable. Convergence was also noted in India for the same food group, but to a lower prevalence across all wealth tertiles for the YC (OC: 0·108, P=0·025; YC: −0·006, P=0·839). In Peru, the consumption of meat and fish increased homogeneously across wealth tertiles although a small gap between children belonging to the top and the lowest wealth tertiles was evident for the YC (OC: 0·114, P=0·105; YC: 0·067, P=0·011). In Vietnam, the inter-tertile disparity in milk consumption widened in favour of adolescents in the least poor tertile (OC: 0·15, P=0·016; YC: 0·199, P<0·000).
(colour online) Heterogeneity in consumption of food groups contributing to protein consumption by household wealth (wealth tertiles defined based on household wealth, which was estimated as wealth index: ![]() , poorest tertile;
, poorest tertile; ![]() , second tertile;
, second tertile; ![]() , least poor tertile), country and cohort (OC, older cohort (born 1994/95); YC, younger cohort (born 2001/02)), Young Lives study. Predicted margins, with their 95 % confidence intervals represented by vertical bars, adjusted for adolescent’s gender and age in months, caregiver’s age, gender and educational level, head of the household’s age and gender, household size, wealth tertiles, urban residence, cohort, and interactions between cohort and gender, cohort and wealth tertiles, and cohort and urban residence
, least poor tertile), country and cohort (OC, older cohort (born 1994/95); YC, younger cohort (born 2001/02)), Young Lives study. Predicted margins, with their 95 % confidence intervals represented by vertical bars, adjusted for adolescent’s gender and age in months, caregiver’s age, gender and educational level, head of the household’s age and gender, household size, wealth tertiles, urban residence, cohort, and interactions between cohort and gender, cohort and wealth tertiles, and cohort and urban residence

Figure 5 presents differing patterns in the prevalence of consumption of added sugars by place of residence. In Ethiopia, consumption increased in both rural and urban areas while the urban–rural gap was maintained (OC: 0·18, P=0·041; YC: 0·197, P<0·000). A striking convergence was observed in Vietnam where added sugar consumption in rural areas was low relative to urban areas in 2006, but comparable to urban areas in 2013 (OC: 0·26, P=0·003; YC: 0·037, P=0·477). In India and Peru, prevalence of sugar consumption decreased in urban areas while it increased in rural areas, resulting in narrower disparities based on location.
(colour online) Heterogeneity in consumption of added sugars consumption by place of residence (![]() , rural;
, rural; ![]() , urban), country and cohort (OC, older cohort (born 1994/95); YC, younger cohort (born 2001/02)), Young Lives study. Predicted margins, with their 95 % confidence intervals represented by vertical bars, adjusted for adolescent’s gender and age in months, caregiver’s age, gender and educational level, head of the household’s age and gender, household size, wealth tertiles, urban residence, cohort, and interactions between cohort and gender, cohort and wealth tertiles, and cohort and urban residence
, urban), country and cohort (OC, older cohort (born 1994/95); YC, younger cohort (born 2001/02)), Young Lives study. Predicted margins, with their 95 % confidence intervals represented by vertical bars, adjusted for adolescent’s gender and age in months, caregiver’s age, gender and educational level, head of the household’s age and gender, household size, wealth tertiles, urban residence, cohort, and interactions between cohort and gender, cohort and wealth tertiles, and cohort and urban residence

Discussion
The present study documents dramatic and rapid shifts in diets among two comparable cohorts of adolescents in Ethiopia, India, Peru and Vietnam that took place between 2006 and 2013. For example, dietary diversity among 12-year-olds increased in Ethiopia and Peru while inter-country disparities in overall dietary quality remained, reflecting different stages of economic development and nutrition transition( Reference Drewnowski and Popkin 36 ). Our results also provide some indications that adolescents’ dietary diversity is converging across population subgroups within countries, particularly with respect to household wealth.
While the dietary diversity score provides a good indication of shifting diets across and within countries over time, the measure may mask underlying heterogeneity regarding the food groups driving those changes. The results related to the cross-cohort changes in consumption of individual food groups reflect the hypothesis of the nutrition transition, which implies substitution of vegetable-source foods for animal-source foods and increased intake of added sugars( Reference Popkin 3 , Reference Ochola and Masibo 5 ).
All together, the findings from the present study shed light on three distinguishing features concerning adolescent diets in developing countries. First, prior studies have indicated that adolescents in developing countries typically tend to consume a plant-based diet based on cereals, roots and tubers, with little intake of animal-source foods, especially in rural areas( Reference Ochola and Masibo 5 ). In the present study, adolescents in urban areas of Peru and Vietnam were more likely to have a diverse diet while differences with respect to rural areas narrowed over time. A similar pattern of decreased rural–urban disparities was observed in China and in Cebu, Philippines( Reference Adair and Popkin 6 ). By contrast, adolescent diets in Ethiopia and India were similarly diverse in rural and urban areas at both points in time although disparities may have existed prior to 2006.
Second, an increased likelihood of consuming processed foods and sugary products is another defining feature of adolescent diets highlighted by the literature( Reference Ochola and Masibo 5 ). This may be driven in part by increased consumption of meals and snacks outside the home, as was found among adolescents in China between 1991 and 2000( Reference Adair and Popkin 6 ). In the present study, consumption of added sugars became more common in Ethiopia and Vietnam, with similar rates across urban and rural areas. By contrast, in Peru and India overall consumption remained stable, although for different reasons: in Peru virtually all adolescents reported added sugar consumption at both time points, while in India the slight increase in rural areas was offset by a decline in urban sites. While energy intake from sugary foods as well as the locale for their consumption were not specifically investigated here, these findings strongly suggest that significantly more adolescents were consuming added sugar and these changes occurred in a relatively short time span.
Lastly, prior studies have highlighted that adolescents in developing countries typically consume an adequate amount of protein, mostly from plant foods( Reference Ochola and Masibo 5 ). In the present study, adolescents were more likely to consume animal-source foods at the expense of the consumption of pulses, legumes and nuts in all countries except Ethiopia. Specifically, in India and Vietnam, consumption of eggs and dairy products drove this shift, while in Peru meat was the main driver. This is consistent with the increase in supply of protein of animal origin in all countries in the period considered (Table 1), as well as with the theory of the nutrition transition, according to which the primary source of protein consumption may shift from vegetable to animal as per capita income increases( Reference Drewnowski and Popkin 36 ).
The noted changes in dietary diversity and dietary composition may reflect the consequences of global economic forces on food systems( Reference Hawkes 37 ). Within-country disparities however may be exacerbated or reduced, depending on how these forces interact with the socio-economic and political context( Reference Hawkes 37 ). Changes and convergence in diets can be particularly pronounced for adolescents, who may be more exposed to and influenced by food environmental factors related to the nutrition transition such as food advertising and promotion( Reference Imamura, Micha and Khatibzadeh 4 , Reference Hawkes 37 ). The results suggest that the four countries could be placed along the continuum of the nutrition transition as follows: Ethiopia (earlier stage), India (intermediate stage), Vietnam (intermediate stage) and Peru (later stage). This assessment can inform the design of policies and strategies to avert the negative consequences of the nutrition transition( Reference Popkin 38 ).
Some limitations merit discussion. Individual dietary diversity is considered a proxy for the macro- and micronutrient adequacy of the diet for different age groups including adolescents and is associated with individual nutrient adequacy( Reference Ruel 30 , Reference Steyn, Nel and Nantel 32 , Reference Mirmiran, Azadbakht and Esmaillzadeh 33 ). Nevertheless, research in this area is still ongoing and, except for women of reproductive age and infants and young children, there are no definite guidelines on which food groups should be included in the score for different sex/age groups( Reference Kennedy, Ballard and Dop 21 , 39 , 40 ). In contrast to nutrient intake assessments, this measure is less burdensome to collect and simpler to analyse. However, the measure did not include quantities or nutritional quality of the reported foods, including consumption of ultra-processed foods which can have significant impacts on energy and nutrient intakes( Reference Monteiro, Bertazzi Levy and Moreira Claro 41 ). Other shortcomings of the data were as follows. The data are based on a description of meal content over 24 h. There may have been some inaccuracy and possible recall bias in reporting all foods consumed but care was taken to reconstruct everything eaten from waking in the morning to sleeping at night in order to avoid missing snacks between meals. Alternatively, willingness to report from adolescents may be affected by psychosocial factors relevant to this age group, such as concerns related to body image( Reference Ochola and Masibo 5 ). The covariate analysis in Table 2 illustrates sociodemographic differences between the two cohorts, an issue that has been highlighted in other cross-cohort studies( Reference Dearth-Wesley, Gordon-Larsen and Adair 42 ). The multivariate estimation of predicted margins sought to uncover trends that could not be ascribed to the differing sociodemographic profiles of the cohorts. More research on other factors that may underlie changing diets, such as changes in preferences, tastes and food environments, is needed. Finally, the data were not nationally representative. Despite this, analysis of key living standards indicators from Young Lives suggests that the type of variation found in Young Lives data is comparable with nationally representative surveys from the same countries( Reference Barnett, Ariana and Petrou 16 ).
Conclusions
The current study presents new evidence regarding the nutrition transition and dietary composition among adolescents in four very different low- and middle-income countries. Dietary diversity increased for most countries while indications of intra-country convergence by household wealth and place of residence were observed. However, care should be taken in drawing general conclusions given significant heterogeneity of diets both across and within countries. Regardless of this, the speed in which diets are transforming clearly signals the urgent need for global, regional and context-specific policies to avert negative and costly consequences for health-care systems and societal well-being. For children and adolescents in particular, school-based policies and interventions hold promise for promoting healthy diets over the life course.
Acknowledgements
Acknowledgement: The authors would like to acknowledge the Young Lives study for providing them with preferential access to the data. Financial support: This research received no specific grant from any funding agency in the public, commercial or not-for-profit sectors. E.A. received partial support from The Sackler Institute for Nutritional Science. Young Lives is funded from 2001 to 2017 by UK Aid from the Department for International Development (DFID) and co-funded by Irish Aid from 2014 to 2015. None of the funders had a role in the design, analysis or writing of this article. The views expressed are those of the authors. They are not necessarily those of, or endorsed by, Young Lives, the University of Oxford or DFID. Conflict of interest: M.E.P. has received research funding from the food industry for unrelated studies. The other authors declare no competing interests. Authorship: E.A. formulated the research questions, had access to the data in the study, analysed the data and prepared the results. M.F. contributed to develop the research questions. E.A. and M.F. wrote the report. M.E.P. contributed to the design of the survey instruments and to the draft and revisions of the report. Ethics of human subject participation: This study was conducted according to the guidelines laid down in the Declaration of Helsinki. The ethics committee of Oxford University approved the study.
Supplementary material
To view supplementary material for this article, please visit http://dx.doi.org/10.1017/S1368980016001865


