


1. Introduction
An essential design practice is to know how to compare the products and services available on the market, for at least two reasons.
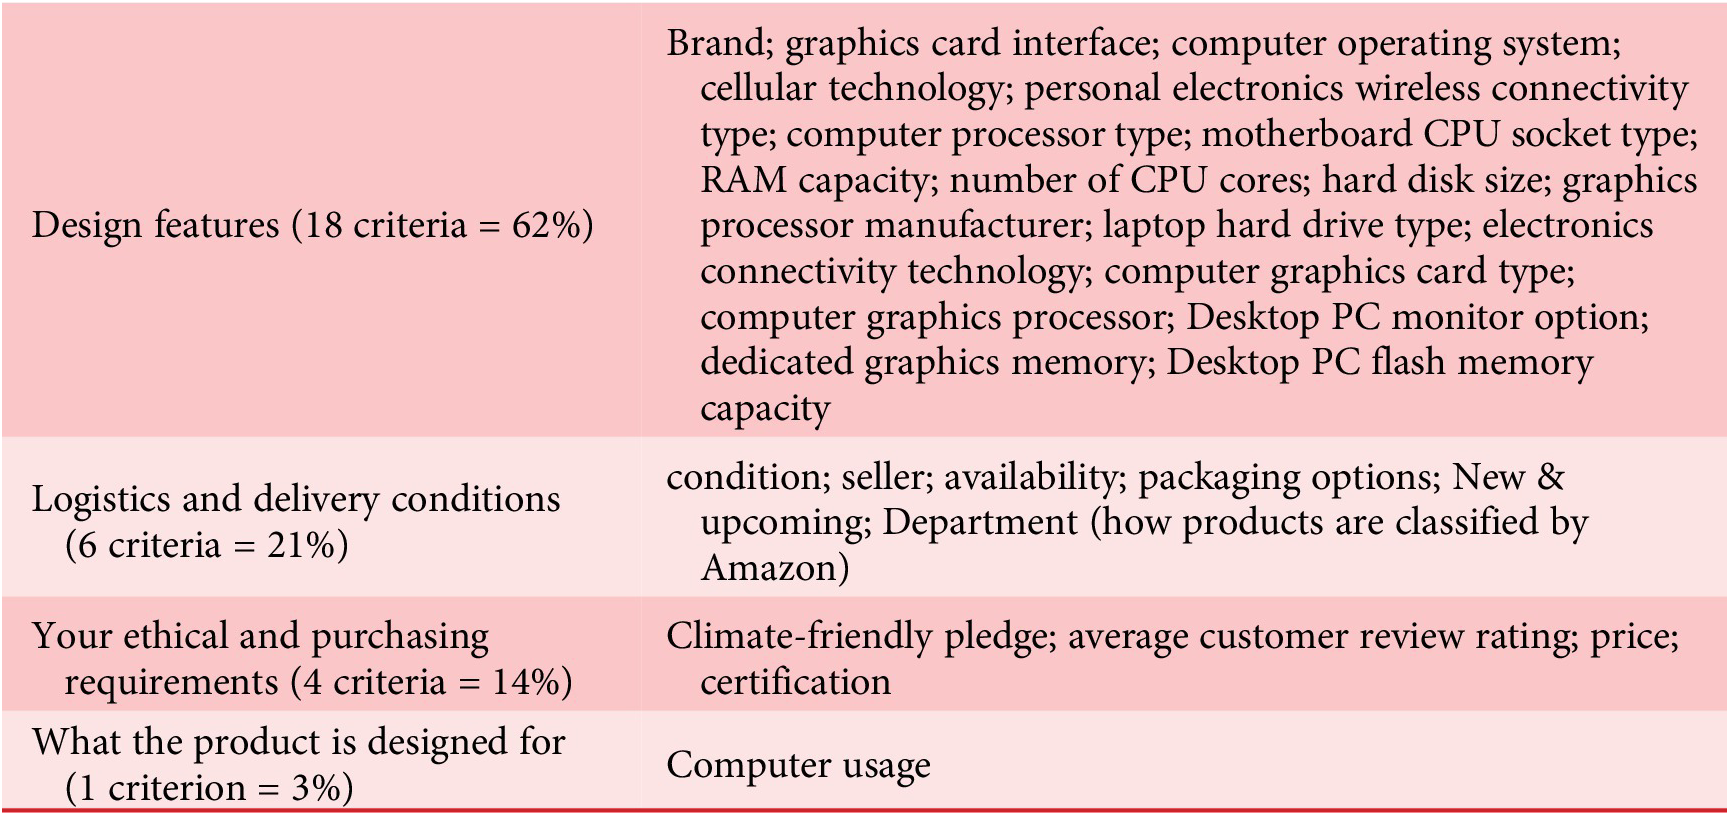
Firstly, as a consumer and user, you would like to know which product best fits your expected performance and preferences. Therefore, big retailers provide comparators, especially when you want to buy a product in a well-identified category, such as electronic goods. For instance, in the category “tower computer” on AmazonFootnote 1, there are 29 comparator criteria proposed (see Table 1). Unfortunately, most of these criteria are design features (18 out of 29, that is 62%), 6 concern logistics and delivery conditions (21%), 4 concern your ethical and purchasing requirements (14%), and only one globally considers the main categories of computer usage (Business, Gaming, Multimedia, Personal). However, unless you are an excellent expert, the design features that characterize how the product is made will not directly inform you on whether the product will effectively deliver the expected service in the usage situations and contexts you intend to use it in. The main reason is that it is very hard to link design features with one or more precise usage situations, and the set of expected performances varies from one usage situation to another. For instance, we know that for gaming, an important performance metric is frame rate per second, which depends on the quality of several design features (inventoried in Table 1) but also on how well they work together and on the in-tower cooling system (which is not even mentioned in the 29 Amazon-selectable design features listed in Table 1). A second reason is that your preferences and personal contexts of use are not declared (for instance, do you need drop shadow calculation in 3D games?). Comparators tend to sacrifice the usage part, whereas the focal issue is not how product features compare but how the products can effectively contribute to a specific activity – further denominated effectiveness – depending on who you are and your usage contexts.
The 29 comparison criteria selectable when you purchase a “tower computer” on Amazon
Secondly, as a company looking to innovate with a need-seeker strategy (Jaruzelski et al., Reference Jaruzelski, Loehr and Holman2012, Reference Jaruzelski, Staack and Goehle2014), you want to determine where it would be both useful and profitable to innovate. You would like to be able to characterize precisely the strengths of your competitors’ and your competitors’ products, in the eyes of your users, so as to determine blue oceans (Kim, Reference Kim2005; Kim and Mauborgne, Reference Kim and Mauborgne2005), that is new product positions that respond to needs for which there are no solutions but which are large enough to try to meet them, or that outperform competing products on a small number of targeted properties considered important or differentiating by categories of users. But marketing and user-centred design departments do not share a simple tool for analyzing the positioning of products or services in the same category in order to understand the reasons why some products or services are better suited than others to meeting the expectations of user segments, an “adequacy” that we refer to in the rest of this article as “effectiveness” in delivering the expected service. Once again, the reason is that there is no simple, shared model for expressing how the existing products to be compared contribute to satisfying an activity in different usage contexts. As a result, marketing briefs never properly explain to designers the contexts in which users are dissatisfied, and designers have no precise, well-founded indications of how to innovate in a way that would be truly competitive.
The simplest and most widely used method in design and industry for comparing several solutions and selecting the best one is the Pugh matrix (Fernandes et al., Reference Fernandes, Rosati, Neto, Goto, Maciel and Mologni2008). A Pugh matrix is based on a reference solution against which the other solutions are compared qualitatively by order-of-magnitude estimates according to a series of comparison criteria. However, the qualification and quantification of the criteria are not based on considerations of the effectiveness of the service provided for categories of user in different contexts of use, but on an overly global assessment, as we shall see. This does not make the Pugh matrix a very suitable tool for targeting the improvements that need to be made as part of a usage-focused (re-)design approach.
The example of the PC purchase could also make us think about using user review analysis techniques such as sentiment analysis or more advanced language processing techniques. The authors have already experimented on the customer sentiment appraisal from user-generated product reviews through natural language processing techniques (Raghupathi et al., Reference Raghupathi, Yannou, Farel and Poirson2015), the detection of appropriate words related to functions, technical solutions, affordances, polarities, feelings, emotions (Hou et al., Reference Hou, Yannou, Leroy and Poirson2019a), possibly the evolution of their occurrences over time (Hou et al., Reference Hou, Yannou, Leroy and Poirson2019b). But note that:
-
- No robust method exists (Hou et al., Reference Hou, Yannou, Leroy and Poirson2019a) for compiling user reviews into the analysis of appropriateness of a product solution or user satisfaction in relation to the usage situations they face. So even if we had sufficient user review data (which is ultimately rare), we would only have a rough idea of what the various solutions on the market cover in terms of usage support for particular users.
-
- Moreover, in this article, we are not in a BtoC situation with an abundance of available customer reviews. On the contrary, in the core of the article, we will be adopting an industrial example in a BtoB situation.
This is why we need a product comparison and selection method based on an ontology based on the building blocks of a user’s activity. This ontology is provided by the radical innovation design (RID) methodology (Yannou and Cluzel, Reference Yannou and Cluzel2024).
The aim of this article is to propose a practical method for comparing the main commercial solutions corresponding to a targeted activity, to highlight their specific strengths and weaknesses and get a comprehensive picture of which existing solution partially or totally dominates others for a given category of users, in terms of service effectiveness under various usage situations. Section 2 is a literature analysis. After recalling some foundational principles of the RID methodology, Section 3 presents original theoretical elements such as the parameterization of an activity, the building of the “cognitive model” of an activity, and the eight effectiveness indicators of the RID comparator. In Section 4, the RID comparator is applied to a real industrial case to compare existing solutions for cleaning solar panels and result in an innovation brief for the company. A final discussion and conclusion section concludes the paper.
2. Literature background
Knowing how to compare products or services – we can also talk about value propositions – is at the heart of innovation strategies because this comparison must show both the attractions of these propositions for current or future customers or users and the difficulties and benefits of implementing them for the company.
It is well established that any innovative company must know its competitors and new players in the market in order to be the most reactive and continue proposing the most relevant innovations to their customers (Porter and Millar, Reference Porter and Millar1985). The strategic canvas of Blue Ocean Strategy (BOS; Kim, Reference Kim2005; Kim and Mauborgne, Reference Kim and Mauborgne2005) prompts for the comparison of existing products under competitive criteria. This comparison is useful for imagining a Blue Ocean offer outperforming all existing products on at least one criterion while being more discrete or nonexistent on other criteria. This strategic canvas allows us to imagine an original area of innovation that does not compete with existing market solutions on all comparison criteria.
Verganti (Reference Verganti2009) says that this framing of a Blue Ocean should be accompanied by the “push of new meanings” in the way one uses or accesses the product. Along with Norman (Norman and Verganti, Reference Norman and Verganti2014; Baha et al., Reference Baha, Ghei and Kranzbuhler2021), Verganti calls design practice “design-driven innovation” (DDI), in opposition to technology push innovation (TPI) and the incremental design associated with human-centered design (HCD) practices popularized by design thinking (Brown, Reference Brown2008). Verganti considers that DDI and TPI are generally radical innovations, as they comply with the three criteria of novelty, uniqueness, and market adoption. A study by Booz & Company (Jaruzelski et al., Reference Jaruzelski, Loehr and Holman2012, Reference Jaruzelski, Staack and Goehle2014) considers these three globally similar innovation strategies but reframed as “need seeker” (NSI in place of DDI), “technology driver” (TDI in place of TPI), and “market reader” (MRI in place of HCD) depending on whether the focus is on the customer, the technology, or the market. With a need seeker innovation, new products and services are based on superior end-user understanding, and this study proved that companies that adopt it consistently outperform others financially. In this paper, we focus on DDI or NSI innovation, which corresponds to a radical innovation from the viewpoint of users. Little or nothing is said in the literature about how to detect these areas of innovation that can “push new meanings” to users (Verganti, Reference Verganti2009; Norman and Verganti, Reference Norman and Verganti2014) by durably changing the user experience. Baha et al. (Reference Baha, Ghei and Kranzbuhler2021) suggest that it is appropriate to use the tools of HCD to query a variety of users and identify these innovation areas by collecting recurrent pains and expectations as the starting point for a DDI process.
As already mentioned, however, these approaches currently suffer from a lack of reference framework for comparison. What do we need to compare: the product features or the service performance they can deliver in specific usage situations? As already said, current designers work with a mixture of comparison criteria that are divorced from the actual measurement of service performance and effectiveness in the targeted usage situations. The reason is that they do not analyze the users’ pains and expectations in the frame of a logical representation of usage situations. In addition, once comparison criteria are identified, there is no clear measurement scale defined to quantify the comparison. To address this gap, we adopt the RID methodology (Yannou, Reference Yannou2015; Yannou et al., Reference Yannou, Cluzel and Farel2016), for which an open-access e-book has been published (Yannou and Cluzel, Reference Yannou and Cluzel2024). RID shares the conviction of Christensen (Christensen and Raynor, Reference Christensen and Raynor2003; Christensen, Reference Christensen2011) that the big secret to innovation success is to allow customers to improve their job performance (the concept of “jobs to be done”), regardless of their job type (professional/personal, physical/intellectual, objective/subjective). RID has generalized this notion of jobs into the concept of activity, which is widely employed by psychologists and ergonomists. RID is based on a clear reference framework and a solid systemic approach, where the focus is on improving an activity system (Engeström et al., Reference Engeström, Miettinen and Punamäki-Gitai1999). This is why the existing activity of interest and its outcomes are meticulously observed using a HCD approach to detect under-explored innovation areas and set innovation specifications for the design of the future activity while pushing new meanings. Activity system theory (Engeström et al., Reference Engeström, Miettinen and Punamäki-Gitai1999) explains that “mediating artifacts” allow some activity subjects to obtain outcome performances through a series of tasks. In RID, the innovative design of a Product-Service-Organization (PSO) system is always transposed as a transformation of a user activity system that improves the activity’s outcome performances and sometimes disrupts the user experience (Figure 1). A modeling language is provided to break down an activity into archetypal usage situation classes, assign present and potential activity users into archetypal persona classes, and assign pains and expectations into generalized problem classes and existing (market) solution classes. In addition, qualitative measurement scales allow to quantify specifications and comparisons under relevant comparison criteria. More than a regular HCD, DDI, or NSI approach, RID claims to be a Usage-Driven Innovation (UDI) approach, which is a new model proposed by Yannou et al. (Reference Yannou, Cluzel and Lamé2018). RID is, to our knowledge, the first computerized methodology to implement usage-driven innovation processes. The aim of this article is to present for the first time algorithms dedicated to product comparisons, based on the RID activity ontology, and to illustrate a nontrivial industrial example.
Reference framework for product design and comparison with RID.

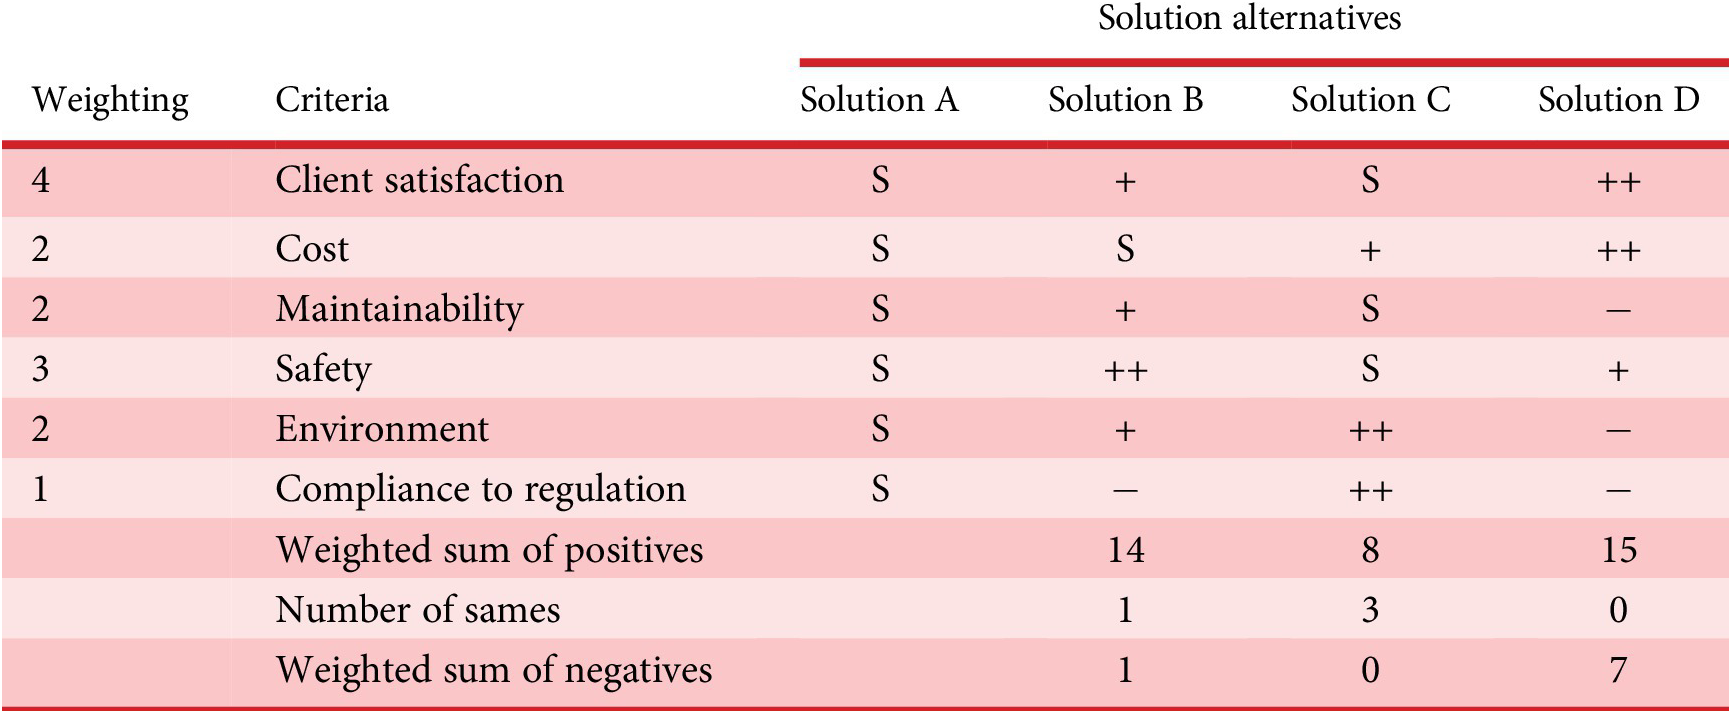
Several other methods dealing with product comparison are worth mentioning. The simplest and most widely used method in design and industry for comparing several solution alternatives and selecting the best one is the Pugh matrix (Fernandes et al., Reference Fernandes, Rosati, Neto, Goto, Maciel and Mologni2008), also called Decision Matrix or Selection Matrix. It amounts to a weighted average against a set of criteria related to user expectations as well as other properties regarding company (scalability, complexity, risks). In order to facilitate the scoring of alternatives, it is proposed to choose a “reference” or “standard” solution against which other solutions are qualitatively scored, ranging from – (appears much worse), − (appears worse), S (for Same), + (appears superior), or ++ (appears much superior), relatively to the standard solution. In Table 2, Solution A has been chosen to be the standard solution. Solution B appears to be the wiser choice, despite Solution D collects the higher sum of positives. When using this method, it is advisable not to attach too much importance to the total values of the scores, but rather to consider the final order of the solutions. We can see here that (a) there is no rule for drawing up the list of comparison criteria and that, in any case, this comparison is not, by default, drawn up for the sole benefit of users, and (b) that user categories on the one hand, and usage situations on the other, are not considered to be important variables for comparing the dominance of existing solutions. In addition, the authors observe that there is no study to verify that the Pugh matrix is a good method for choosing the right solution. There is no explicit validation of it. Everyone seems to accept the fact that a weighted average is a universally recognized method for yielding good results. However, this is not the case. As early as 1946, Stevens (Reference Stevens1946, Reference Stevens and Stevens1951) proposed definitions on measurement scales and rules on the possibility of arithmetic operations on variables defined on these scales. He was one of the pioneers of these researchers in multicriteria decision aid. Subsequently, Belton and Gear (Reference Belton and Gear1983) highlighted the problems of rank reversal that were led by widely used approaches like Analytic Hierarchy Process – AHP – (Saaty, Reference Saaty1980, Reference Saaty2002), which is basically a procedure for making decisions with the principle of weighted average. Belton gain (Reference Belton1986) compared the ability of AHP and a simple multiattribute value function to choose a best solution. The lack of validation of the Pugh Matrix method and the known limitations of the AHP method have not prevented researchers, particularly in design, from continuing to publish their results using these methods. These ranking methods are in fact open loop. They are essentially based on the fact that the principles establishing their ranking are good and shared and understood by everyone, but in reality, the ranking results are “open loop” because it is very difficult, if not impossible, to prove that the prescribed ranking result is the best in relation to a decision-making context. In most cases, the aim is not to build a model for aggregating user preferences in a situation where users are choosing between several competing offers. In this case, methods based on multiattribute utility theory would be better suited to verifying that the utility model does indeed predict the choice made by consumers in a purchasing situation, or by users in a situation where they are giving a global preference opinion. In this article, our aim is to make a detailed comparison of existing value propositions for different user categories and in different usage situations, without immediately arriving at a single aggregation of preferences, but allowing these comparisons to be explored according to the dimensions that could condition a good performance of the service provided by the solution. This is why, like the Pugh Matrix and AHP methods, we will clearly set out the structuring principles that lead us to the formulas for the effectiveness indicators, but we will not be able to fully validate through ad hoc experimentation that our indicators provide the “best” advice for decision-making. Nevertheless, we will report as faithfully as possible on all the stages involved in establishing the model with the industrial company in the reported use case, and above all, on all the stages that enabled this company to make its innovation brief decision on the basis of the RID comparator.
Example of a Pugh matrix
QFD, or quality function deployment, is a more sophisticated method that is used to focus on propagating the voice of the customer to the elementary choices of components and manufacturing processes. It is implemented by creating a series of matrices to relate what the customer wants in terms of product and process features, and these matrices serve to prioritize development efforts (Dikmen et al., Reference Dikmen, Talat Birgonul and Kiziltas2005; Hoyle and Chen, Reference Hoyle and Chen2007; Hauser et al., Reference Hauser, Griffin, Klein, Katz, Gaskin, Sheth and Malhotra2010). QFD is a valuable method, but (a) it is based on functional decomposition rather than on an activity or usage-based breakdown, and (b) it tends to choose the product and process architecture that makes a tradeoff between what is useful for users and what is apparently feasible with known solutions, which makes it unlikely to prompt radical innovations.
Using matrices in design to represent, understand, and make decisions has been popularized by approaches known as DSM, or dependency structure modeling (also referred to as design structure matrix – Steward, Reference Steward1981; Eppinger and Browning, Reference Eppinger and Browning2012; Yassine and Braha, Reference Yassine and Braha2003). DSMs are matrices used to describe information and products, processes, industrial projects, and their interactions based on their ability to represent large quantities of data and complex systems in an easy, understandable, and schematic way (Lindemann et al., Reference Lindemann, Maurer and Braun2009). There have been several attempts to use them for solution or supplier selection tasks (Ye et al., Reference Ye, Jankovic, Kremer, Yannou, Leroy and Bocquet2016), but no general framework has emerged like the usage-based reference framework proposed in this article embedded within the RID framework.
Several categories of models have been developed for comparing products based on their ability to comply with (i) perceptions and emotions, (ii) completing a task, and (iii) inclusivity for all people, regardless of their capabilities and disabilities.
For the first category, Petiot and Yannou (Reference Petiot and Yannou2004) proposed a qualitative pairwise method for comparing products, such as wine glasses, based on user perceptions and emotions. Yannou and Coatanéa (Reference Yannou and Coatanéa2009) used the same method with car dashboards, but this method does not consider a segmentation of usage contexts.
A second category of models based on a segmentation of usage contexts has been proposed (He et al., Reference He, Chen, Hoyle and Yannou2012; Yannou et al., Reference Yannou, Yvars, Hoyle and Chen2013; Wang et al., Reference Wang, Yannou, Alizon and Yvars2013), but these models require simulating the behavior of the products or at least their effects on the tasks studied. The integration of physics-based and statistics-based models linking design features with product performances is considered to optimize a parameterized product solution on a consumer and usage basis and maximize the market demand. However, the incorporation of physics- and statistics-based models remains a significant bottleneck.
The third category of models concerns the methods developed to support inclusive (Clarkson et al., Reference Clarkson, Coleman, Keates and Lebbon2013) or universal design (Preiser and Smith, Reference Preiser and Smith2010). The British Standards Institute (2005) defines inclusive design as the “design of products and environments to be usable by all people, to the greatest extent possible, without the need for adaptation or specialized design.” Every design decision has the potential to include or exclude customers with different sensory, motor, and cognitive capabilities, as well as different needs and aspirations when acting in different activity contexts. UK researchers, as seen in the Inclusive Design Toolkit (2022), have considerably developed an integrated inclusive design process, models, and tools. In the design process, the focus is put on user interactions with a product or service. Such interactions typically require cycles where the user (i) perceives, (ii) thinks, and (iii) acts thanks to five categories of user capabilities/disabilities, namely: vision, hearing, thinking, reach and dexterity, and mobility. A given product or service places demands on users’ capabilities. The level of demand that a product places on the five capabilities can be assessed and compared to the ability of the users in the target population. Data on how many people have different levels of capability can be used to calculate how many people would be excluded by a product with a particular set of demands (Keates and Clarkson, Reference Keates and Clarkson2003; Johnson et al., Reference Johnson, Clarkson and Huppert2010). The whole inclusive design process also uses observation techniques, segmentations on personas (Adlin and Pruitt, Reference Adlin and Pruitt2010), and generation of corresponding customer journeys for capturing the interaction needs. The practice of inclusive design is beneficial when a product or service’s successful use depends on the user’s abilities. However, in some cases, a product’s effectiveness may not depend entirely on the user. For example, fall detection solutions for the elderly may require user input, such as pressing a button in case of a fall. However, a reliable solution must be autonomous and work without user input. Nonetheless, the effectiveness of such a solution in all circumstances is not guaranteed. The RID comparator aims to identify these ineffective service areas.
3. Theoretical elements
3.1. Some foundational principles of RID
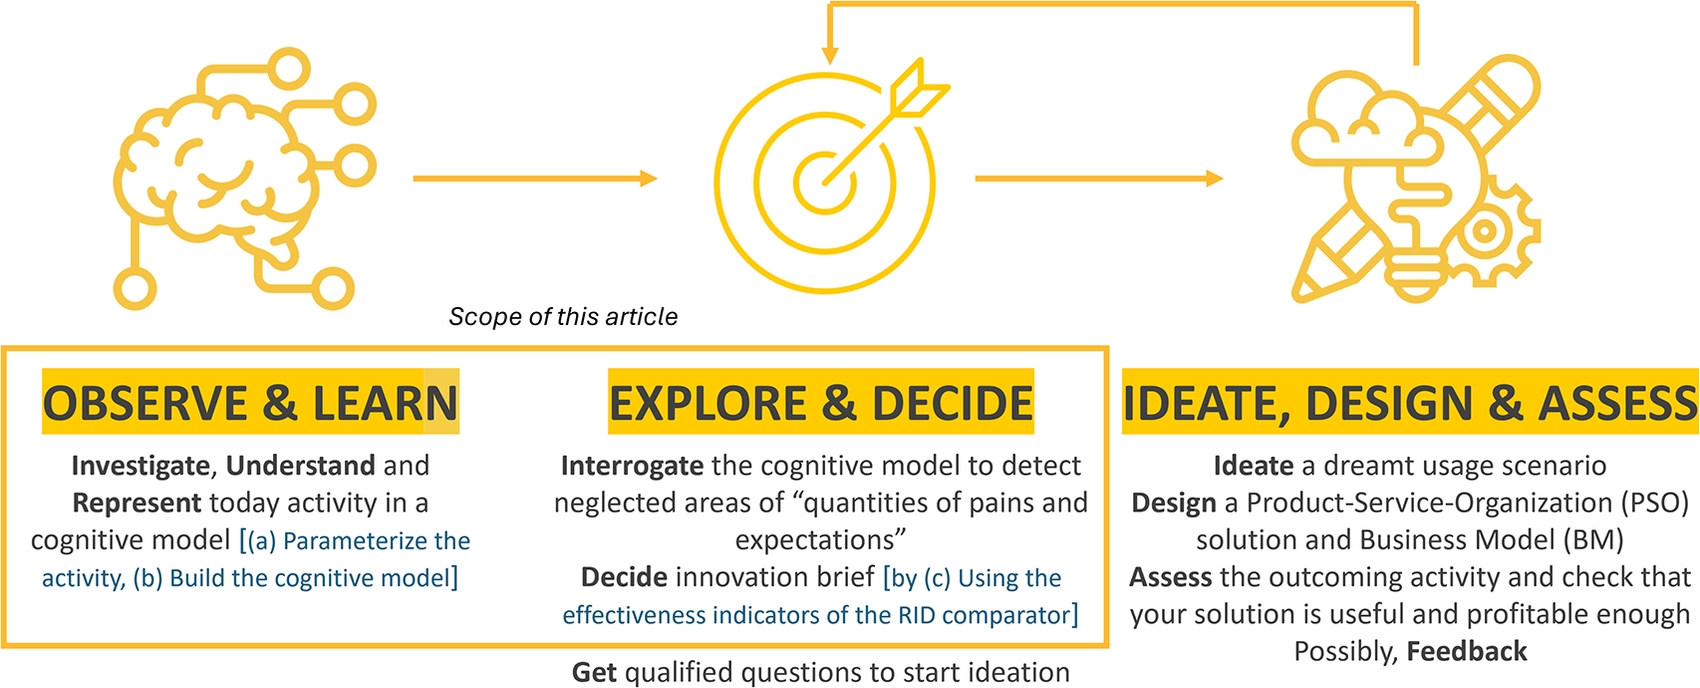
The RID process works in three stages (Figure 2): (1) Observing today’s activity and learning about it by building a cognitive model, (2) Exploring this cognitive model and deciding on the innovation targets, and (3) Ideating, designing, and checking that your innovative solution(s) effectively augment the user’s activity. The process of improving an activity through the RID design process has already been illustrated in four papers. In Bekhradi et al. (Reference Bekhradi, Yannou, Cluzel and Vallette2017), do-it-yourself activities are investigated to innovate on an innovative universal accent light solution. With the aim of analyzing the often low environmental performances of a building, Lamé et al. (Reference Lamé, Leroy and Yannou2017) used RID methodology to analyze the contribution of existing design and organizational solutions and the imperfections of the design activity for a building, such as fragmentation of the participation of the actors in the construction, failure to implement LCA, eco-design approaches and environmental standards, and/or the lack of consultation among the actors in the value chain. In Lamé et al. (Reference Lamé, Yannou and Cluzel2018), the authors analyzed the activity system of a dental radiologist to derive neglected areas based on “quantities of pains and expectations” from which they ideate to further define innovative socio-technical layout solutions. Salehy et al. (Reference Salehy, Yannou, Leroy, Cluzel, Fournaison, Hoang, Lecomte and Delahaye2021) used RID to model the design and maintenance activity of a supermarket refrigeration system to highlight the lack of early coordination of actors and a shared integrated digital mockup. In all four case studies, RID permitted a systematic production process of innovation leads supported by a digital platform. The present paper covers almost the entire two first stages. That is the first time that the authors have presented in such detail the parameterization of an activity, the meticulous construction of the cognitive model, and the way in which this cognitive model is interrogated through the eight effectiveness indicators of the RID comparator, leading to a solid and informed innovation brief.
The RID process of usage-driven innovation.
3.2. Parameterization of an activity
A RID process starts from the definition of the scope of an activity. This scope of activity legitimates the system boundary in which one seeks to innovate for the usefulness benefit of users and the profitability benefit of a designing company. This scope is defined by naming the activity and defining an ideal goal. This naming must not be influenced by the present namings of particular product-service solutions. The ideal goal corresponds to when the activity outcome performance is set at 100%. Before parameterizing an activity, it is of course necessary to organize the activity observation and documentation in order to guarantee its reliability and traceability. This is done by a RID Knowledge Design process (not detailed here but see for instance Salehy et al., Reference Salehy, Yannou, Leroy, Cluzel, Fournaison, Hoang, Lecomte and Delahaye2021) and also thanks to conventional tools of design ethnographic approaches like persona method and user journey map.
Activity parameterization and the construction of a cognitive model serve to model, without oversimplification, the way in which people experience the activity in progress (or the way in which a component interacts in a system) in all its diversity. The compromise between representing the diversity of situations and the necessary simplification is achieved by segmenting – or categorizing – the four blocks of activity modeling, that is the user profiles who experience different usage situations to carry out the activity, while encountering certain problems depending on the (existing) solutions used (see Figure 3). Here are the definitions of these four building blocks:
-
• User Profiles (Up) - The stakeholders concerned by the activity are investigated in the knowledge design stage and segmented in user profiles. Different user profiles can be taken into account depending on whether they practice different subactivities or whether their contribution to the activity is different. A user profile is a category clearly qualified by common habits and similar forms of activity: sharing the same sets of usage situations, similarly perceiving satisfactions and problems, and using similar preferred existing solutions. Statistical data should be collected to quantify their number and their habits on activities, especially their adherence to usage situations, problems, and existing solutions.
-
• Usage Situations (Us) - A usage situation is linked to an episode, a particular scene, a series of actions, one of the processes or a task, that is a portion of the activity. An activity can be decomposed into a series of usage situations.
-
• Problems (P) - A problem is not only an issue, a concern, an irritant, a dissatisfaction, a lack, a trouble, a dysfunction, it is also an insufficient amount of an expected performance. A problem encompasses at the same time pains and gains (see Osterwalder et al., Reference Osterwalder, Pigneur, Bernarda, Smith and Papadakos2014). Problems are differently experienced by users during specific usage situation. They can be consciously expressed, but they can also be internalized as “the way things work” and have to be uncovered by designers during Knowledge Design investigations.
-
• Existing Solutions (Es) - During knowledge design, existing product-service-organization solutions, which may be linked to a given activity, are inventoried and documented. Then, they are classified into a small number of categories (typically 3 to 12), which are captioned and illustrated. Existing solutions range in their effectiveness in alleviating identified problems, and therefore in their relevance and effectiveness during usage situations.
The 4 building blocks of an activity in RID.

There are some modeling rules to respect in order to get four satisfactory sets of categories:
-
• A good category must be defined by a set of properties and its definition must be carefully defined and written.
-
• It is recommended that the set of categories of one activity block forms a mathematical partition, that is all categories be mutually exclusive, and their union totally covers the activity block.
-
• It is recommended that the categories be classified in a hierarchy of macro-categories (for zoom-in and zoom-out facilities of the RID comparator that will not be exemplified in this article).
3.3. The “cognitive model” of an activity
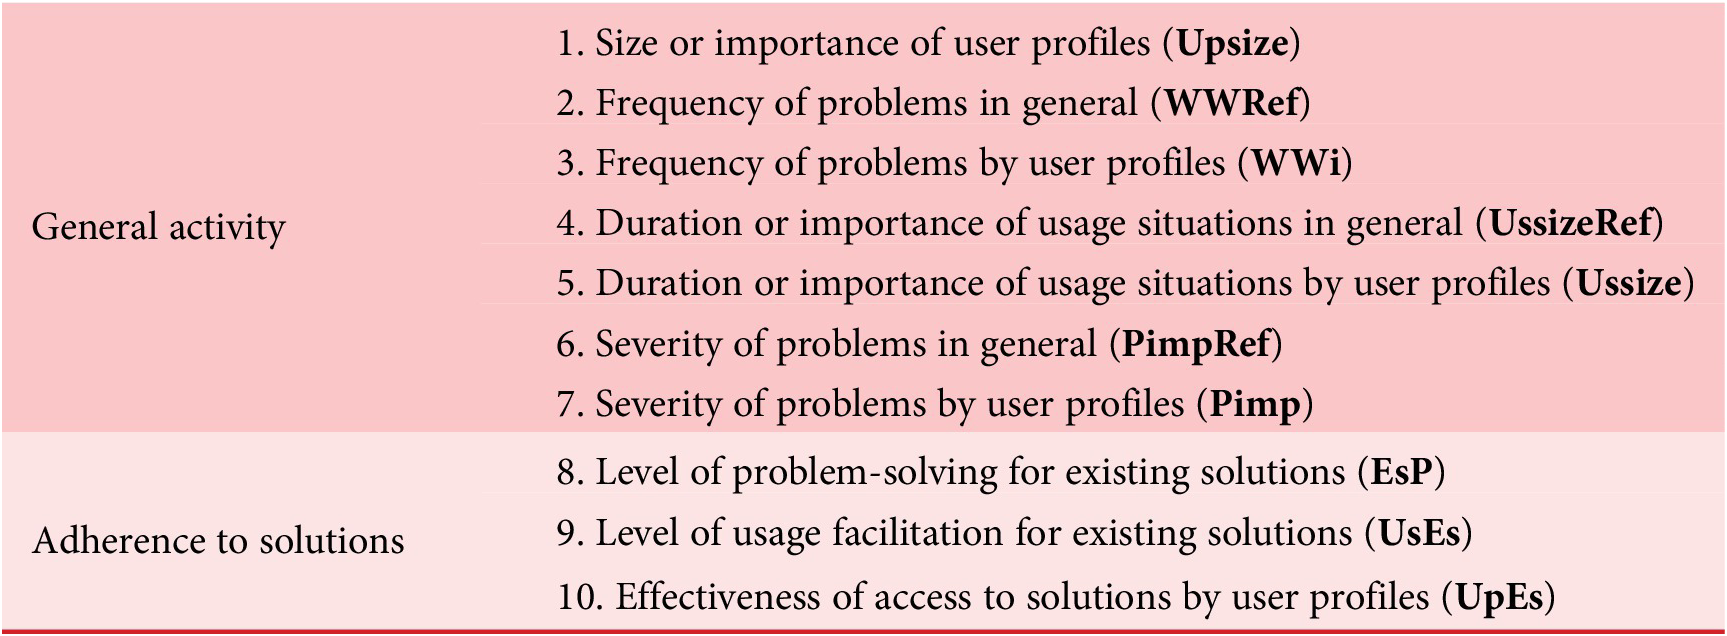
Once the parameterization of the activity done, the cognitive model is built using seven questions (see Figure 4) on one, two, or three activity dimensions at a time (among user profiles, usage situations, problems, existing solutions). These questions are very simple, and experts and users are appropriately queried on specific questions to contribute to a systemic representation of the activity practice.
The 7 questions to answer to complete the cognitive model of activity in RID.

We use seven semiquantitative measurement scales to intuitively answer these questions. For instance, we often use scales from 0 for “never” or “no importance” to 5 for “frequently” or “very important”, or we can decide to use a percentage between 0 and 100% if more natural (Stevens Reference Stevens1946, 1953). In practice, ten matrices – of 1, 2, or 3 dimensions – are filled (see Table 3). They all have a specific designation. Three matrices denoted with Ref extension (WWref, UssizeRef, PimpRef) permit to consider that all user profiles are behaving and perceiving the same manner, which allows to get more immediate results. Conversely, one can refine user discrepancies as finely as necessary with the three no-Ref corresponding matrices: WW, Ussize, Pimp. A group is set up to provide the various ratings. We recommend that this group be carefully constituted to cover all categories of users. It is often necessary to add specialists in the problems encountered (often researchers, doctors, or psychologists), experts in the activity for given usage situations, or experts in existing solutions such as marketers or people in charge of competitive intelligence. We also recommend using simple scales like the one between 0 and 5 as it is simple to propose customized definitions for the 6 ordinal levels. For instance, for evaluating the frequency of problems in general, the question asked is “How often can this problem occur during this usage, regardless of the user?” and we provide the following definitions: 0: Not frequent/1: Very infrequent/2: Infrequent/3: Moderately frequent/4: Very frequent/5: Extremely frequent. In addition, the choice between ordinal levels and the definitions of ordinal levels are discussed again during the data feeding between participants to ensure a similar representation of figures.
The nature of the variables involved in the cognitive model of activity
The questions asked generally lead to precise answers that are not open to misinterpretation or subjectivity in the way that questions about preferences might be: “What is the proportion…?”, “How often…?”, “How long or how important…?”, “How severe…?”, “To what extent…?”. That’s why disagreements about evaluation most often reveal that a participant has misunderstood the question or is ill-informed to answer it (lack of information or knowledge). The problem is then either resolved immediately or requires further investigation to bring both participants into agreement. We encountered 95% of these situations. If, however, we were to take these divergences into account, we would distinguish 3 cases:
-
a. There are minor differences: one participant wants 2, the other 3; we agree on averages of 2.5.
-
b. There is a big discrepancy, and we do not have time to investigate. We run two simulations and see if there are any rank inversions in subsequent calculations (of efficiency, for example). If there are only slight variations, we conclude that this input has had little effect.
-
c. There are several large variations, and we do not have time to investigate. We run a Monte Carlo simulation, drawing equiprobable values between the extremes and reconstructing the probability density functions for subsequent calculations (efficiency indicators).
The following notations are adopted: $ Up, Us,P, Es $
: vectors of (respectively) user profiles, usage situations, problems, and existing solutions. The indices are as follows:
$ Up, Us,P, Es $
: vectors of (respectively) user profiles, usage situations, problems, and existing solutions. The indices are as follows: $ \forall i,j,k,l\in \left[ Up, Us,P, Es\right] $
. Matrices
$ \forall i,j,k,l\in \left[ Up, Us,P, Es\right] $
. Matrices $ WW, UpEs, UsEs, EsP $
are adimensioned with their proper scale (Eq. 1), while matrices
$ WW, UpEs, UsEs, EsP $
are adimensioned with their proper scale (Eq. 1), while matrices $ {Us}_{size},{P}_{imp},{Up}_{size} $
are normalized (Eq. 2).
$ {Us}_{size},{P}_{imp},{Up}_{size} $
are normalized (Eq. 2).
 $$ \forall i,j,k,l,{WW}_{ijk}\leftarrow \frac{WW_{ijk}}{Scale_{WW}} $$
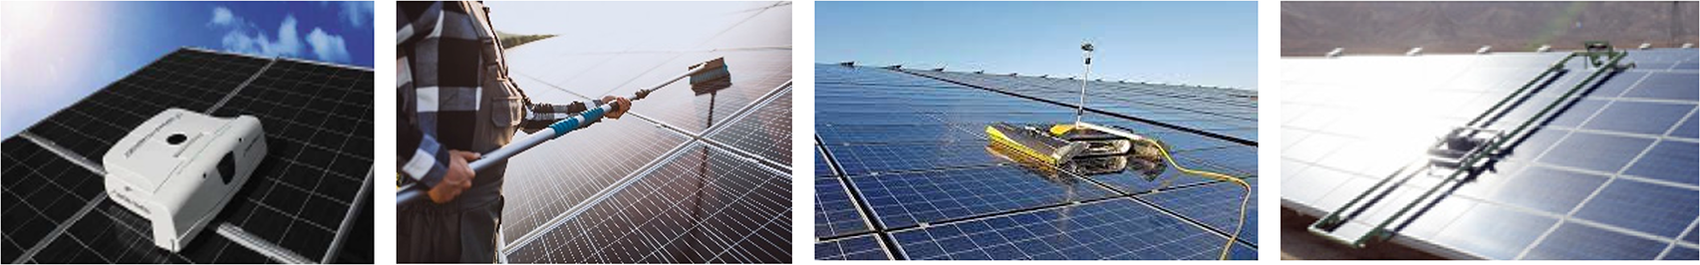
 $$ \forall i,j\hskip1.08em U{s}_{siz{e}_{ij}}\leftarrow U{s}_{siz{e}_{ij}}/{\sum}_{z=1}^JU{s}_{siz{e}_{iz}} $$
3.4. The new metrics of quantities of pain
In RID, a new unified metrics to assess the quantities of pain and expectations within the scope of an activity is proposed. An elementary quantity of pain is defined as a portion of problems experienced by a given user in a given usage situation, and which can be partially or totally lessened by a given existing solution. Two matrices are homogeneous with the “quantities of pain” measurement scale:
-
1. The 3D matrix $ WW $
(see Figure 4) expresses the “initial quantities of pain
$ W{W}_{ijk} $
to be removed for considering an ideal activity”,
$ WW $
(see Figure 4) expresses the “initial quantities of pain
$ W{W}_{ijk} $
to be removed for considering an ideal activity”, -
2. The 4D matrix ES is computed by multiplication of the three matrices UsEs, EsP, and UpEs for expressing the “ability of a solution to lessen quantities of pain”, that is the problems in a given situation for a given user, after formula (3).


 $$ {ES}_{ijkl}={UsEs}_{lj}.{EsP}_{lk}.{UpEs}_{il} $$
In consequence, the 4D $ {E}_{UpUsPEs}\hskip0.24em $
matrix expresses the elementary effectiveness of solution l, that is the percentage of pain removal offered by solution l, after formula (4).
$ {E}_{UpUsPEs}\hskip0.24em $
matrix expresses the elementary effectiveness of solution l, that is the percentage of pain removal offered by solution l, after formula (4).
 $$ {E_{UpUsPEs}}_{ijk l}=\left\{\begin{array}{cc}\frac{E{S}_{ijk l}}{W{W}_{ijk}}& \mathsf{if}\hskip0.24em W{W}_{ijk}>E{S}_{ijk l}\\ {}1& \mathrm{otherwise}\end{array}\right. $$
3.5. The seven aggregated effectiveness indicators of the RID comparator
From the $ {E}_{UpUsP} $
matrix corresponding to a given existing solution l, seven aggregated indicators are calculated. Rather than averaging for each dimension, we weight the indicators according to
$ {E}_{UpUsP} $
matrix corresponding to a given existing solution l, seven aggregated indicators are calculated. Rather than averaging for each dimension, we weight the indicators according to $ {Up}_{size} $
vector (“What is the proportion of each user profile or the importance given to them in the activity?”),
$ {Up}_{size} $
vector (“What is the proportion of each user profile or the importance given to them in the activity?”), $ {Us}_{size} $
matrix (“How long or how important are the current or desired usage situations for each user specifically?”), or
$ {Us}_{size} $
matrix (“How long or how important are the current or desired usage situations for each user specifically?”), or $ {P}_{imp} $
matrix (“How severe is this problem in terms of dramatic consequences for each user specifically?”), all of which being normalized. The calculation of these seven indicators is given through formulas (5) to (11).
$ {P}_{imp} $
matrix (“How severe is this problem in terms of dramatic consequences for each user specifically?”), all of which being normalized. The calculation of these seven indicators is given through formulas (5) to (11).
-
• Effectiveness of solutions for pairs: usage situations and problems
 $$ \forall j,k\in \left[ Us,P\right]\hskip0.48em {E}_{U{sP}_{jk}}=\sum \limits_{i\in Up}{E_{UpUsP}}_{ijk}.U{p}_{siz{e}_i} $$
-
• Effectiveness of solutions for couples: user profiles and problems
 $$ \forall i,k\in \left[ Up,P\right]\hskip0.48em {E}_{Up{P}_{ik}}=\sum \limits_{j\in Us}{E_{Up UsP}}_{ij k}.U{s}_{siz{e}_{ij}} $$
-
• Effectiveness of solutions for couples: user profiles and usage situations
 $$ \forall i,j\in \left[ Up, Us\right]\hskip0.48em {E}_{UpU{s}_{\mathrm{ij}}}=\sum \limits_{k\in P}{E_{UpU sP}}_{ijk}.{P}_{im{p}_{ik}} $$
-
• Effectiveness of solutions for problems
 $$ \forall k\in P\hskip0.48em {E}_{P_k}=\sum \limits_{\begin{array}{c}i\in Up\\ {}j\in Us\end{array}}{E_{UpUsP}}_{ij k}.U{s_{size}}_{ij}.U{p_{size}}_i $$
-
• Effectiveness of solutions for usage situations
 $$ \forall j\in Us\hskip0.48em {E}_{Us_{\mathrm{j}}}=\sum \limits_{\begin{array}{c}i\in Up\\ {}\mathrm{k}\in P\end{array}}{E_{UpUsP}}_{ijk}.{P_{imp}}_{ik}.U{p_{size}}_i $$
-
• Effectiveness of solutions for user profiles
 $$ \forall i\in Up\hskip0.48em {E}_{Up_i}=\sum \limits_{\begin{array}{c}j\in Us\\ {}k\in P\end{array}}{E_{Up UsP}}_{ij k}.{P_{imp}}_{ik}.U{s_{size}}_{ij} $$
-
• Global effectiveness of solutions
 $$ E=\sum \limits_{\begin{array}{c}i\in Up\\ {}j\in Us\\ {}k\in P\end{array}}{E_{UpUsP}}_{ij k}.{P_{imp}}_{ik}.U{s_{size}}_{ij}.U{p_{size}}_i $$
The multiplicity of these indicators will make it possible to explore where existing solutions are not very effective, and where it would therefore be a good idea to provide users with innovative solutions. The logic of the last formula (11) is that the global effectiveness of a solution is a weighted average of the elementary effectiveness of its contributing parts – for each triplet (user $ i $
, situation
$ i $
, situation $ j $
, problem
$ j $
, problem $ k $
). The weights in formula (11)
$ k $
). The weights in formula (11) $ {P_{imp}}_{ik}.U{s_{size}}_{ij}.U{p_{size}}_i $
guarantee that
$ {P_{imp}}_{ik}.U{s_{size}}_{ij}.U{p_{size}}_i $
guarantee that
-
• the larger the user segment, the larger the quantity of pain
-
• the more frequent the usage situation, the larger the quantity of pain
-
• the more severe the problem, the larger the quantity of pain.
These weighting factors are much similar to the ones used in Pugh matrix and AHP methods where criteria scores are weighted with importance factors. In RID, the scores are calculated after formula (4) for each elementary quantity of pain $ {E_{UpUsPEs}}_{ijk} $
for an existing solution l. The quantities of pain metrics with these importance factors have been designed to be an extensive metrics; summations and comparisons can be done (Stevens, Reference Stevens1946, 1953) as it is done with weighted averages for the Pugh Matrix and AHP methods.
$ {E_{UpUsPEs}}_{ijk} $
for an existing solution l. The quantities of pain metrics with these importance factors have been designed to be an extensive metrics; summations and comparisons can be done (Stevens, Reference Stevens1946, 1953) as it is done with weighted averages for the Pugh Matrix and AHP methods.
4. Case study on solar panel cleaning solutions
4.1. Parameterization of the activity
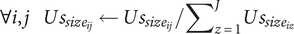
Our case study is a study carried out on behalf of a company that manages solar farms. This company has solar farms all over the world, of all sizes, generations, and technologies (Figure 5). One problem that plagues operators is the fouling of solar panels. You can tolerate up to 30% less irradiation before you must clean them. This cleaning is expensive, immobilizes the installations for the duration of the operation, and contributes to wear and tear on the panel coating; hence, the need to find a clever compromise when it comes to knowing when to intervene for cleaning. The qualities of the overall product–service–organization solution have a major influence on this compromise, which represents a major challenge in terms of electricity production gains. This company has been trying to find suitable industrial solutions for years. The problem is that there are many techniques available, and they are all adapted to economic, climatic, and local labor situations. The company called on us to (a) pose the problem of matching supply (existing solutions on the market) and demand (their needs in terms of pain to be reduced and gains to be made) and (b) determine one or more priorities for where to innovate, and therefore determine a motivated innovation brief.
A diversity of usage contexts for exploiting solar farms.
The first step was to set up a group of experts representative of the knowledge to be addressed. They included production managers from solar farms on several continents, researchers from the company’s R&D department who had worked on the various physico-chemical phenomena linked to the nature of soiling in different parts of the world, as well as marketers and designers.
The first task of the group was to determine the scope of the activity to innovate on. The group proposed to name the activity: “Cleaning solar panels of solar farms” and to set the ideal goal to:” A cleaning activity that ensures the restoration of maximum panel performance in all local conditions, regardless of the type of soiling and for all types of installations. The planned procedure is self-contained, easy to implement, inexpensive, fast and takes into account environmental impacts”.
The difficulty the project group had to overcome in this study was to accept that the users benefiting from the “solar panel cleaning” activity were not humans but archetypes of solar farms (user profiles), and that the usage situations were the typical conditions in which they evolved, that is their location characterizing the climatic conditions, the type of soiling (and the related physico-chemical phenomena), and the local workforce.
For determining the main categories of solar farms that might behave differently during a cleaning activity, the project group investigated on the most differentiating factors of solar farms that influence the performances of this cleaning activity? Two main factors were identified: the size of solar farms and the glass quality. In terms of size, we define a big power plant a solar power plant that produces at 10 MWp. Considering that on average a solar power panel produces 265 Watts, a 10 MWp plant has around 38 k solar panels installed, and it occupies around 60 acres of land. Smaller power plants are those that produce 500 kW at peak and occupy less area. Panels that are installed on rooftops enter this category. This classification of the solar plants (following the peak power production) is based on the current PV panels’ distribution. In terms of glass quality, tempered glass is about four times stronger than annealed glass. In addition, tempered glass breaks into small fragments, reducing the probability of serious injury. Tempered glasses are also less sensitive to wear and tear due to intensive or aggressive cleaning. Most (but not all) of solar panels on the market use it despite its greater weight and higher cost. Hence, a judicious combination of user characteristics yields four categories of user profiles (Figure 6).
The four user profiles.

The decomposition of the “solar panel cleaning” usage situations can be interpreted in two different ways: (1) by globally considering different activity conditions, (2) by listing different generic episodes or subprocesses of a complete cleaning process. We have considered this situation the first case and have chosen the location of the solar farm as the only differentiating factor since it completely determines the climatic conditions (sun, wind, storms) and the types of soil to be cleaned: organic matter (pollen, bird droppings or ashes produced by cars and industrial activities), inorganic matter (quartz, calcite, dolomite, kaolinite…), snow. The group considered that five usage situations (Figure 7) were representative of all situations: (1) Trondheim (Norway): snow, cold, less sun; (2) Paris (France): cement plant nearby, pigeons with bird droppings, installed on rooftop; (3) Dubai (United Arab Emirates): sand/dust, low rainfall, medium humidity; (4) Lagos (Nigeria): high humidity, very high rainfall in summer; and (5) Santiago (Chile): windy.
The five usage situations.

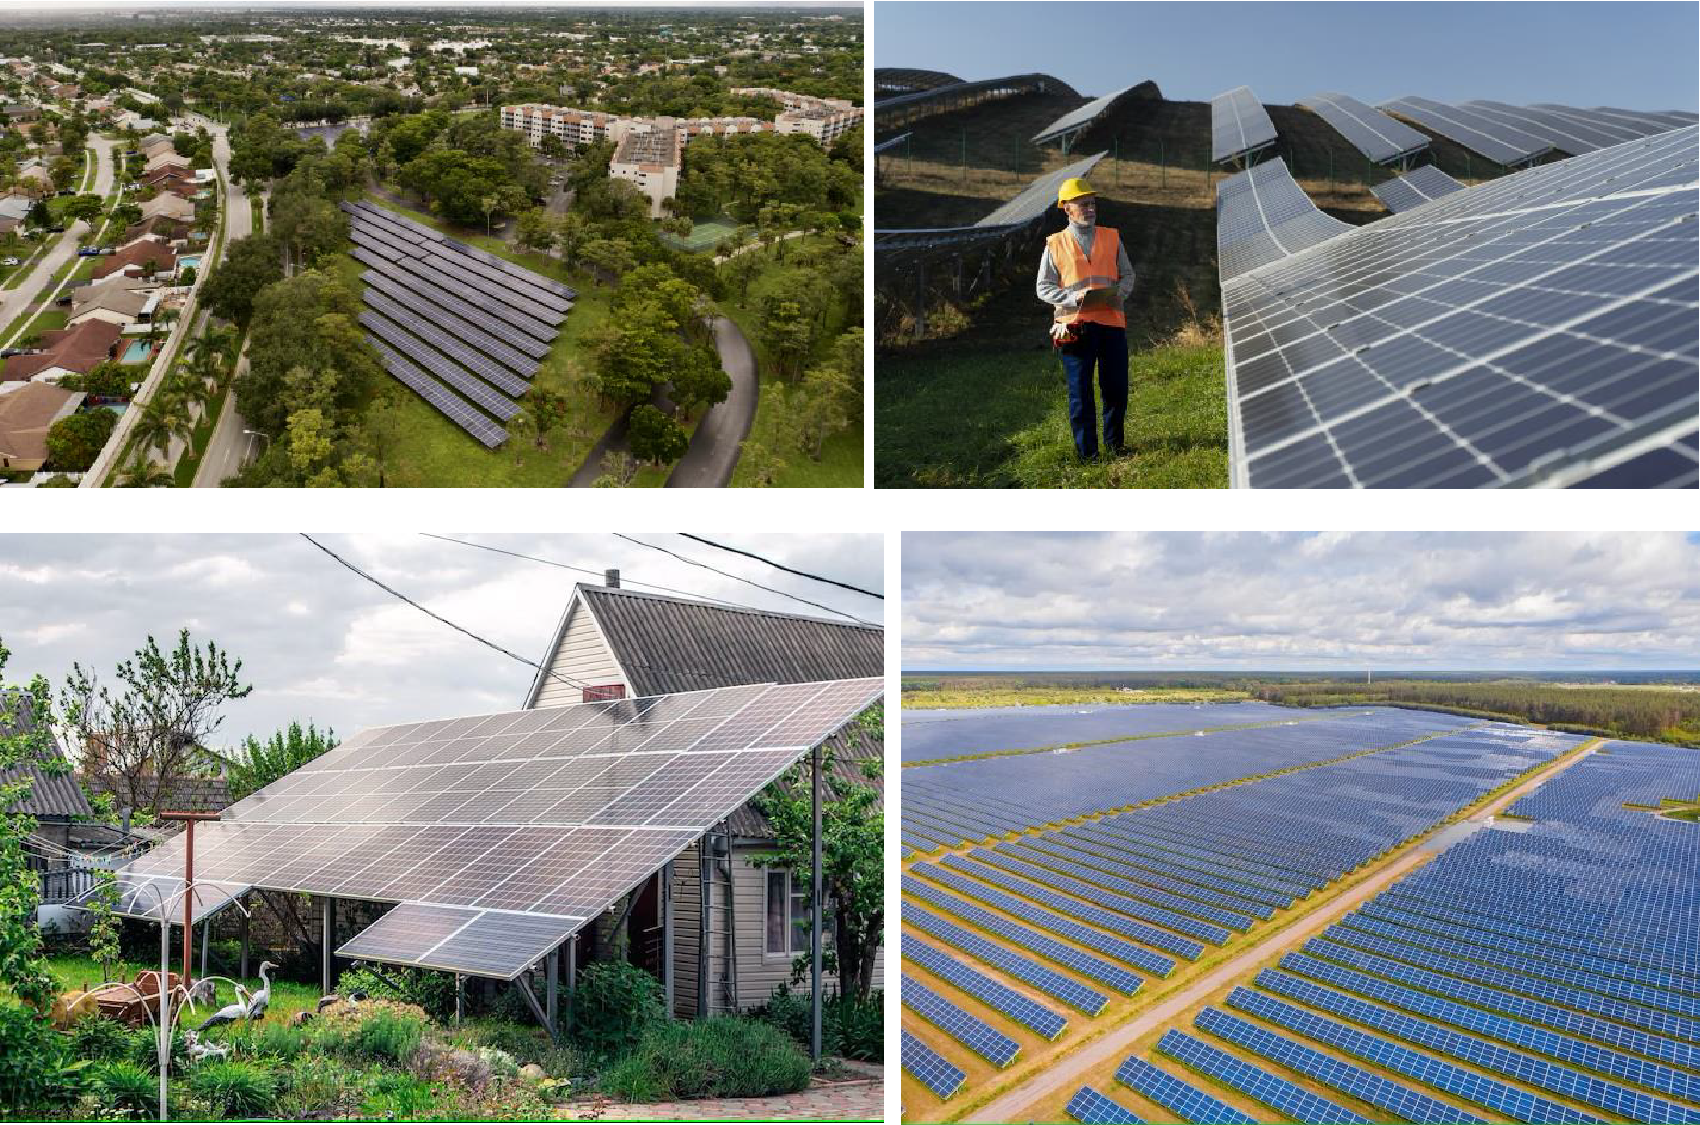
The problems relating to the activity are classically related to costs (CAPEX and OPEX), quality (remaining substances after cleaning, lack of safety for operator), time (slowness of cleaning, long downtime to switch between lines), and environment (water and material consumption). Their definition can be found in Table 4.
The eight problems
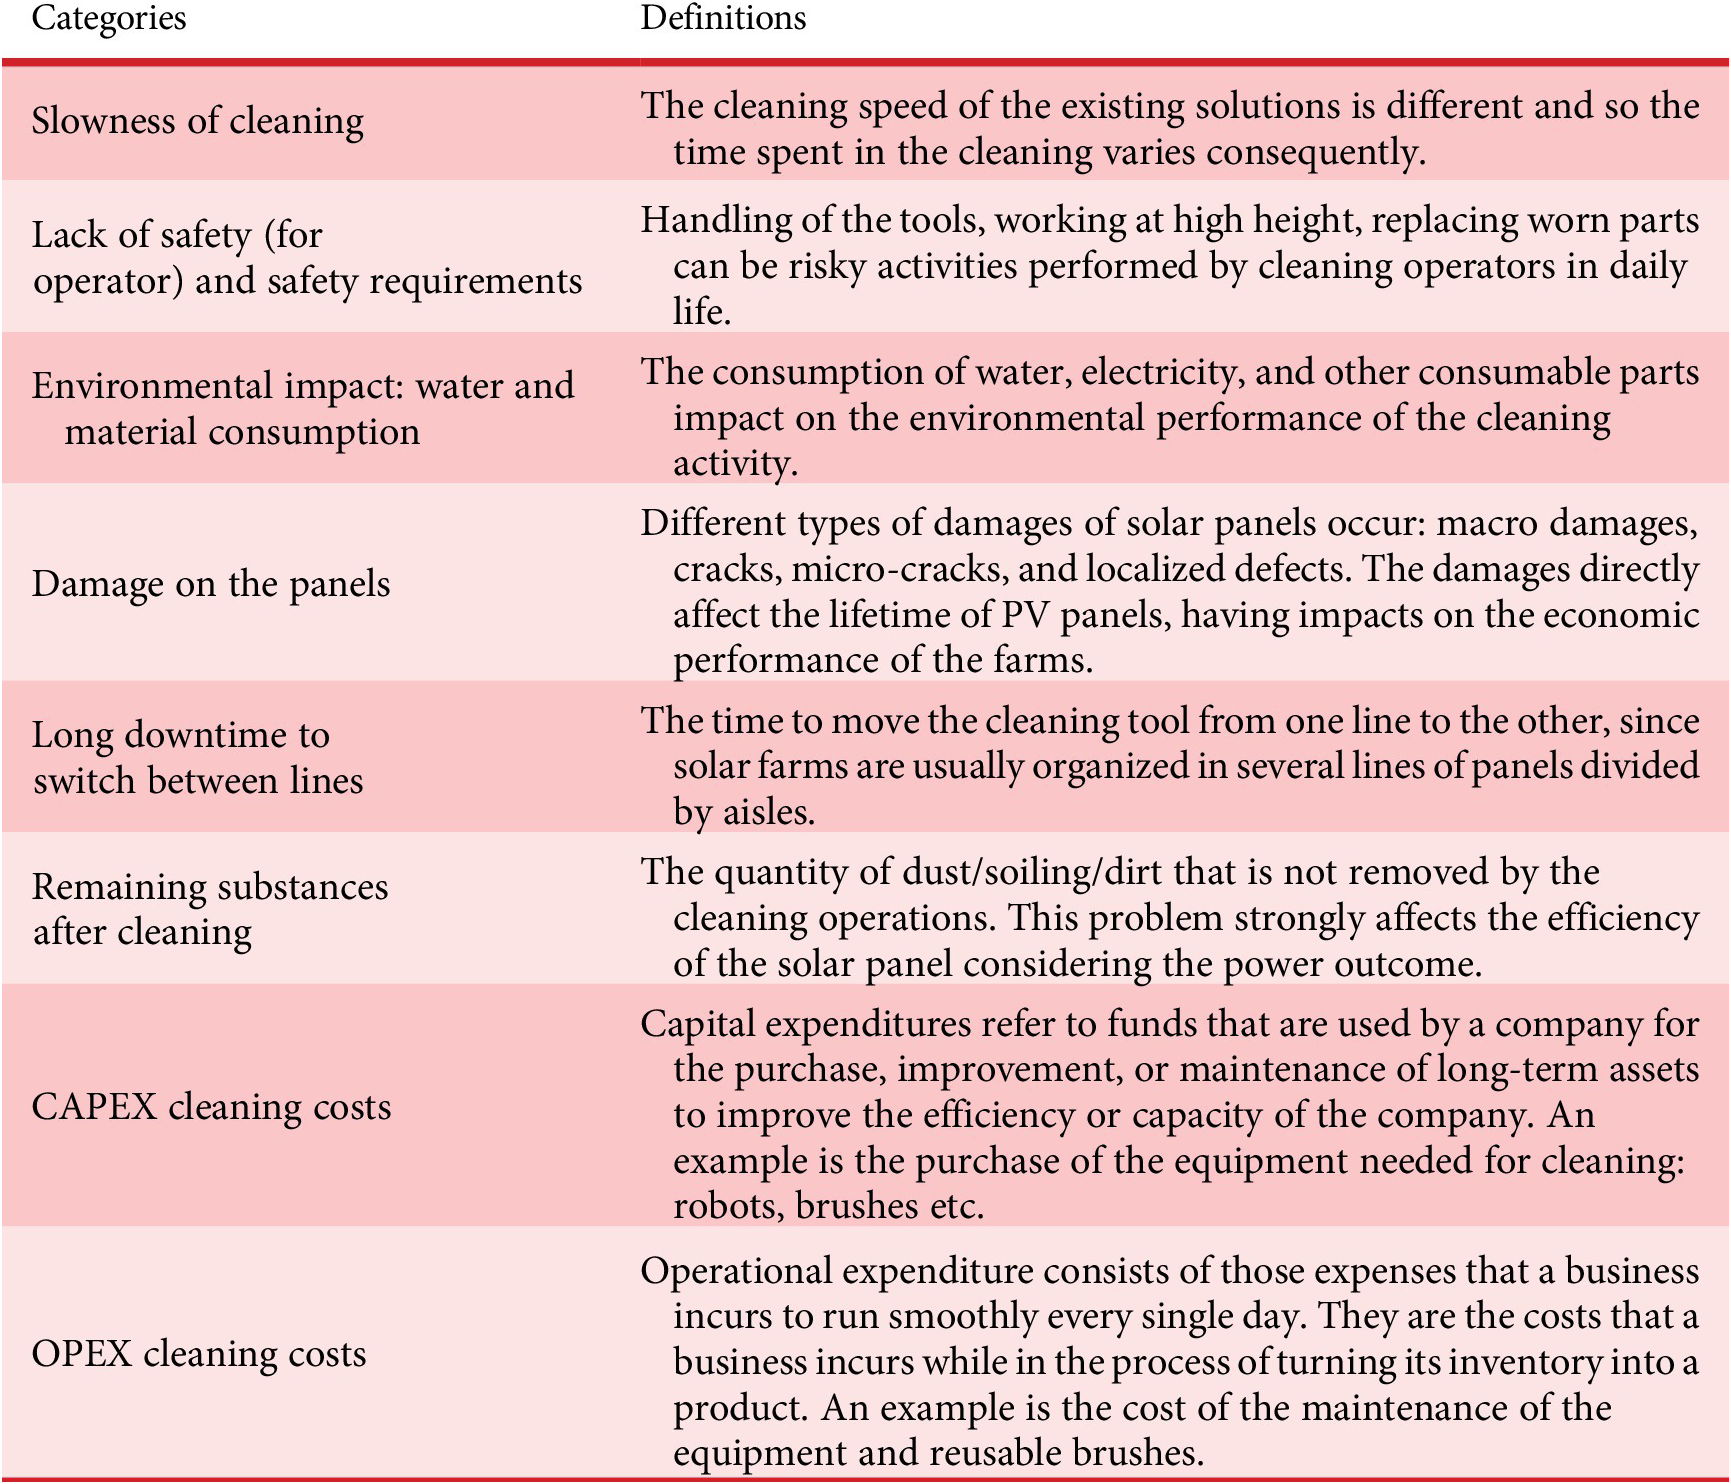
Existing solutions are inventoried and classified into eight categories (see Table 5 and Figure 8) with significant differences in properties with respect to users, usage situations, and problems. It can be noted that solutions like “coating systems” and “manual tools” are not exclusive solutions. However, the RID comparator algorithms still give excellent results.
The eight existing solutions

Illustrations of some existing solutions. From left to right: Autonomous robot, Manual tool, Installed hydraulic system, and Installed robotic system.
4.2. Modeling of the cognitive model of the activity
The modeling of the cognitive model of the “solar panel cleaning” activity (see subsection 3.3) is carried out progressively matrix by matrix and gives rise to highly structured discussions between experts, as the questions asked are very precise each time and relate to one, two, or even three categories of different building blocks.
Matrix $ {Up}_{size} $
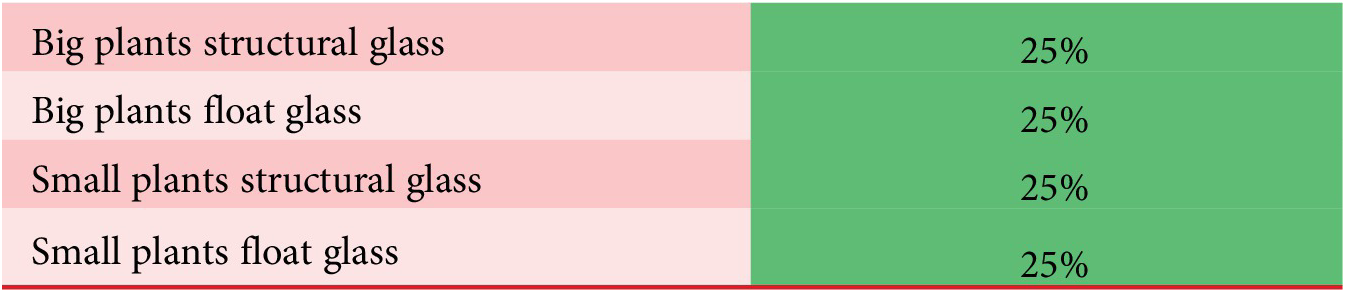
(Table 6) answers the question: “What is the proportion of each user profile or the importance given to them in the activity?”. By default, with RID, we want to help the stakeholders of an activity according to their number. The larger the number of stakeholders, the more we will want to alleviate their pain and support their activities. Conversely, orphan problems attached to very specific populations will tend to be erased, unless the project group decides to restrict its innovations to a few niche markets, which is an entirely laudable choice, but the project group must be aware of this marketing choice, and this is precisely what the RID comparator will make possible. Another way to weight the user profiles is with the importance of the market size that is given to them in terms of expected profit. In this case, it is decided that the importance of the 4 markets of solar panel cleaning is of equal importance.
$ {Up}_{size} $
(Table 6) answers the question: “What is the proportion of each user profile or the importance given to them in the activity?”. By default, with RID, we want to help the stakeholders of an activity according to their number. The larger the number of stakeholders, the more we will want to alleviate their pain and support their activities. Conversely, orphan problems attached to very specific populations will tend to be erased, unless the project group decides to restrict its innovations to a few niche markets, which is an entirely laudable choice, but the project group must be aware of this marketing choice, and this is precisely what the RID comparator will make possible. Another way to weight the user profiles is with the importance of the market size that is given to them in terms of expected profit. In this case, it is decided that the importance of the 4 markets of solar panel cleaning is of equal importance.
Matrix $ {\mathrm{Up}}_{\mathrm{size}} $
of size or importance of user profiles
$ {\mathrm{Up}}_{\mathrm{size}} $
of size or importance of user profiles
Matrix $ {WW}_{Ref} $
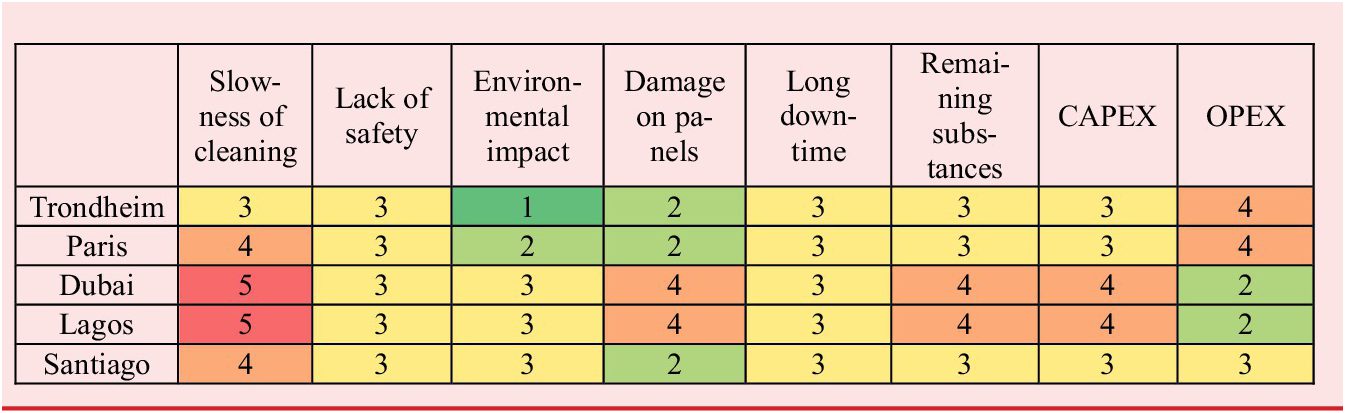
answers the question: “How often can this problem (of a given level/intensity) occur during this usage, regardless of the user?”. An in-depth survey was carried out in the field to identify all the good and bad practices. In Arabian desert (like for Dubai in UAE), the main soiling process is cementation due to the presence of dust (which is mainly sand) in the air (the sky is not visibly blue) and the high humidity (the morning dew). This cementation requires cleaning operations on average every 2 weeks, accounting for most of the operating costs of a solar farm. Today solar farm operators try to use dry cleaning as much as they can with tools such as mops or robotic brushes (nylon hair). This cleaning is triggered when the electrical production drops to 80 to 85% of its maximum capacity. But wet cleaning is mandatory every 2 months to restore the maximum capacity of the panels. Wet cleaning has been optimized while spraying with a water hose, but unfortunately a lot of water is wasted in this process. Local cleaning subcontractors still use manual cleaning rather than some automatic cleaning equipment. They avoid these solutions because the current robots have major problems with their durability and return on investment. In fact, buying automatic solutions is not an optimal solution for all working conditions, for example, for the cleaning of small areas in the case of a roof farm. Another factor for choosing manual cleaning is the low cost of labor in third-world countries. A number of findings were clearly established by the group in order to complete Table 7. The slowness of the cleaning procedure mainly occurs in Dubai and Lagos since the level of soiling in these regions is extremely high. Also, considering the cementation process, the time needed for performing the cleaning becomes quite high. The solar panels in Dubai and Lagos experience large quantities of remaining substances after cleaning, due to the low level of precipitations along the year. The CAPEX problem is mainly faced in Dubai and Lagos because solar farms’ managers must deal with extreme conditions in terms of soiling (i.e., high expenditure on cleaning tooling). The OPEX problem is linked with Trondheim and Paris since they are locations where labor and consumables costs are high.
$ {WW}_{Ref} $
answers the question: “How often can this problem (of a given level/intensity) occur during this usage, regardless of the user?”. An in-depth survey was carried out in the field to identify all the good and bad practices. In Arabian desert (like for Dubai in UAE), the main soiling process is cementation due to the presence of dust (which is mainly sand) in the air (the sky is not visibly blue) and the high humidity (the morning dew). This cementation requires cleaning operations on average every 2 weeks, accounting for most of the operating costs of a solar farm. Today solar farm operators try to use dry cleaning as much as they can with tools such as mops or robotic brushes (nylon hair). This cleaning is triggered when the electrical production drops to 80 to 85% of its maximum capacity. But wet cleaning is mandatory every 2 months to restore the maximum capacity of the panels. Wet cleaning has been optimized while spraying with a water hose, but unfortunately a lot of water is wasted in this process. Local cleaning subcontractors still use manual cleaning rather than some automatic cleaning equipment. They avoid these solutions because the current robots have major problems with their durability and return on investment. In fact, buying automatic solutions is not an optimal solution for all working conditions, for example, for the cleaning of small areas in the case of a roof farm. Another factor for choosing manual cleaning is the low cost of labor in third-world countries. A number of findings were clearly established by the group in order to complete Table 7. The slowness of the cleaning procedure mainly occurs in Dubai and Lagos since the level of soiling in these regions is extremely high. Also, considering the cementation process, the time needed for performing the cleaning becomes quite high. The solar panels in Dubai and Lagos experience large quantities of remaining substances after cleaning, due to the low level of precipitations along the year. The CAPEX problem is mainly faced in Dubai and Lagos because solar farms’ managers must deal with extreme conditions in terms of soiling (i.e., high expenditure on cleaning tooling). The OPEX problem is linked with Trondheim and Paris since they are locations where labor and consumables costs are high.
Matrix $ {WW}_{Ref} $
of frequency of problems in general
$ {WW}_{Ref} $
of frequency of problems in general
Matrices $ {WW}_i $
answer the question: “How often can this problem (of a given level/intensity) occur during this usage situation for each user specifically?”. Filling the sole
$ {WW}_i $
answer the question: “How often can this problem (of a given level/intensity) occur during this usage situation for each user specifically?”. Filling the sole $ {WW}_{Ref} $
matrix to inform on the frequency of problems regardless of user profiles can be sufficient to get a first result. However, things can be modulated by considering the specificities of user profiles. Let us look at the two notable differences in these user profiles that conduct to express the four
$ {WW}_{Ref} $
matrix to inform on the frequency of problems regardless of user profiles can be sufficient to get a first result. However, things can be modulated by considering the specificities of user profiles. Let us look at the two notable differences in these user profiles that conduct to express the four $ {WW}_i $
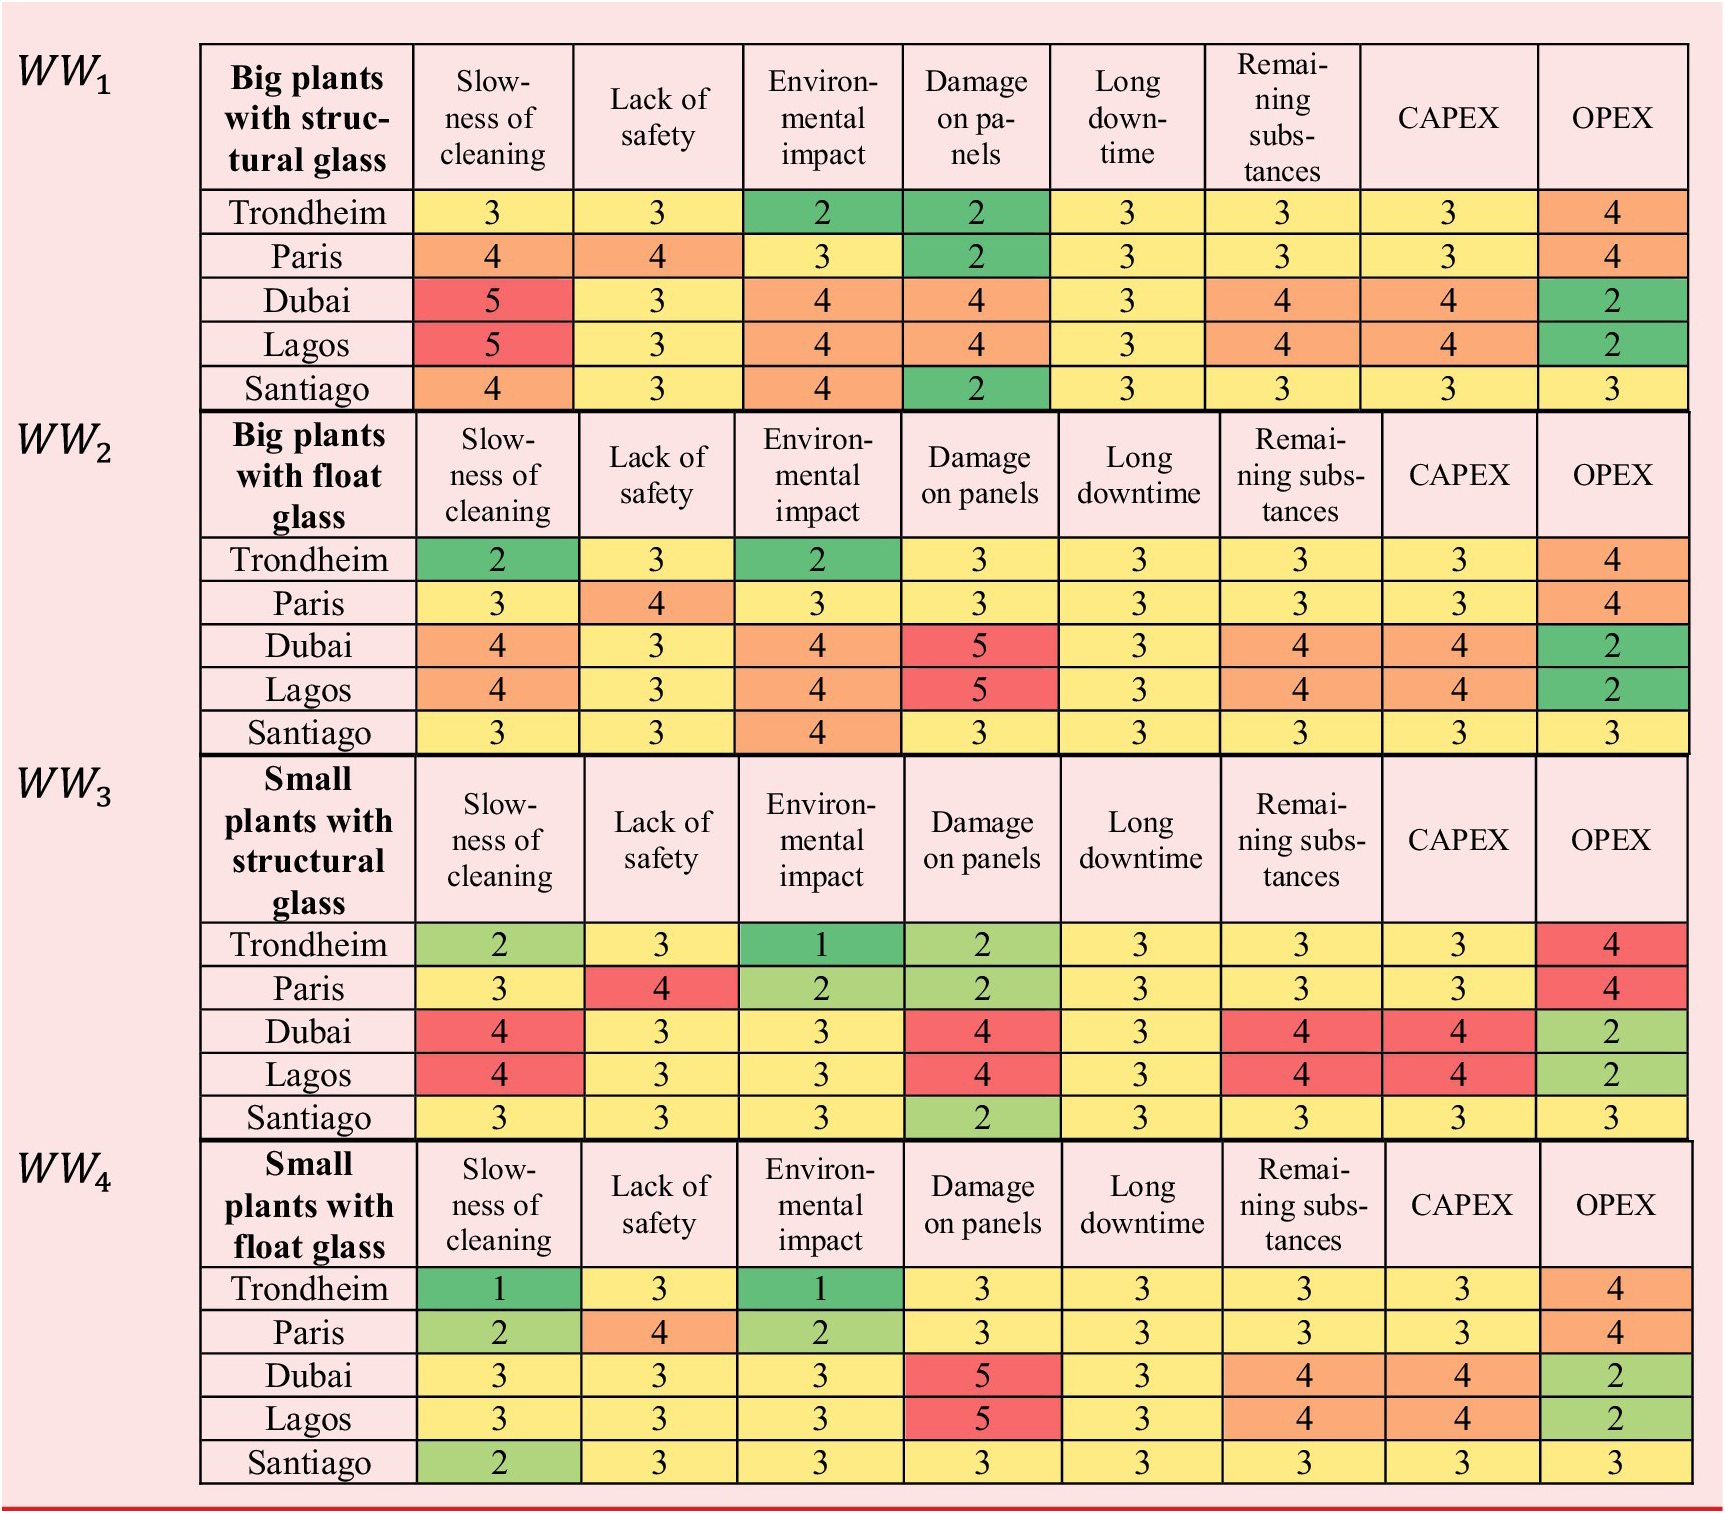
matrices (see Tables 8). First, the main difference between big and small plant is related to the environmental impact (so the consumption of water and materials) and the slowness of the cleaning procedure. Second, the main difference between structural and float glass is the damage on the panels and slowness of cleaning procedure. The strength of float glass is lower, and the cleaning operations are faster when dealing with structural glass.
$ {WW}_i $
matrices (see Tables 8). First, the main difference between big and small plant is related to the environmental impact (so the consumption of water and materials) and the slowness of the cleaning procedure. Second, the main difference between structural and float glass is the damage on the panels and slowness of cleaning procedure. The strength of float glass is lower, and the cleaning operations are faster when dealing with structural glass.
Matrices $ {WW}_i $
of frequency of problems by user profiles
$ {WW}_i $
of frequency of problems by user profiles
Matrix $ {Us}_{size\; Ref} $
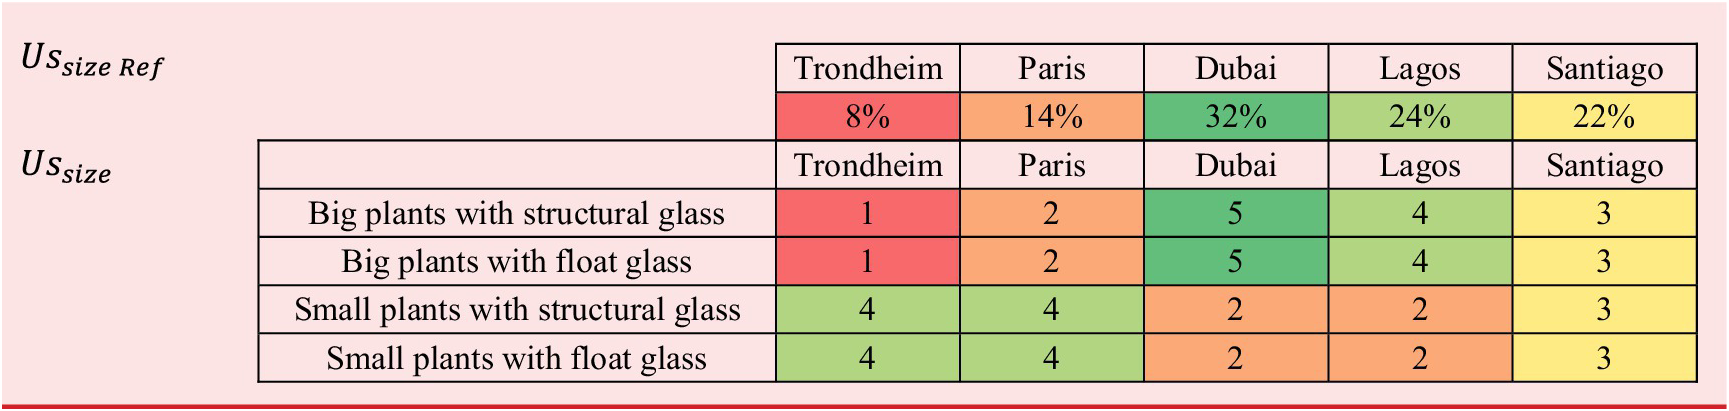
answers the question: “How long or how important are the current or desired usage situations regardless of the user?”. The duration or importance of a usage situation must sometimes be interpreted. In the most frequent case, when usage situations are associated with generic episodes, subprocesses or tasks of the activity, then the relative duration of usage situations is often chosen. In the less frequent case, when usage situations are associated with different activity conditions (this is the case here), then either the proportion of these activity conditions or the relative importance of these activity conditions can be chosen. In our case of “cleaning solar panels”, one can make the observation that the major part of the energy produced by solar plants comes from Dubai and Lagos. The two regions are quite close to the equator, and they face a high number of sunny days along the year (Dubai about 3500 annual hours of sunshine and Lagos about 2500 annual hours of sunshine). We adopted this measure of annual hours of sunshine to express the relative importance of the usage situations (see Tables 9).
$ {Us}_{size\; Ref} $
answers the question: “How long or how important are the current or desired usage situations regardless of the user?”. The duration or importance of a usage situation must sometimes be interpreted. In the most frequent case, when usage situations are associated with generic episodes, subprocesses or tasks of the activity, then the relative duration of usage situations is often chosen. In the less frequent case, when usage situations are associated with different activity conditions (this is the case here), then either the proportion of these activity conditions or the relative importance of these activity conditions can be chosen. In our case of “cleaning solar panels”, one can make the observation that the major part of the energy produced by solar plants comes from Dubai and Lagos. The two regions are quite close to the equator, and they face a high number of sunny days along the year (Dubai about 3500 annual hours of sunshine and Lagos about 2500 annual hours of sunshine). We adopted this measure of annual hours of sunshine to express the relative importance of the usage situations (see Tables 9).
Matrices $ {Us}_{size\; Ref} $
of duration or importance of usage situations in general and
$ {Us}_{size\; Ref} $
of duration or importance of usage situations in general and $ {Us}_{size} $
of duration or importance of usage situations by user profiles
$ {Us}_{size} $
of duration or importance of usage situations by user profiles
Matrix $ {Us}_{size} $
answers the question: “How long or how important are the current or desired usage situations for each user specifically?”. Again, we can choose to introduce modulations in the duration or importance of use situations for each user profile. We must then ask ourselves how the user profiles have affinities or spend more or less time in the usage situations. In this “cleaning solar panels” case, we based ourselves on the approximate distribution of the types of solar farms (our user profiles) in the different countries (the usage situations). Indeed, big plants (and consequently relevant power produced) are located in hot areas, while the small plants are spread in mountain and industrial environments. Our formulas can take into account qualitative estimates (here on a scale of 0 to 5), percentages or even a scale of a particular physical measure. This must be decided once and for all when filling in the matrix (see Table 9).
$ {Us}_{size} $
answers the question: “How long or how important are the current or desired usage situations for each user specifically?”. Again, we can choose to introduce modulations in the duration or importance of use situations for each user profile. We must then ask ourselves how the user profiles have affinities or spend more or less time in the usage situations. In this “cleaning solar panels” case, we based ourselves on the approximate distribution of the types of solar farms (our user profiles) in the different countries (the usage situations). Indeed, big plants (and consequently relevant power produced) are located in hot areas, while the small plants are spread in mountain and industrial environments. Our formulas can take into account qualitative estimates (here on a scale of 0 to 5), percentages or even a scale of a particular physical measure. This must be decided once and for all when filling in the matrix (see Table 9).
Matrix $ {P}_{imp\; Ref} $
answers the question: “How severe is this problem in terms of dramatic consequences regardless of the user?”. The importance of problems must be estimated in terms of the severity of their consequences. Here, a causality graph linking causes to problems and consequences has been drawn to establish orders of magnitude in terms of dramatic consequences. Of course, the project group must consider how it can balance the economic, safety, and environmental consequences. The RID Knowledge Design process was important for gathering useful information but the project group could still express its sensitivity during this weighting task. In practice, we chose a simple rating scale like 0 to 5 or 0 to 10 (see Table 10a). Then, we determined the most important problems and gave it the maximum score. We did the same with the least important problems, and next, we scaled the rating for problems of intermediate importance. Finally, we can possibly transform these weights into percentages and slightly modify the importance of some percentages.
$ {P}_{imp\; Ref} $
answers the question: “How severe is this problem in terms of dramatic consequences regardless of the user?”. The importance of problems must be estimated in terms of the severity of their consequences. Here, a causality graph linking causes to problems and consequences has been drawn to establish orders of magnitude in terms of dramatic consequences. Of course, the project group must consider how it can balance the economic, safety, and environmental consequences. The RID Knowledge Design process was important for gathering useful information but the project group could still express its sensitivity during this weighting task. In practice, we chose a simple rating scale like 0 to 5 or 0 to 10 (see Table 10a). Then, we determined the most important problems and gave it the maximum score. We did the same with the least important problems, and next, we scaled the rating for problems of intermediate importance. Finally, we can possibly transform these weights into percentages and slightly modify the importance of some percentages.
Matrices $ {P}_{imp\; Ref} $
of severity of problems in general and
$ {P}_{imp\; Ref} $
of severity of problems in general and $ {P}_{imp} $
of severity of problems by user profiles
$ {P}_{imp} $
of severity of problems by user profiles

Matrix $ {P}_{imp} $
answers the question: “How severe is this problem in terms of dramatic consequences for each user specifically?”. Again, it may be relevant to express how the different user profiles are more or less sensitive to problems. In our case, damage on panels is greater with float glass, which wears out more quickly. Environmental impact is more important for big plants. Slowness of cleaning is more important, as well as more difficult to control, for big plants. It is also all the more important for structured glasses.
$ {P}_{imp} $
answers the question: “How severe is this problem in terms of dramatic consequences for each user specifically?”. Again, it may be relevant to express how the different user profiles are more or less sensitive to problems. In our case, damage on panels is greater with float glass, which wears out more quickly. Environmental impact is more important for big plants. Slowness of cleaning is more important, as well as more difficult to control, for big plants. It is also all the more important for structured glasses.
Matrix $ EsP $
answers the question: “To what extent does this solution eliminate or mitigate this problem?”. After the investigation led in the knowledge design subprocess RID, it was possible to notice how different existing solutions solve specific problems (see Table 11). Manual tools are usually slow, and operators can cause damage to the panels, both in terms of cracks and macro damages. However, the quality of the cleaning is high, keeping CAPEX quite low. Installed hydraulic systems use a huge quantity of water, and the final effectiveness of the cleaning operations strongly depends on the soiling type. For heavy soiling deposition, this kind of solution is quite ineffective. Installed robotic systems and autonomous robots are useful devices for cleaning solar panels. Their overall performance is quite good, specially looking the remaining substances and at the OPEX problem. The autonomous ones can also easily be moved between different lines of panels. Venturi method solves a lot of the identified problems, even if the method works only in specific atmospheric conditions (that is windy areas). Ampere method is based on the use of electric current for removing dust and sand from the panels. Also considering this approach, its effectiveness strongly varies on the soiling typology. CAPEX and OPEX are medium-low.
$ EsP $
answers the question: “To what extent does this solution eliminate or mitigate this problem?”. After the investigation led in the knowledge design subprocess RID, it was possible to notice how different existing solutions solve specific problems (see Table 11). Manual tools are usually slow, and operators can cause damage to the panels, both in terms of cracks and macro damages. However, the quality of the cleaning is high, keeping CAPEX quite low. Installed hydraulic systems use a huge quantity of water, and the final effectiveness of the cleaning operations strongly depends on the soiling type. For heavy soiling deposition, this kind of solution is quite ineffective. Installed robotic systems and autonomous robots are useful devices for cleaning solar panels. Their overall performance is quite good, specially looking the remaining substances and at the OPEX problem. The autonomous ones can also easily be moved between different lines of panels. Venturi method solves a lot of the identified problems, even if the method works only in specific atmospheric conditions (that is windy areas). Ampere method is based on the use of electric current for removing dust and sand from the panels. Also considering this approach, its effectiveness strongly varies on the soiling typology. CAPEX and OPEX are medium-low.
Matrix $ EsP $
of Level of problem-solving for existing solutions
$ EsP $
of Level of problem-solving for existing solutions

Matrix $ UsEs $
answers the question: “To what extent does this solution facilitate this usage?”. After the investigation led in the Knowledge Design RID subprocess, it was possible to notice how different existing solutions are adapted to specific usage situations (see Table 12). It is straightforward to understand how manual and mechanized tools are suitable for almost the 5 usage scenarios. Also installed robotic systems facilitate the cleaning operations, especially in Lagos. On the other hand, coating systems are good for moderate soiling, so for example, in Trondheim and Paris. The Venturi method works perfectly in windy places in order to take advantage of air fluxes: Santiago is the only location that satisfies this requirement.
$ UsEs $
answers the question: “To what extent does this solution facilitate this usage?”. After the investigation led in the Knowledge Design RID subprocess, it was possible to notice how different existing solutions are adapted to specific usage situations (see Table 12). It is straightforward to understand how manual and mechanized tools are suitable for almost the 5 usage scenarios. Also installed robotic systems facilitate the cleaning operations, especially in Lagos. On the other hand, coating systems are good for moderate soiling, so for example, in Trondheim and Paris. The Venturi method works perfectly in windy places in order to take advantage of air fluxes: Santiago is the only location that satisfies this requirement.
Matrix $ UsEs $
of level of usage facilitation for existing solutions
$ UsEs $
of level of usage facilitation for existing solutions

Finally, matrix $ UpEs $
answers the question: “How effectively does this user access and use this solution?”. After the investigation led in the Knowledge Design RID subprocess, it was possible to notice how different existing solutions are accessible, effectively used and adapted to specific user profiles (see Table 13). For big plants, installed robots are preferable because of the large surface to clean, also coatings provide help in the cleaning operations. Regarding the covering of the PV panel, float glass is more suitable for autonomous robots and coating systems thank to its final finishing. Regarding glass qualities, similar reasonings can be made for small plants. Manual and mechanized tools are suitable for little plants, thanks to their high flexibility.
$ UpEs $
answers the question: “How effectively does this user access and use this solution?”. After the investigation led in the Knowledge Design RID subprocess, it was possible to notice how different existing solutions are accessible, effectively used and adapted to specific user profiles (see Table 13). For big plants, installed robots are preferable because of the large surface to clean, also coatings provide help in the cleaning operations. Regarding the covering of the PV panel, float glass is more suitable for autonomous robots and coating systems thank to its final finishing. Regarding glass qualities, similar reasonings can be made for small plants. Manual and mechanized tools are suitable for little plants, thanks to their high flexibility.
Matrix $ UpEs $
of Effectiveness of access to solutions by user profiles
$ UpEs $
of Effectiveness of access to solutions by user profiles

4.3. RID comparator outcomes and decision of an innovation brief
Effectiveness indicators have been invented to assess the ability of solutions to lessen quantities of pain. Effectiveness indicators are calculated for each solution and are denoted $ {E}_x $
, where
$ {E}_x $
, where $ E $
stands for “effectiveness”, and x is an index that identifies each of the 8 indicator types. They provide four levels of aggregation (from 0 to 3) depending on the desired level of detail desired about user profiles, usage situations or problems. For all indicators, a value of 100% means that the solution lessens the entire initial quantities of pain, or that there was no pain to begin with. A value of 0% means that the solution has no influence on the initial quantities of pain.
$ E $
stands for “effectiveness”, and x is an index that identifies each of the 8 indicator types. They provide four levels of aggregation (from 0 to 3) depending on the desired level of detail desired about user profiles, usage situations or problems. For all indicators, a value of 100% means that the solution lessens the entire initial quantities of pain, or that there was no pain to begin with. A value of 0% means that the solution has no influence on the initial quantities of pain.
-
• Aggregation level 0 corresponds to the most aggregated indicator – simply termed
$ E $
and defined by formula (11) – which allows a single effectiveness value for a solution. This is the most comprehensive indicator but also the least detailed since it is the most aggregated. Therefore, we have broken it down into 7 other indicators with varying degrees of granularity. -
• Level 1 deepens in one dimension according to user profiles, usage situations or problems, referred to as
$ {E}_{Us} $
,
$ {E}_{Up} $
and
$ {E}_P $
, respectively – see formula (8) to (10) –. For example, if one wants to know the effectiveness of a solution for a specific user profile, one must look for the value of
$ {E}_{Up} $
corresponding to this user. These indicators are vectors. -
• Level 2 deepens in two dimensions between user profiles, usage situations and problems. They are referred to as
$ {E}_{UsP} $
,
$ {E}_{UpUs} $
, and
$ {E}_{UpP} $
and are 2D matrices – see formula (5) to (7) -. -
• Level 3 is the most precise by presenting the effectiveness of a solution according to the three dimensions (user profiles, usage situations, and problems). The corresponding indicator is a 3D matrix noted
$ {E}_{UpUsP} $
defined by formula (4). This is the most complex indicator, but it is also the only one allowing to obtain the effectiveness corresponding to a specific problem, for a specific user, during a specific usage situation.


In what follows, we only display and comment on level 0 and 1 indicators, for the sake of simplicity.
As said, $ E $
(see Figure 9) is the most comprehensive effectiveness indicator but also the least detailed since it is the most aggregated. Usually, solutions that achieve more than 50% global effectiveness indicate an already considerable optimization. These solutions are very versatile and universal: they solve several problems at once, adapt to various usage situations and are suitable for various users. When in the markets corresponding to an activity, a good proportion of existing solutions exceed 50% of effectiveness, one can say that the market is mature, and it will probably be difficult to surprise the market with a new disruptive solution. When a solution has, in such a market, a low effectiveness (30% or less), we can say that if it remains, it is because it must surpass the others in niche contexts. When RID modeling is sufficiently fine-tuned, the use of effectiveness indicators of dimensions 2 and 3 makes it possible to find these local dominance zones, which are expressed by user/usage, user/problem, or problem/usage combinations. When all the existing solutions in the markets corresponding to an activity have a low effectiveness (less than 25%), we can legitimately say that there has been no serious study of usage, that the potential for innovation is strong and that an innovative and ambitious company has a future.
$ E $
(see Figure 9) is the most comprehensive effectiveness indicator but also the least detailed since it is the most aggregated. Usually, solutions that achieve more than 50% global effectiveness indicate an already considerable optimization. These solutions are very versatile and universal: they solve several problems at once, adapt to various usage situations and are suitable for various users. When in the markets corresponding to an activity, a good proportion of existing solutions exceed 50% of effectiveness, one can say that the market is mature, and it will probably be difficult to surprise the market with a new disruptive solution. When a solution has, in such a market, a low effectiveness (30% or less), we can say that if it remains, it is because it must surpass the others in niche contexts. When RID modeling is sufficiently fine-tuned, the use of effectiveness indicators of dimensions 2 and 3 makes it possible to find these local dominance zones, which are expressed by user/usage, user/problem, or problem/usage combinations. When all the existing solutions in the markets corresponding to an activity have a low effectiveness (less than 25%), we can legitimately say that there has been no serious study of usage, that the potential for innovation is strong and that an innovative and ambitious company has a future.
Results for the global effectiveness indicator $ E $
.
$ E $
.

The $ {E}_P $
indicator expresses the ability of existing solutions to cope effectively with a problem, considering all usage situations and all users. This indicator can be displayed in one of two ways (see Figure 10). It can be noted that the installed robotic system solves many of the problems (that is the score obtained by this solution is high in many categories of problems), except for long downtime to switch between lines. Coating systems and mechanized tools perform well, even if the former one does not solve the remaining substances problem and the latter the damage on the panels and the CAPEX. Autonomous robots are environmentally friendly and effective in cleaning; however, they are expensive and quite slow. Installed hydraulic systems consume a lot of water and are not able to clean all the types of soiling. These results make it possible to prioritize the problems that are never solved or only solved to a very limited extent.
$ {E}_P $
indicator expresses the ability of existing solutions to cope effectively with a problem, considering all usage situations and all users. This indicator can be displayed in one of two ways (see Figure 10). It can be noted that the installed robotic system solves many of the problems (that is the score obtained by this solution is high in many categories of problems), except for long downtime to switch between lines. Coating systems and mechanized tools perform well, even if the former one does not solve the remaining substances problem and the latter the damage on the panels and the CAPEX. Autonomous robots are environmentally friendly and effective in cleaning; however, they are expensive and quite slow. Installed hydraulic systems consume a lot of water and are not able to clean all the types of soiling. These results make it possible to prioritize the problems that are never solved or only solved to a very limited extent.
Results for the effectiveness for problems indicator $ {E}_P $
.
$ {E}_P $
.

The $ {E}_{Us} $
indicator expresses the ability of existing solutions to effectively provide a service in a usage situation, considering all problems and all users. This indicator can be displayed in one of two ways (see Figure 11). It can be noted that the Venturi method works well in Santiago since it is a windy area. Coatings are useful in Santiago, Trondheim and Paris because cementation of dust does not occur. The installed robotic systems are a valuable technology for almost all usage situations. Autonomous robots are suitable for industrial environments like Paris, usually panels are positioned horizontally, and the dust can be easily removed. Looking at the usage situations, Dubai is the archetype facing the biggest problems. Low humidity, low rainfall, and high presence of dust in the air characterize the location. In addition, Lagos suffers also a lot of troubles. For these two locations, there is no satisfactory solution in average, and there is a lot of quantities of pain remaining. The project group decided to focus its innovation brief to them. The most adapted solution Dubai and Lagos is the installed robotic system, which in turn reveals in Figure 10 to have weak performances in terms of environmental impacts and downtime. So, we are almost done with the innovation brief.
$ {E}_{Us} $
indicator expresses the ability of existing solutions to effectively provide a service in a usage situation, considering all problems and all users. This indicator can be displayed in one of two ways (see Figure 11). It can be noted that the Venturi method works well in Santiago since it is a windy area. Coatings are useful in Santiago, Trondheim and Paris because cementation of dust does not occur. The installed robotic systems are a valuable technology for almost all usage situations. Autonomous robots are suitable for industrial environments like Paris, usually panels are positioned horizontally, and the dust can be easily removed. Looking at the usage situations, Dubai is the archetype facing the biggest problems. Low humidity, low rainfall, and high presence of dust in the air characterize the location. In addition, Lagos suffers also a lot of troubles. For these two locations, there is no satisfactory solution in average, and there is a lot of quantities of pain remaining. The project group decided to focus its innovation brief to them. The most adapted solution Dubai and Lagos is the installed robotic system, which in turn reveals in Figure 10 to have weak performances in terms of environmental impacts and downtime. So, we are almost done with the innovation brief.
Results for the effectiveness for usage situations indicator $ {E}_{Us} $
.
$ {E}_{Us} $
.

The $ {E}_{Up} $
indicator expresses the ability of existing solutions to effectively provide a service to a given user profile, considering all problems and all usage situations. Results in Figure 12 reveal that there is strong difference in the trend of structural and float glass, considering the two main families of plants. Float glass is on average better for applying coatings and for deploying autonomous robots since the surface is very smooth. Installed robotic systems are effective for big plants, manual, and mechanized tools for small ones. Manual and mechanized tools are affordable even for smaller plants, while installed devices are a good tradeoff between costs and cleaning effectiveness for big plants. The decision is made here to dedicate the innovation brief to big plants for which the average effectiveness is lower.
$ {E}_{Up} $
indicator expresses the ability of existing solutions to effectively provide a service to a given user profile, considering all problems and all usage situations. Results in Figure 12 reveal that there is strong difference in the trend of structural and float glass, considering the two main families of plants. Float glass is on average better for applying coatings and for deploying autonomous robots since the surface is very smooth. Installed robotic systems are effective for big plants, manual, and mechanized tools for small ones. Manual and mechanized tools are affordable even for smaller plants, while installed devices are a good tradeoff between costs and cleaning effectiveness for big plants. The decision is made here to dedicate the innovation brief to big plants for which the average effectiveness is lower.
Results for the effectiveness for user profiles indicator $ {E}_{Up} $
.
$ {E}_{Up} $
.

5. Discussion and conclusions
Comparing design alternatives or solutions is a fundamental task in design.
In the introduction to this article, we illustrated with the purchase of a PC that a customer who wants to explain his/her usage situations does not have the means to express them. If he/she cannot express his/her needs and verify that a technical product can do the job, then the system for selecting products on the market is unsuitable. The RID methodology makes it possible to develop product selectors or comparators, indifferently, for a given user who may encounter particular problems in specific usage situations. Figure 12a illustrates this, clearly showing that:
-
- the solutions best suited to the “Big plants float glass” user are: 1/ Installed robotic systems 2/ Coating system 3/ Autonomous robots
-
- the solutions best suited to the “Small structural glass plants” user are: 1/ Installed robotic systems 2/ Mechanized tools 3/ Coating system
The RID comparator approach can therefore be used both to compare the effectiveness of products in relation to usage situations or problems and to develop solution selectors tailored to specific user needs. With RID, we claim that product specifications are of great interest if they are broken down by situation/context of usage. That is the whole point of the RID Comparator method presented in this article, which addresses deficient design practices.
However, we can generalize and conceptualize the comparison of design alternatives by considering four situations (Table 14) in which, respectively, a consumer, a user, a marketer, and a designer find themselves in the situation of comparing existing commercial solutions (those of competitors or those of your company) or alternative solutions during the design process. In all four situations, the players find themselves unable to gain a thorough understanding of the fact that the design solutions envisaged are suited to the usages they want to make of them (see also (He et al., Reference He, Chen, Hoyle and Yannou2012; Yannou et al., Reference Yannou, Yvars, Hoyle and Chen2013; Wang et al., Reference Wang, Yannou, Alizon and Yvars2013)). Of course, they will try to cobble together a list of criteria and weight them to make their decisions like with the Pug matrix and AHP methods.
The four situations of comparing design solutions

However, comparing is not simply giving a grade without going into the details of what makes a solution suitable or unsuitable for a particular need. This is particularly the case for the marketer and the designer for who to compare must also be to study the conditions for a given solution to partially dominate another one under restrictive conditions of categories of users, usage situations, or problems (or service expectations). Among the set of existing solutions on the market, very few are Pareto optimal, and every solution is in general dominant under some restrictive conditions. If a solution is not on the Pareto front of solutions of the same type, it risks rapidly disappearing. Blue Ocean Strategy (BOS; Kim, Reference Kim2005; Kim and Mauborgne, Reference Kim and Mauborgne2005) is an innovation strategy based on this principle to reinforce or make a unique subset of offer attributes. Consequently, the comparison between design solutions should be more of an exploration of dominance.
We have seen that the Pugh matrix method and the AHP method have a number of limitations:
-
1. The system whose solutions are being compared is not known.
-
2. There is no specific ontology for expressing a relevant criterion, and we do not know whether we have a complete list of criteria.
-
3. These methods mix the expectations of users with the constraints and preferences of the company, and there is no strong logic for knowing what to include in the comparison and what not.
-
4. The comparison is not ultimately based on the principle that a solution provides a complete and satisfactory service in a given usage context.
-
5. These methods are not validated, in the sense that (a) we do not know whether we have used them properly because of a lack of framework, and (b) we do not know whether the method is good in absolute terms (we have more indications than not, as mentioned previously in the article).
In this article, we have provided a solution to these limitations by proposing the RID comparator, which is based on the RID methodology and fits perfectly into an innovative RID design process:
-
1. The system on which we are trying to compare existing solutions and design innovative solutions is unambiguously defined as a mediating artifact (Engeström et al., Reference Engeström, Miettinen and Punamäki-Gitai1999) in the context of an activity and by the ideal goal of this activity.
-
2. The ontology we use is that of the RID building blocks of an activity, the segmented representation of an activity against categories of user profiles, usage situations and problems (and expectations) is confronted with a segmented representation of existing solutions.
-
3. The RID methodology therefore prioritizes the success of the activity, so we have a clear framework for introducing a criterion into the future comparison since it must be related to the expectations (pains and gains) of a stakeholder of this activity. A user profile in RID is not necessarily a product user but can be an important actor of the value chain of the product. There are far fewer questions about the legitimacy of introducing a category than there are about introducing a criterion for the Pugh matrix or AHP methods. We observed that, in practice, all the definitions we have provided and the rules for categorizing building blocks ensure that different people arrive at very similar activity parameterizations. This needs to be confirmed in our future work.
-
4. As regards the nature of the comparison, we proposed the original quantities of pain metric, which is an extensive measure, allowing summation and comparison (Stevens, Reference Stevens1946, 1953). This metric calculates elementary scores, which are then weighted in different ways to calculate eight increasingly aggregated effectiveness indicators: from level 3 to level 0 for an overall rating of the effectiveness of solutions, including level 1 with three indicators of effectiveness relating to user profiles, usage situations, and problems. These effectiveness indicators allow a real exploration of the dominance of solutions in relation to the service provided and the activity carried out while incorporating the widely adopted weighted average principle of the Pugh matrix and AHP methods. Pugh matrix method compares approximately and suggestively properties/attributes of an alternative solution against a reference solution. Our method leaves no room for suggestiveness, and our original metrics of quantities of pain and effectiveness indicators are calculated from data derived from the construction of a cognitive model of activity based on seven factual questions about activity practice. In the article, we show during the construction of the cognitive model how we meticulously elaborate data based on real statistics and probabilistic reasoning – sometimes scientific studies – about the dangerousness of a problem, the size of a user category, the representativeness of a usage situation, or the frequency of a problem in a situation for a given user. The whole method is designed to be based on data to inform decisions rather than on instinct.
-
5. The question of validation of our method of RID comparator is not trivial. We are not developing a metric or model for aggregating user preferences. It is in no way a question of choosing a better solution based on suggestions as to what consumers will prefer. We are therefore not in the position of having to validate a posteriori the best choices prescribed by our formulas based on user tests. We are in a similar situation to the use of the Pugh matrix and AHP methods to make complex decisions in the case of marketers and designers, where no one can know which will be the best solution at the end of the comparison. Our metrics are open-loop objective functions that do not need to be validated a posteriori because nobody can confirm what they are supposed to measure. What do they measure? As we made clear at the start of our article, our metrics measure effectiveness in covering usage situations. We have already published four journal articles on this subject (He et al., Reference He, Chen, Hoyle and Yannou2012; Yannou et al., Reference Yannou, Yvars, Hoyle and Chen2013; Wang et al., Reference Wang, Yannou, Alizon and Yvars2013; Bekhradi et al., Reference Bekhradi, Yannou, Farel, Zimmer and Chandra2015), where product families are optimized to maximize the usage coverage. In the present article, we use this usage coverage principle in a simpler, more qualitative way than in the four previous articles and we call it effectiveness. In these previous publications, we never had any criticism of the fact that our objective function is debatable. We proposed it and it was never questioned.
In this article, we have gone into great detail about an industrial case which has enabled a global company to gain a better understanding of a complex, multifactorial design problem with multiple partially satisfactory solutions. The working group included 4 production managers from solar farms on several continents, 3 researchers from the company’s R&D department who had worked on the various physico-chemical phenomena linked to the nature of soiling in different parts of the world, 2 marketers used to selling solar farms and their management and maintenance solutions, and 3 designers from the company’s R&D department. These 12 people were brought together for 3 half-days to set up and fill in the cognitive activity model and to analyze the effectiveness results of existing solutions using the RID comparator. This part was spread over 1.5 months. A second part, not reported in this article, consisted of an ideation, conceptual design and validation of a better innovative solution – described in pages 286 to 289 of (Yannou and Cluzel, Reference Yannou and Cluzel2024) –, which lasted 1 month on a part-time basis (half-time) with the 3 designers.
During the RID study, the many questions that were asked to build the cognitive model of the “Cleaning solar panels of solar farms” activity generated a great deal of debate and information-seeking which, in the end, created overall cohesion and consensus in the group, as the few disagreements only occurred on points of detail. In addition, the people in the company were able to “play” with the cognitive model and the effectiveness indicators because there are “what if” functions that are not explained in the article. The project group appreciated that the RID methodology and the RID comparator method forced them to dissociate the understanding of what creates value from the fact that the solution can be developed by the company at a lower cost and without risk. This dissociation is essential if we are not to pollute the innovation brief with too many nonfeasibility considerations whereas we have not even begun to ideate new concepts and solution architectures. They finally demonstrated the method’s ability to engage production managers, researchers, marketers, and designers in dialogue to jointly generate an innovation brief, which led to the official launch of a new innovation project. The notable difference from their previous way of doing things (see Figure 13) was that the marketers, after only superficially understanding the problems as the production managers might have mentioned them, used to determine an innovation brief that they would pass on to the designers. There was a loss of information between marketers and designers regarding the technical and market reasons that had led the marketers to make this targeting. Moreover, the designers only sporadically contacted the researchers during the process of designing a new solution to understand the circumstances of different types of soiling on solar panels more deeply. The RID comparator method, on the contrary, allowed them all to share a common understanding based on the ontology of the activity that they all understand well, to build and share an objective and simulatable cognitive model. By spending a little more time at the beginning, they are now convinced that they will ultimately save a lot of time, and most importantly, that they will gain in quality.
How the RID comparator method allowed for a change in the way of collaborating for the generation of an innovation brief.

Abbreviations
- BOS
-
Blue Ocean Strategy
- DDI
-
Design-Driven Innovation
- HCD
-
Human-Centered Design
- MRI
-
Market Reader Innovation
- NSI
-
Need Seeker Innovation
- QFD
-
Quality Function Deployment
- RID
-
Radical Innovation Design
- TDI
-
Technology Driver Innovation
- TPI
-
Technology Push Innovation
- UDI
-
Usage-Driven Innovation
Financial support
This research received no specific grant from any funding agency, commercial, or not-for-profit sectors.


 Open access