


1. Introduction
Prototyping is a ubiquitous and critical part of the new product development (NPD) process (Wall, Ulrich & Flowers Reference Wall, Ulrich and Flowers1992), supporting design development, decision-making and testing throughout processes stages (Ulrich & Eppinger Reference Ulrich and Eppinger2016). The process of prototyping is multi-purpose, with prototypes used for learning, communication between people and teams, refinement of designs and record keeping (Camburn et al. Reference Camburn, Viswanathan, Linsey, Anderson, Jensen, Crawford, Otto and Wood2017). Prototypes themselves comprise any representation of a product prior to the final design (Buchenau & Suri Reference Buchenau and Suri2000) and so may be of vastly different forms (Ulrich & Eppinger Reference Ulrich and Eppinger2016) ranging from preliminary sketches to near-production, comprehensive products. Throughout the process, the focus of learning will also vary, ranging from isolated prototyping of role, implementation and aesthetic to full development of integrated and comprehensive prototypes as the design process continues (Houde & Hill Reference Houde and Hill1997). While the ultimate aim of prototyping typically remains consistent – to support development of products – the prototyping space introduces a breadth of options as to how this output may be reached.
It then stands that the desired output from prototyping activities may be described as the accumulation of learning from any number of prototypes of different forms (see Camburn et al. Reference Camburn, Viswanathan, Linsey, Anderson, Jensen, Crawford, Otto and Wood2017; Petrakis, Wodehouse & Hird Reference Petrakis, Wodehouse and Hird2021a) each with associated levels of detail, costs, breadth of learning and development complexities. From these prototypes, designers must generate the learning required to produce their products, but they will have substantial choice as they do, and the choices that they make will impact the cost, difficulty and duration of the process itself.
High-quality prototyping then demands appropriate prototype method selection and sequencing aligned with design intent (Menold, Jablokow & Simpson Reference Menold, Jablokow and Simpson2017; Goudswaard et al. Reference Goudswaard, Snider, Gopsill, Jones, Harvey and Hicks2021b). However, Goudswaard et al. (Reference Goudswaard, Gopsill, Harvey, Snider, Bell and Hicks2021a) suggest that prototyping practice could be improved by improving prototyping method selection to ensure the right tool is used at the right time to generate the right knowledge – which is of importance as, in particular, novice designers are found to approach prototyping in an ad hoc manner (Petrakis et al. Reference Petrakis, Wodehouse and Hird2021a). This has led to the creation of prototype selection frameworks to guide designers to appropriate approaches for their given scenario (see, e.g., Filippi & Barattin Reference Filippi and Barattin2012; Menold et al. Reference Menold, Jablokow and Simpson2017; Lauff, Menold & Wood Reference Lauff, Menold and Wood2019).
Supporting better selection of prototyping methods must account not only for tangible impacts such as cost and time commit, but also recognise that the different properties of prototypes may affect the learning generated (Jones, Snider & Hicks Reference Jones, Snider and Hicks2020; Goudswaard et al. Reference Goudswaard, Snider, Gopsill, Jones, Harvey and Hicks2021b). Prototypes can be broadly considered to fall into two domains: physical (i.e., made of atoms) and digital (made of 1s and 0s). Each of these has its respective benefits and drawbacks. For example, the inherent tangibility of physical prototypes is particularly suited to understanding feel of a product in the hand, while the rapid reconfigurability of a digital model is suited to performance testing of many variants in a short period of time (Li, Nee & Ong Reference Li, Nee and Ong2017; Coutts, Wodehouse & Robertson Reference Coutts, Wodehouse and Robertson2019; Kent et al. Reference Kent, Snider, Gopsill and Hicks2021).
To support better method selection, it is then important to understand the potential relationships between prototyping activities and learning generated, such that proactive steps may be taken to ensure the methods chosen by designers will efficiently and effectively generate the learning that they need.
This article aims to understand the relationship between prototypes and learning generated through study and comparison of the prototyping media and methods of eight design teams, each solving the same design brief. Specifically, it will investigate the appearance of knowledge dimensions (KDs) (Real et al. Reference Real, Snider, Goudswaard and Hicks2021) during their prototyping activities, using them as a lens to compare between teams, prototyping domains, project stage gates and prototyping fidelities.
Correspondingly, the contribution of this article is twofold. First, in the elucidation of evidence that may permit mapping of KDs to prototyping activities; and second, in so doing, the proposition and validation of a methodology that can be used to operationalise KDs in the context of prototyping in product development.
The outputs of this work can therefore lead to better framings of prototyping activities that can subsequently support method selection such that it is aligned with the intent and needs of both the designer and design problem, as well as providing a methodology for the wider research community to use to further explore the prevalence and utility of KDs in prototyping.
2. Background
To contextualise the work in this article, the background section will consider: i) prototyping in new product development (Section 2.1); ii) prototyping as iterative knowledge generation (Section 2.2) and iii) knowledge dimensions in prototyping (Section 2.3).
2.1. Prototyping in new product development
In literature, prototypes are typically defined at an abstract level; as preliminary representations of a product. For example, as “an approximation of the product along one or more dimensions of interest” (Ulrich & Eppinger Reference Ulrich and Eppinger2016) or the very broad definition of Houde & Hill (Reference Houde and Hill1997) – “any representation of a design idea regardless of medium”. Such high-level definitions allow space for the wide range of prototypes and prototyping activities that exist in design industry, in which, prototyping methods and purposes are often in essence bespoke, in themselves, a task for the designer to select and implement as part of the product design process.
Others extend these artefact-driven definitions to also encompass the importance of the role of prototyping. Lauff, Kotys-Schwartz & Rentschler (Reference Lauff, Kotys-Schwartz and Rentschler2018) state that:
“A prototype is a physical or digital embodiment of critical elements of the intended design, and an iterative tool to enhance communication, enable learning, and inform decision-making at any point in the design process.
Prototyping is the process of creating the physical or digital embodiment of critical elements of the intended design.”
As such they identify that a prototype is more than the sum of its parts, and plays a broad and critical role in the learning and understanding processes of designers and across design teams. It is therefore critical for researchers to understand how prototyping methods influence the learning they afford it generates such that better tools and methods may be developed and selected by designers (Menold et al. Reference Menold, Jablokow and Simpson2017; Lauff et al. Reference Lauff, Menold and Wood2019).
This breadth of definition and criticality outlines a key challenge for industry – the selection and application of prototyping methods has a substantial impact on the success, quality and value of both the design process and design output (Camburn et al. Reference Camburn, Viswanathan, Linsey, Anderson, Jensen, Crawford, Otto and Wood2017; Rao et al. Reference Rao, Kim, Kwon, Agogino and Goucher-Lambert2020); for example, through the cost of methods employed (Christie et al. Reference Christie, Jensen, Buckley, Menefee, Ziegler, Wood and Crawford2012) and suitability of methods for the intended learning (Pei, Campbell & Evans Reference Pei, Campbell and Evans2011). However, prototyping can itself often be ad hoc and lacking direction (Petrakis et al. Reference Petrakis, Wodehouse and Hird2021a, Reference Petrakis, Wodehouse and Hird2021b), with both selection of methods and implementation left solely as a task for the designer indicating an absence of a clear prototyping strategy. This apparent lack of strategy risks inappropriate or sub-optimal selection, leading to extended processes or yielding products that do not reach their full potential. With novice designers, prototypes can be under-utilised during the front end of design (Deininger et al. Reference Deininger, Daly, Sienko, Lee and Kaufmann2019). It is subsequently suggested that prototyping practice could be improved by ensuring the right prototyping method is used at the right time (Goudswaard et al. Reference Goudswaard, Gopsill, Harvey, Snider, Bell and Hicks2021a).
To this end, researchers have developed many classifications of prototyping that have focused on elements including:
-
• prototyping methods and physical characteristics of prototypes (Hannah, Michaelraj & Summers Reference Hannah, Michaelraj and Summers2009; Ulrich & Eppinger Reference Ulrich and Eppinger2016);
-
• the embodiment of prototypes (Camburn et al. Reference Camburn, Dunlap, Kuhr, Viswanathan, Linsey, Jensen, Crawford, Otto and Wood2013);
-
• prototype types (Houde & Hill Reference Houde and Hill1997);
-
• prototype functionality (Buchenau & Suri Reference Buchenau and Suri2000);
-
• prototype fidelity (McCurdy et al. Reference McCurdy, Connors, Pyrzak, Kanefsky and Vera2006; Pei et al. Reference Pei, Campbell and Evans2011);
-
• purpose of prototyping activities (Otto & Wood Reference Otto and Wood2001; Ulrich & Eppinger Reference Ulrich and Eppinger2016; Camburn et al. Reference Camburn, Viswanathan, Linsey, Anderson, Jensen, Crawford, Otto and Wood2017);
-
• prototype scope (McCurdy et al. Reference McCurdy, Connors, Pyrzak, Kanefsky and Vera2006) and
-
• how prototyping enables progress in design processes (Lauff et al. Reference Lauff, Kotys-Schwartz and Rentschler2018).
Through these perspectives, researchers aim to understand how prototyping is used and may be better used to support the design process, with learnings then passed forwards to designers by way of better prototyping tools, methods and selection approaches.
2.2. Prototyping as iterative knowledge generation
Within a design process, and as highlighted by Lauff et al. (Reference Lauff, Kotys-Schwartz and Rentschler2018), a key role of prototyping lies in supporting the learning of the designer(s) implementing the prototyping activity. This view – of iterative knowledge generation lying central to prototyping activities – aligns closely with how we understand the wider design process itself. For example, Maher & Poon (Reference Maher and Poon1996) and Smulders, Reyman & Dorst (Reference Smulders, Reyman and Dorst2009) describe design as an iterative co-evolution of the problem space and the solution space, where activity within one increases knowledge of the appropriate state of the other with iteration until both align. Similarly, the Function, Behaviour, Structure (FBS) model (Gero & Kannengiesser Reference Gero and Kannengiesser2004; Gero Reference Gero1990) highlights the iteration between a design’s expected behaviour and actual behaviour with the learning generated from their comparison leading to alignment and the final product, while C-K theory (Hatchuel & Weil Reference Hatchuel and Weil2009) describes design as an iteration between an exploratory conceptual space and an explicit knowledge space where conceptual effort iteratively increases knowledge.
Through these models and definitions, it is clear that design, and hence prototyping as an activity within it, can be considered as a knowledge generation process – a view echoed by many (see Ulrich & Eppinger Reference Ulrich and Eppinger2016; Camburn et al. Reference Camburn, Viswanathan, Linsey, Anderson, Jensen, Crawford, Otto and Wood2017; Lauff et al. Reference Lauff, Menold and Wood2019; Goudswaard et al. Reference Goudswaard, Snider, Gopsill, Jones, Harvey and Hicks2021b). Increasing knowledge of the current design representation and comparison against expectation or some pre-defined ideal supports the next stage of iteration, with type and quality of knowledge generated then impacting the success of the design process.
Considering the breadth of prototyping tools and methods required and employed to meet the variant needs of different design projects, it then stands that the prototyping activity employed may directly impact the form of knowledge that is generated through the process. As such it is important to understand how the prototyping method employed may affect the knowledge that is subsequently generated, and whether it forms the appropriate set given the needs of the activity.
This argument underpins this work – direct investigation of the relationships between prototyping activity and knowledge generated, with an eventual view to influence said knowledge for the benefit of the wider design process itself. This is achieved by mapping of prototyping activity to KDs generated across eight comparable design projects, then exploring consistency both between cases, and between methods employed. In so doing, the article sets grounding for better method selection with respect to the knowledge that is most appropriate to the needs of the designer and design process.
2.3. Knowledge dimensions in prototyping
Where the development of a product or system requires knowledge to be generated across a range of dimensions (Ulrich & Eppinger Reference Ulrich and Eppinger2016), prior works have investigated the application of frameworks to observe the knowledge contributions from prototyping against such a range of dimensions. For instance, in the study of architecture, Schon & Wiggins (Reference Schon and Wiggins1992) and Schon (Reference Schon1968) outline a set of knowledge domains to which the designer registers knowledge; describing the process as a reflective conversation with the materials of a design’s solution, with the designer attributing information beyond the medium itself to a range of different domains.
Schon & Wiggins (Reference Schon and Wiggins1992) give the example of a designer working in the medium of drawing, ‘the designer sees what is “there” in some representation of a site, draws in relation to it, and sees what has been drawn, thereby informing further designing’. The designer not only registers visual information, but identifies and gives meaning to patterns beyond the medium itself, registering, and further evaluating this knowledge against the different dimensions required for the overall understanding of a concept. Further, research has shown that the medium used in an activity affects the form of and learning of the activity itself (Camburn et al. Reference Camburn, Viswanathan, Linsey, Anderson, Jensen, Crawford, Otto and Wood2017; Kent et al. Reference Kent, Snider, Gopsill and Hicks2021). This raises the question of the relationships between activity, medium and knowledge generated, and specifically to what degree the medium benefits, constrains, or otherwise influences knowledge generation such that it affects the progress of the design process itself.
In the context of NPD, Real et al. (Reference Real, Snider, Goudswaard and Hicks2021) recontextualise Schon’s domains to classify and characterise the design knowledge afforded by different prototype fabrication and evaluation methods (Real et al. Reference Real, Snider, Goudswaard and Hicks2023). The KDs proposed by Real et al. (Reference Real, Snider, Goudswaard and Hicks2021) delineate design knowledge into a set of 10 dimensions against which knowledge is required for the creation of a new product in NPD (Table 1). These dimensions are not claimed to be an exhaustive set, instead representing those proposed by Schon translated into the NPD domain. Where this work examines their feasibility as a research tool to generate insight, specific KDs of interest should be investigated or developed on a case-by-case basis in future work.
Knowledge dimensions that adapted from Schon & Wiggins (Reference Schon and Wiggins1992)

By considering these different KDs, researchers can better understand the complex and multidisciplinary nature of prototyping, as well as the challenges and opportunities involved in developing effective prototypes for different purposes and contexts.
Real et al. (Reference Real, Snider, Goudswaard and Hicks2021, Reference Real, Snider, Goudswaard and Hicks2023) highlight a number of relevant findings in their study of dimensions, predominantly, in the distinctions between the physical and digital fabrication and evaluation methods commonly employed in the product development process. The authors in this work identify strong relationships between the methods selection and the KD(s) that they contribute towards.
The study, based on a participant questionnaire, in which raters review and score a broad and representative selection of prototyping media by their perceived contributions to each of the dimensions, posits the hypothesis that different media or methods will provide varying degrees of learning against different dimensions. Thus, by observing dimensions and understanding the methods, prototyping activities can be better supported with prescribed strategies to streamline knowledge generation in the necessary dimensions.
2.4. Summary and research hypotheses
Prototyping can be understood as a process in which a designer utilises any number of methods to form preliminary representations of their design, from which they generate knowledge about it as a product, iterate and refine until reaching a satisfactory final design.
The variant properties of different media (Lim, Stolterman & Tenenberg Reference Lim, Stolterman and Tenenberg2008; Pei et al. Reference Pei, Campbell and Evans2011; Christie et al. Reference Christie, Jensen, Buckley, Menefee, Ziegler, Wood and Crawford2012; Ulrich & Eppinger Reference Ulrich and Eppinger2016; Kent et al. Reference Kent, Snider, Gopsill and Hicks2021) and previous preliminary work (Goudswaard et al. Reference Goudswaard, Snider, Gopsill, Jones, Harvey and Hicks2021c; Real et al. Reference Real, Snider, Goudswaard and Hicks2021) imply that different media are differently suited to generating knowledge against different dimensions. However, the specific suitability and relationships between such media and knowledge generated is not currently understood. There is, hence, a need to investigate the knowledge generated during prototyping in order to enable improved method selection. Further, there is a need to understand the degree by which knowledge generation may be expected to be consistent or variant dependent on designer, scenario, or common prototyping properties such as fidelity and process stage.
Additionally, there is a need for a methodology that can be used to elicit and analyse the appearance of KDs during prototyping activities in product development. As stated in the article’s contributions, the methodology proposed in this article constitutes a first-of-a-kind approach to enable this.
To indicate the utility of KDs as a method to measure and support design activity, this work probes an initial situated investigation of KDs in a real-world design context by considering the what, when and how of prototype contributions towards each KD. To aid this intention, four hypotheses will be tested, chosen to investigate where across the breadth of prototyping activities KDs may provide insight. These frame the study of knowledge generation through dimensions in three ways: i) that of determining the knowledge profiles generated by designers within a set design context; ii) that of studying relationships between prototype media and characteristics of application and knowledge generated and iii) that of studying relationships between process characteristics and knowledge generated.
This article will investigate the relationships between prototyping media and methods, project stages and KDs through comparison of eight different teams completing a 16-week design project with identical brief. Through this, it will explore similarity in appearance of KDs, relationships between KDs and media and process stages, and potential value both of different prototyping activities, and of KDs as a research tool to understand design. To explore similarities in appearances of KDs, the knowledge profiles of different teams will be examined. A knowledge profile is the prevalence of knowledge generated through the duration of a project categorised against each of the different KDs.
Given a consistent design task with similar designer experience, design process and availability of prototyping methods, it may be expected that the knowledge generated will also show consistency. This would indicate that knowledge generated is not random or individualistic, and instead closely related to the design scenario meaning that knowledge profiles would be dependent upon the design task, team composition and prototyping methods used during a project. This leads to H1, exploring what knowledge is generated for each KD, and consistency in knowledge profiles across teams for the same design brief:
H1: Teams of similar compositions undertaking the same design task over the same period of time will generate similar knowledge profiles in the process.
Next, this work explores the relationships between prototyping and generation of knowledge. This intends to investigate whether there is indeed a determinance on knowledge generation derived from the prototyping method used. While many specific properties could be investigated, this work focuses on the fundamental distinction between prototypes in the physical domain (i.e., made of atoms) and the digital domain (i.e., made of bits), and the specific distinction between prototypes of varying representative fidelity (i.e., the degree to which they present a realistic representation of the complete design solution (see McCurdy et al. Reference McCurdy, Connors, Pyrzak, Kanefsky and Vera2006; Camburn et al. Reference Camburn, Viswanathan, Linsey, Anderson, Jensen, Crawford, Otto and Wood2017). H2 and H3 are therefore as follows:
H2: Different prototyping domains are suited to generating knowledge in specific dimensions.
H3: High-, medium- and low-fidelity prototypes will generate knowledge in different dimensions.
Finally, this work investigates the relationship between knowledge generation and process stage via prototypes. With a general shift in such characteristics as prototyping purpose (Camburn et al. Reference Camburn, Viswanathan, Linsey, Anderson, Jensen, Crawford, Otto and Wood2017; Menold et al. Reference Menold, Jablokow and Simpson2017), fidelity (Ulrich Reference Ulrich2003), type (Houde & Hill Reference Houde and Hill1997) and more as the design process progresses from idea to solution, it may be expected that the form of knowledge generated also evolves. Hence, H4 investigates whether a change in knowledge generation itself may be detected as the design process progresses, stating:
H4: Contributions towards different knowledge dimensions will be made across different phases of the project.
Through these four hypotheses, this work continues to investigate the generation of knowledge within prototyping, and its relationship to prototyping media, characteristics of implementation and process stage.
3. Methodology
This section will present the methodology with attention to the study setup, data capture, coding and analysis processes. An overview of the methodology followed to test these hypotheses is shown in Figure 1. It will be elaborated upon in the following sections.
Process diagram for methodology followed in this article.

3.1. Study setup: team and task structure
Design teams comprised of students completing Proyecto Intermedio (Intermediate Project – Uniandes unit code IMEC2700) – a project-based learning course on design prototyping at the Universidad de los Andes (Uniandes), Colombia. The course follows a conceive, design, implement and operate (CDIO) scheme and ran from late January to June 2021. Students were required to complete the unit as a credit-bearing part of their course. The course is the second design project in the Mechanical Engineering syllabus at Uniandes and is expected to prepare students for their graduate theses in the final semesters of the course. Students can be considered to be novice designers with some prior design experience acquired from the previous taught design course.
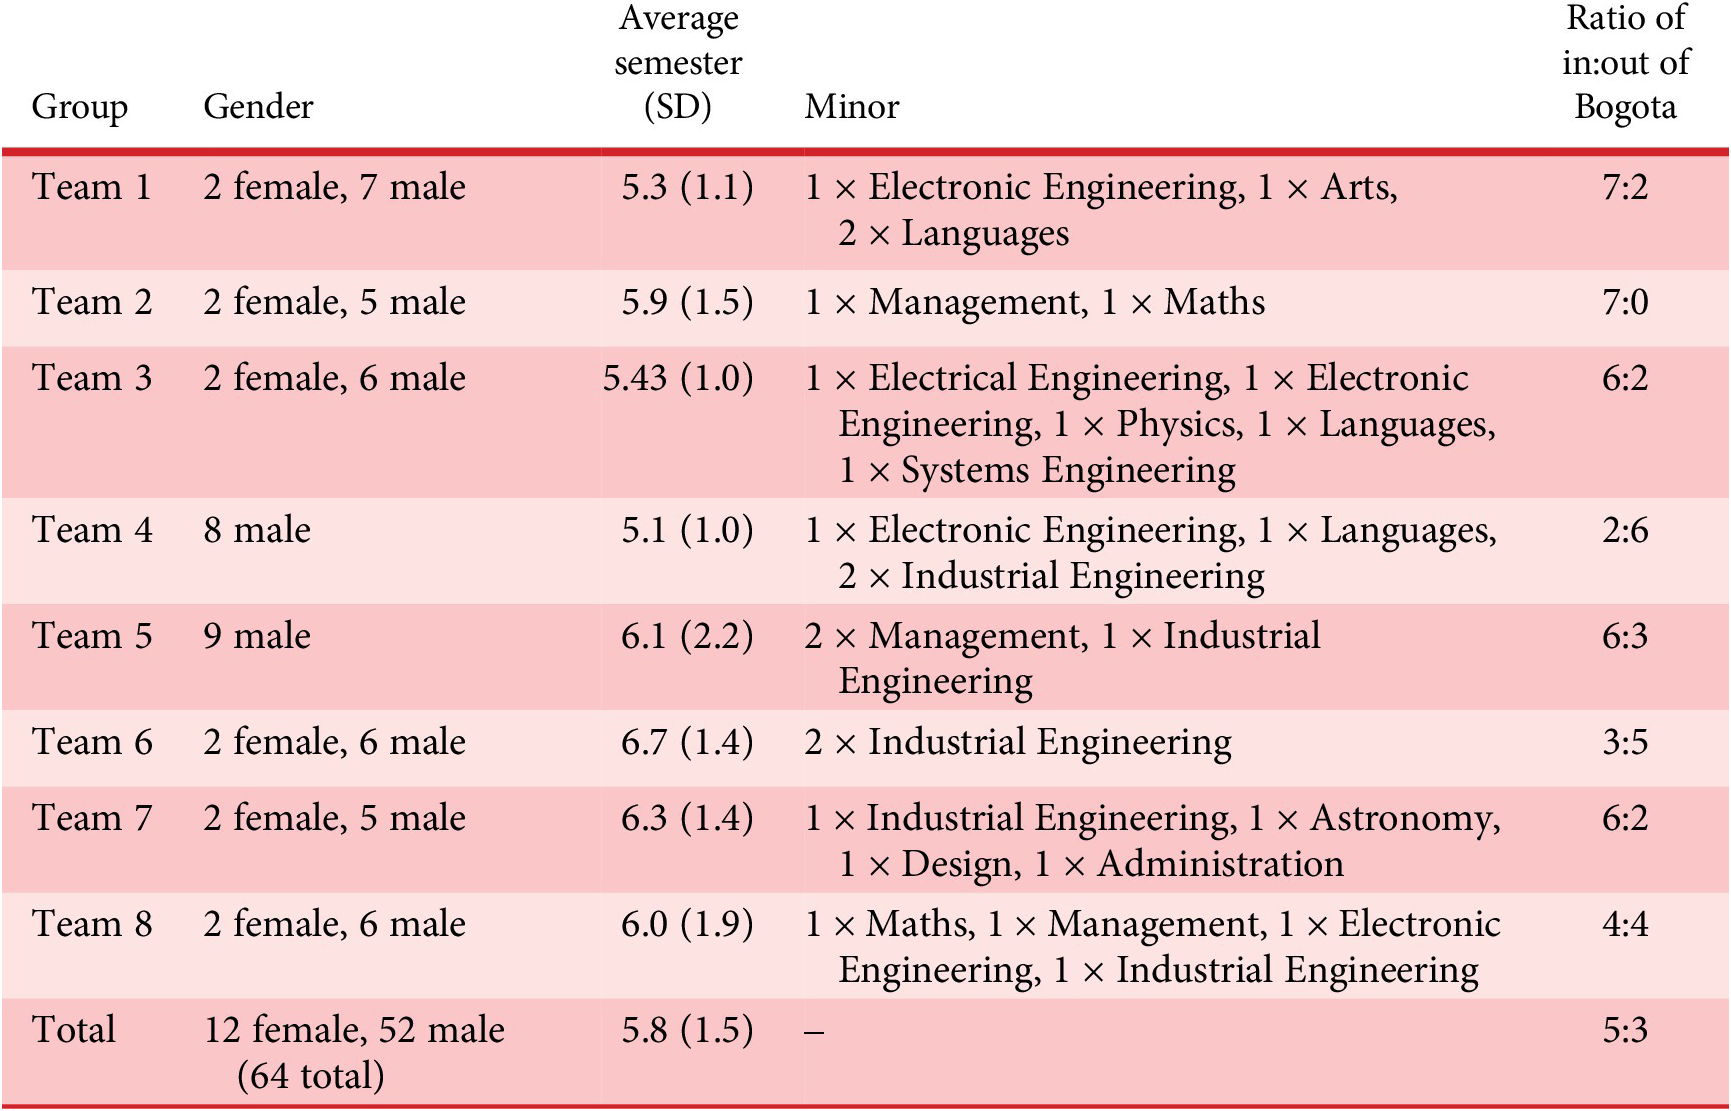
Group demographics are presented in Table 2. Groups initially had eight or nine students, with a single seven-member team are due to students dropping the unit part way through the course. All students were majoring in Mechanical Engineering and if students were also pursuing a minor degree, this was recorded in the minor column. The average experience across all groups was 5.77 semesters. All groups with the exception of groups three and six have means within one semester of this global average. These outlying teams are due to single participants being in semesters 18 and 19, respectively, which can be due to a change in major, study breaks and/or part time study. Group composition was determined in accordance with Uniandes practice and sought to enable equal groups but without marginalising under-represented groups. For this reason, six groups had two female students, and two had none. Uniandes is based in Bogotá, and due to pandemic conditions during the study, some students were working from their home cities and towns. This ratio of students in versus out of Bogotá is also presented in Table 2. Due to consistency of major across participants, similarities in experience in terms of completed semesters of undergraduate study and that all students met requisite requirements to partake in the course, teams are considered comparable for this study however, any potential impacts of team composition will be considered in Section 5.
Team demographics
While differing significantly in experience, the design activities undertaken by novice designers have been observed to generally encompass those of design practitioners (Cash, Hicks & Culley Reference Cash, Hicks and Culley2013). The population selected for this study is therefore considered to be appropriate for testing the hypotheses of the study set out in the previous section.
Ethics procedures were followed in accordance with those from Uniandes. All students gave informed consent to participate in the study. Whilst undertaking of the course was mandatory, participation in the study was optional and students were given the option to opt out of the study and continue as normal with the course. All students on the course chose to take part in the study.
The design task asked the students to design, prototype, and test a system to safely transport vaccines to isolated locations while maintaining cold temperatures and hence vaccine viability. The environment given was that of Colombia, comprising a mix of mountainous, rainforest, and otherwise isolated locations requiring a range of airborne, waterborne, or manually carried transportation.
The task comprised four stage gates: 1) concept design (CD); 2) design selection (DS); 3) system-level design (SD) and 4) detail design (DD). Each stage gate occurred over a 4-week period. At the end of the DS stage, gate teams were expected to generate a low/mid fidelity digital prototype. At the end of SD stage, gate students undertook a performance test of a design representation of their choice. By the end of the project after the DD stage gate, students were expected to design, make and evaluate a physical prototype. To meet the goals, set out for each stage students were expected to prototype their designs according to their own preference of methods. The project structure is shown in Table 3. As part of course formalities, students presented their progress and outputs at three stage gates and in final presentations for feedback, although these reviews did not form part of the analysed dataset.
Design project structure

As all groups possessed similar experience and process knowledge, followed the same framework, and performed the same design task, this study does not claim that specific results are fully generalisable and care must be taken when applying these findings to alternative design scenarios or team structures. Rather, it intends to demonstrate and evaluate the capability of the approach to generate research-level knowledge that provides insight into design through study of the relationships between prototyping domains and KDs in a specific, comprehensive case, with sufficient internal repetition to allow within-task comparison between design teams and hence establish consistency.
3.2. Data capture: design logs
As part of the course, students were encouraged to complete design logs charting their progress and documenting prototypes made during the project. Completion of the log was not mandatory and did not have weight on course outcome. Students were encouraged to use them in order to keep track of their prototypes and design process, facilitate both intra-team and external communication and to encourage on-going documentation for stage-gate and/or final presentations. The outputs of these formed the primary dataset for analysis.
The design logs comprised a spreadsheet completed by each team with one row per prototype, asking students to input a range of information describing their prototyping activity, its method, purpose and learning. Information requested in the design log is detailed in Table 4. The information captured in the design log was based upon the information included for different prototype capture tools (Nelson, Berlin & Menold Reference Nelson, Berlin and Menold2019; Erichsen et al. Reference Erichsen, Sjöman, Steinert and Welo2020) as well as additional information required to address the study’s research questions.
Information requested in the design log

Format for the design logs was iterated through a previous design project where they were first applied, following which students discussed categories and utility with researchers. This involved ensuring that meaning of categories were well understood by students and that the design logs were able to support and improve students’ design processes rather than making them more difficult.
Prior to completing the design logs, the participants were briefed on the meaning and intention of each data category, with opportunity for questions. At each stage gate, the design logs were reviewed by the course director to ensure data entry was in line with intention. Between stage gates, design logs were observed by a course monitor who had direct insight into team progress and behaviour. This course monitor was able to input on how the ‘as-done’ design work was reflected in the design logs. An example of a design log entry is given in Figure 2.
Extract of a team’s design log.

Prototype method was selected from a list produced and utilised in previous work (Real et al. Reference Real, Snider, Goudswaard and Hicks2021) that was abridged for the purpose of this study (see Table 5). Prototype domain was selected from physical (made of atoms), digital (made of 0s and 1s) and sketch. Sketches, including all pen-/pencil- and paper-based representations, were considered as their own category as physical and digital sketches have been shown to be analogous (Ranscombe & Bissett-Johnson Reference Ranscombe and Bissett-Johnson2017). Prototype fidelity (the level of visual representation of the design; McCurdy et al. Reference McCurdy, Connors, Pyrzak, Kanefsky and Vera2006; Pei et al. Reference Pei, Campbell and Evans2011) was rated on a three-point Likert scale labelled as low, medium and high. All other entries were free text. To ensure understanding of the above terms, students were provided with a video resource made by the research team that defined each category the students needed to assign their prototypes into. Students also had the opportunity to ask questions to the study team in the event that terms were not fully understood.
Prototyping methods and their associated domain

Design logs were captured from each of the 8 teams, with between 4 and 22 prototypes listed by each (median 11). Design logs were completed by each team member on creation of a prototype and thus served as a boundary object between team members for communication of design status. Teams were able to amend their prototype entries to align the ‘as-documented’ to ‘as-done’ work from the project making the design log a living document.
3.3. Data coding
Entries were collated for all teams and coded for appearance of KDs by the three raters. These were two lecturers in Design and Manufacture and one PhD candidate with 13, 17 and 11 years’ design experience, respectively. The KDs considered were the same as those presented in Section 2.3 that are consolidated from previous work (Real et al. Reference Real, Snider, Goudswaard and Hicks2021, Reference Real, Snider, Goudswaard and Hicks2023) and shown in Table 1.
Appearance of KDs was not considered to be mutually exclusive, that is, a prototype may contribute to multiple KDs. Each entry was coded for each KD as ‘2’ (substantial contribution to the KD), ‘1’ (some appearance of the KD), or ‘0’ (no appearance of the KD). An example of coded data is shown in Figure 3.
Example of design log coding. Empty cells indicate a 0 – no appearance of this KD.

To ensure validity and consistency in coding, all data were coded according to a three part inter-coder reliability process (see Klenke Reference Klenke2008; Blessing and Chakrabarti 2009; Krippendorff Reference Krippendorff2018). Before rating, each rater was familiarised with the KDs, study process and coding process to build shared understanding. Following coding best practice (Krippendorff Reference Krippendorff2018), during this process, the definitions for each KD were discussed to ensure consistency between raters and alignment between KD definitions and their intention.
-
• (1): Each rater was presented with the same log comprising 13 entries, and coded it in isolation. Rating was assessed for Fleiss’ kappa (Fleiss Reference Fleiss1971) and showed moderate agreement ( $ \kappa $
= 0.557, p
$ < $
0.0005). Following, each conflict was discussed by all raters until agreement was reached. Conflicts were defined either as disagreement in presence of a KD (a score of ‘0’ vs ‘1’ or ‘2’) and in scale of contribution (a score of ‘1’ vs ‘2’).
$ \kappa $
= 0.557, p
$ < $
0.0005). Following, each conflict was discussed by all raters until agreement was reached. Conflicts were defined either as disagreement in presence of a KD (a score of ‘0’ vs ‘1’ or ‘2’) and in scale of contribution (a score of ‘1’ vs ‘2’). -
• (2): Each rater was assigned two-thirds of the total dataset, ensuring that every log was coded by two raters. Each coded their sample in its entirety, in isolation.
-
• (3): All double-coded samples were compared in a single sitting attended by all raters. During this meeting, the duplicated samples were compared to identify conflicts and discussed by all raters, with the rater who did not initially code each set acting as adjudicator. In this process, every code was assessed for the entire dataset, thereby reaching three-way consensus between raters on all data points.


This process produced a single agreed set of coded data for all design logs to then be processed in subsequent analysis.
3.4. Analysis
Coded data were compared via means of a range of statistical tests. To compare variance between groups one-way ANOVA was used in all cases as underlying data were found to meet assumptions of normality. One-way ANOVA is a parametric test and as such has greater statistical power than non-parametric alternatives such as the Kruskal–Wallis test. To augment these comparisons, Tukey multiple comparison tests were carried out to identify between which groups statistical differences could be observed. Where this was used, correction for multiple comparison was made by using statistical hypothesis testing. Descriptive statistics, one-way ANOVA, Tukey multiple comparison tests and normality tests were all carried out using Graphpad Prism 9 software.
Chi-squared tests were carried out to determine statistical differences in count data considering the occurrences of KDs. These were carried out using Social Science Statistics (Stangroom Reference Stangroom2022) with P and chi-square values corroborated with Graphpad Prism 9.
Further information about the applications of each statistical tests including how assumptions were met are outlined along with each result.
4. Results
Results are first presented as an overview, and then grouped according to comparisons of teams, domains, fidelities and stage gates in alignment with the paper’s hypotheses.
4.1. Data overview
Table 6 presents results from the study. It provides overall data for all prototypes and also breaks this down across domains (physical, digital and sketch), teams (1–8), prototype fidelity (high, medium and low) and stage gate (CD, DS, SD and DD). Figure 4 presents examples of physical, digital and sketch prototypes from the dataset. No prototypes were present in the dataset that contributed to KDs 8–10 and they will therefore be omitted for the remainder of the analysis. Potential causes for this are the nature of the design task and a number of constraints on the project. This will be discussed further in Section 5.
Results table

Note: Instances correspond to the number of prototypes in each category. The value associated with each KD correspond to the aggregate knowledge points for all prototypes in each category. Normalised knowledge corresponds to the total knowledge points for a category divided by prototype instances.
Sample prototypes from dataset. (a) Sample digital prototype. (b) Sample physical prototype. (c) Sample sketch prototype.

Figure 5 presents a high-level overview of how prototypes in each domain contribute to each KD at different phases of the project. It can be seen that sketches are most present in the CD stage gate. Physical prototypes are more apparent at later phases of the project – SD and DD. KD1 (programme use), KD4 (design elements) and KD5 (form) have clear peaks in CD, feature physical, digital and sketch prototypes and exponentially decrease as the projects progress.
Graph showing contributions of each prototyping domain for all teams’ prototypes combined. Initialisms are defined as follows: CD, concept design; DD, detail design; DS, design selection; SD, system design.

KD3 (resources) peaks in DS and features prototypes from all domains. KD2 (environment) has a joint peak in CD and DS and features mostly digital prototypes with physical prototypes appearing in DD. KD6 (manufacturing process) has a joint peak in DS and SD featuring digital in all stages and physical prototypes in SD and DD. KD7 (configuration) fluctuates throughout the project phases and features physical and digital prototypes.
From Figure 5, the relatively high quantity of digital prototypes in the dataset can be observed. The underlying cause of this, and its implications will be discussed in Section 5.
4.2. Comparisons
The data are used to make comparisons across teams, prototyping domains, prototyping fidelities and stage gates in alignment with the study’s hypotheses.
4.2.1. Across teams
Identification of similarities across teams undertaking the design task was carried out to test H1. Knowledge profiles represent the prevalence of knowledge generated through the duration of a project, categorised against each of the KDs. To determine similarities in profiles, differences in each KD across all teams are subject to statistical tests. Similarities in knowledge profiles are determined by exploring if statistical differences between teams’ knowledge profiles exist and if, when the data are grouped by teams, differences in individual dimensions can be observed due to the design activity undertaken. Knowledge profiles for each team are shown in Table 6.
Similarities between knowledge profiles in different teams were determined via two statistical tests; a one-way ANOVA and Tukey multiple comparisons. The data were found to be normally distributed via means of a Kolmogorov–Smirnov test.Footnote
1 Knowledge profiles from each team were then compared via means of a one-way ANOVA. This revealed that there was no statistically significant difference between knowledge profiles between at least two groups (F(3.046, 18.28) = 2.691, p $ = $
0.0758). As the results were close to the 0.05 threshold for significance, further analysis was carried out in the form of Tukey’s test for multiple comparisons which facilitated comparison of the knowledge profiles for each of the teams. These tests yielded no statistical differences. Results of both of these tests therefore indicate that there are no differences between teams’ knowledge profiles.
$ = $
0.0758). As the results were close to the 0.05 threshold for significance, further analysis was carried out in the form of Tukey’s test for multiple comparisons which facilitated comparison of the knowledge profiles for each of the teams. These tests yielded no statistical differences. Results of both of these tests therefore indicate that there are no differences between teams’ knowledge profiles.
To further explore similarities in knowledge profiles, these were grouped by teams in order to explore how the design activity impacted knowledge contributions to different dimensions. The data were found to be normally distributed by means of a D’Agostino and Pearson test. Figure 6a presents this data graphically from which amounts of knowledge generated per domain can be seen to vary in spread and quantity across each KD. To identify differences in this total knowledge generated in different KDs, and therefore, identify if knowledge variation is attributed to the design activity and remains consistent across teams, a one-way ANOVA was performed. This revealed that there was a statistically significant difference in knowledge generated between at least two groups (F(3.046, 21.33) = 22.17, p $ < $
0.0001). Tukey’s test for multiple comparisons found that the mean knowledge generated was significantly different between the following groups:
$ < $
0.0001). Tukey’s test for multiple comparisons found that the mean knowledge generated was significantly different between the following groups:
-
• KD1 (programme use) and KD2 (environment) (p = 0.005, 95% CI = [3.45, 16.05]);
-
• KD1 and KD3 (resources) (p = 0.023, 95% CI = [1.42, 17.83]);
-
• KD1 and KD4 (design elements) (p = 0.001, 95% CI = [7.38, 22.12]);
-
• KD1 and KD6 (manufacturing processes) (p = 0.004, 95% CI = [4.69, 20.81]);
-
• KD1 and KD7 (configuration) (p = 0.001, 95% CI = [7.52, 21.73]);
-
• KD2 and KD7 (p = 0.037, 95% CI = [0.29, 9.46]);
-
• KD3 and KD4 (p = 0.035, 95% CI = [0.36, 9.89]);
-
• KD3 and KD7 (p = 0.003, 95% CI = [2.00, 7.80]);
-
• KD4 and KD5 (p = 0.02, 95% CI = [−16.49, −1.51]) and
-
• KD5 and KD7 (p = 0.018, 95% CI = [1.634, 16.12]).
Comparisons of Knowledge Dimensions against team, domain, fidelity and stage gate. Values are taken from Table 6 and normalised to yield a percentage to enable comparison across different prototype population sizes. (a) KDs across knowledge dimensions. Plot shows mean and standard deviation for all teams. (b) KDs across domains – percentage contribution of domains to each knowledge dimension. (c) KDs across prototype fidelity – percentage contribution of prototypes at each fidelity to each KD. KDs marked * denote that differences were identified in chi-squared tests. (d) KDs across stage gates – percentage contribution to each KD during each stage gate. KDs marked * denote that differences were identified in chi-squared tests.

The tests in this section have shown that knowledge profiles of different teams do not show statistical differences and that when performing the same design activity, teams grouped together generate statistically different amounts of knowledge for different dimensions.
4.2.2. Across prototyping domains
Table 6 contains the raw data for total prototype instances with total knowledge per KD in each domain. It is noteworthy that there were far more instances of digital prototypes (72) than physical or sketch prototypes (13 and 13, respectively). The reason for this will be commented in Section 5. Results for graphs and comparisons are presented in Table 6.
Comparison of prototypes in different domains is carried out to test H2. Figure 6b displays the proportion of knowledge in each dimension that is contributed by each domain. It can be seen that physical and digital prototypes contribute to all KDs, with sketching contributing only to KD1 (programme use), KD4 (design elements), KD5 (form) and KD3 (resources). Figure 7a shows the same information but with the axes reversed to indicate the proportion of knowledge in each domain contributed to each KD.
Comparisons of knowledge dimensions domain, fidelity and stage gate. Values are taken from Table 6 and normalised to yield a percentage to enable comparison across different population sizes. (a) KDs across domains – percentage contribution of prototypes in each domain. (b) KDs across fidelities – percentage contribution of prototypes in each domain. KDs marked * denote that differences were identified in chi-squared tests. (c) KDs across stage gates – percentage contribution of prototypes in each domain. KDs marked * denote that differences were identified in chi-squared tests.

Chi-squared tests could not be carried out on the impact of domain on knowledge generation as the data failed to meet an underpinning assumption of fewer than 20% of the data containing values of less than 5 (McHugh Reference McHugh2013).
4.2.3. Across prototype fidelities
To explore H3, Figure 6c displays the proportion of knowledge in each dimension that is contributed by each prototyping fidelity. Figure 7b displays the same information but with the axes reversed. They demonstrate that high-, medium- and low-fidelity prototypes all contribute KDs 1–7 but in differing amounts. Results for graphs and comparisons are presented in Table 6.
A chi-square test of independence was performed to examine the relation between prototype fidelity and KD that they contribute to. To meet the assumptions required for the chi-squared test (no cells having values of zero, and 80% above five), KDs 4 and 7 were omitted from the test. The relation between these variables was significant, $ \chi $
2(1, N = 246) = 34.84, p = 0.000029. Chi-squared table is presented in Table 7 indicating values that are higher or lower than would be expected if the contribution to KDs were to be randomly distributed. High-fidelity prototypes are shown to contribute less than expected to KD1 (programme use – 9 actual and 13 expected) and KD5 (form – 3 actual and 9 expected) and more than expected to KD2 (environment) and KD6 (manufacturing processes – 8 actual and 3.5 expected). Medium-fidelity prototypes contribute more than expected to KD2 (environment – 23 actual and 15.9 expected) and less than expected to KD5 (form – 17 actual and 25.3 expected). Low-fidelity prototypes contributed less than expected to KD2 (environment – 7 actual and 17.7 expected) and KD6 (manufacturing processes – 4 actual and 9.8 expected) and more than expected to KD5 (form – 37 actual and 25.3 expected). KDs where differences are observed due to prototyping fidelity are highlighted with an asterisk in Figures 6c, 7b.
$ \chi $
2(1, N = 246) = 34.84, p = 0.000029. Chi-squared table is presented in Table 7 indicating values that are higher or lower than would be expected if the contribution to KDs were to be randomly distributed. High-fidelity prototypes are shown to contribute less than expected to KD1 (programme use – 9 actual and 13 expected) and KD5 (form – 3 actual and 9 expected) and more than expected to KD2 (environment) and KD6 (manufacturing processes – 8 actual and 3.5 expected). Medium-fidelity prototypes contribute more than expected to KD2 (environment – 23 actual and 15.9 expected) and less than expected to KD5 (form – 17 actual and 25.3 expected). Low-fidelity prototypes contributed less than expected to KD2 (environment – 7 actual and 17.7 expected) and KD6 (manufacturing processes – 4 actual and 9.8 expected) and more than expected to KD5 (form – 37 actual and 25.3 expected). KDs where differences are observed due to prototyping fidelity are highlighted with an asterisk in Figures 6c, 7b.
Chi-squared results table – value out of parentheses corresponds to observed value, value in () corresponds to expected value, value in [] corresponds to test statistic for which value over one indicates a statistical difference
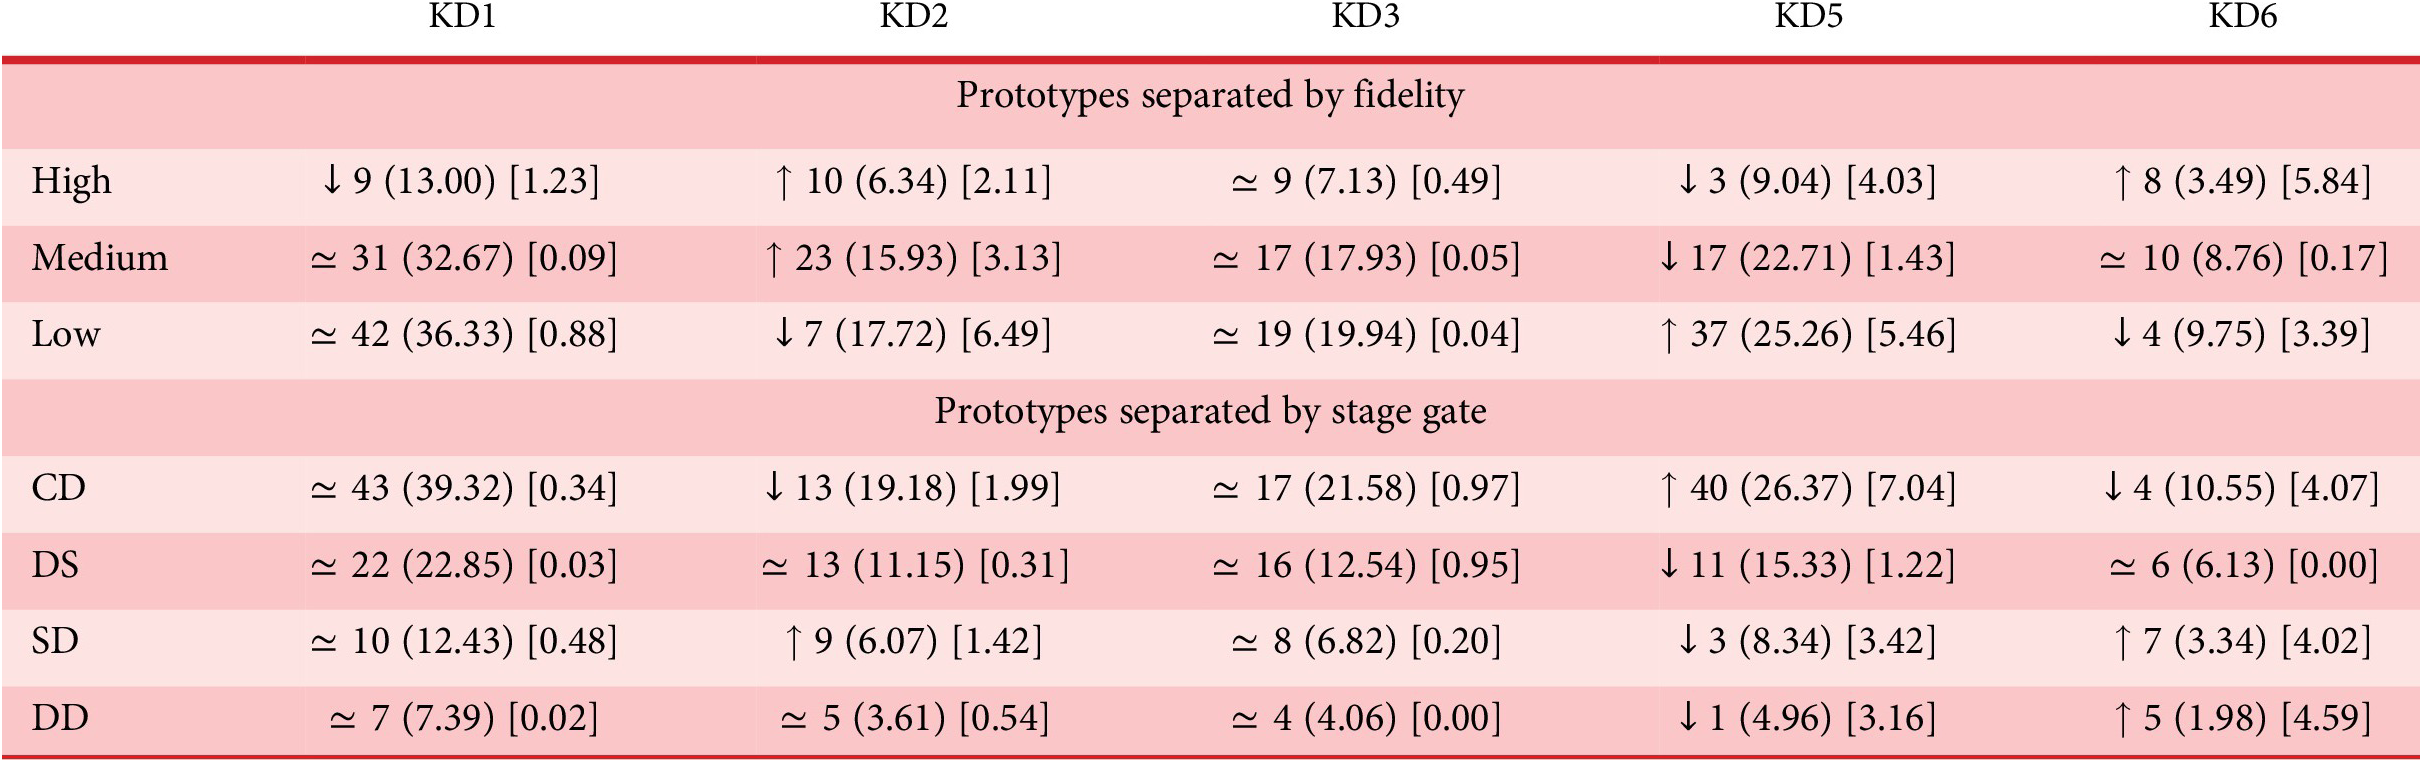
Note: Tests were carried out separately for fidelity and stage gate.
4.2.4. Across project stage gates
To explore H4, Figure 6d displays the proportion of knowledge in each dimension that is contributed by prototypes in each stage gate. Figure 7c displays the same information but with the axes reversed. They indicate that knowledge is generated against all KDs at any phase of a project, but in differing amounts. Results for graphs and comparisons are presented in Table 6.
A chi-square test of independence was performed to examine the relation between prototyping stage gate and KDs that they contribute to. To meet the assumptions required for the chi-squared test KDs 4 and 7 were omitted from the test. The relation between these variables was significant, $ \chi $
2 (1, N = 244) = 34.78, p = 0.000507. Chi-squared table is presented in Table 7 indicating values that are higher or lower than would be expected if the contribution to KDs were to be randomly distributed. In the CD phase, more prototypes contributed knowledge to KD5 (form – 40 actual and 26 expected) and less than expected to KD2 (environment – 13 actual and 19.2 expected) and KD6 (manufacturing processes – 4 actual and 10.6 expected). In the DS phase, fewer than expected prototypes contributed to KD5 (form – 11 actual and 15.3 expected). In the system design phase more prototypes contributed to KD2 (environment – 9 actual and 6.1 expected) and KD6 (manufacturing processes – 7 actual and 3.3 expected) than expected and fewer to KD5 (form – 3 actual and 8.34 expected). In the DD phase, fewer than expected prototypes contributed to KD5 (form – 1 actual and 5.0 expected) and more than expected to KD6 (manufacturing processes – 5 actual and 2.0 expected).
$ \chi $
2 (1, N = 244) = 34.78, p = 0.000507. Chi-squared table is presented in Table 7 indicating values that are higher or lower than would be expected if the contribution to KDs were to be randomly distributed. In the CD phase, more prototypes contributed knowledge to KD5 (form – 40 actual and 26 expected) and less than expected to KD2 (environment – 13 actual and 19.2 expected) and KD6 (manufacturing processes – 4 actual and 10.6 expected). In the DS phase, fewer than expected prototypes contributed to KD5 (form – 11 actual and 15.3 expected). In the system design phase more prototypes contributed to KD2 (environment – 9 actual and 6.1 expected) and KD6 (manufacturing processes – 7 actual and 3.3 expected) than expected and fewer to KD5 (form – 3 actual and 8.34 expected). In the DD phase, fewer than expected prototypes contributed to KD5 (form – 1 actual and 5.0 expected) and more than expected to KD6 (manufacturing processes – 5 actual and 2.0 expected).
5. Discussion
This discussion section will consider whether the results can support the study’s hypotheses, the utility of KDs in design, limitations and further work.
5.1. Hypotheses
The results presented in the previous section will be considered with respect to how they support the hypotheses posed earlier in the article.
H1: Teams undertaking the same design task over the same period of time will generate similar knowledge profiles in the process.
Section 4.2.1 presented the knowledge profiles generated by each team during the design task. Comparisons of knowledge profiles between teams via means of one-way ANOVA and Tukey multiple comparisons did not show statistical differences. With teams grouped together, consistent differences were shown for knowledge generated for different dimensions as demonstrated via means of statistical tests of one-way ANOVA and Tukey multiple comparisons. These results presented therefore support H1. The knowledge generated during the project is shown to be related to task and its required output as it is shown to demonstrate consistencies across teams. This finding is based upon multiple teams undertaking a single design task and for this reason, to explore its generalisability, it would be necessary to repeat the study with different design tasks. This will be considered in the further work section. The results of this study therefore suggest that knowledge profiles and therefore KDs are indicative of design scenario, team composition and availability of prototyping resources.
H2: Different prototyping domains are suited to generating knowledge in specific dimensions.
Physical and digital domains have been shown to hold varying affordances for prototyping activity (Kent et al. Reference Kent, Snider, Gopsill and Hicks2021), such as the increased accessibility of physical, and the increased flexibility and analytic power of digital. As such, it may be expected that prototyping in each domain may lead to varying knowledge generation. Section 4.2.2 presented the types of knowledge generated by different domains of prototype. Physical and digital prototypes were shown to provide knowledge for all dimensions, whereas sketch prototypes only contributed to dimensions of KD1 (programme use), KD3 (resources), KD4 (design elements) and KD5 (form). While some differences in knowledge generated per dimension according to prototype domain, statistical tests could not be carried out to verify this due to the low occurrences of physical prototypes. The results of this study are therefore unable to confirm H2. Section 5.3 will discuss this limitation regarding the quantity of physical prototypes in the dataset, its causes and potential remedies for further work.
H3: High, medium and low fidelities of prototypes will generate knowledge in different dimensions.
Section 4.2.3 compared the types of knowledge generated by different fidelities of prototypes. Encompassing degree of realism against the final product (McCurdy et al. Reference McCurdy, Connors, Pyrzak, Kanefsky and Vera2006), it may be expected that varying prototyping fidelity will enable different generation of different KDs, ranging from ideative and conceptual at earlier stages (Camburn et al. Reference Camburn, Viswanathan, Linsey, Anderson, Jensen, Crawford, Otto and Wood2017) to specific to (i.e.) production and detail design later in the design process. Via means of a chi-square test, the data showed that prototypes of different fidelities were used to generate knowledge in different dimensions thus supporting H3. This is as one would expect, as a certain cadence of knowledge generation is required as it is not possible to learn everything all at once (or at the very least is not efficient). Benefit could therefore exist in defining how this knowledge cadence should occur, which would serve as a guideline or blueprint for prototyping knowledge generation. This could be of great use to novice designers who are often lacking in strategy when prototyping (Petrakis et al. Reference Petrakis, Wodehouse and Hird2021a). Moreover, it can be seen that for some KDs that the majority of total knowledge generated is through low-fidelity prototypes demonstrating the importance of quick and dirty prototypes typical of the fuzzy front end of the development process.
H4: Different knowledge will be generated across different phases of the project.
As a general shift exists in characteristics such as prototyping purpose (Camburn et al. Reference Camburn, Viswanathan, Linsey, Anderson, Jensen, Crawford, Otto and Wood2017; Menold et al. Reference Menold, Jablokow and Simpson2017) and type (Houde & Hill Reference Houde and Hill1997; Ulrich & Eppinger Reference Ulrich and Eppinger2016) as the design process continues, it may be expected that the knowledge generated across process stages may also vary. Section 4.2.4 compared the types of knowledge generated by prototypes during different stages of the project. Via means of a chi-square test, the data showed that in different stages of a design project, knowledge in different dimensions is generated thus supporting H4. This is as would be expected and is linked to the supporting evidence presented for H3 where knowledge generation in design is required to follow a certain cadence. Like with the different fidelities of prototypes, recommendations for the types of knowledge that need to be generated in different phases can be used to help guide novice designers in selecting the most appropriate prototype given the project stage.
It can be asserted that experienced designers might support the thesis of this article, that is, that prototyping is a knowledge generating activity. Whilst this may be the case, there are no published examples of how prototyping activities (what, when and how) influence the knowledge that is then generated. In contrast, the presented study demonstrates a quantification of KDs and a number of relationships between KDs and prototyping activity, namely:
-
• From H1: knowledge profiles and therefore KDs are indicative of design scenario, team composition and availability of prototyping resources;
-
• From H3: prototyping fidelity has a statistically significant impact on contributions to each KD with contributions to some KDs exclusively made by low-fidelity prototypes emphasising the criticality of early stage prototyping and
-
• From H4: contributions towards KDs vary according to different phases of a project.
In establishing these relationships, the application of KDs in a prototyping context enables a more granular analysis of prototyping activities and the design process. Their application and utility will be explored in the following section.
5.2. Utility of KDs and appraisal of methodology
This work has demonstrated that KDs are detectable in the prototyping of designers, that their appearance holds relationships to the media and method used, and that through classification of KDs learning about the design process may be formed. As such, it demonstrates that as a research tool, KDs could hold value for the academic community as a means to better understand the prototyping methods used by designers and their link to knowledge creation. While the population used to study prototyping contributions to KDs was that of novice designers (mechanical engineering students), Cash et al. (Reference Cash, Hicks and Culley2013) found that design activities undertaken by students encompassed the majority of practitioner activities indicating that laboratory studies can give genuine insights into design practice. Whilst conclusions from this study are therefore principally drawn around novice designers, they are likely indicative of design practice more broadly.
Because of this, and given the broad variance in prototyping media and methods as employed in industry and across design teams (Goudswaard et al. Reference Goudswaard, Gopsill, Harvey, Snider, Bell and Hicks2021a), better understanding of KD appearance also presents a opportunity for industry. With different domains aligning to different KDs (Section 4.2.2), and different process stages requiring different KDs (Section 4.2.4), there is potential to create recommendations by which designers are guided on the prototyping methods they should use to achieve their aim. With further knowledge on secondary characteristics of media and methods (i.e., cost, skill required, speed), such a system could support designers in tailoring their prototyping methods towards efficiency and effective outputs, while still ensuring that required learning is generated.
The application of KDs for both research and industrial applications requires an operationalised methodology for eliciting and analysing the appearance of KDs in prototyping datasets. An appraisal of the methodology used in this article is therefore useful for the future exploration of KDs in the context of prototyping.
Due to the explanatory insights into prototyping activity revealed by the study it can be concluded that, from a research perspective, the methodology is operationalisable. Application of the methodology did however require a significant amount of manual coding by multiple coders. This could potentially limit its use for larger datasets in a research context and application in an industrial context.
Further development of a methodology for eliciting and analysing KDs could take two avenues depending on whether it was to be applied descriptively or prescriptively. If descriptive, the value in the methodology comes in KDs being recognised and understood by the designer with them being considered in order to identify potential blindspots in their processes. The descriptive avenue may also hold potential for design research and researchers seeking to study the information and knowledge generated by designers and teams, by informing their applied research methodologies. If prescriptive, it would consider that certain knowledge profiles are preferable for a given design scenario and that prototyping activities must fulfil these. To apply this in an industrial context requires minimisation of time and resource commitment. A possible means to achieve this could be through machine learning with image recognition and natural language processing to automatically detect KDs in prototypes in real time. Achieving these kind of automatic system would require significant development in understanding of KDs and is therefore considered less practical until further research into KDs is undertaken.
5.3. Limitations and further work
There are a number of limitations within this work that must be considered when drawing conclusions.
First, while the design task and process followed by each group was extensive, it did not comprise the entirety of the product development process. Here, a trade-off existed; generation of eight similar cases that could be compared required contrived cases which then did not have the realism or resource to proceed through from initial ideation stages into production. Capturing the whole of the design process would likely require observational studies of product development in industry. The impact of this is that KDs that may be intuitively more likely to appear at later process stages with a range of KDs (i.e., KD6 manufacturing processes and KDs 8–10 – character, explanation and lifecycle) less present in this dataset. This also highlights the limitation in task realism due to the use of design students as participants and an academic rather than industrial setting. While industry observation would increase output validity, the cost of observing a long term, 16-week design task with multiple industrial teams for comparison prohibited this option.
Second, while the KDs themselves are derived from literature and have been verified through several studies and rounds of refinement (see Real et al. Reference Real, Snider, Goudswaard and Hicks2021) they are not to be considered an exhaustive or complete list at this point in time. The ways in which knowledge and learning may be categorised are broad, and the list within this work may be extended or altered as understanding develops. Indeed, it may be valuable for different organisations or researchers to tune KD categorisation based on their own priorities, process activities, or work breakdowns. They could even be tailored to individual projects or products. On a case-by-case basis, researchers and designers may wish to consider alternative KDs in their primary set, including at either higher or lower levels of abstraction (i.e., cost, reliability, sustainability, interaction form, etc.). Further work should consider the set of viable KDs for use in research.
Third, due to constraints and restrictions during the study there were a low number of physical prototypes generated. These were largely related to Colombian coronavirus restrictions that were in placeFootnote 2 and national strikesFootnote 3 that reduced students’ ability to access university workshops for making physical prototypes or meeting to share prototypes they could have made at home. For this reason, students were perhaps much more inclined to create digital prototypes that could be easily shared virtually. This lack of physical prototypes meant that it was only possible to statistically test a subset of the hypotheses for the article and as a result it was not possible to draw conclusions as to the difference KDs that prototypes of difference domains are appropriate for. Repeating the study with another dataset with more physical prototypes is therefore considered as an area for further work.
Last, there are a number of statistical and methodological limitations that should be considered. For several KDs and media categorisations, few appearances occurred. This data sparsity led to incompatibility with the assumptions of several statistical techniques, and hence limits the robustness of conclusions. This is thought to be due to the relationships between certain media and process stages and their preferred KDs, in that the design task structure and resources aligned better with some media and KDs than others (i.e., the relatively high appearance of digital prototypes over physical and sketch prototypes, see Table 6). Results presented here are only those that can be considered statistically robust, and studies should be extended to capture further data and ensure that the appearance of all KDs is fairly considered and observed. Further, while the study of eight parallel design tasks allows detailed comparison for a single scenario, the technical experience of designers, use of a single CDIO framework, and task consistency limit generalisability of specific findings. This is also true of the bias introduced by the COVID-19-driven limitations on feasible prototyping methods. While this study demonstrates utility of KDs as a method of generating insight into design prototyping and provides initial specific directions, further study across design contexts is required to increase generalisability.
Primarily, addressing these limitations requires extension of this study to industry datasets and cases, and to larger prototyping datasets in order to further verify and validate the findings from this paper.
6. Conclusion
The aim of this article was to understand the relationship between prototypes and the KDs towards which they contribute. This was achieved through the study and comparison of the prototyping activities of eight design teams, each solving the same design brief with particular attention to the appearance of KDs and their relationship to the prototypes that facilitate their generation.
Prototypes were captured using design logs throughout a 16-week project-based learning (PBL) course with 64 students in eight teams. The dataset generated featured 98 prototypes which were categorised according to domain (physical/digital/sketch), team, fidelity and stage gate. Based upon text entries input by teams into the design logs, prototypes were coded according to which KDs the prototypes contributed.
Analysis of the data and subsequent statistical tests indicated that: i) teams were consistent with respect to the amount of knowledge generated in different dimensions; ii) prototypes of different fidelities are used to generate knowledge in different dimensions and iii) prototypes generated in different phases of the project are used to generate knowledge in different dimensions. It was not possible to draw conclusions on the impact of domain on knowledge generation due the low occurrence of physical prototypes in the dataset. This was due to restrictions on project execution brought about by coronavirus restrictions and national strikes.
The results of this study therefore meet the aim set out by demonstrating differences in knowledge generated according to different types of prototypes and similarities across teams undertaking the same task. In doing this, the article presented a first-of-a-kind investigation and characterisation of the relations between prototyping media and knowledge generated during a design project.
In doing this, the article provides twofold contributions in i) the elucidation of evidence that permits mapping of KDs to prototyping activities and ii) also the presentation of a methodology that permits the operationalisation of KDs in a product development context.
Potential applications of the research lie in supporting selection of designers’ prototyping media and methods which can often lack direction. By defining the KD in which one wishes to generate knowledge at a given phase of a project, it would be possible to suggest a prototyping method that would facilitate its generation. On a wider project scale, it could be possible to define prototyping strategies based upon a successful cadence of knowledge generation.
Acknowledgements
The work reported in this article has been undertaken as part of Engineering and Physical Sciences Research Council (EPSRC) funded projects Brokering Additive Manufacturing (BAM), ProtoTwinning, 21st Century Prototyping, and Royal Academy of Engineering funded Project Clean Access (grant references EP/V05113X/1, EP/R032696/1, EP/W024152/1 and EXPP 2021/1/318, respectively). The work was conducted at the University of Bristol in the Design and Manufacturing Futures Lab in collaboration with La Universidad de los Andes, Bogotá. Underlying data for this paper is openly available at https://doi.org/10.5281/zenodo.8322110.


 Open access