

Prostate cancer is the second leading cause of cancer-related death in men in Western countries(Reference Greenlee, Hill-Harmon and Murray1). Despite tremendous improvements in cancer treatment methods over the past few decades, 20–30 % of patients will relapse(Reference Lu, Williams and Chalasani2). Androgen ablation is a routine form of prostate cancer therapy. However, after an initial response, androgen-insensitive clones can appear, which results in cancer progression and metastasis with high mortality(Reference Sharma, Shin and Grimshaw3). Few successful curative therapies currently exist for metastatic prostate cancer. As prostate cancer is usually diagnosed in older-aged men and progresses slowly to detectable malignancy, considerable efforts have been made to identify bioactive food components to prevent and/or intervene in prostate cancer(Reference Thompson, Tangen and Klein4, Reference Shukla and Gupta5).
Bioactive food components are an excellent source of antitumoral agents, because they have low toxicity and multiple molecular targets. Maslinic acid, a natural pentacyclic triterpene acid, is widely present in edible plants, particularly in olive fruits, and exhibits potential anti-tumour activities such as induction of apoptosis in Caco2 and HT29 colon cancer cells(Reference Reyes, Centelles and Lupianez6, Reference Reyes-Zurita, Rufino-Palomares and Lupianez7) and 1321N1 astrocytoma cells in vitro (Reference Martin, Carvalho-Tavares and Ibeas8).
A variety of proteins, such as matrix-degrading proteases, adhesion molecules and motility factors, play crucial roles in tumour invasion and metastasis(Reference Bogenrieder and Herlyn9). Tumour metastasis is supported by the increased proteolytic activity of active matrix metalloproteinases (MMP) and urokinase-type plasminogen activator (uPA) secreted by tumour cells or stromal cells(Reference Bourboulia and Stetler-Stevenson10, Reference Mekkawy, Morris and Pourgholami11). MMP, particularly MMP-9 and MMP-2, are involved in the degradation of the extracellular matrix and the basement membrane(Reference Yoon, Park and Yun12). Tissue inhibitors of metalloproteinases (TIMP) are endogenous MMP inhibitors, which are also commonly expressed at tumour sites(Reference Kessenbrock, Plaks and Werb13). Both TIMP-1 and TIMP-2 inhibit MMP activity, but TIMP-1 appears to promote cancer metastasis rather than inhibit the process. Elevated TIMP-1 levels are associated with a poor prognosis in a wide variety of cancers (reviewed in Duffy et al. (Reference Duffy, McGowan and Gallagher14)). The uPA system is one of the serine proteinase systems involved in extracellular matrix degradation and plays a major role in the migration, invasion, adhesion and metastasis of cancer cells, thus making it an important target for anticancer drug therapy(Reference Mekkawy, Morris and Pourgholami11). Cellular adhesion molecules are glycoproteins expressed on the cell membrane surface. Cellular adhesion molecules are involved in cell signalling, migration, proliferation and differentiation, and function as regulators of tumour progression and metastasis (reviewed in Patriarca et al. (Reference Patriarca, Macchi and Marschner15) and van der Gun et al. (Reference van der Gun, Melchers and Ruiters16)).
Hypoxia is a key trait of tumours, and virtually all solid tumours contain hypoxic regions in which oxygen concentrations are markedly reduced compared with adjacent normal tissues. Angiogenesis is the formation of new blood vessels from pre-existing vessels and is required for tumour growth and metastasis(Reference Folkman17). The family of hypoxia-inducible factors (HIF) is a key regulator of angiogenesis in mammalian tissues in response to oxygen deficiency. HIF-1 is a heterodimeric transcriptional factor composed of α- and β-subunits. Under normoxic conditions, HIF-1α is constitutively expressed but rapidly degraded by the ubiquitin–proteasome pathway(Reference Fu, Xue and Li18). However, under hypoxic conditions, the blockade of prolyl hydroxylation, ubiquitination and degradation results in the extraordinary accumulation of HIF-1α and the subsequent translocation of the protein to the nucleus(Reference Lee and Lee19). HIF-1α is overexpressed in many human cancers, and its activity is associated with tumour growth, metastasis and angiogenesis(Reference Semenza20–Reference Maxwell, Dachs and Gleadle22). In the majority of experimental systems, HIF-1α induced the transcription of vascular endothelial growth factor (VEGF), which is one of the most ubiquitous and potent angiogenic factors and plays a critical role in tumour angiogenesis (reviewed in Rankin & Giaccia(Reference Rankin and Giaccia23) and Hicklin & Ellis(Reference Hicklin and Ellis24)). As neovascularisation is critical for tumour growth and metastasis, targeting the HIF-1α/VEGF system is a promising strategy for preventing and treating cancers. In addition to VEGF, HIF-1α can directly alter the expression of a number of pro-tumorigenic factors, including VEGF receptors, plasminogen activator inhibitor-1, uPA receptor (uPAR), E-cadherin, MMP-2 and MMP-9(Reference Rankin and Giaccia23, Reference Semenza25).
The principal objective of the present study was to examine the effects of maslinic acid on the metastatic capacity of androgen-insensitive DU145 prostate cancer cells. The present findings demonstrated that maslinic acid inhibits the migration, invasion and adhesion of DU145 cells. We also demonstrated that maslinic acid inhibits the secretion of VEGF, MMP and uPA, and the expression of uPAR and adhesion molecules. The present results suggest that maslinic acid reduced HIF-1α activity, which contributed to decreased levels of MMP, VEGF, uPAR and E-cadherin in DU145 cells.
Materials and methods
Materials
The reagents used were as follows: maslinic acid (Cayman Chemical); antibodies against uPAR, TIMP-1, TIMP-2, intercellular adhesion molecule (ICAM), vascular cell adhesion molecule (VCAM) and VEGF (Santa Cruz Biotechnology); antibodies against Akt, phospho-Akt, ERK1/2 and phospho-ERK1/2 (Cell Signaling Technology); anti-uPA antibody (Calbiochem); anti-HIF-1α, anti-E-cadherin and Matrigel™ Matrix (BD Biosciences); epidermal growth factor (EGF; R&D Systems); an adhesion assay kit (Chemicon International); transwell filters (Costar). All other materials were obtained from Sigma.
Cell culture
DU145 and TRAMP-C2 mouse prostate cancer cells were obtained from the American Type Culture Collection. Cells were maintained in Dulbecco's modified Eagle's medium (DMEM)/nutrient mixture Ham's F12 (F12) with 10 % fetal bovine serum, 62·5 mg/l (100 000 U/l) of penicillin and 100 mg/l of streptomycin (Gibco BRL) at 5 % CO2 and 37°C. To induce hypoxia, cells were placed in an automatic air-jacketed multi-gas incubator (MCO-18M; Sanyo) and flushed with a mixture of 1 % O2, 5 % CO2 and 94 % N2.
Migration, invasion and adhesion assays
Transwell migration assays were conducted, as described previously, to examine whether maslinic acid inhibits the migration of DU145 and TRAMP-C2 cells(Reference Kwon, Cho and Chung26). Briefly, cells were serum-deprived in DMEM/F12 medium supplemented with 1 % charcoal-stripped fetal bovine serum for 24 h. Cells (2·5 × 104 cells/filter) were then plated onto transwell filters in a twenty-four-well plate. The transwell filter was precoated with 10 μg type IV collagen. The lower chambers of the wells were filled with DMEM/F12 medium containing 1 % charcoal-stripped fetal bovine serum. Bovine serum albumin (0·1 %) in the absence or presence of 10 ng/ml EGF was added as a chemoattractant. Cells were incubated with 0–25 μm-maslinic acid, and the migrated cells were stained with haematoxylin and eosin. The same procedures were conducted for the invasion assay, except that a Matrigel-coated transwell filter (BD Biosciences) was used instead of the collagen-coated filter. For the adhesion assay, cells were plated in human collagen type I-coated CytoMatrix Cell Adhesion Strips (Chemicon International). The cells were incubated for 45 min in DMEM/F12 medium containing 1 % charcoal-stripped fetal bovine serum with various concentrations of maslinic acid in the absence or presence of 10 ng/ml EGF. The strips were rinsed three times with PBS containing Ca2+/Mg2+ and stained for 5 min with 0·2 % crystal violet in 10 % ethanol. The cell-bound stains were then quantified by determining the absorbance at 570 nm. Cell viability was tested as described previously(Reference Kim, Kang and Schaffer27).
Gelatin zymography
Cells were serum-starved in DMEM/F12 medium and treated with or without 10 ng/ml EGF for 18 h in the absence or presence of maslinic acid. Conditioned media were collected, and the proteins were concentrated via centrifugal ultrafiltration using a Centricon Plus-20 filter (Millipore Corporation). Proteins in the concentrated media were separated by SDS-PAGE on a 7·5 % acrylamide gel containing 1 % gelatin. The volumes of media loaded onto the gel were adjusted to equivalent protein levels. After electrophoresis, the gels were washed twice with 2·5 % Triton X-100 for 30 min to completely eliminate SDS. The gels were then rinsed twice with zymogen activation buffer (50 mm-Tris–HCl, 0·02 % Brij 35, 5 mm-CaCl2 and 0·2 mm-NaCl) and incubated for 48 h at 37°C in the same buffer. The gels were subsequently stained with 0·25 % Coomassie Brilliant Blue solution and destained. Serum-free conditioned medium from the HT-1080 human sarcoma cell line (American Type Culture Collection) was loaded on the gel as MMP-9 and MMP-2 controls.
Western blot analyses
Total cell lysates(Reference Cho, Kim and Kim28) and nuclear extract(Reference Kwon, Cho and Chung26) were prepared as described previously. The protein contents were determined using a bicinchoninic acid protein assay kit (Thermo Scientific). Proteins in the total cell lysates, nuclear extract (50 μg protein) and concentrated conditioned media (50 or 80 μg protein) were analysed by Western blotting, as described previously(Reference Park, Lim and Kim29). The relative abundance of each band was quantified using the Bio-profile Bio-1D application (Vilber-Lourmat).
Urokinase-type plasminogen activator activity
uPA activity in conditioned media was estimated using a uPA activity kit (Millipore), according to the manufacturer's instructions.
Real-time RT-PCR
Total cellular RNA was isolated with an RNeasy Plus Mini kit (Qiagen) based on the manufacturer's protocol. Complementary DNA was synthesised using 3 μg of isolated RNA and SuperScript II RT (Invitrogen), as described previously(Reference Kwon, Cho and Chung26). MMP-9, uPA, VEGF and HIF-α mRNA were quantified by RT-PCR using a Rotergene 3000 PCR apparatus (Corbett Research). Glyceraldehyde-3-phosphate dehydrogenase was used as the endogenous expression standard. Primer set sequences for real-time PCR amplification of MMP-9(Reference Kwon, Jung and Song30), uPA(Reference Kwon, Jung and Song30), VEGF(Reference Kwon, Jung and Song30), glyceraldehyde-3-phosphate dehydrogenase(Reference Kwon, Jung and Song30) and HIF-α(Reference Zhao, Wang and Hui31) were obtained from previously published work. PCR results were analysed and relative concentrations were calculated using Roter-gene software (version 6; Corbett), and the control levels (0 μg/l EGF+0 μm-maslinic acid) were set to 1.
Transfection and hypoxia-responsive element luciferase reporter assay
The cells were co-transfected with the pGL3-Basic luciferase reporter vector (Promega) or the pGL3-hypoxia-responsive element (HRE)-luciferase reporter plasmid(Reference Maxwell, Wiesener and Chang32) and the Renilla luciferase reporter vector (pRL-TK; Promega) using Nucleofector-II (Amaxa). Transfected cells were plated in twenty-four-well plates at 25 000 cells/well. After 24 h, cells were serum-deprived for 24 h and then incubated for 6 h with 0–25 μm-maslinic acid in the absence or presence of EGF. Luciferase activities were measured with the cell lysates using a dual luciferase assay system (Promega). HRE luciferase activity was normalised to Renilla luciferase activity.
Statistical analysis
Data are expressed as means with their standard errors and analysed with an ANOVA. Differences among the treatment groups were assessed by Duncan's multiple range test. Differences were considered significant at P <0·05. All statistical analyses were performed using the SAS system for Windows version 9.1 (SAS Institute).
Results
Maslinic acid inhibits the migration and invasion of DU145 and TRAMP-C2 cells
To determine whether maslinic acid inhibits cell migration and invasion in DU145 cells, we cultured cells in the absence or presence of EGF, because we have previously demonstrated that EGF stimulates the migration, invasion and adhesion of DU145 cells(Reference Kwon, Cho and Chung26). Maslinic acid markedly inhibited both the basal and EGF-induced migration of DU145 cells (Fig. 1(A)). Maslinic acid also significantly inhibited the migration of TRAMP-C2 mouse prostate cancer cells (Fig. 1(C)). The transwell invasion assay was also conducted using Matrigel-coated filters, which demonstrated that maslinic acid concentration-dependently inhibited the basal and EGF-stimulated invasion of DU145 cells (Fig. 1(B)). As cell viability was not changed when the cells were treated for 18 h with 10–25 μm-maslinic acid (data not shown), we utilised 10–25 μmol/l of maslinic acid in the experiments.
Maslinic acid inhibits the migration and invasion of DU145 and TRAMP-C2 cells. Cells were serum-deprived in Dulbecco's modified Eagle's medium (DMEM)/nutrient mixture Ham's F12 (F12) containing 1 % charcoal-stripped fetal bovine serum (FBS) for 24 h. (A, B) DU145 cells and (C) TRAM-C2 cells were plated on 6·5 mm transwell filters precoated with (A, C) type IV collagen or (B) Matrigel at 25 000 cells/well and treated with 0–25 μm-maslinic acid. The lower compartment was filled with DMEM/F12 medium supplemented with 1 % charcoal-stripped FBS and 0·1 % bovine serum albumin with or without epidermal growth factor (EGF). Cells were incubated for (A) 4, (B) 12 or (C) 1 h. (A, C) Migrating and (B) invading cells were quantified. Values are means from three independent experiments, with standard errors represented by vertical bars. a,b,c,d,eMean values with unlike letters were significantly different (P< 0·05).

Maslinic acid alters the secretion of matrix metalloproteinase, tissue inhibitors of metalloproteinases and urokinase-type plasminogen activator in DU145 cells
The gelatin zymography results revealed that EGF increased pro-MMP-9 (92 kDa) secretion, but that the maslinic acid treatment reduced pro-MMP-9 secretion in the absence and presence of EGF. Additionally, pro-MMP-2 (72 kDa) secretion increased with the EGF treatment but was reduced by maslinic acid, regardless of whether the cells were treated with EGF (Fig. 2(A)). The results from real-time RT-PCR analysis demonstrated that maslinic acid reduced MMP-9 mRNA levels, particularly in the presence of EGF (Fig. 2(B)). EGF stimulated the secretion of TIMP-1, and maslinic acid inhibited the secretion of the protein to an undetectable level in the absence or presence of EGF. TIMP-2 was not detected on the Western blot of DU145-conditioned medium either in the absence or presence of EGF. Maslinic acid dose-dependently increased TIMP-2 secretion (Fig. 2(C)). EGF increased pro- and active-uPA secretion, and maslinic acid markedly reduced the secretion of these proteins (Fig. 3(A)). uPA activity also increased with the EGF treatment but decreased with the maslinic acid treatment (Fig. 3(B)). Additionally, the levels of uPA transcripts increased with the EGF treatment but decreased with the maslinic acid treatment (Fig. 3(C)). Furthermore, the Western blot analysis of total cell lysates revealed that the uPAR protein levels were decreased significantly in cells treated with maslinic acid, regardless of whether they were treated with EGF or not. Plasminogen activator inhibitor-1 levels were not altered by either EGF or maslinic acid (Fig. 3(A)).
Effect of maslinic acid on the secretion of matrix metalloproteinase (MMP) and tissue inhibitors of metalloproteinases (TIMP) in DU145 cells. DU145 cells were plated in 100 mm dishes at 2 × 10⁶ cells/dish in Dulbecco's modified Eagle's medium (DMEM)/nutrient mixture Ham's F12 (F12) supplemented with 10 % fetal bovine serum (FBS). At 1 d later, the monolayers were serum-deprived in DMEM/F12 medium containing 1 % charcoal-stripped FBS for 24 h. Cells were incubated with 0–25 mm-maslinic acid in serum-free medium with or without epidermal growth factor (EGF) for 18 h. The 18 h conditioned media were concentrated for (A) gelatin zymography and (C) Western blotting. In the first lane of (A), serum-free HT-1080 cell-conditioned medium was loaded. The volumes of media loaded onto the gel were adjusted for equivalent protein concentrations. Photographs of chemiluminescent detection of Coomassie blue-stained (A) gels and (C) blots, which are representative of three independent experiments. The relative abundance of each band was quantified by densitometric scanning of the exposed film. The adjusted means of each band with their standard errors are shown above each blot. (B) Serum-deprived cells were incubated for 12 h with maslinic acid and/or EGF. Total RNA was isolated and reverse-transcribed, and real-time PCR was conducted. MMP-9 mRNA expression was normalised to that of glyceraldehyde-3-phosphate dehydrogenase (GAPDH). Values are means, with standard errors represented by vertical bars (n 3). a,b,c,d,eMean values with unlike letters were significantly different (P <0·05). ND, not determined; M r, molecular weight.

Maslinic acid inhibits urokinase-type plasminogen activator (uPA) activity in DU145 cells. DU145 cells were plated, serum-deprived and treated with maslinic acid as described in Fig. 2, and 18 h conditioned media were collected. (A) To determine uPA secretion and uPA receptor (uPAR) expression, volumes of media and total cell lysates, respectively, loaded onto the gel were adjusted for equivalent protein concentrations. Photographs of chemiluminescent detection of the Western blots, which are representative of three independent experiments, are shown. The relative abundance of each band was quantified by densitometric scanning of the exposed film. uPAR and plasminogen activator inhibitor 1 (PAI-1) levels were normalised to those of β-actin. The adjusted means of each band with their standard errors are shown above each blot. (B) uPA activity was with unlike letters determined using unconcentrated conditioned media. (C) Serum-deprived cells were incubated with maslinic acid and/or epidermal growth factor (EGF) for 12 h. Total RNA was isolated and reverse-transcribed, and real-time PCR was conducted. The levels of uPA mRNA were normalised to those of glyceraldehyde-3-phosphate dehydrogenase (GAPDH). Values are means, with standard errors represented by vertical bars (n 3). a,b,c,d,eMean values were significantly different (P< 0·05). ND, not determined; M r, molecular weight.

Maslinic acid inhibits DU145 cell adhesion
EGF increased DU145 cell adhesion to type I collagen, and maslinic acid inhibited basal and EGF-stimulated cell adhesion (Fig. 4(A)). The protein levels of ICAM and E-cadherin were not affected significantly by the EGF treatment, whereas they decreased following the maslinic acid treatment. However, the VCAM levels increased with the EGF treatment, but were inhibited by the maslinic acid treatment. The VCAM levels were not altered in cells treated with maslinic acid in the absence of EGF (Fig. 4(B)).
Maslinic acid inhibits adhesion of DU145 cells. (A) Serum-deprived DU145 cells were plated in CytoMatrix™ human collagen I cell adhesion strips (Chemicon International) and were incubated for 45 min in Dulbecco's modified Eagle's medium/nutrient mixture Ham's F12 containing 1 % charcoal-stripped fetal bovine serum with 0–25 μm-maslinic acid with or without epidermal growth factor (EGF). Cells were stained with 0·2 % crystal violet, and the cell-bound stains were quantified colorimetrically. Values are means, with standard errors represented by vertical bars (n 4). (B) Serum-deprived DU145 cells were treated with maslinic acid in serum-deprived media. Total cell lysates were subjected to immunoblotting with antibodies raised against intercellular adhesion molecule (ICAM), vascular cell adhesion molecule (VCAM) or E-cadherin. Photographs of chemiluminescent detection of the blots, which are representative of three independent experiments, are shown. The relative abundance of each band was estimated by densitometric scanning of the exposed films, and the expression levels were normalised to those of β-actin. The adjusted means (n 3) of each band with their standard errors are shown above each blot. a,b,c,dMean values with unlike letters were significantly different (P< 0·05). M r, molecular weight.

Maslinic acid drastically inhibits vascular endothelial growth factor secretion in DU145 cells under both normoxic and hypoxic conditions
The Western blotting results demonstrated that VEGF secretion increased as a result of the EGF treatment and that maslinic acid inhibited VEGF secretion in the absence or presence of EGF with a normal oxygen supply (Fig. 5(A)). Additionally, VEGF mRNA levels changed in parallel with VEGF protein levels (Fig. 5(B)). Hypoxia significantly increased the VEGF levels, whereas maslinic acid markedly inhibited VEGF secretion under hypoxic conditions (Fig. 5(A)).
Maslinic acid inhibits vascular endothelial growth factor (VEGF) secretion in DU145 cells. DU145 cells were plated and serum-deprived as described in Fig. 2. (A) Serum-deprived cells were treated with 0–25 μm-maslinic acid for 18 h in serum-free media with or without epidermal growth factor (EGF) under normoxic or hypoxic conditions. The 18 h conditioned media were concentrated for Western blotting. The volumes of media loaded onto the gel were adjusted for equivalent protein concentrations. Photographs of chemiluminescent detection of the blots, which are representative of three independent experiments, are shown. The relative abundance of each band was quantified by densitometric scanning of the exposed films, and the adjusted means of each band with their standard errors are shown above each blot. (B) Serum-deprived cells were treated with maslinic acid and/or EGF for 12 h. Total RNA was isolated for real-time PCR. The levels of VEGF mRNA were normalised to those of glyceraldehyde-3-phosphate dehydrogenase (GAPDH). Values are means (n 3), with standard errors represented by vertical bars. a,b,c,dMean values with unlike letters were significantly different (P <0·05). ND, not determined.

Maslinic acid reduces hypoxia-inducible factor-1α levels in DU145 cells
Because HIF-1α is a transcription factor that induces VEGF, MMP, uPAR and E-cadherin expression(Reference Rankin and Giaccia23), we determined the effect of maslinic acid on HIF-1α levels in DU145 cells under both normoxic and hypoxic conditions. The Western blot analysis of total cell lysates revealed that HIF-1α levels increased markedly under hypoxic condition. EGF increased HIF-1α expression under both normoxic and hypoxic conditions, whereas maslinic acid drastically inhibited HIF-1α expression with or without EGF under both conditions (Fig. 6(A)). Moreover, HIF-1α levels in the nucleus were substantially lower in cells treated with maslinic acid (Fig. 6(B)). The results from HRE-driven luciferase reporter gene assays revealed that EGF increased HRE luciferase activity, whereas maslinic acid reduced its activity in a concentration-dependent fashion under both the basal and EGF-induced conditions (Fig. 6(C)). We conducted real-time PCR assays to determine whether maslinic acid regulates HIF-1α levels at the mRNA level. HIF-1α mRNA levels increased with EGF but decreased with the maslinic acid treatment (Fig. 6(D)). To determine whether the maslinic acid treatment affects HIF-1α protein stability, DU145 cells were treated with or without maslinic acid in the presence of 100 μm-cycloheximide, which inhibits new cellular protein synthesis. The HIF-1α protein decayed with a half-life of 11·81 min in the absence of maslinic acid, whereas the half-life decreased to 4·96 min when cells were treated with maslinic acid (Fig. 6(E)).
Maslinic acid reduces hypoxia-inducible factor (HIF)-1α protein levels in DU145 cells. (A, B) Serum-deprived cells were incubated with 0–25 μm-maslinic acid in serum-deprived media with or without epidermal growth factor (EGF) for 6 h under normoxic or hypoxic conditions. (E) Serum-deprived cells were stimulated with EGF for 6 h and then treated with 100 μm-cycloheximide (CHX) with or without 10 μm-maslinic acid for the indicated periods. Total cell lysates (A, E) and the nuclear fractions (B) were subjected to Western blotting with an HIF-1α antibody. The relative abundance of each band was quantified by densitometric scanning of the exposed films, and the expression levels were normalised to those of β-actin. The adjusted means of each band with their standard errors are shown above each blot. (C) Cells were co-transfected with a human hypoxia-responsive element (HRE) reporter gene construct and a pRL-TK control vector. The transfected cells were plated in twenty-four-well plates at 25 000 cells/well. After serum deprivation, cells were incubated with the indicated concentrations of maslinic acid in serum-deprived media with or without EGF for 6 h. Cell lysates were prepared to measure luciferase and Renilla activities. Luciferase activity was normalised to Renilla activity. (D) Serum-deprived cells were incubated for 12 h with maslinic acid and/or EGF. Total RNA was isolated and reverse-transcribed, and real-time PCR was conducted. HIF-1α mRNA expression was normalised to that of glyceraldehyde-3-phosphate dehydrogenase (GAPDH). Values are means (n 3), with standard errors represented by vertical bars. a,b,c,dMean values with unlike letters were significantly different (P <0·05). ND, not determined; M r, molecular weight.

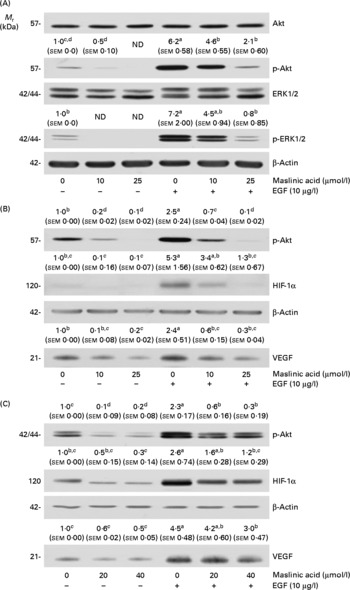
Maslinic acid inhibits Akt and extracellular signal-related kinase 1/2 phosphorylation
We next examined whether maslinic acid inhibits basal and EGF-stimulated Akt and ERK1/2 phosphorylation in DU145 cells. Treating DU145 cells with EGF for 15 min induced Akt and ERK1/2 phosphorylation, but maslinic acid significantly reduced the levels of phospho-Akt and ERK1/2 (Fig. 7(A)). To examine whether inhibiting Akt and ERK1/2 activation would reduce HIF-1α levels and VEGF secretion in DU145 cells, we treated the cells with the phosphatidylinositol 3-kinase inhibitor LY294002 or the ERK-specific inhibitor PD98509. LY294002 and PD98509 inhibited basal and EGF-induced Akt and ERK1/2 phosphorylation, respectively. These two inhibitors reduced the cellular levels of HIF-1α and the secretion of VEGF in DU145 cells (Fig. 7(B) and (C)).
Maslinic acid reduces the activation of Akt and extracellular signal-related kinase (ERK) in DU145 cells. (A) Serum-deprived cells were incubated with 0–25 μm-maslinic acid for 6 h, and cell lysates were prepared with or without a 15 min epidermal growth factor (EGF) stimulation. Serum-deprived cells were incubated with (B) 0–20 μm-LY294002 or (C) 0–40 μm-PD98059 for 6 h and lysed without stimulation or after 15 min of EGF stimulation to determine phospho (p)-Akt or p-ERK1/2 levels. To identify hypoxia-inducible factor-1α (HIF-1α), serum-deprived cells were incubated with (B) 0–20 μm-LY294002 or (C) 0–40 μm-PD98059 in the absence or presence of EGF for 6 h. Total cell lysates were subjected to Western blotting. Photographs of chemiluminescent detection of the blots, which are representative of three independent experiments, are shown. The relative abundance of each band was estimated by densitometric scanning of the exposed films, and the expression levels were normalised to those of β-actin. To determine vascular endothelial growth factor (VEGF) concentrations, serum-deprived cells were incubated with (B) 0–20 μm-LY294002 or (C) 0–40 μm-PD98059 in serum-free media with or without 10 μg/l EGF for 18 h. The 18 h conditioned media were concentrated and subjected to Western blotting with VEGF antibody. The volumes of media loaded onto the gel were adjusted for equivalent protein concentrations. Photographs of chemiluminescent detection of the blots, which are representative of three independent experiments, are shown. The relative abundance of each band was quantified by densitometric scanning of the exposed films. The adjusted means (n 3) of each band with their standard errors are shown above each blot. a,b,c,dMean values with unlike letters were significantly different (P <0·05). M r, molecular weight.
Discussion
We have shown that maslinic acid, a natural triterpenoid present in pomace olive oil, inhibited basal and EGF-induced migration, invasion and adhesion in DU145 prostate cancer cells. We also demonstrated that treating DU145 cells with maslinic acid resulted in (1) a decreased secretion of MMP-2, MMP-9, TIMP-1 and uPA and increased TIMP-2 secretion; (2) a decreased expression of E-cadherin, uPAR, ICAM and VCAM; (3) decreased uPA activity; (4) decreased VEGF secretion under both hypoxic and normoxic conditions; (5) decreased cellular HIF-1α levels under both hypoxic and normoxic conditions; (6) decreased HIF-1α transcripts, nuclear HIF-1α levels, HRE reporter activity and HIF-1α stability; and (7) a decreased activation of Akt and ERK1/2. Furthermore, we have shown that inhibiting Akt and ERK1/2 activation induced a reduction in HIF-1α levels and VEGF secretion. These results indicate that maslinic acid inhibited Akt and ERK1/2 activation, which, in turn, reduced HIF-1α activity, thereby resulting in the inhibited expression of genes involved in the stimulation of tumour angiogenesis and metastasis.
Metastasis has been described as a two-phase process: (1) physical translocation of a cancer cell to a distant organ and (2) colonisation of the translocated cells at that distant site(Reference Chaffer and Weinberg33). To begin the metastatic cascade, cancer cells within the primary tumour must break away from their neighbours, push their way through the surrounding stroma and break through the basement membrane to enter the circulation. These steps are required for several proteolytic enzymes to degrade the extracellular matrix, which includes interstitial collagens, basement membrane collagen (type IV), fibronectin, laminin and various proteoglycans(Reference Woessner34). MMP and uPA are important proteases involved in extracellular matrix degradation(Reference Bourboulia and Stetler-Stevenson10, Reference Mekkawy, Morris and Pourgholami11). Maslinic acid markedly reduced the secretion of MMP and uPA as well as uPA activity and uPAR expression, and increased TIMP-2 (Figs. 2 and 3), which probably contributed to the decreased invasion and migration of DU145 cells. Additionally, we observed that maslinic acid inhibited DU145 cell adhesion, which was accompanied by decreases in the levels of E-cadherin, ICAM and VCAM (Fig. 4). Among the many changes inherent to the tumour progression process, alterations in cell–cell and cell–matrix adhesion appear to play a crucial role in promoting tumour cell invasion, migration and metastasis(Reference Christofori35). The present results indicate that decreases in these adhesion-regulating molecules contributed to maslinic acid-induced decreases in DU145 cell adhesion.
As invasive solid tumours suffer from intratumoral hypoxia resulting from an abnormality in the microvasculature and the rapid expansion of tumour mass(Reference Yao, Wang and Zhang36), angiogenesis is critical for tumour survival and growth. VEGF stimulates angiogenesis by activating a group of signalling pathways that stimulate the growth, migration and survival of endothelial cells, vascular permeability, and the mobilisation of endothelial precursor cells from the bone marrow into the general circulation(Reference Hicklin and Ellis24). A natural compound that inhibits VEGF production has potential for use as a next-generation cancer prevention agent. In the present study, maslinic acid significantly inhibited basal and EGF-induced VEGF production in DU145 cells under both normoxic and hypoxic conditions (Fig. 5). When the present study was in progress, Li et al. (Reference Li, Yang and Zhai37) reported that maslinic acid inhibited VEGF and uPA secretion and HIF-1α mRNA expression in liver cancer cells. Together, these results suggest that maslinic acid could be used as an anti-angiogenic agent to prevent liver and prostate cancer.
When tumour cells are exposed to hypoxic stress, the transcriptional activity of HIF-1 increases and plays an important role in promoting cancer angiogenesis and anaerobic metabolism(Reference Maxwell, Dachs and Gleadle22). HIF-1 is a well-established transcriptional regulator of VEGF and of many other genes involved in tumour growth and angiogenesis. In addition to HIF-1α regulation by hypoxia, HIF-1α can be activated in tumours under normoxic conditions as a result of genetic alterations affecting key oncogenes and tumour-suppressor genes(Reference Rankin and Giaccia23, Reference Semenza38, Reference Zhong, Chiles and Feldser39). The present results demonstrate that maslinic acid reduced HIF-1α protein levels under normoxic and hypoxic conditions in DU145 cells (Fig. 6(A)). Additionally, maslinic acid decreased HIF-1α transcripts and increased HIF-1α degradation (Fig. 6(D)). Taken together, these results suggest that maslinic acid reduced HIF-α levels by reducing transcript levels and protein stability. However, the effect of maslinic acid on the synthesis and degradation of HIF-α mRNA and protein synthesis needs to be examined in the future.
Maslinic acid reduced the nuclear levels of HIF-1α (Fig. 6(B)) and HRE reporter activities (Fig. 6(C)) in DU145 cells, demonstrating that maslinic acid reduced HIF-1 transcriptional activity. HIF-1α can directly activate the expression of a variety of pro-angiogenic and pro-metastatic factors, including VEGF, VEGF receptors, E-cadherin, plasminogen activator inhibitor-1, uPAR, MMP-2 and MMP-9(Reference Rankin and Giaccia23, Reference Semenza25). In the present study, maslinic acid significantly reduced VEGF, MMP-2, MMP-9, uPA, uPAR and E-cadherin protein and/or mRNA levels in DU145 cells (Figs. 2, 3 and 5). These findings indicate that maslinic acid exhibits antiangiogenic and antimetastatic effects under normoxic and hypoxic conditions by inhibiting HIF-1α activity.
The HIF-1α subunit is regulated by several signalling pathways, including phosphoinositol 3-kinase/Akt and mitogen-activated protein kinases, in response to various hormones, growth factors, cytokines, oncogenes and hypoxia (reviewed in Dimova et al. (Reference Dimova, Michiels and Kietzmann40)). It has been reported that Akt and ERK1/2 signalling plays a role in HIF-1α expression in breast(Reference Blancher, Moore and Robertson41) and prostate(Reference Jiang, Jiang and Zheng42, Reference Liu, Li and Chen43) cancer cells. We found that maslinic acid inhibited basal and EGF-induced Akt and ERK1/2 phosphorylation in DU145 cells (Fig. 7(A)). Additionally, inhibiting Akt and ERK1/2 activation by specific inhibitors reduced cellular HIF-1α levels and VEGF secretion (Fig. 7(B) and (C)). Taken together, these results suggest that maslinic acid inhibited Akt and ERK signalling, which in turn reduced HIF-1α activity and thereby reduced VEGF secretion. As maslinic acid inhibited EGF-induced ERK1/2 and Akt activation, future studies are needed to determine whether maslinic acid inhibits various growth factor signalling pathways.
In the present in vitro study, we demonstrated that maslinic acid inhibits the metastatic capacity of DU145 cells at 10–25 μmol/l. To the best of our limited knowledge, nutritional relevance of the concentrations of maslinic acid has yet to be elucidated. The concentration of maslinic acid in virgin olive oils has been reported to vary from 3·93 to 41·81 mg/kg(Reference Allouche, Jimenez and Uceda44). Additionally, the concentration of maslinic acid increases as olive oil quality decreases (38 mg/kg for extra virgin and 721 mg/kg for crude pomace olive oils)(Reference Perez-Camino and Cert45, Reference Fernandez-Navarro, Peragon, Esteban, Preedy and Watson46). The intake of olive oil in the Mediterranean countries is estimated to be 30–50 g/d(Reference Vissers, Zock and Katan47). Vissers et al. (Reference Vissers, Zock and Katan47) estimated that the plasma concentration of phenols with antioxidant potential resulting from the intake of 50 g olive oil can be at most 0·06 μmol/l, which is much lower than the concentrations of these phenols (10–25 μmol/l) required to show anti-metastatic activity in vitro. Thus, it appears that the concentrations of maslinic acid utilised in the present in vitro study are difficult to achieve in human subjects by dietary intake of olive oils. However, an in vivo study utilising a xenograft mouse model has shown that subcutaneous injection of 10–50 mg/kg body weight of maslinic acid every 2 d drastically suppressed pancreatic tumour growth(Reference Li, Yang and Zhai37). Nevertheless, there has been no study that investigated the concentrations and distributions of maslinic acid in various tissues of animals and human subjects after the administration of maslinic acid. Future in vivo studies in animals and human subjects are needed to determine whether maslinic acid can be developed as a chemopreventive and/or chemotherapeutic agent.
In conclusion, we demonstrated that maslinic acid suppressed HIF-1α expression by inhibiting Akt and ERK1/2 activation and suppressed the expression of VEGF, MMP, uPA, uPAR, E-cadherin, ICAM and VCAM in DU145 cells. Because HIF-1α regulates a number of genes that stimulate angiogenesis and metastasis, it is possible that maslinic acid could be useful as an angiogenesis and metastasis inhibitor. Future animal studies are warranted to determine whether maslinic acid inhibits tumour angiogenesis and metastasis in vivo.
Acknowledgements
The present study was supported by the Mid-career Researcher Program (grant no. 2010-0006923), the SRC program (Center for Food and Nutritional Genomics: grant no. 2011-0000912) and the Leap Research Program (2010-0029233) of the National Research Foundation of Korea, funded by the Ministry of Education, Science and Technology. S. Y. P., C. W. N., D. Y. K., Y.-H. K., K. W. L and J. H. Y. P. designed the experiments. S. Y. P. conducted the biochemical analyses and analysed the data. S. Y. P. wrote the first draft of the manuscript. J. H. Y. P. revised the manuscript. All authors read and approved the final manuscript. The authors declare that they have no conflict of interest.


