





Introduction
Cover crop–based organic rotational no-till (“organic no-till”) soybean [Glycine max (L.) Merr.] production uses surface mulch from a fall-established, mechanically terminated cereal rye (Secale cereale L.) cover crop as the primary means of weed suppression. Cereal rye mulch can provide early-season weed suppression and prevent yield loss when biomass production exceeds 6 to 8 Mg ha−1 (Mirsky et al. Reference Mirsky, Ryan, Teasdale, Curran, Reberg-Horton, Spargo, Wells, Keene and Moyer2013; Mohler and Teasdale Reference Mohler and Teasdale1993; Ryan et al. Reference Ryan, Mirsky, Mortensen, Teasdale and Curran2011b). Studies suggest that early fall seeding and high residual soil nitrogen are needed to achieve this level of biomass production in the U.S. Northeast (Mirsky et al. Reference Mirsky, Curran, Mortensen, Ryan and Shumway2011, Reference Mirsky, Spargo, Curran, Reberg-Horton, Ryan, Schomberg and Ackroyd2017). However, within commonly used grain cropping sequences in the U.S. Northeast (e.g., corn [Zea mays L.]–soybean–wheat [Triticum aestivum L.]), cereal rye establishment is frequently delayed beyond optimal establishment dates due to late grain corn harvest, and residual soil nitrogen can be low, which may prevent adequate weed control due to insufficient cereal rye biomass production (Wellman et al. Reference Wellman, Bagley, Crawford, Darby, Doonan, Hashemi, Hirsh, Krezinski, Mirsky, Moore, Scott, Siller, Tao, VanGessel and Vollmer2026). Despite the associated benefits such as improved soil health and reduced energy and labor costs (Hamilton et al. Reference Hamilton, Wallace, Barbercheck and Curran2023), short fall growing seasons after grain corn in the Northeast are a major barrier to adoption of organic no-till practices. Critically, much of the foundational research on weed suppression in organic no-till soybean was conducted independently of these cropping system constraints. To increase the adoption potential of rotational no-till soybean production, it is crucial to investigate cereal rye cultural management practices that increase rye biomass and weed suppression within these short growing windows (Mirsky et al. Reference Mirsky, Ryan, Teasdale, Curran, Reberg-Horton, Spargo, Wells, Keene and Moyer2013; Ryan et al. Reference Ryan, Curran, Grantham, Hunsberger, Mirsky, Mortensen, Nord and Wilson2011a; Wallace et al. Reference Wallace, Williams, Liebert, Ackroyd, Vann, Curran, Keene, VanGessel, Ryan and Mirsky2017).
Adjusting cereal rye seeding rates, sowing arrangement, and fall soil fertility are cultural management practices that have been investigated in alternative contexts, which may improve the weed-suppression potential of cereal rye surface mulch within existing crop rotations. While increasing cereal rye seeding rates within drill-seeded rows leads to lower tillering and high intraspecific competition within the row, previous work has shown that increasing seeding rates contributes to lower weed biomass despite no increase in aboveground biomass, an effect attributed to greater early-season groundcover (Boyd et al. Reference Boyd, Brennan, Smith and Yokota2009; Ryan et al. Reference Ryan, Curran, Grantham, Hunsberger, Mirsky, Mortensen, Nord and Wilson2011a). Previous studies conducted in small grain production have also shown that weed suppression is enhanced when using a grid sowing arrangement compared with standard sowing methods in wheat (Olsen et al. Reference Olsen, Kristensen and Weiner2005a; Weiner et al. Reference Weiner, Griepentrog and Kristensen2001). Clumped spacing (e.g., crops planted in rows) at high densities can result in size-asymmetric competition, where larger individuals capture a disproportionate share of available resources and suppress their smaller neighbors (Lu et al. Reference Lu, Jiang, Weiner and Sparks2020; Schwinning and Weiner Reference Schwinning and Weiner1998; Weiner Reference Weiner1990). In comparison, grid sowing arranges individual plants more uniformly within the field, which may increase asymmetric competition between the cover crop and establishing weeds while slowing the onset of intraspecific competition. While there is extensive theory supporting that increasing crop uniformity improves weed suppression during the small grain growing season (Lu et al. Reference Lu, Jiang, Weiner and Sparks2020), there is limited research on the effects of increasing cover crop uniformity via grid seeding on weed suppression post-termination in subsequent cash crops (Boyd et al. Reference Boyd, Brennan, Smith and Yokota2009; Brennan et al. Reference Brennan, Boyd, Smith and Foster2009). To our knowledge, this research has not yet been conducted within grain cropping systems in the U.S. Northeast.
A previous study conducted in the Northeast region suggests that cereal rye needs an average of 72 kg N ha−1 beyond typical residual N levels to reach maximum biomass production (Mirsky et al. Reference Mirsky, Spargo, Curran, Reberg-Horton, Ryan, Schomberg and Ackroyd2017). Residual soil nitrogen is more likely to be insufficient to optimize cereal rye production when rye is sown after high nitrogen demand crops such as field corn (Mirsky et al. Reference Mirsky, Spargo, Curran, Reberg-Horton, Ryan, Schomberg and Ackroyd2017). Ryan et al. (Reference Ryan, Curran, Grantham, Hunsberger, Mirsky, Mortensen, Nord and Wilson2011a) reported that spring-applied poultry litter increased cereal rye biomass but did not reduce weed biomass in an organic no-till soybean sequence. However, as most of the nitrogen in poultry litter is in the organic form and must be mineralized before crop uptake, fall poultry litter application may improve the synchronicity of nitrogen mineralization and crop demand, promoting greater cereal rye biomass accumulation without stimulating weed growth that can result from readily available soil inorganic nitrogen (Ashworth et al. Reference Ashworth, Chastain, Moore, Waldrip, Pagliari and He2020; Balkcom et al. Reference Balkcom, Duzy, Arriaga, Delaney and Watts2018; Seman-Varner et al. Reference Seman-Varner, Varco and O’Rourke2019).
In organic no-till soybean production, soybean planting date is dictated by cereal rye maturation, as cereal rye must be rolled-crimped at anthesis for optimal termination efficacy (Keene et al. Reference Keene, Curran, Wallace, Ryan, Mirsky, VanGessel and Barbercheck2017; Mirsky et al. Reference Mirsky, Curran, Mortensen, Ryan and Shumway2009). Delayed cereal rye establishment in a corn–soybean sequence can also delay cereal rye maturity and consequently lead to late soybean planting and diminished soybean yield. To overcome this management constraint, planting green, a practice that delays cover crop termination relative to cash crop planting, has been adapted for organic systems using mechanical termination with the roller-crimper (Reed et al. Reference Reed, Karsten, Curran, Tooker and Duiker2019; Silva and Vereecke Reference Silva and Vereecke2019). In organic production, soybean is no-till planted into standing cereal rye at the boot stage (Zadoks 45), and the cereal rye is later terminated using the roller-crimper at anthesis (Zadoks 67). Soybean plants can survive rolling-crimping to terminate cereal rye provided they have not passed the V3 stage at the time of rolling-crimping (Silva and Vereecke Reference Silva and Vereecke2019).
In this study, we evaluated combinations of cultural management practices to address management challenges associated with organic no-till management in a grain corn to soybean rotation sequence characterized by a narrow postharvest establishment period. This work aims to fine-tune previously investigated management practices (seeding rate, fertility) alongside emerging techniques adopted for organic no-till soybean cropping systems (sowing arrangement, planting green). Two complementary field studies were conducted to test the effects of (1) cereal rye seeding rate and grid sowing arrangement and (2) planting green compared with standard roll-planted soybean under three levels of fall-applied poultry litter amendments on cereal rye biomass productivity, weed-suppression potential, and soybean performance. In the cereal rye seeding density and arrangement experiment, we hypothesized that (1a) there would be a positive relationship between higher cereal rye seeding rates and cereal rye biomass at anthesis; (1b) grid-sown cereal rye would result in higher biomass compared with standard practice across a seeding rate gradient; and (1c) cereal rye biomass would be negatively correlated with weed biomass in soybean in August. In the soil fertility and planting green experiment, we hypothesized that (2a) there would be a positive relationship between fall-applied poultry litter and cereal rye biomass at anthesis; (2b) cereal rye biomass would be negatively correlated with weed biomass in soybean in August; and (2c) planting green would improve soybean establishment and yield over the standard practice of rolling-crimping and planting at the cereal rye anthesis stage.
Materials and Methods
We established two complementary field experiments on certified organic land in the 2021 to 2022 and 2022 to 2023 growing seasons. Experiments were imposed in adjacent fields at the Pennsylvania State University Russell E. Larson Agricultural Research Center (RELARC) near Rock Springs, PA (40.72°N, 77.93°W). The soils were Hagerstown silt loam (fine, mixed, semiactive, mesic Typic Hapludalfs) with a pH ranging from 6.2 to 6.9 in 2021 and 6.4 to 6.8 in 2022. Organic matter ranged from 2.2% to 3.2% in 2021 and 2.4% to 2.6% OM in 2022. Immediately before cover crop establishment, soil nitrate ranged from 8.5 to 13 ppm in 2021 and 3.2 to 6.2 ppm in 2022. Experiments were conducted in the corn–soybean sequence of a corn–soybean–wheat rotation.
Cereal Rye Seeding Density and Arrangement Experiment
The field experiment was designed as a two-factor augmented randomized block design with three replications. The first factor was rye sowing arrangement imposed in 6 by 6 m plots. Treatments included (1) standard sowing in one direction using 19-cm row spacing and (2) grid sowing in two directions using 19-cm row spacing. The most common grain-drill row spacing in this region is 19 cm. The second factor included four seeding rate levels (150, 300, 600, 900 live seeds m−2). Each replicate block also included an unseeded control, resulting in nine experimental units per block. Seeding rates were determined by weight and were adjusted each year based on seed lot viability and 1,000-kernel weight, which can vary greatly even within named varieties (Lounsbury et al. Reference Lounsbury, Warren, Hobbie, Darby, Ryan, Mortensen and Smith2022). Seeding rate treatments were equivalent to 31, 63, 126, and 188 kg ha−1 in 2021 and 36, 71, 142, and 213 kg ha−1 in 2022.
Soil Fertility and Planting Green Experiment
The field experiment was designed as a two-factor split-plot design with five replications. Fall fertility treatments were imposed at the main plot level (6 by 6 m) and included three treatment levels: 0, 3.6, or 6.7 Mg ha−1 poultry litter applied at the time of rye sowing. Poultry litter rates equated to 22.2 or 44.4 and 8.9 or 17.9 kg NH4-N ha−1 and 88.3 or 176.6 and 57.7 or 115.5 kg total N ha−1 in 2021 and 2022, respectively. Soybean planting strategy was imposed at the split-plot level (3 by 6 m) and consisted of two treatment levels: (1) standard practice of no-till planting soybean and rolling-crimping cereal rye at rye anthesis (late treatment); and (2) planting green, where soybean was planted into standing rye at the boot stage (Zadoks 45) and cereal rye and soybean seedlings were rolled-crimped at anthesis (early treatment) (Silva and Vereecke Reference Silva and Vereecke2019). Cereal rye seeding rate (600 seeds m−2, 126 kg ha−1) and sowing arrangement were held constant across treatments. Cereal rye was sown using 19-cm row spacing in the same direction as rolling-crimping.
Experimental Procedures
Before initiation of experiments, corn was harvested for grain and residue was flail mowed to enhance decomposition. Seedbeds were prepared using two passes with a high-speed disk, a form of shallow tillage targeting the top 10 cm of soil. Cereal rye (‘Aroostook’) was seeded with a no-till drill (Great Plains, Salina, KS) in 19-cm-wide rows (or grid) on October 14, 2021, and October 12, 2022. In the soil fertility experiment, poultry litter was spread using a belt spreader calibrated with the weight–area method. Soybean was no-till planted using 76-cm row spacing at a rate of 592,800 seeds ha−1 (240,000 seeds acre−1) with a John Deere no-till planter (Deere & Company, Moline, IL) equipped with residue slicers (Pequea Planter, Gap, PA), an electric drive metering system, and hydraulic down-force pressure on individual row units. Soybean was planted on May 25, 2022, and May 24, 2023, for the standard planting and May 12, 2022, and April 21, 2023, for planting green treatments. Inclement weather delayed field operations in 2022, postponing soybean planting until cereal rye was at the early heading stage. A peat-based Bradyrhizobium japnonicum soybean inoculant (Exceed Superior Legume Inoculant, Visjon Biologics, Henrietta, TX) was added to soybean seeds before planting. All rolling-crimping operations were conducted with a front-mounted I&J style roller-crimper parallel to the direction of rye sowing on May 25, 2022, and May 24, 2023. Emerged planted green soybeans were at growth stage VC at the time of rolling-crimping in both years.
Weed Seed Microplot Establishment
Permanently marked quadrats (1 m2) were established in the middle of each plot. Artificial weed seedbanks were established using common ragweed (Ambrosia artemisiifolia L.) (750 seeds m−2), redroot pigweed (Amaranthus retroflexus L.) (750 seeds m−2), giant foxtail (Setaria faberi Herrm.) (750 seeds m−2), and velvetleaf (Abutilon theophrasti Medik.) (200 seeds m−2; 2022 only) that were mixed with sand (<100g) as a carrier and sprinkled evenly within the microplot on December 9, 2021, and December 14, 2022. Weed microplots were established in December to expose weeds seeds to freeze–thaw and release dormancy cycles (Forcella et al. Reference Forcella, Benech Arnold, Sanchez and Ghersa2000). Weed species were selected to represent the most troublesome weeds in organic no-till soybean and span a wide range of seed mass traits (Ficks et al. Reference Ficks, Lowry and Wallace2022a; Wallace et al. Reference Wallace, Keene, Curran, Mirsky, Ryan and VanGessel2018). Weed seeds were collected in September and October from several locations near Rock Springs, PA. Mature inflorescences were hand harvested and dried at room temperature for approximately 2 wk. Inflorescences were then hand threshed, sieved, and run through an air column separator (Seedburo, Des Plaines, IL) before determination of 100-seed weights by species. Weed seed numbers were determined by weight.
Cover Crop Productivity
To assess cereal rye productivity in response to cultural management practices, we quantified cereal rye biomass at anthesis. We harvested cereal rye biomass immediately before rolling-crimping at anthesis within a square 0.25-m2 quadrat and dried biomass at 60 C for 1 wk before weighing. Cereal rye biomass was corrected to account for grain drill width (19 cm) and row length (3 x 50 cm) by multiplying biomass by a correction factor of 0.8749 (1/(row area/quadrat area)) before converting to kilograms per hectare (kg ha−1) (Brennan Reference Brennan2023).
Weed Biomass
We assessed the effects of the cereal rye mulch and soybean competition on weed biomass in August when weeds were in a reproductive stage and vegetative biomass was greatest. We harvested a 0.54-m2 (0.66 m by 0.82 m) subsample of weeds centered between two soybean rows within the 1-m2 weedy microplot established the previous fall. We counted weeds by species, sorted biomass by species, and weighed biomass after oven-drying at 60 C for 1 wk. Both ambient and artificially established weeds were assessed.
Soybean Performance
Soybean stand counts were performed to assess establishment rates. Soybean yield in response to weed competition was assessed by hand harvesting the two 1-m lengths of soybean row within the weedy microplot. Because weed vegetation had been removed in August for the weed assessment, some soybean plants in the microplots were targeted by rodent herbivory. In 2022, a second soybean yield sample was taken outside the microplot in all plots. In 2023, only unseeded control treatments experienced herbivory, and a second sample was taken only in the unseeded control plots in the seeding density experiment. Soybeans were harvested when the average grain moisture was 15%. Soybeans were threshed using a stationary plot combine, and grain was collected after each sample was threshed. Grain moisture was quantified using a handheld moisture meter suitable for small sample sizes (John Deere Moisture Chek Plus, Deere & Company), and soybean yields were standardized to 13% moisture.
Statistical Analysis
We fit a series of models testing the effects of cultural management practices on cereal rye productivity, weed suppression, and soybean yield. All analyses were completed in R statistical software v. 4.5.1. All models were fit using the nlme package (Pinheiro et al. Reference Pinheiro, Bates and Core Team2025). Cereal rye seeding rate was regressed as a continuous variable, while poultry litter rate was fit as a categorial variable in ANOVA models. We tested the significance of fixed effects with Wald chi-square tests and assessed mean separation with Tukey’s contrasts in the emmeans package (Lenth and Piaskowski Reference Lenth2025). We present both marginal (R2 m; variance explained by fixed effects) and conditional (R2 c; combined variance explained by fixed and random effects) R2 for mixed-effects models.
To test the effect of cereal rye seeding rate and arrangement on cereal rye biomass, we fit a linear mixed-effects model. Seeding rate, sowing arrangement, year, and their two- and three-way interactions were fit as fixed effects, and block was fit as a random effect. Unseeded control treatments were excluded from cereal rye biomass models. To test the effect of fall-applied poultry litter and soybean planting strategy on cereal rye biomass, we fit a linear mixed-effects model with poultry litter rate, soybean planting strategy, year, and their two- and three-way interactions as fixed effects, and block as a random effect.
To assess the effect of cereal rye biomass on weed suppression, we fit a linear mixed-effects model assessing the fixed effects of cereal rye biomass, year, and their interaction, and a random effect of block on total weed biomass. For the seeding density experiment, models were fit to the natural log of total weed biomass, and back-transformed means are presented in the results. Weed biomass in the fertility experiment was not transformed.
To assess how cereal rye seeding density affected weed biomass relative to the unseeded control treatment, we calculated a log response ratio (LRR) of weed biomass in August. ${\rm{LRR}} = {\rm{ln}}\left({{\rm{weed\;biomas}}{{\rm{s}}_{{\rm{seeding\;density\;treatment}}}}/{\rm{weed\;biomas}}{{\rm{s}}_{{\rm{unseeded\;control}}}}} \right)$
Positive LRR values indicate weed biomass increased relative to the control due to a given cereal rye seeding density, while negative values indicate weed biomass decreased relative to the control treatment due to a given cereal rye seeding density. We fit linear mixed-effects models with seeding rate, sowing arrangement, year, and their interactions as fixed effects, and block as a random effect, to the LRR of total weed biomass in August.
To evaluate the effect of fall-applied poultry litter and soybean planting strategy on total weed biomass, we fit linear mixed-effects models with poultry litter rate, soybean planting strategy, year, and their interactions as fixed effects, and block as a random effect. We did not use LRRs for the fertility study, as we lacked a true control (i.e., no weed management) for comparison.
To test hypothesized relationships between cultural management practices, cereal rye biomass, and weed biomass, we used piecewise structural equation models (PSEMs). These models test hypothesized relationships depicted in path diagrams using a series of structured equations that are evaluated individually (Lefcheck Reference Lefcheck2016). We fit PSEMs testing the hypothesized path diagram for each previously identified significant cultural practice (seeding rate or poultry litter rate) to test whether cereal rye biomass mediated the relationship between cultural management and weed biomass. To facilitate interpretation of PSEM results, we used both seeding rate and poultry litter rate as continuous variables. We fit year as a random effect in both PSEMs. We first fit unsaturated models that omit the direct link between cultural management practice and weed biomass and used tests of directed separation based on Fischer’s C statistic as a goodness-of-fit test for PSEM to assess the independence claim that there is no direct relationship between cultural management and weed biomass. Nonsignificant P-values (P > 0.05) indicate the unsaturated model fits the data well (i.e., there are no missing paths) we fail to reject the null model that the cultural practice and weed biomass are conditionally independent; otherwise, we fit a model including the path between the cultural management practice and weed biomass.
Finally, to test whether cereal rye density affected soybean establishment and yield, we fit two linear mixed-effects models with cereal rye seeding rate, sowing arrangement, year, and their interactions as fixed effects, and block as a random effect, to the count of soybean plants or the LRR of soybean grain yield. Soybean yield LRR is calculated as: $\small{{\rm{LRR}} = {\rm{ln}}\left( {{\rm{soybean\;yiel}}{{\rm{d}}_{{\rm{seeding\;density\;treatment}}}}/{\rm{soybean\;yiel}}{{\rm{d}}_{{\rm{unseeded\;control}}}}} \right)}$
Positive LRR values indicate soybean yield increased relative to the control due to a given cereal rye seeding density, while negative values indicate soybean yield decreased relative to the control treatment due to a given cereal rye seeding density. Soybean yield LRR allows for relative comparisons between yield in the seeding density treatments, without the overwhelming differences between soybean yield in the unseeded control and any seeding density. We also tested whether poultry litter rate and soybean planting strategy affected soybean establishment and yield using linear mixed-effects models. Poultry litter rate, soybean planting strategy, year, and their interactions were fit as fixed effects, with block as a random effect, to the number of soybean plants or soybean grain yield.
Results and Discussion
Seeding Density Experiment
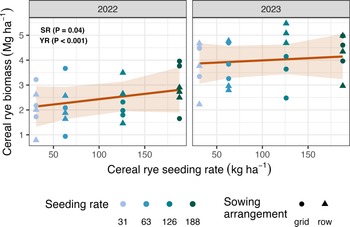
There was a significant main effect of cereal rye seeding rate (P = 0.04) and year (P < 0.001) on cereal rye biomass at anthesis (Figure 1; R2 m= 0.51, R2 c= 0.54). There was no effect of cereal rye sowing arrangement on rye biomass accumulation (P = 0.83). Cereal rye biomass increased moderately with seeding rate and was greater in 2023 than in 2022. In 2022, biomass ranged from 0.78 to 3.21 Mg ha−1 at the lowest seeding rate and increased to 1.65 to 3.96 Mg ha−1 at the highest seeding rate. In 2023, biomass ranged from 2.22 to 4.68 Mg ha−1 at the lowest seeding rate to 2.96-4.98 Mg ha−1 at the highest seeding rate. On average, for every additional kilogram per hectare (kg ha−1) of seed added, cereal rye biomass increased by 4.26 kg ha−1. While cereal rye biomass at anthesis was affected by cereal rye seeding rate, the magnitude of increase in biomass production was small given targeted biomass thresholds for weed suppression in organic no-till systems. Previous studies found that increasing seeding rate was ineffective at increasing biomass production at optimal sowing dates (Boyd et al. Reference Boyd, Brennan, Smith and Yokota2009; Brockmueller et al. Reference Brockmueller, Sexton, Osborne and Chim2023; Essman et al. Reference Essman, Loux, Lindsey and Dobbels2023; Ficks et al. Reference Ficks, VanGessel and Wallace2022b; Ryan et al. Reference Ryan, Curran, Grantham, Hunsberger, Mirsky, Mortensen, Nord and Wilson2011a). Our results are consistent with a limited number of studies that sowed cereal rye late in the fall and found that seeding rate modestly increased biomass production (Darby et al. Reference Darby, Halteman, Cummings, Gervais and Madden2010, Reference Darby, Cline, Cummings, Madden and Harwood2011; Wellman et al. Reference Wellman, Bagley, Crawford, Darby, Doonan, Hashemi, Hirsh, Krezinski, Mirsky, Moore, Scott, Siller, Tao, VanGessel and Vollmer2026). Additionally, we found no effect of sowing arrangement on cereal rye biomass production. This is consistent with other studies, where the advantage of grid sowing was most pronounced when weed–crop competition occurs at early crop growth stages (Olsen et al. Reference Olsen, Kristensen and Weiner2005a, Reference Olsen, Kristensen, Weiner and Griepentrog2005b).
Predicted effects of cereal rye seeding rate (SR; kg ha−1), sowing arrangement (SA), and year (YR) on cereal rye biomass (Mg ha−1) at anthesis. Lines fit using linear mixed-effects model with SR, SA, YR, and their interaction as fixed effects, and block as a random effect. Shaded bands are 95% confidence intervals, and points are individual observations.

Cereal rye biomass at anthesis did not affect total weed biomass in soybean in August in the seeding density experiment (P = 0.15), but weed biomass varied by year (P = 0.03). Weed biomass in 2022 ranged from 754 kg ha−1 to 5,149 kg ha−1 and 494 kg ha−1 to 6,676 kg ha−1 in 2023 (Figure 2A). In 2022, weed biomass was 51% S. faberi and 34% A. artemisiifolia, whereas in 2023, weed biomass was 21% S. faberi and 59% A. artemisiifolia. These species are the most common weeds in organic no-till soybean production, because they can emerge before cereal rye rolling-crimping (Wallace et al. Reference Wallace, Keene, Curran, Mirsky, Ryan and VanGessel2018). Amaranthus retroflexus and A. theophrasti biomass was <0.5% of total weed biomass in both years.
Predicted effects of (A) cereal rye biomass (BIO; Mg ha−1) at anthesis, sowing arrangement (SA), and year (YR) on weed biomass in August (kg ha−1) and (B) cereal rye seeding rate (SR), SA, and YR on the log response ratio (LRR) of weed biomass. The LRR is the natural log of weed biomass in a density treatment over the unseeded control. Negative LRR indicates better weed suppression than in the unseeded control. Lines fit using linear mixed-effects model with BIO/SR, SA, YR, and their interaction as fixed effects, and block as a random effect. Shaded bands are 95% confidence intervals, and points are individual observations. (C) Piecewise structural equation model (PSEM) results. Solid lines indicate significant relationships, with thicker lines representing stronger relationships. Dashed lines indicate nonsignificant relationships. Numbers on lines indicate partial regression coefficients for statistically significant relationships. R2 m represents variance from fixed effects only; R2 c is the combined variance from fixed and random (year) effects.
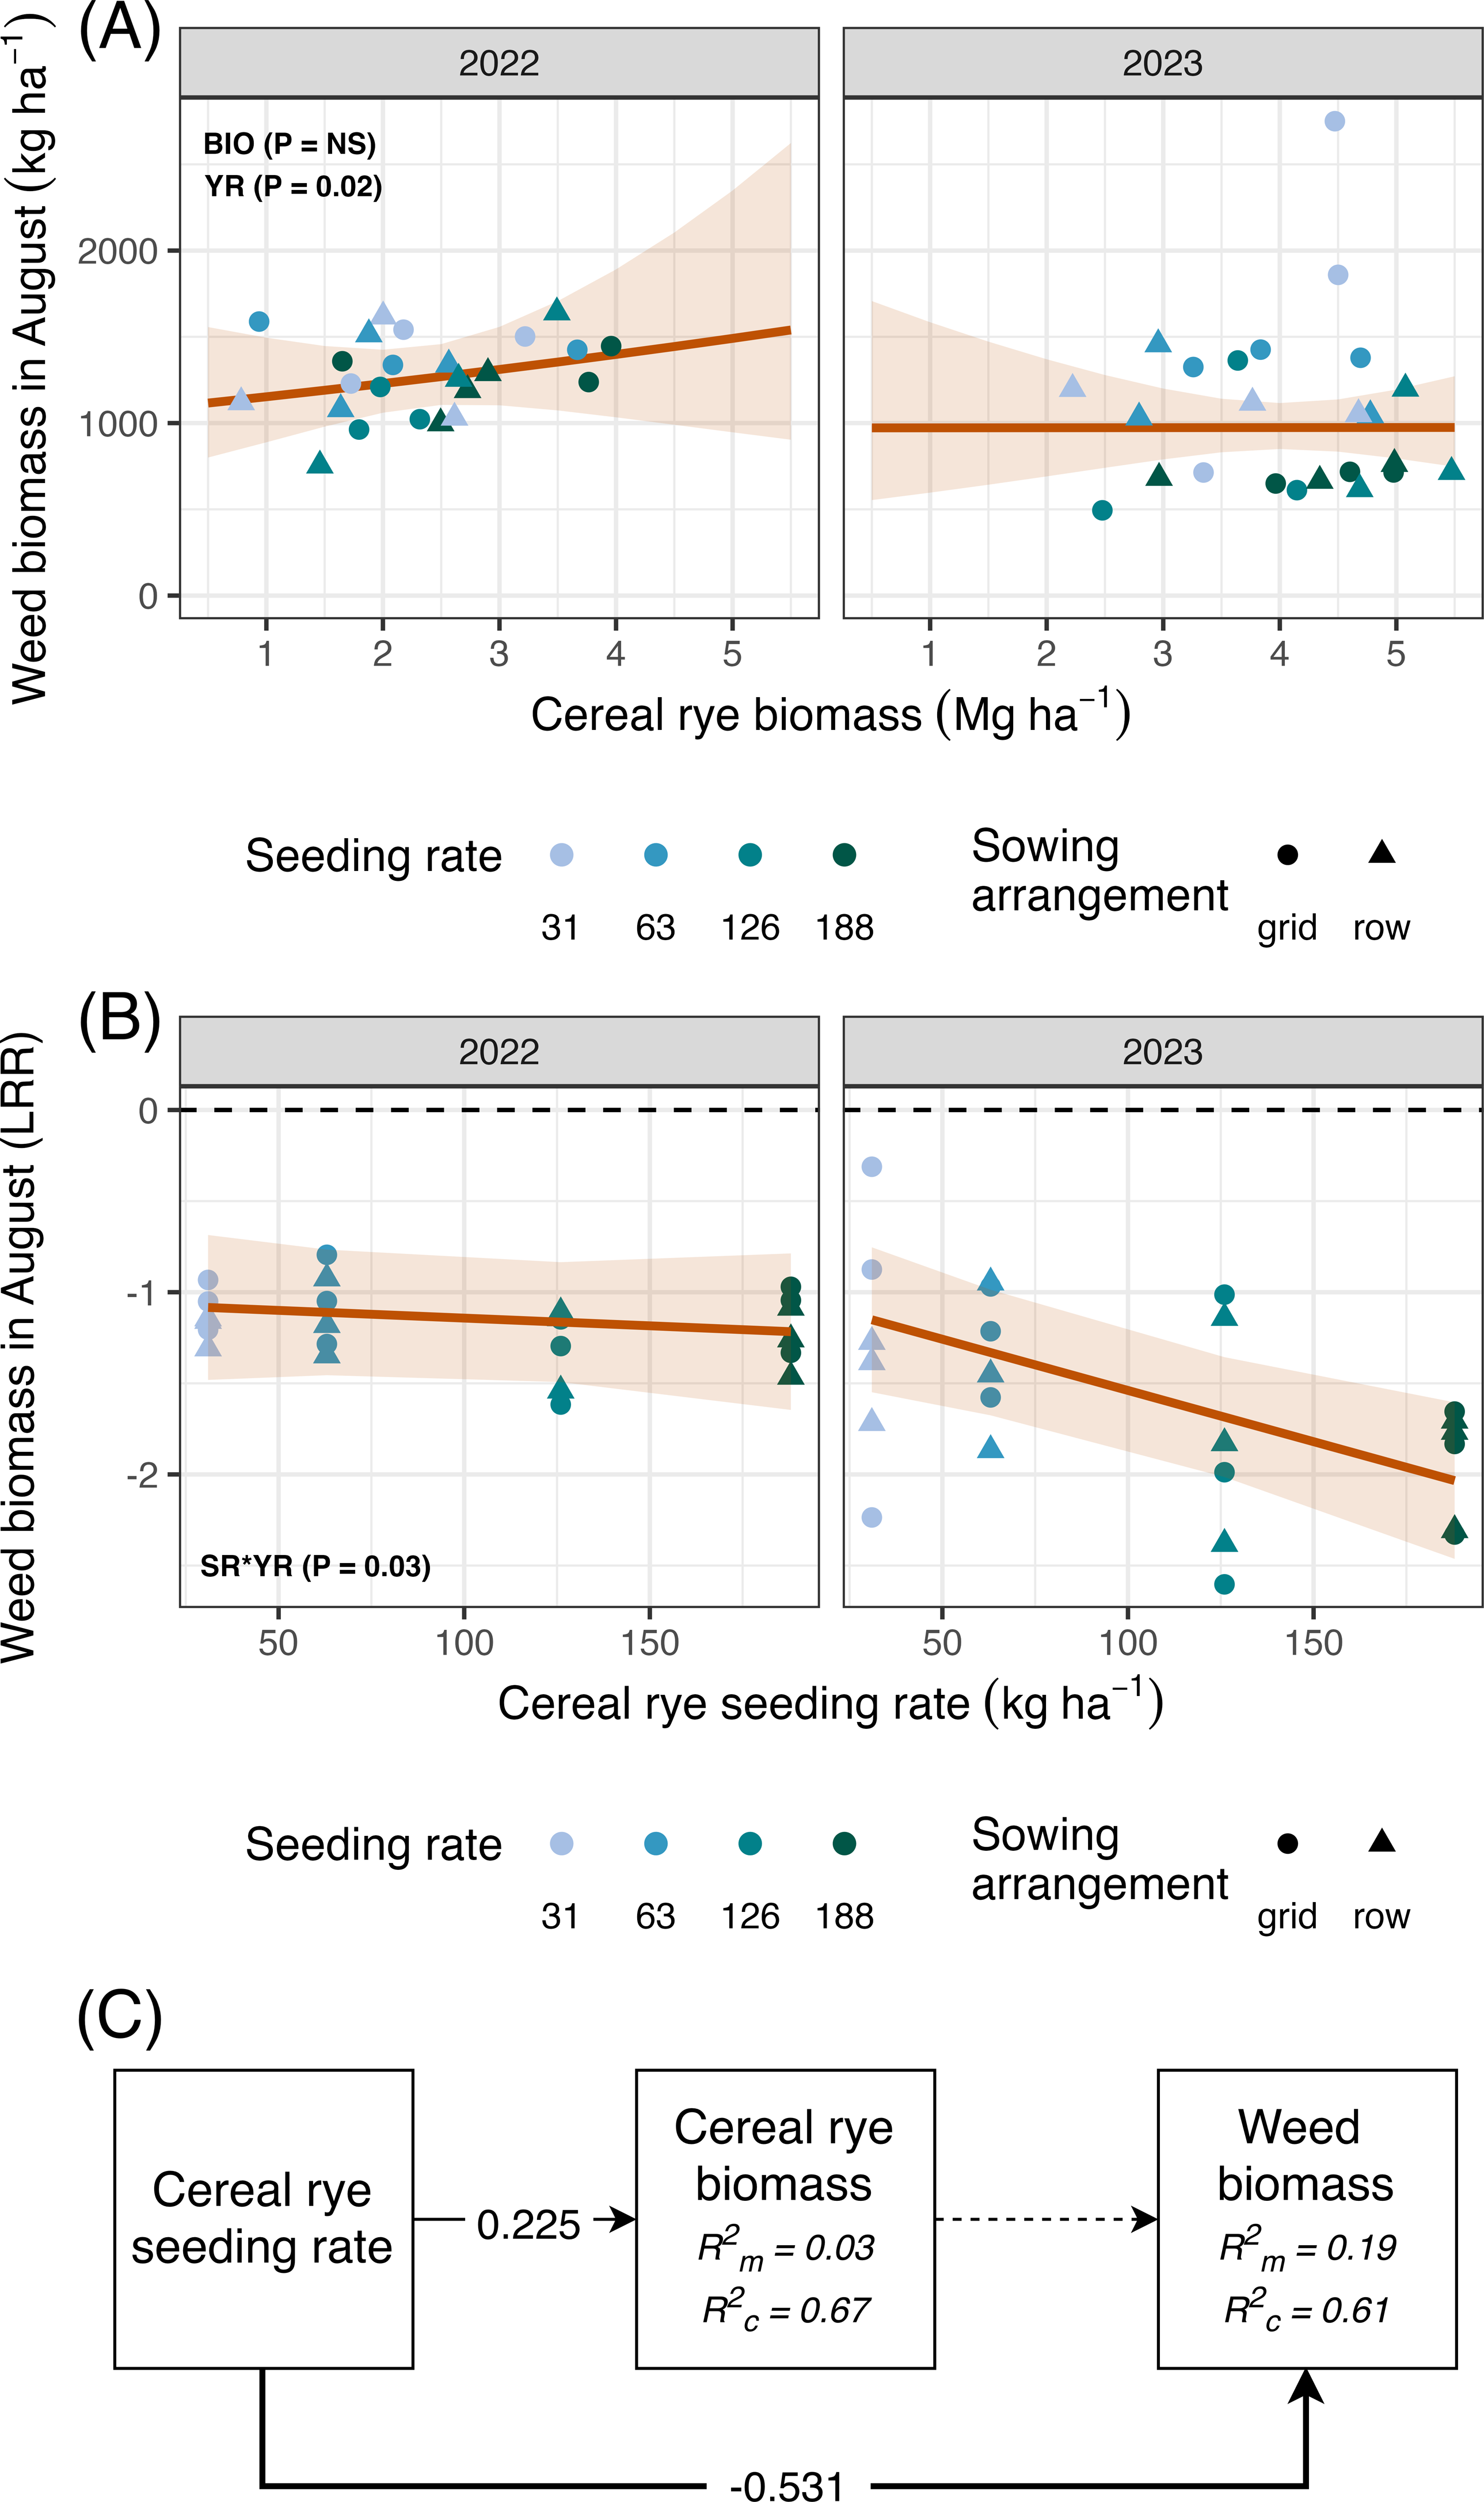
While the seeding density study produced a range of cereal rye biomass levels in both years, we did not find support that greater cereal rye biomass led to greater weed suppression within production seasons. Notably, biomass production was low across both years, reaching a maximum of 4 to 5 Mg ha−1 in 2022 and 2023, respectively. Therefore, the cultural management strategies investigated in this study were not sufficient given a 6 to 8 Mg ha−1 biomass target for weed suppression (Mirsky et al. Reference Mirsky, Ryan, Teasdale, Curran, Reberg-Horton, Spargo, Wells, Keene and Moyer2013; Mohler and Teasdale Reference Mohler and Teasdale1993; Ryan et al. Reference Ryan, Mirsky, Mortensen, Teasdale and Curran2011b). Weed suppression is often insufficient when biomass is below 6 Mg ha−1 due to heterogeneity in residue layers, which leaves gaps in the mulch that are sufficient to stimulate germination of light-sensitive weed species (Teasdale Reference Teasdale1996). The maximum rye biomass was approximately 4 Mg ha−1 in 2022, which we suspect left gaps in soil coverage that stimulated weed germination, while simultaneously providing resources, like increased soil moisture, that promoted growth of surviving weed individuals.
Independent of cereal rye biomass, there was a significant effect of cereal rye seeding rate (P = 0.003), year (P < 0.001), and seeding rate by year interaction (P = 0.03), on the LRR of total weed biomass in August. There was no effect of sowing arrangement on LRR weed biomass (P = 0.39). All LRR weed biomass values were negative, indicating that all seeding rates reduced biomass compared with the unseeded control (Figure 2B). The LRR decreased moderately in 2022 as seeding rate increased and decreased at a higher rate in 2023, indicating that higher seeding rates reduced weed biomass compared with lower seeding rates.
The results of the PSEM indicate that cereal rye seeding rate affects both cereal rye biomass and weed biomass, but there was no mediating effect of cereal rye biomass on weed biomass (Figure 2C). Importantly, this indicates that higher cereal rye seeding rates improved weed suppression independently of cereal rye biomass. Weed suppression was greatest when cereal rye was sown at high seeding rates, implicating a non–biomass mediated, density-dependent mechanism of weed suppression from cereal rye. This is consistent with some studies that found weed suppression improved at higher seeding rates (Boyd et al. Reference Boyd, Brennan, Smith and Yokota2009; Olsen et al. Reference Olsen, Kristensen and Weiner2005a; Ryan et al. Reference Ryan, Curran, Grantham, Hunsberger, Mirsky, Mortensen, Nord and Wilson2011a), while others have found no effect of cover crop seeding rate on weed suppression (Essman et al. Reference Essman, Loux, Lindsey and Dobbels2023; Ficks et al. Reference Ficks, VanGessel and Wallace2022b).
Notably, we modeled weed suppression using the LRR with weed biomass in the unseeded control as the baseline, because weed biomass in the unseeded control was two to three times greater than weed biomass in any seeding rate treatment. Therefore, it was clear that as a stand-alone weed-suppression tactic, using cereal rye mulch in any capacity reduced weed biomass, and that weed suppression was further improved by using higher cereal rye seeding rates.
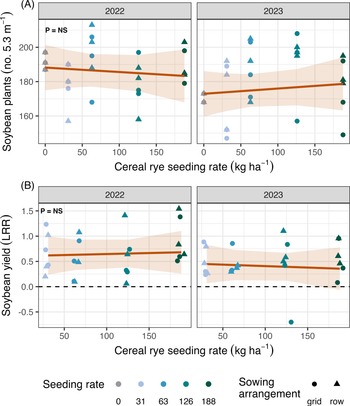
Soybean establishment was not affected by cereal rye seeding rate (P = 0.46), sowing arrangement (P = 0.25), or year (P = 0.08) (Figure 3A). This indicates that planting soybean into alternative cereal rye sowing arrangements was not detrimental to soybean establishment under the low to moderate levels of cereal rye mulch achieved in this study. The variability observed in soybean establishment was unrelated to cereal rye seeding rate under these conditions.
Predicted effects of cereal rye seeding rate (SR; kg ha−1), sowing arrangement (SA), and year (YR) on (A) soybean establishment and (B) the log response ratio (LRR) of soybean yield. The LRR is the natural log of soybean yield in a given rye density treatment over yield in the unseeded control. Positive LRR indicates yield was greater than in the control treatment. Shaded bands are 95% confidence intervals, and points are individual observations.

There was no effect of cereal rye seeding rate (P = 0.24), sowing arrangement (P = 0.36), or year (P = 0.12) on the LRR of soybean yield (Figure 3B). Soybean yield was 2.5 times greater in 2023 than in 2022 and was on average 93 g m−1 row and 227 g m−1 row in 2022 and 2023, respectively. All but one observation of the LRR were greater than zero, indicating that any cereal rye increased soybean yield over the unseeded control. However, the magnitude by which weed suppression increased with rye seeding rate (Figure 2B) did not impact soybean yield LRR. Still, soybean yield in plots with any cereal rye mulch were greater than in the unseeded control in all but one observation, indicating that any cereal rye mulch generally improved soybean yield, likely due to reduced weed–crop competition.
Throughout the seeding density experiment, we found no difference between grid sowing and the standard 19-cm row sowing on any response evaluated. Notably, we implemented the grid treatments using two passes with the standard grain drill to reduce technological barriers to adoption, which meant that the grid arrangement was not as uniform as in previous studies that used a modified precision planter or hand sowing (Weiner et al. Reference Weiner, Griepentrog and Kristensen2001; Xi et al. Reference Xi, Wu, Weiner and Zhang2022). This study also examined the effects of grid sowing primarily after cover crop termination, which may have reduced the impact of the grid arrangement relative to studies that examined the relationship directly between weed suppression and yield within the same cash crop. While broadcast establishment of cereal rye has been proposed as an alternative to grid sowing to increase cover crop uniformity, broadcasting risks stand loss due to poor seed–soil contact and other factors that may contribute to patchiness in cover crop establishment (Fisher et al. Reference Fisher, Momen and Kratochvil2011), which may lead to poor weed control (Haramoto Reference Haramoto2019).
The aim of this study was to compare the magnitude of weed control and soybean yield under different cereal rye densities within the soybean phase of cover crop–based organic rotational no-till production. Accordingly, the control treatment was no weed management, rather than alternative weed management practices such as tillage. While it is intuitive that including any cereal rye mulch improved weed suppression and soybean yield compared with no weed management, an alternate scenario that we did not observe was that a low biomass cover crop mulch could have facilitated weed growth (Mohler and Teasdale Reference Mohler and Teasdale1993; Teasdale and Mohler Reference Teasdale and Mohler2000) and diminished soybean yield relative to the no weed control treatment. Previous research demonstrated that even if organic no-till soybean is weedier than tilled comparisons, soybean yield and net income are comparable (Hamilton et al. Reference Hamilton, Wallace, Barbercheck and Curran2023; Wallace et al. Reference Wallace, Williams, Liebert, Ackroyd, Vann, Curran, Keene, VanGessel, Ryan and Mirsky2017).
Fall Fertility Experiment
There was a significant main effect of poultry litter rate (P < 0.001) and year (P = 0.001) on cereal rye biomass at anthesis (Figure 4). Overall, biomass accumulation was greater in 2023 than in 2022. In 2022, applying poultry litter in the fall significantly increased biomass accumulation. Biomass increased from 2.51 Mg ha−1 without poultry litter, to 4.04 Mg ha−1 or 4.68 Mg ha−1 biomass when 3.36, and 6.67 Mg ha−1 poultry litter was applied, respectively. There was no significant difference between effects of the two poultry litter rates. In 2023, biomass accumulation increased from 3.37 Mg ha−1 without poultry litter to 4.82 Mg ha−1 at the lower poultry litter rate and significantly increased to 6.32 Mg ha−1 rye biomass when the high poultry litter rate was applied. The increase in cereal rye biomass with poultry litter is consistent with the findings of Mirsky et al. (Reference Mirsky, Spargo, Curran, Reberg-Horton, Ryan, Schomberg and Ackroyd2017), where on average, an additional 72.4 kg N ha−1 beyond residual soil N was necessary to achieve maximum biomass production. The increase in cereal rye biomass with fall-applied poultry litter was greater than Ryan et al. (Reference Ryan, Curran, Grantham, Hunsberger, Mirsky, Mortensen, Nord and Wilson2011a) reported with spring-applied poultry litter at similar rates of total N, suggesting more efficient nutrient utilization when poultry manure was applied in the fall rather than in the spring. It is possible higher rates of poultry litter could have further increased cereal rye biomass, as the estimated mineralized fraction of N was below the 72.4 kg ha−1 target (Mirsky et al. Reference Mirsky, Spargo, Curran, Reberg-Horton, Ryan, Schomberg and Ackroyd2017; Penn State Extension 2025). However, to mitigate the risk of excessive soil phosphorus, applying additional poultry manure is not recommended, particularly within the Chesapeake Bay watershed (Ritter Reference Ritter2019; Sharpley et al. Reference Sharpley, Herron and Daniel2007). There was no change in rye biomass with soybean planting date, indicating that in the early-planted soybean, driving planting equipment through the field at cereal rye boot to heading stage did not significantly disrupt cereal rye growth.
Predicted effects of fall-applied poultry litter rate (PL; Mg ha−1), soybean planting date (PD), and year (YR) on cereal rye biomass at anthesis (Mg ha−1). The large square points represent estimated marginal means across PDs, and error bars represent standard errors.

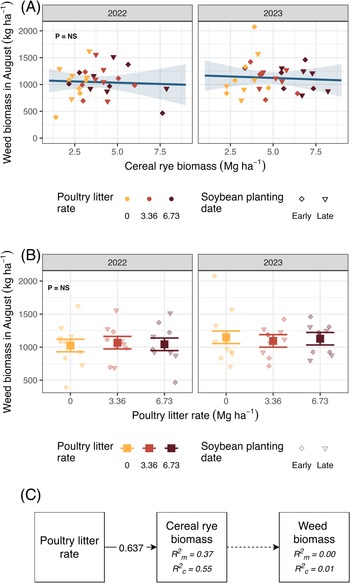
There was no effect of cereal rye biomass at anthesis (P = 0.96) or year (P = 0.27) on total weed biomass in August in the fall fertility experiment. Weed biomass ranged from 390 kg ha−1 to 1,621 kg ha−1 in 2022 and 705 kg ha−1 to 2,074 kg ha−1 in 2023 (Figure 5A). In 2022, weed biomass was composed of 66% S. faberi and 22% A. artemisiifolia, whereas in 2023, weed biomass was composed of 34% S. faberi and 60% A. artemisiifolia. In both years, A. retroflexus and A. theophrasti biomass comprised <0.1% of total weed biomass. Although applying poultry litter significantly increased cereal rye biomass, there was not a corresponding decrease in total weed biomass despite the finding that fall fertility amendments increased cereal rye biomass beyond targeted biomass thresholds (Mohler and Teasdale Reference Mohler and Teasdale1993). However, because the greatest cereal rye biomass was achieved through poultry litter fertilization, it is possible that the weeds also benefited from the greater fertility.
(A) Predicted effects of cereal rye biomass (BIO; Mg ha−1), soybean planting date (PD), and year (YR) on weed biomass in August (kg ha−1). Lines fit using linear mixed-effects model with BIO, PD, YR, and their interaction as fixed effects, and block as a random effect. Shaded bands are 95% confidence intervals, and points are individual observations. (B) Predicted effects of poultry litter rate (PL; Mg ha−1), soybean planting date (PD), and year (YR) on weed biomass in August (kg ha−1). The large square points represent estimated marginal means across PDs, and error bars represent standard errors. (C) Piecewise structural equation model (PSEM) results. Solid lines indicate significant relationships, and dashed lines indicate nonsignificant relationships. Numbers on lines indicate partial regression coefficients for statistically significant relationships. R2 m represents variance from fixed effects only; R2 c is the combined variance from fixed and random effects.

There was no direct effect of poultry litter rate (P = 0.99), soybean planting strategy (P = 0.53), or year (P = 0.32) on total weed biomass in August (Figure 5B). However, in the highest rate poultry litter treatment, there were fewer weeds (Supplementary Figure S1). Therefore, the greater mulch biomass reduced total weed recruitment, but individual weeds that survived were larger, likely due to higher fertility levels.
The results of the PSEM confirm that while poultry litter increased cereal rye biomass, there was no effect of cereal rye biomass on weed biomass (Figure 5C). We present the results of the unsaturated PSEM, because the results of Fischer’s C test indicated P > 0.05, implying that the unsaturated model is supported by the data, and we therefore failed to reject the unsaturated model. Thus, the addition of a causal pathway between poultry litter rate and weed biomass did not improve the model fit.
Soybean establishment was significantly impacted by soybean planting strategy (P = 0.008), but not by poultry litter rate (P = 0.16) or year (P = 0.36). The interaction of planting strategy and year was marginally significant (P = 0.07; Figure 6A). Planting green (early) reduced establishment compared with the roll-planted (late) soybean. Previous research found no significant effect of rolling-crimping soybean postemergence on soybean establishment, although similar to this study, soybean establishment trended lower in the early-planted soybean treatments in one year (Silva and Vereecke Reference Silva and Vereecke2019).
Predicted effects of poultry litter rate (PL; Mg ha−1), soybean planting date (PD), and year (YR) on (A) soybean establishment and (B) soybean yield. The blue square points in A represent estimated marginal means across PL, and error bars represent standard errors. In B, the large points represent estimated marginal means in the early (diamond) and late (triangle) soybean planting strategies.

Soybean yield was significantly affected by poultry litter rate (P < 0.001), soybean planting strategy (P = 0.05), and year (P < 0.001). There was a significant interaction between poultry litter rate and year (P = 0.003), and a significant three-way interaction between poultry litter rate, soybean planting strategy, and year (P = 0.02; Figure 6B). In 2022, yield was on average 102 g m−1 row, and in 2023, yield was on average 194 g m−1 row. Tukey’s contrasts indicated no differences between treatments in 2022, but in 2023, in the unfertilized control, the planted green soybean yield was lower than the late-planted soybean yield. There were no differences between yield of the soybean planting strategies within the fertilized cereal rye treatments. In 2023, the yield of soybean planted into rye that received the intermediate, 2.26 Mg ha−1 poultry litter was the greatest, and the yield of soybean planted into rye that received the highest poultry litter rate yielded the lowest.
Soybean yield tended to mirror the trends observed in soybean establishment rate in 2023, where treatments with the lowest establishment tended to yield the lowest grain, and as establishment increased, soybean yield increased (Supplementary Figure S2). In 2023, yield was also lowest when fall fertility was greatest, indicating that greater residual N from poultry litter may exacerbate the effects of low establishment rates, potentially by reducing the relative competitiveness of soybean compared with the weeds.
Notably, the proposed benefit of soybean planted before rolling-crimping is that the soybean growing season is extended because cover crop phenology does not delay soybean planting. We did not find evidence of this yield benefit. Particularly in 2023, when soybean was planted in April, the cool, wet conditions resulted in stunted growth, and 1 mo after planting, soybean had only reached the VC growth stage. Previous studies suggest that these conditions may promote soybean seedling disease (Hartman et al. Reference Hartman, Pawlowski, Herman and Eastburn2016). Given these constraints, and the lack of yield improvement with early-planted soybean, we do not recommend this production practice.
Management Implications
Across both studies, we did not find consistent evidence that cultural management practices can increase biomass-related weed suppression when cereal rye is sown in later than optimal fall establishment windows after corn grain harvest. This further enforces the limitations of the corn–soybean–wheat crop rotation when relying on cereal rye mulch as the sole means of weed suppression in organic no-till soybean production.
Increasing cereal rye seeding rate up to 168 kg ha−1, while relatively ineffective at increasing cereal rye biomass, did improve season-long weed suppression through the soybean growing season and may be a worthwhile practice when weed control is a top concern. We do not recommend grid seeding cereal rye, as the additional field operations did not improve rye biomass, weed suppression, or soybean yield. Fertilizing cereal rye in the fall increased cereal rye biomass production, but not weed suppression, and therefore additional weed management tactics are required if achieving high cover crop biomass is desired with this method. Finally, in the 2 yr of our study, we found no advantage to planting soybean before rolling-crimping. While the most successful stand-alone cultural weed management practice in our study was increasing cereal rye seeding rates, we suggest that these practices are most effective when integrated with other weed management tactics.
Recent studies on integrated weed management in organic no-till soybean indicate that the addition of supplemental weed control post-soybean emergence may be a viable way of reducing the shortcomings of this crop rotation. By alleviating the impetus for a high biomass cereal rye mulch as the sole means of weed suppression, cereal rye can still be sown following field corn. Integrating additional tactics also provides an opportunity to control weeds that may emerge before rolling-crimping, such as A. artemisiifolia and S. faberi. For example, high residue cultivation can leave the cover crop mulch relatively undisturbed while reducing weed biomass between soybean rows (Wallace et al. Reference Wallace, Williams, Liebert, Ackroyd, Vann, Curran, Keene, VanGessel, Ryan and Mirsky2017). More recent methods, such as interrow mowing or weed electrocution, also minimize soil disturbance while targeting weeds that have escaped the cover crop mulch (Rowland et al. Reference Rowland, Menalled, Pelzer, Sosnoskie, DiTommaso and Ryan2023). Future studies may consider the integration of our investigated cultural management practices, including increased cereal rye seeding rate and use of fall fertility amendments, with supplemental weed control tactics within the soybean growing season.
Acknowledgments
The authors thank Tosh Mazzone, Jared Adam, Hanna Wells, Abbe Hamilton, Noelle Connors, Grant Hoffer, Megan Czekaj, and Cody Smith for assisting in the completion of this project.
Supplementary material
To view supplementary material for this article, please visit https://doi.org/10.1017/wsc.2026.10128
Funding statement
This work was supported by the USDA National Institute of Food and Agriculture, Organic Research and Education Initiative (OREI) 2020-51300-32378.
Competing interests
The authors declare no conflicts of interest.



 Open access

