

Introduction
Type 2 diabetes (T2D) disproportionately impacts racial and ethnic minority groups, including the Marshallese community, a Pacific Islander subpopulation. T2D prevalence among Marshallese adults ranges from 20% to 40%, compared to 12% in the general US adult population [Reference McElfish, Hallgren, Henry, Ritok, Rubon-Chutaro and Kohler1]. In Northwest Arkansas, home to the largest Marshallese population in the continental US (approximately 15,000 per the 2020 Census) [2], 38.4% of Marshallese adults have T2D, versus about 11% among all Arkansas adults [3]. These disparities underscore the urgent need for culturally tailored interventions to support effective diabetes management in this community.
Diabetes self-management education (DSME) [Reference Bekele, Negash and Bogale4,Reference Ernawati, Wihastuti and Utami5] is an evidence-based program designed to equip individuals with the knowledge and skills to manage T2D outside clinical settings. Given that most people with T2D see their healthcare providers only two to four times annually for 12–20 minutes per visit [Reference Berk6], DSME plays a critical role in reinforcing self-management behaviors [Reference Funnell, Brown and Childs7]. The DSME curriculum encompasses eight core content areas [Reference Davis, Fischl and Beck8]: the pathophysiology of diabetes and treatment options, healthy coping, healthy eating, being active, taking medication, monitoring, reducing risk, and problem solving and behavior change strategies. The 2022 National Standards for DSMES [Reference Davis, Fischl and Beck8] highlight the importance of person-centered care (Standard 5) in promoting health equity among diverse populations [Reference Blanchette, Aaron, Allen and Litchman9].
Culturally tailored DSME programs have shown success in improving engagement in behavioral change, disease management, treatment adherence, and uptake by aligning educational content with cultural beliefs, practices, and languages [Reference Navodia, Wahoush, Tang, Yost, Ibrahim and Sherifali10]. For example, a study with Native Hawaiians and Pacific Islanders reported high satisfaction (87%) with a culturally adapted DSME [Reference Sinclair, Zamora-Kapoor, Townsend-Ing, McElfish and Kaholokula11], while another found significant reductions in hemoglobin A1c (HbA1c) and body mass index (BMI) among Marshallese participants and their family members after receiving DSME delivered by Marshallese community health workers (CHWs) in church settings [Reference McElfish, Rowland and Hall12].
Cost-effectiveness studies using simulation modeling approaches have supported DSME’s value. One example is a 6-month peer-led DSME followed by a 6-month CHW-led intervention, which showed an incremental cost-effectiveness ratio (ICER) of $31,975 per quality-adjusted life-year (QALY) gained over 20 years [Reference Ye, Kuo and Kieffer13], compared to enhanced usual care. Moreover, Brownson et al. reported an ICER of $55,478 per QALY of diabetes self-management programs, compared to no intervention, with a lifetime time horizon [Reference Brownson, Hoerger, Fisher and Kilpatrick14]. Another simulation study indicated an ICER of $451 per QALY for a CHW-led DSME program, over 20 years [Reference Prezio, Pagán, Shuval and Culica15].
Despite this evidence [Reference McElfish, Rowland and Hall12,Reference McElfish, Long and Kohler16–Reference Williams, Utz, Hinton, Yan, Jones and Reid18], limited data exist on the cost and cost-effectiveness of culturally tailored DSME programs, which are critical for guiding program adoption, implementation, and sustainability. To address this gap, this study aimed to (1) describe resource use and associated costs with implementing a culturally tailored DSME (adapted DSME) among Marshallese individuals and (2) assess its cost-effectiveness compared to standard-model DSME (standard DSME), using data from a community-based randomized controlled trial (RCT) [Reference McElfish, Long and Kohler16].
Materials and methods
Study design
Using retrospective data collected during the trial period, we estimated the cost of implementing adapted DSME compared to standard DSME in the community settings (e.g., participants’ home for adapted DSME and a community center for standard DSME). We further conducted a within-trial cost-effectiveness analysis (CEA), with reporting following the Consolidated Health Economic Evaluation Reporting Standards [Reference Husereau, Drummond and Augustovski19]. The DSME trial was approved by the University of Arkansas for Medical Sciences Institutional Review Board (IRB), and all participants provided informed consent prior to enrollment. The present study was determined to be exempt from IRB review.
Overview of the DSME trial
The adaptation process for DSME [Reference Yeary, Aitaoto and Sparks20], trial design and protocol [Reference Yeary, Long, Bursac and McElfish21], and primary results [Reference McElfish, Long and Kohler16] have been documented in details elsewhere. In brief, the community-based RCT compared an adapted DSME with a standard DSME among Marshallese individuals with a T2D diagnosis in Washington and Benton Counties, Arkansas, between May 2015 and May 2018. Inclusion criteria were Marshallese adults (aged 18 years and older) who self-reported a T2D diagnosis made by a health care provider, further confirmed by a baseline HbA1c level of ≥6.5%. Assessments were conducted at baseline, immediately post-intervention (approximately 9 weeks), and 6 and 12 months after the intervention.
A total of 221 individuals were randomized to the adapted DSME arm (n = 110) or the standard DSME arm (n = 111) (see Table S1 for the baseline characteristics of the trial participants). Participants assigned to the adapted DSME, which emphasizes family support, were required to invite adult family members to participate in the study to help enhance self-management skills. Sessions were delivered in participants’ homes by a bilingual, bicultural CHW, who covered eight core self-care elements aligned with the recommendations of American Diabetes Association’s and the American Association of Diabetes Educators. A certified diabetes educator (CDE) attended each session and was available for consultation if needed. The adapted DSME curriculum was developed over 7 months through weekly meetings and 3 half-day planning sessions [Reference Yeary, Aitaoto and Sparks20].
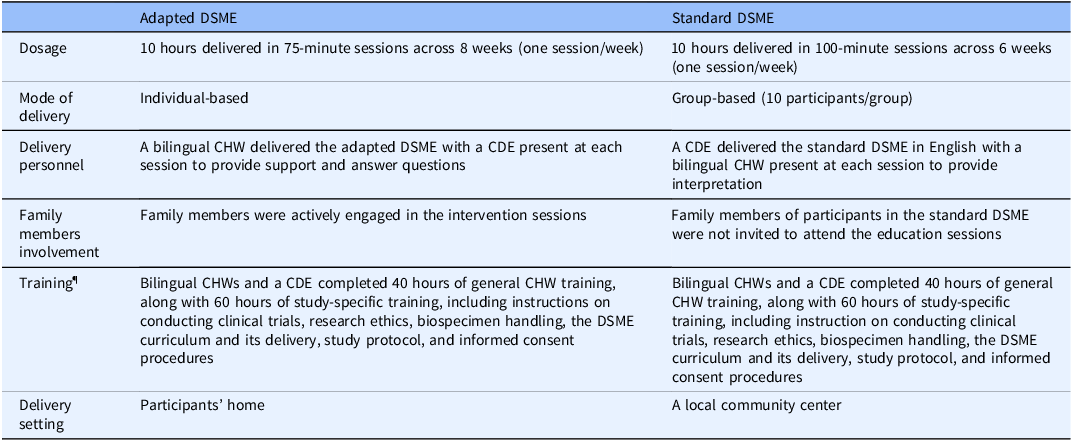
Participants in the standard DSME received similar eight core self-care elements, delivered at a community center by a CDE coupled with a bilingual CHW present at each session. The group-based standard DSME consisted of 8–14 participants per session. Table 1 highlights the differences between the adapted DSME and standard DSME models, specifically in terms of delivery mode and content.
Program description of adapted DSME and standard DSME

DSME = diabetes self-management and education; CDE = certified diabetes educator; CHW = community health worker.
¶Study-specific training was excluded from the program cost calculation.
Perspective and time horizon
We assessed the cost analysis and CEA from the perspective of small-scale stakeholders [Reference Jones Rhodes, Ritzwoller and Glasgow22], such as community implementation teams, over a one-year time horizon. Given the short timeframe, costs and effects were not discounted.
Cost measures
DSME program costs were categorized into labor and non-labor expenses, excluding research administration, data collection, and outcome assessment costs. We applied an activity-based costing approach [Reference Raghavan23], as most components of the DSME programs were activity-driven. All costs were adjusted to 2023 US dollars using the Consumer Price Index (CPI) [24], by multiplying the original cost data by the ratio of the 2023 CPI to the 2018 CPI, or to the CPI of the respective year in which the cost data were obtained, especially for non-labor costs.
Labor costs
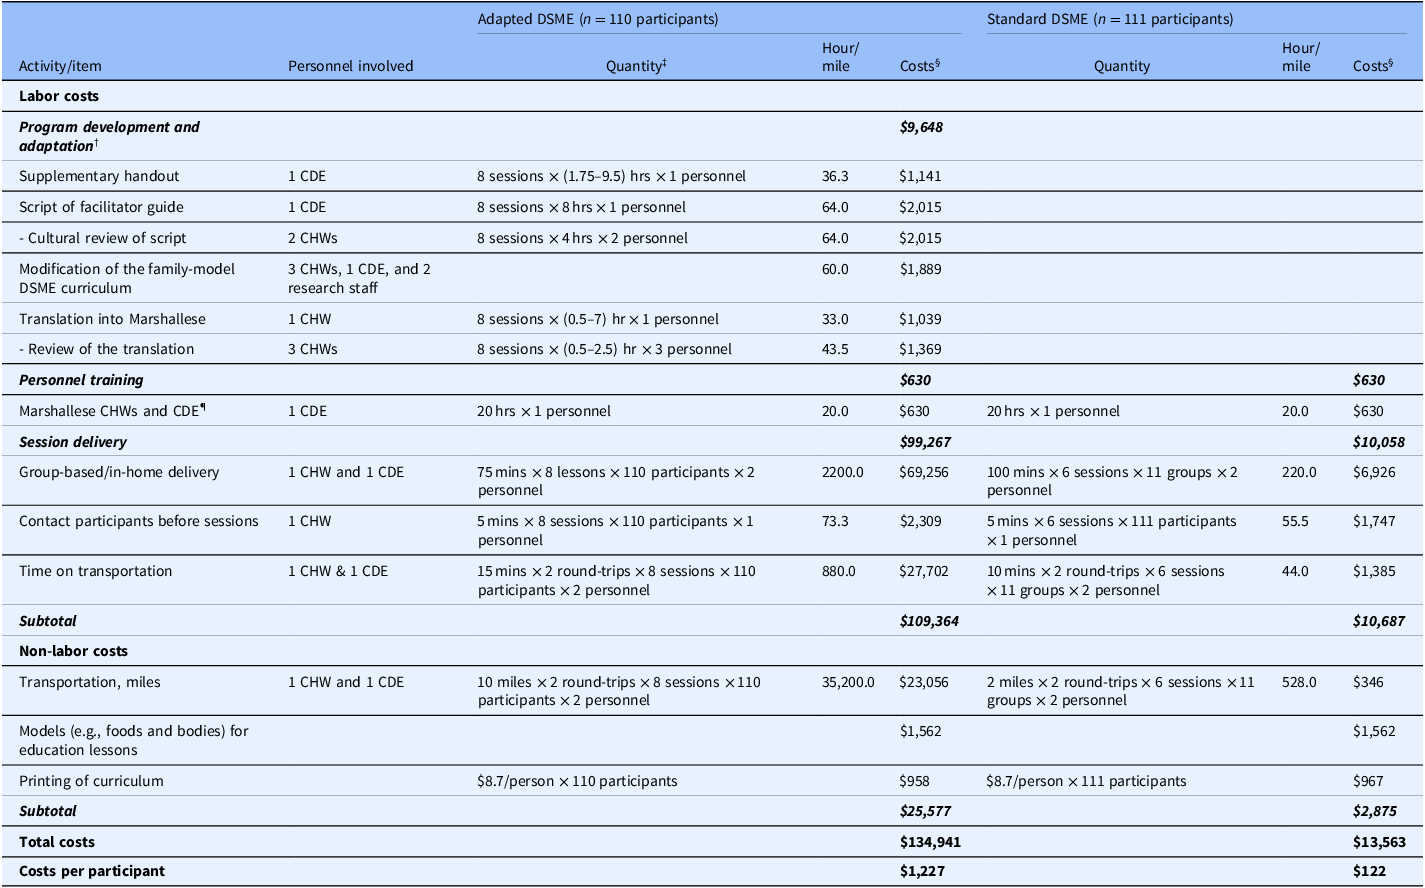
We calculated labor costs by multiplying the time (in hours) spent on each activity by the hourly wage of the personnel involved. Activities and time allocations associated with DSME program implementation were identified by two project coordinators and verified by the study’s principal investigator. Table 2 outlines the key activities for each DSME model, including program development and adaptation, personnel training, session delivery, staff roles, resource quantities, and estimated times (or miles) required for each activity. To minimize geographic variations in wage rates when interpreting the results, and considering that different occupations or personnel may be involved in program implementation (e.g., CHWs, CDEs, registered dietitians), we applied the 2023 national average hourly rate of $31.48 [25] for all personnel involved in implementation activities. Additionally, because detailed quantity data for each activity are provided in this study, stakeholders can easily adapt total cost estimates using local wage rates. Transportation costs incurred by study participants, including family members in the adapted DSME, such as time and mileage, were not included in the analysis.
Activities, associated personnel, time requirement, and cost estimates for the adapted DSME and standard DSME

DSME = diabetes self-management education; CDE = certified diabetes educator; CHW = community health worker.
†No program development and adaptation activity occurred in the standard DSME group.
‡Values in paratheses indicated the range of times spent across eight sessions.
¶Bilingual CHWs and a CDE received 40 hours of general CHW training in a single session, regardless of intervention group. As a result, training costs were shared equally across two intervention groups.
§A 2023 national average hourly rate of $31.48 [25] was applied for all personnel involved in implementation activities, along with the standard mileage rate of $0.655 per mile [26].
Non-labor costs
Non-labor costs included actual expenses for items such as printing, foods, and body models used during education sessions, and transportation mileages incurred by the study personnel. These costs were based on receipts, invoices, or administrative datasets (Table 2). Additionally, transportation costs were calculated using the standard mileage rate of $0.655 per mile [26]. Overhead or space costs were excluded, as the DSME sessions were conducted either in participants’ homes or at a local community center that was available free of charge.
Effectiveness measures
The primary outcome examined in the comparative effectiveness trial of adapted DSME versus standard DSME was the change in HbA1c (%) from baseline to immediately after, 6 months after, and 12 months after the intervention [Reference McElfish, Long and Kohler16]. We used the change in HbA1c from baseline to 12 months post-intervention as the primary effectiveness measure for the CEA, aligning with the one-year time horizon. Secondary outcomes included changes in BMI (kg/m2), total cholesterol (mg/dL), and high-density lipoprotein (HDL; mg/dL) cholesterol over the same period. Of note, the results of these effectiveness outcomes are summarized in Table S2, based on data reported in a previous publication [Reference McElfish, Long and Kohler16].
Data analysis
We performed descriptive analyses to estimate total program costs, labor costs (including program adaptation, personnel training, and session delivery), and non-labor costs for each DSME model.
Cost-effectiveness analysis
The CEA was conducted using an ICER metric [Reference Raghavan23], comparing differences in costs and effectiveness (i.e., HbA1c, BMI, total cholesterol, and HDL cholesterol) between adapted DSME and standard DSME. The results were interpretated as the cost per additional unit reduction in HbA1c, BMI, and total cholesterol, and per additional unit increase in HDL cholesterol, comparing the adapted DSME to the standard DSME. Notably, ICER results were calculated regardless of the statistical significance of the effectiveness measures, in line with the view that adoption decisions should be guided by potential mean net benefits, rather than arbitrary rules of inference [Reference Claxton27,Reference Michaud, You and Estabrooks28]. Additionally, we conducted a separate CEA excluding the program adaptation cost in the adapted DSME model to evaluate program sustainability. Notably, we did not present the 95% confidence interval (CI) for the CEA results associated with negative outcomes, particularly those that were not statistically significant, and, consequently, negative ICERs. This decision was made because a negative ICER can be interpreted in two opposing ways: as cost-saving (i.e., the intervention is more effective and less costly than the comparator), or as indicative of negative health outcomes – as was the case in our study [Reference Black29].
Sensitivity analysis
A one-way deterministic sensitivity analysis was performed to estimate the potential replication costs [Reference Michaud, You and Estabrooks28,Reference Michaud, Estabrooks and Dai30–Reference Michaud, Wilson, Silva, Almeida, Katula and Estabrooks32] of the adapted DSME model, excluding adaptation-related costs that may not be necessary, if implemented in other community settings or maintained in the current context. The analysis also assessed cost variations attributable to individual activities or cost categories. Specifically, we varied the unit costs, such as hourly wage rates for labor-related activities (e.g., personal training and session delivery), and non-labor cost items outlined in Table 2 by ±50% to establish plausible lower and upper cost bounds [Reference Michaud, You and Estabrooks28,Reference Briggs, Weinstein and Fenwick33,Reference Michaud, Wilson, Katula, You and Estabrooks34]. The sensitivity analysis results, showing how total replication costs of the adapted DSME varied across different cost ranges for specific activities or items, were visualized using a tornado diagram. All analyses were performed using Microsoft Excel for Microsoft 365, version 2308.
Results
DSME program costs
Table 2 outlines a detailed breakdown of labor activities, associated personnel, non-labor categories, the corresponding time, and cost estimates for the DSME programs. The total program costs were estimated at $134,941 for the adapted DSME and $13,563 for the standard DSME. For the adapted DSME, costs were distributed as follows: $9,648 (7%) for program adaptation, $630 (0.5%) for personnel training, and $99,267 (74%) for session delivery. In comparison, costs for the standard DSME were $630 (5%) for personnel training and $10,058 (74%) for session delivery. The estimated per-unit costs were $1,227 per participant for the adapted DSME and $122 per participant for the standard DSME.
Cost-effectiveness analysis
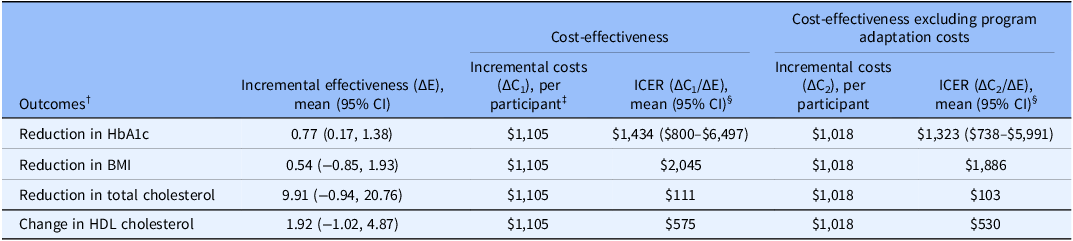
The CEA results, comparing the adapted DSME to the standard DSME, were $1,434 (95% CI: $800–$6,497), $2,045, and $111 for additional unit reduction in HbA1c, BMI, and total cholesterol, and $575 for additional increase in HDL cholesterol (Table 3). In the scenario where program adaptation costs were excluded from the total cost calculation of the adapted DSME, ICERs were $1,323 (95% CI: $738–$5,991), $1,886, and $103 for addition unit reduction in HbA1c, BMI, and total cholesterol, and $530 per additional unit increase in HDL cholesterol.
Cost-effective results of adapted DSME compared to standard DSME

DSME = diabetes self-management education; HbA1c = hemoglobin A1c; BMI = body mass index; HDL = high-density lipoprotein; CI = confidence interval; ICER = incremental cost-effectiveness ratio.
†Data were abstracted from McElfish et al [Reference McElfish, Long and Kohler16]. To indicate the reduction in HbA1c, BMI, and total cholesterol as positive benefits of the intervention and reflected in the ICER calculation, we presented the effect sizes as a positive observation by including the term of “reduced” in front of the name of study outcomes.
‡Incremental cost was calculated as the per participant difference between adapted DSME and standard DSME: $1,227−$122 = $1,105.
§We did not present 95% CI for the ICER of study outcomes with nonsignificant effect sizes, as these may yield negative ICERs, which can lead to ambiguous interpretation, such as the intervention being more costly but less effective, or less costly but more effective, compared to the comparator. For this reason, negative ICERs are typically not reported [Reference Stinnett and Mullahy41].
Replication costs for adapted DSME
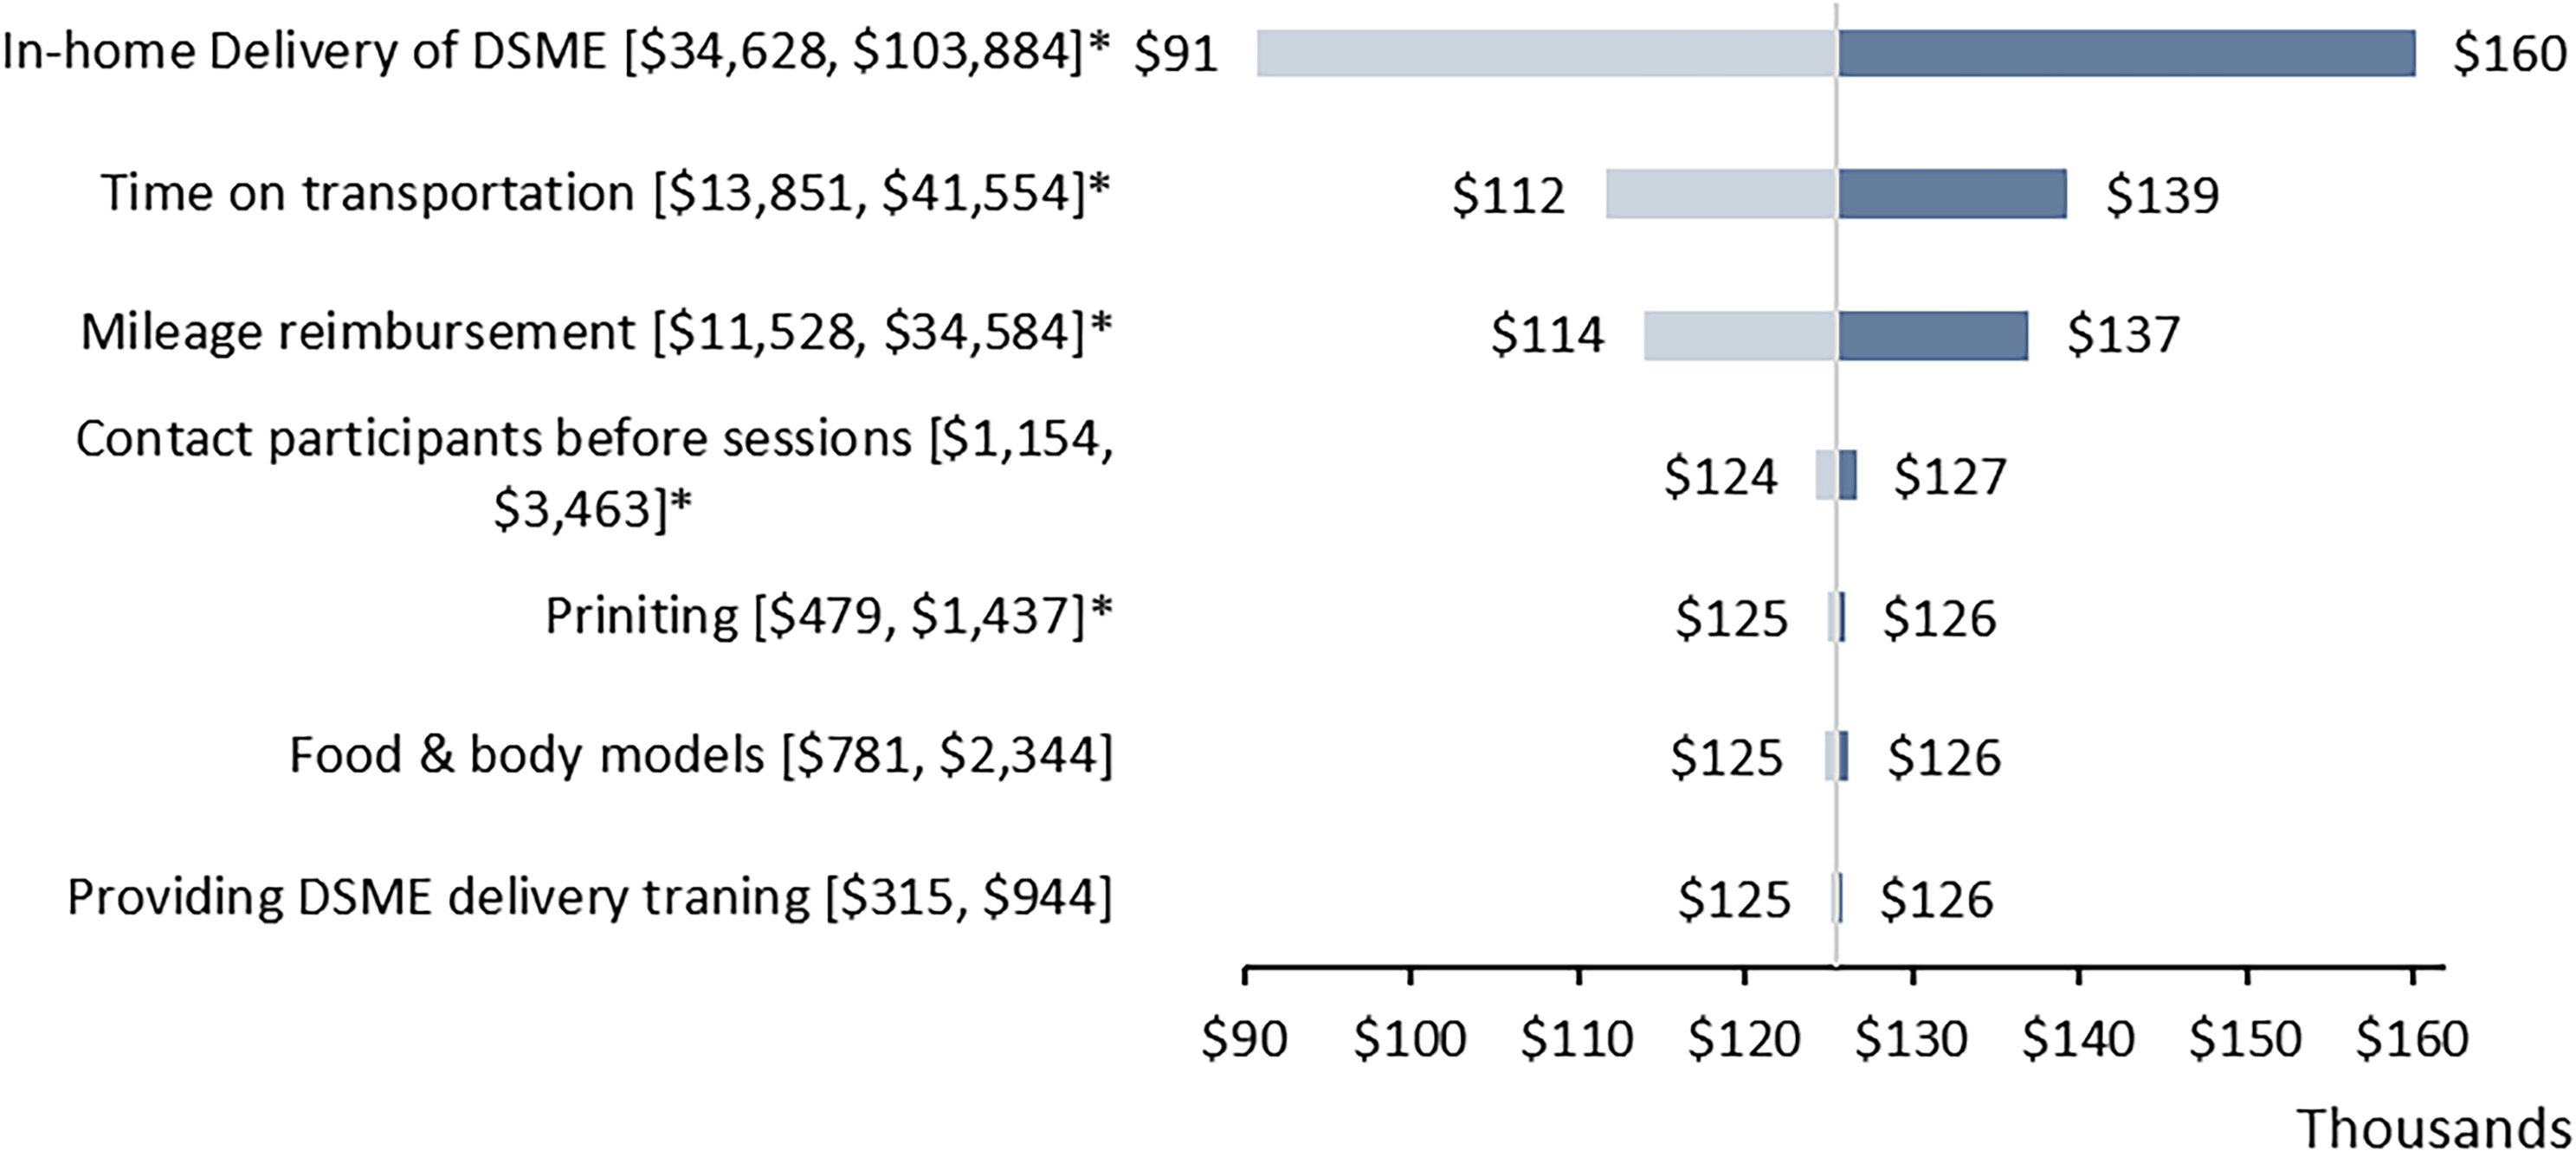
Figure 1 presents a one-way sensitivity analysis using a tornado diagram to illustrate the impact of variations in program implementation activities and non-labor resources on total replication costs. Excluding program adaptation costs, the replication costs for the adapted DSME were estimated at $125,473 (range: $62,737–$188,210). The most significant cost driver was in-home delivery of adapted DSME, which resulted in total program costs ranging from $90,845 to $160,101, followed by CDE’s times on transportation, with the total program cost ranged from $111,622 to $139,324, during the 12-month period.
One-way sensitivity analysis results for the total program costs of adapted DSME by implementation activities or non-labor cost items. Each row shows the changes in costs from the initial replication costs ($125,473). *Indicated that costs of the activities varied by the number of participants (variable cost). Brackets indicated the lower and upper values of the specified activities or cost items. DSME = diabetes self-management education.

Discussion
This study evaluated the cost and cost-effectiveness of a culturally tailored DSME. The total program replication costs of adapted DSME were estimated at $125,473, including a fixed cost of $2,192, covering personnel training and education sessions, regardless of the number of participants enrolled, and a variable cost of $1,121 per participant. Variable costs included $630 for in-home DSME delivery, $21 for participant outreach before sessions, $252 for transportation time, $210 for mileage reimbursement, and $9 for printing education materials. By presenting costs across distinct categories, our findings offer valuable insights into the program’s future sustainability and highlight potential areas for cost reduction to better align with organizational budgets. Consistent with results of a multi-country DSME cost analysis, our study observed that while the overall program cost may be relatively modest, substantial variations can arise from personnel expenses as a result of the time required for implementation activities, which represented as the major cost driver, along with the number of participants enrolled [Reference Doyle, ODonnell and Quigley35]. Moreover, these costs can vary depending on key factors such as the mode of program delivery (group vs individual instruction), delivery personnel (bilingual personnel versus use of an interpreter), and delivery setting (home versus community center).
Our CEA findings are comparable to those from other studies examining the cost-effectiveness of lifestyle modification programs for management, control, or prevention of T2D. For example, a study evaluating a digital diabetes prevention program reported an ICER of $4,739 per 1% (or 10.9 mmol/mol) reduction in HbA1c compared to standard care [Reference Michaud, Wilson, Katula, You and Estabrooks34]. Similarly, a CHW-led home-visit diabetes program reported an ICER of $1,385 per 1% HbA1c reduction (inflated from $1,121 to 2023 US dollars) [Reference Huang, Galárraga, Smith, Fuimaono and McGarvey36], while a telephonic behavioral intervention showed an ICER of $638 per 1% reduction (inflated from $491 to 2023 US dollars), compared to a control group that received only printed diabetes self-management materials [Reference Schechter, Cohen, Shmukler and Walker37]. Given that a 1% HbA1c reduction is associated with an estimated annual saving of $602 in diabetes-related healthcare costs (adjusted from $555 to 2023 US dollars using the medical care CPI) [Reference Lage and Boye38], the adapted DSME program cost of $1,227 per person in our analysis appears modest. Although the benefits may not fully offset costs within the trial period, the program may be cost-effective over a longer horizon [Reference Lian, McGhee, Chau, Wong, Lam and Wong39], as supported by prior simulation studies [Reference Ye, Kuo and Kieffer13–Reference Prezio, Pagán, Shuval and Culica15]. Future research should further explore the long-term economic and health impacts of culturally adapted DSME programs across diverse populations.
Moreover, while the commonly cited willingness-to-pay threshold is $50,000–$150,000 per QALY gained [Reference Neumann and Kim40], there are no universally accepted thresholds for what constitutes a clinically meaningful change in HbA1c, BMI, total cholesterol, or HDL – the effectiveness measures used in the present CEA. As such, it is ultimately up to stakeholders and implementers to determine whether an evidence-based program is cost-effective, based on their specific goals, values, and contextual priorities, particularly in real-world implementation settings.
To the best of our knowledge, this is the first study to evaluate the cost-effectiveness of a culturally tailored, family-model DSME compared to a standard-model DSME, specifically among Pacific Islander populations. Our findings highlight the cost-effectiveness of the adapted DSME in improving HbA1c management among Marshallese adults with T2D living in the US. The primary purpose of this cost analysis and CEA is to inform decision-making for small-scale stakeholders, such as community-based implementers who may be considering the adoption or scaleup of the adapted DSME. A key strength of this study lies in the detailed estimation and transparent reporting of adaptation costs for evidence-based DSME programs, which are often underreported in literature. Although these costs were excluded from replication or maintenance estimates in our sensitivity analysis, they remain an essential component of overall implementation expenses. These costs, typically incurred during the pre-implementation phase, are generally one-time investment; however, they may recur depending on the context or the need for future program customization during implementation.
Limitations
Several limitations should be noted. First, we did not calculate ICERs using QALYs, the standard outcome measure in CEAs, due to insufficient data to directly or indirectly estimate QALYs for study participants. This limits the comparability of our findings with other studies that reported ICERs based on QALYs. However, QALYs may be difficult for some community stakeholders to interpret or effectively communicate during community listening sessions or town hall meetings. In contrast, simpler metrics, such as costs per-unit reduction in HbA1c, BMI, total cholesterol, or HDL cholesterol (regardless of the non-significant results for some measures in the comparative effectiveness trial), may be more intuitive and useful for informing local adoption decisions. Still, setting a threshold for cost-effectiveness on specific outcomes can be challenging and may not always lead to cost-effective decisions. Second, we did not use behavioral change as the effectiveness measure in the CEA due to limitations in data availability, despite it being a unique and program-specific outcome for DSME, as outlined in the 2022 National Standards for DSMES [Reference Davis, Fischl and Beck8]. Third, cost data were collected retrospectively, based on project coordinators’ review of study documents and records, which may introduce recall bias. Although these data were subsequently validated by the principal investigator, some inaccuracies might remain. Fourth, we applied the national average hourly wage rate to estimate labor costs, rather than occupation-specific rates, due to variability in the types of personnel (e.g., titles, roles, or occupations), such as CHWs, CDEs, and registered dietitians, who may implement the program, as well as wage differences across geographic locations. However, the total time associated with each implementation activity is provided in Table 2, allowing stakeholders to readily calculate total program costs based on local wage rates and the specific occupations available within their implementation contexts. Fifth, while we did estimate and report the program adaptation costs, we did not include the cost of training for cultural adaptation specifically. This is because such expertise is expected to be part of the collaborative team’s existing skill set. Communities intending to implement a similar project with a cultural adaptation component are assumed to account for this during the project preparation phase. Finally, our analysis focused on cost and cost-effectiveness relevant to adoption, implementation, and sustainment of evidence-based programs within community settings. We did not exercise a healthcare sector perspective (including medical costs) or societal perspective (including both medical and participant costs, such as time spent on attending education sessions), nor did we use a longer time horizon (e.g., 10–20 years or lifetime) commonly applied in conventional CEAs. Similarly, we did not perform probabilistic sensitivity analyses, which are typical in conventional CEAs, because program costs were estimated at the aggregate level. As such, the distribution of cost data required for these analyses was not available, even though effectiveness data were collected at the individual level.
Conclusion
In this study, we provided detailed cost data for a culturally adapted DSME program and examined its potential sustainability in community settings. Moreover, the adapted DSME is effective in improving glycemic control and might be a potential cost-effective lifestyle intervention for Marshallese individuals with type 2 diabetes.
Supplementary material
The supplementary material for this article can be found at https://doi.org/10.1017/cts.2025.10228.
Author contributions
Tzeyu L. Michaud: Conceptualization, formal analysis, methodology, writing – original draft, writing – review & editing; Daniel Lamprecht-Carson: Writing – original draft, writing – review & editing; Su-Hsin Chang: Methodology, writing – original draft, writing – review & editing; Clare C. Brown: Writing – original draft, writing – review & editing; Jennifer A. Andersen: Writing – original draft, writing – review & editing; James P. Selig: Writing – original draft, writing – review & editing; Philmar Mendoza Kabua: Writing – original draft, writing – review & editing; Pearl McElfish: Funding acquisition, supervision, writing – original draft, Writing – review & editing.
Funding statement
Research reported in this publication was supported by University of Arkansas for Medical Sciences Translational Research Institute funding awarded through the National Center for Advancing Translational Sciences of the National Institutes of Health (UL1 TR003107). Financial support for the study was provided by the Patient-Centered Outcomes Research Institute (grant no. AD-1310-07159). The content is solely the responsibility of the authors and does not necessarily represent the official views of the funders.
Competing interests
All authors declared no competing interests.


 Open access