


I. Introduction
We document two contrasting mutual fund strategies that have implications for mutual fund selection and offer insight into fund managers’ stock selections. Colloquially, and descriptively, we label these strategies as “Swinging for the Fences” (SF) and “Batting for Average” (BA). “Swinging for the Fences” describes funds that hold a relatively large number of stocks that are “home runs” and/or “strikeouts,” which we define as holdings with extreme relative returns. In contrast, “Batting for Average” describes funds that try to beat the market with the most holdings possible, regardless of the amount by which they beat the market.Footnote 1 We provide evidence that SF and BA are mutual fund strategies that affect flows, expenses, and volatility, but not risk-adjusted returns, thereby providing insight into the incentives and decisions of fund managers.
Our hypothesis is that a fund strategy that picks stocks that beat the market more often differs from a strategy that leads to a small number of stocks that end up as big winners or big losers. Consistent with our hypothesis, we find that the SF and BA strategies are persistent over time and after conditioning on other fund characteristics.Footnote 2 Furthermore, we find that SF and BA are not explained by common measures of active management or by a comprehensive list of 211 asset-pricing factors, leading us to conclude that SF and BA are likely deliberate and distinct stock-picking strategies. Our article makes several contributions to the large literature on mutual fund managers’ portfolio choices.Footnote 3
We show that swinging for the fences is a persistent fund strategy that leads to extreme relative returns in select holdings. While SF and BA do not offer superior risk-adjusted returns, gross or net of fees, we do find that SF is related to higher fund volatility. Specifically, a 1-standard-deviation increase in our measure of swinging for the fences leads to 23 bps increase in monthly fund return volatility. Funds with no home-run or strikeout holdings have 4 bps lower monthly volatility. At the portfolio level, we find that the portfolio of funds that swings for the fences has a monthly volatility of 3.49%, whereas the portfolio of funds that does not swing for the fences has a volatility of 2.44%, a statistically significant difference of 1.05% (t-stat of 8.69). These results are consistent with and help identify a stock-level strategy that generates higher idiosyncratic fund volatility, similar to that found in Clifford, Fulkerson, Jame, and Jordan (Reference Clifford, Fulkerson, Jame and Jordan2021), which show that fund investors are attracted to funds with high idiosyncratic volatility, even though chasing idiosyncratic volatility does not deliver superior performance.
Our article also complements the literature on lottery-like returns and mutual fund flows. In particular, Agarwal, Jiang, and Wen (Reference Agarwal, Jiang and Wen2020) find that the disclosure of right-tail “lottery stocks” leads to increased fund flows. Similarly, Solomon, Soltes, and Sosyura (Reference Solomon, Soltes and Sosyura2014) show that funds holding stocks with high returns receive higher fund flows, especially when catalyzed by media attention. At the mutual fund portfolio level, Akbas and Genc (Reference Akbas and Genc2020) show that, controlling for last year’s performance, extreme fund returns in 1 month during the year are associated with higher mutual fund flows in the future.
While complementary, we provide evidence of a mutual fund strategy choice, in contrast to investors’ reactions to lottery-like returns. We also employ a distinct definition of extreme holdings’ performance. We consider a stock to be a home run if its quarterly relative performance is exceptional, defined as being in the 90th percentile relative to its Fama–French peers. In contrast, Agarwal et al. (Reference Agarwal, Jiang and Wen2020) define lottery-like performance as an extreme daily holding return, regardless of quarter-end performance, whereas Akbas and Genc (Reference Akbas and Genc2020) focus on an extreme monthly fund return. These differences matter. We show that just one out of every seven home runs would be defined as a lottery stock, confirming that SF is measuring something distinct relative to prior measures of lottery stocks.
We also find that SF funds are more likely to specifically mention their home runs and strikeouts in their annual shareholder reports, particularly when these holdings have a larger positive economic impact on fund returns. These disclosures of specific home runs and strikeouts in annual reports lead to even higher flows into the funds. This suggests a role for salience, similar to that created by the media in Solomon et al. (Reference Solomon, Soltes and Sosyura2014), generated by fund managers’ disclosures of home runs and strikeouts. Our SF measure also extends the literature by showing that investors not only chase funds with more home runs but also withdraw capital from funds with too many strikeouts, which contrasts with the lottery stock/fund literature that has naturally focused on positive extreme performance.
Consistent with the hypothesis that younger funds and early-career managers have stronger incentives to stand out among the competition, we find that younger funds and, in some of our tests, early-career managers are more likely to employ the more flamboyant SF strategy. This complements the findings of Chuprinin and Ruf (Reference Chuprinin and Ruf2018), who show that mutual fund flows are sensitive to portfolio composition in the years immediately after fund inception. Furthermore, as funds grow older, the likelihood of holding stocks that are strikeouts decreases at a significantly higher rate than the rate of hitting home runs, suggesting that funds learn to pick potential home runs more efficiently. This finding highlights the role of experience in mutual fund performance (Chevalier and Ellison (Reference Chevalier and Ellison1999), Kempf, Manconi, and Spalt (Reference Kempf, Manconi and Spalt2017)).
Moreover, we find that SF and BA strategies both suffer from diseconomies of scale. Berk and Green (Reference Berk and Green2004) argue that liquidity constraints challenge active managers and lead to decreasing returns to scale in active mutual funds.Footnote 4 Yan (Reference Yan2008) and Pollet and Wilson (Reference Pollet and Wilson2008) identify factors that contribute to diseconomies. Yan (Reference Yan2008) finds larger diseconomies among funds that primarily invest in small-cap stocks and funds with higher turnover, while Pollet and Wilson (Reference Pollet and Wilson2008) show that large, growing funds diversify their portfolios to reduce the negative effect of portfolio size on performance. In larger funds, we observe more frequent strikeouts relative to smaller funds. This is consistent with large fund managers having to select less favored stocks in order to fully invest more total net assets.
We also find that funds with a focus on institutional clients are less likely to swing for the fences relative to funds that focus on retail clients. This finding is consistent with Del Guercio and Reuter (Reference Del Guercio and Reuter2014) and Barber, Huang, and Odean (Reference Barber, Huang and Odean2016), who find that investors in funds that are directly sold are more sophisticated than investors in broker-sold funds. Retail funds’ tendency to swing for the fences is consistent with the well-documented fact that retail investors are attracted to stocks with extreme returns (Kumar (Reference Kumar2009), Kumar, Page, and Spalt (Reference Kumar, Page and Spalt2011), Conrad, Kapadia, and Xing (Reference Conrad, Kapadia and Xing2014), and Bali, Brown, Murray, and Tang (Reference Bali, Brown, Murray and Tang2017)).
The economic impact on flows associated with the SF strategy is meaningful. A 1-standard-deviation increase in SF is associated with 18 bps increase in fund flows. For the average-sized fund, the effect translates to $8.4 million in additional fund flows each quarter. Furthermore, the effect of home runs and strikeouts on capital flows is more than twice as large when funds specifically mention the stocks that were large contributors or detractors to performance in the managerial commentary section of the annual shareholder report. This is consistent with the SF strategy, providing managers with salient talking points that influence flows.
The SF strategy may also help to understand mutual fund fees. It is puzzling that actively managed equity funds generally have higher fees and commonly generate poor net-of-expense performance relative to low-fee funds (Cooper, Halling, and Yang (Reference Cooper, Halling and Yang2021), Sheng, Simutin, and Zhang (Reference Sheng, Simutin and Zhang2023)). Yet funds with high fees continue to exist and, to do so, must attract investors’ attention (Christoffersen and Musto (Reference Christoffersen and Musto2002), Elton, Gruber, and Busse (Reference Elton, Gruber and Busse2004), and Hortaçsu and Syverson (Reference Hortaçsu and Syverson2004)). Gil-Bazo and Ruiz-Verdú (Reference Gil-Bazo and Ruiz-Verdú2009) offer a model of the mutual fund industry in which high-fee funds strategically target unsophisticated investors who are more responsive to advertising. We contribute by showing that swinging for the fences is a common strategy among funds that target retail investors who are more likely to respond to a simple signal like a home run. We also find that SF funds have meaningfully higher expense ratios. A 1-standard-deviation increase in swinging for the fences is associated with 3.7 bps higher fees.
Our article also contributes to the literature that studies the determinants of capital flows to mutual funds. Del Guercio and Tkac (Reference Del Guercio and Tkac2008) show that changes in Morningstar ratings lead to changes in fund flows, while Kaniel and Parham (Reference Kaniel and Parham2017) find that investors allocate more flow to funds that are featured in the media than to funds with otherwise similar performance. Hillert, Niessen-Ruenzi, and Ruenzi (Reference Hillert, Niessen-Ruenzi and Ruenzi2025) show that fund flows are influenced by the tone and writing style of funds’ annual shareholder letters. Ben-David, Li, Rossi, and Song (Reference Ben-David, Li, Rossi and Song2022) show that mutual fund investors rely on simple signals such as fund rankings and likely do not engage in sophisticated risk-adjustments when allocating their capital. Our article adds to this literature by showing that the simple presence of past home runs and strikeouts in the funds’ portfolio significantly affects fund flows, and manager disclosures of the specific home runs magnify the impact.
Finally, we conduct falsification tests in a sample of passively managed funds to rule out the conjecture that our measures are artifacts of the data. If swinging for the fences and batting for average are two intentional active investment strategies, then passive funds with no incentives to pursue stock-picking strategies should not exhibit the relations we find among actively managed funds. We find no robust evidence that returns, volatility, flows, or fees are related to the SF or BA measures in passive funds. These tests support the hypothesis that SF and BA strategies are intentional among actively managed mutual funds and not merely artifacts of the data.
Our article is organized as follows: Section II explains the data and variables and reports the descriptive statistics. Section III examines the persistence and marketing of the strategies as well as their relation with other fund characteristics and active management metrics. Section IV examines the performance implications of the strategies. Section V studies funds’ incentives to pursue the strategies, including fund flows and fees. Section VI provides our falsification tests that use passively managed fund data. Section VII concludes.
II. Data, Variable Construction, and Summary Statistics
A. Data and Sample Construction
Our sample includes quarterly observations for actively managed U.S. equity mutual funds appearing in the CRSP Mutual Funds data set and Morningstar Direct between 1993 and 2020. Following Pástor et al. (Reference Pástor, Stambaugh and Taylor2015), we cross-check returns and size using CRSP and Morningstar. To be included in our sample, funds must appear in both CRSP and Morningstar, and their returns and size must correspond closely.Footnote
5 For funds with multiple share classes, we aggregate the data at the fund level by asset-weighting across share classes. We restrict the sample to funds whose Morningstar category falls within the Morningstar $ 3\times 3 $
style box.Footnote
6 This restriction excludes nonequity funds, international equity funds, and industry-sector funds. We exclude funds that have less than 12 quarters of data and have less than $15 million in assets under management. We compute benchmark-adjusted returns as a fund’s returns in excess of returns on its benchmark assigned by Morningstar. Since the benchmark assignments are made by Morningstar rather than the funds themselves, there is less concern about manipulation of self-reported benchmarks in the fund’s prospectus (Sensoy (Reference Sensoy2009)).
$ 3\times 3 $
style box.Footnote
6 This restriction excludes nonequity funds, international equity funds, and industry-sector funds. We exclude funds that have less than 12 quarters of data and have less than $15 million in assets under management. We compute benchmark-adjusted returns as a fund’s returns in excess of returns on its benchmark assigned by Morningstar. Since the benchmark assignments are made by Morningstar rather than the funds themselves, there is less concern about manipulation of self-reported benchmarks in the fund’s prospectus (Sensoy (Reference Sensoy2009)).
We obtain mutual fund portfolio holdings from the Thomson Reuters Mutual Fund Holdings S12 database, which reports quarterly snapshots of fund holdings in our sample. We use quarterly holdings to construct our strategy measures. Ideally, we would like to observe the precise timing of funds’ trading activity to identify home runs and strikeouts at the trade level: a pair of buy–sell trades with extreme gains or losses, respectively. However, because the data are limited to quarterly holdings reports, we define our strategy measures using portfolio holdings at the beginning of a quarter that are followed by extreme performance in the subsequent quarter. We are confident that holding-level measures capture mutual funds’ strategy. First, holdings reflect managers’ intentional portfolio choices and their ex ante expectations of future performance. Second, changes in quarterly holdings are the direct result of trades made by the fund during the quarter.
B. Swing for the Fences and Bat for Average Strategy Measures
At the end of each quarter, we estimate home runs (HR), strikeouts (SO), and batting average (BA) as a fraction of the total stocks held by the fund at the beginning of that quarter. For each fund at the end of each quarter, HR, SO, and BA are defined as the number of stocks held by the fund at the beginning of the quarter that become home runs, strikeouts, and hits by the end of that quarter. A stock is identified as a home run or a strikeout if its portfolio-adjusted quarterly return is in the 90th or 10th percentile of the return distribution in the calendar quarter, respectively. A stock is identified as a hit if its portfolio-adjusted quarterly return is positive, meaning it beats its benchmark portfolio. The benchmark portfolio for each stock is its corresponding Fama–French 25 (“FF25”) portfolio, which is determined by the book-to-market ratio and market capitalization. The FF25 benchmark controls for the fact that small-cap and growth firms are naturally more likely to deliver extreme returns. As a result, stocks designated as HR, SO, or beating their benchmark do so with respect to peer stocks with similar market capitalization and book-to-market ratios.
We also define three additional variables. First, we define HR + SO in a quarter as a measure of swinging for the fences. Second, we define HR − SO, as the spread between the two measures. HR − SO measures how successful a fund is at swinging for the fences by delivering more home runs than strikeouts. Last, we define $ \unicode{x1D7D9} $
(HR + SO = 0) as a dummy variable that takes the value of 1 if the fund has no home runs and strikeouts in the portfolio.
$ \unicode{x1D7D9} $
(HR + SO = 0) as a dummy variable that takes the value of 1 if the fund has no home runs and strikeouts in the portfolio. $ \unicode{x1D7D9} $
(HR + SO = 0) measures a fund’s tendency to just bat for average.
$ \unicode{x1D7D9} $
(HR + SO = 0) measures a fund’s tendency to just bat for average.
Figure 1 illustrates the timing and construction of our measures. Our primary objective is to examine whether past home runs and strikeouts in a fund’s portfolio predict future performance or capital flows. In doing so, we estimate the effect of HR and SO at quarter $ t-1 $
on fund outcomes at quarter
$ t-1 $
on fund outcomes at quarter $ t $
. The construction of our strategy variables at quarter
$ t $
. The construction of our strategy variables at quarter $ t-1 $
is designed to mitigate the impact of potential window dressing on our measures. Specifically, we designate stock
$ t-1 $
is designed to mitigate the impact of potential window dressing on our measures. Specifically, we designate stock $ j $
as a home run in quarter
$ j $
as a home run in quarter $ t-1 $
if its FF25 adjusted return in quarter
$ t-1 $
if its FF25 adjusted return in quarter $ t-1 $
is in the 90th percentile. We only count stock j as a home run or strikeout (
$ t-1 $
is in the 90th percentile. We only count stock j as a home run or strikeout ( $ {HR}_{i,t-1} $
,
$ {HR}_{i,t-1} $
, $ {SO}_{i,t-1} $
) for fund
$ {SO}_{i,t-1} $
) for fund $ i $
, if fund i holds stock
$ i $
, if fund i holds stock $ j $
at quarter-end
$ j $
at quarter-end $ t-2 $
, prior to stock
$ t-2 $
, prior to stock $ j $
’s extreme performance during quarter
$ j $
’s extreme performance during quarter $ t-1 $
. In other words, construction of
$ t-1 $
. In other words, construction of $ {HR}_{i,t-1} $
and
$ {HR}_{i,t-1} $
and $ {SO}_{i,t-1} $
is based on portfolio holdings at quarter
$ {SO}_{i,t-1} $
is based on portfolio holdings at quarter $ t-2 $
, preventing funds from receiving credit for purchasing stock
$ t-2 $
, preventing funds from receiving credit for purchasing stock $ j $
during or after the extreme relative returns.
$ j $
during or after the extreme relative returns.
Figure 1 describes the timing and process of defining home runs (HR), strikeouts (SO), and batting average (BA). In quarter $ t-2 $
, we record fund holdings. Then, we observe each holding’s portfolio-adjusted return during the following quarter (i.e., returns from
$ t-2 $
, we record fund holdings. Then, we observe each holding’s portfolio-adjusted return during the following quarter (i.e., returns from $ t-2 $
to
$ t-2 $
to $ t-1 $
). A stock holding is identified as home run or strikeout if its portfolio-adjusted quarterly return is in the 90th or 10th percentile of the return distribution, respectively. A stock is identified as a hit if its portfolio-adjusted quarterly return is positive. For each stock, we use one of the FF25 portfolios, which are based on the book-to-market ratio and market capitalization. Last, for each fund at quarter
$ t-1 $
). A stock holding is identified as home run or strikeout if its portfolio-adjusted quarterly return is in the 90th or 10th percentile of the return distribution, respectively. A stock is identified as a hit if its portfolio-adjusted quarterly return is positive. For each stock, we use one of the FF25 portfolios, which are based on the book-to-market ratio and market capitalization. Last, for each fund at quarter $ t-1 $
, we define HR, SO, and BA as the number of holdings identified as home run, strikeout, and hits during the quarter, scaled by the total number of stocks held by the fund at quarter
$ t-1 $
, we define HR, SO, and BA as the number of holdings identified as home run, strikeout, and hits during the quarter, scaled by the total number of stocks held by the fund at quarter $ t-2 $
. In our estimates, we regress dependent variables of interest at quarter
$ t-2 $
. In our estimates, we regress dependent variables of interest at quarter $ t $
on strategy variables at quarter
$ t $
on strategy variables at quarter $ t-1 $
.
$ t-1 $
.

Our results are robust to a variety of alternative definitions of our variables. First, we define home runs and strikeouts using alternative thresholdsFootnote 7 and find that our estimation results remain very similar regardless of which thresholds are used to define the strategy measures. Second, our conclusions are robust to the adoption of alternative risk adjustments, including using a simple market adjustment and Fama–French 6 portfolios, in place of the FF25 portfolios, to identify extreme-adjusted returns in funds’ stock holdings. Given that home runs and strikeouts identify extreme realized returns, it is not surprising that the specific model of expected returns does not meaningfully impact the stocks that we define as home runs or strikeouts.
We focus on equal-weighted measures of home runs and strikeouts, which put more emphasis on small holdings. We believe this simple characterization of extreme performers is consistent with how investors might notice that a home run is held in the portfolio. For robustness and further insight, we provide additional evidence using alternative weights at the fund-level for HR, SO, and BA. We employ three weighting alternatives that emphasize larger holdings and more extreme returns. Specifically, we define value-weighted HR, SO, and BA using portfolio weights, placing more emphasis on larger portfolio holdings. Second, we use holding returns as weights to compute our measures, allowing more salient extreme performances to carry more weight. Third, we limit the calculation of strategy measures to the top 20 largest holdings to credit funds for holding a home run only if that home run is among the biggest holdings. We find that our results are consistent across these methods.
C. Disclosure Data and Measures
To examine whether mutual funds disclose and advertise their home runs and strikeouts to investors, we collect N-CSR filings of all mutual funds between 2003 and 2020. Form N-CSR was introduced as part of the SEC’s rulemaking following the Sarbanes–Oxley Act of 2002, which sought to enhance corporate responsibility and financial disclosure.Footnote 8 Form N-CSR filings are required for all registered management investment companies, including mutual funds, and provide investors with detailed information about a fund’s performance, holdings, expenses, as well as a management discussion of results.
We are particularly interested in characterizing how fund managers discuss their performance. In the Management Discussion of Fund Performance, fund managers explain in narrative form the key factors that influenced performance. Managerial discussion often covers market and economic conditions, investment strategy, and comparison with benchmarks. The key factors that managers attribute to performance vary wildly. While some managers limit their discussion to industry trends and/or macroeconomic conditions as key factors, some managers will mention specific holdings that were notable contributors or detractors to fund performance. To test the idea that SF strategies can influence flows, we extract from these management discussions cases in which fund managers mention individual stocks they hold. To do so, we collect Form N-CSR filings of all mutual funds in our sample after 2003 from directEDGAR. N-CSR filings are filed at the fund advisor level, meaning that some filings comprise multiple mutual funds’ disclosures. We break these files into fund-specific disclosures. For each filing, we machine-read the Management Discussion of Fund Performance to identify whether the fund managers discussed their home-run and strikeout holdings as key contributors and detractors to performance. We achieve this by comparing these narrative discussions with the names and ticker symbols of home runs and strikeouts in the fund portfolio. We then define two indicator variables, MENTIONED_HR and MENTIONED_SO, which take values of 1 if the fund mentions at least one home run as a contributor and at least one strikeout as a detractor in that year, respectively, and 0 otherwise. In Section C of the Supplementary Material, we provide an example of an N-CSR filing in which the management does not mention holdings as key contributors and an example of an N-CSR filing in which the management specifically highlights home runs.
D. Summary Statistics
Our sample of active mutual funds includes 2,312 unique funds and 114,935 fund-quarter observations from 1993 to 2020. Table 1 reports descriptive statistics for the variables used in our analysis. Consistent with the mutual fund literature, mutual funds deliver 2.65% quarterly gross returns and 2.34% in net-of-fees returns. The sample funds deliver 0.12% and −0.19% in Morningstar benchmark-adjusted quarterly gross and net returns, respectively. Carhart (Reference Carhart1997) four-factor quarterly $ \alpha $
is −0.07%. The average funds’ benchmark-adjusted monthly volatility is 1.68%. The average factor-adjusted monthly volatility is 1.59%.Footnote
9
$ \alpha $
is −0.07%. The average funds’ benchmark-adjusted monthly volatility is 1.68%. The average factor-adjusted monthly volatility is 1.59%.Footnote
9

The share of fund holdings that are home runs and strikeouts average 5.16% and 4.30%, respectively. The standard deviations of these measures are 7.72% and 6.43%, suggesting considerable variation in funds’ ability or willingness to swing for the fences. HR + SO is 9.47% with a standard deviation of 7.35%. HR − SO is 0.85%, suggesting that an average fund hits slightly more home runs than strikeouts. In a given quarter, 9% of the fund quarters have no home-run and strikeout holdings in their portfolio. In addition, the average BA is 49.15%, suggesting that slightly fewer than half of the stocks held by mutual funds exceed their FF 25 portfolio returns in any given quarter. On average, 46.52% of funds mention at least one home-run holding as a factor that contributed to the fund’s annual performance, whereas 39.25% of funds mention at least one strikeout holding as a factor that detracted from the fund’s performance.
The average fund size and fund family size are $4.6 billion and $128.3 billion, respectively. However, the median fund has only $435 million, and the median fund family has $11.74 billion in AUM. Funds, on average, attract 3.19% of their AUM in additional capital each quarter. Funds’ expense ratios average 1.23%, and average turnover is 82%. Funds in our sample are, on average, 15 years old and hold an average of 126 different securities in each quarter. Thirty-one percent of funds have an institutional focus, while 67% are retail-focused.Footnote 10 Fund managers in the sample have slightly less than 10 years of experience, on average, and 59% of funds are managed by a team of managers.
E. Home Runs Versus Other Forms of Extreme Returns
The Swing-for-the-Fences strategy is a distinctive form of risk-taking. SF funds display an ability to pick stocks that can deliver extreme returns in future quarters. As mentioned above, we define a home-run stock as a stock that delivers a portfolio-adjusted quarterly return that is in the top 10% of its peer stocks. As described earlier in Section II.B, we use the FF25 portfolios constructed based on market capitalization and book-to-market ratios to define the universe of peer stocks. In this section, we describe the distinctions between our home runs and other forms of extreme returns studied in the literature. Specifically, we focus on measures of “lottery stocks” (e.g., Kumar (Reference Kumar2009), Bali, Cakici, and Whitelaw (Reference Bali, Cakici and Whitelaw2011), Bali et al. (Reference Bali, Brown, Murray and Tang2017), Agarwal et al. (Reference Agarwal, Jiang and Wen2020), and Bali, Hirshleifer, Peng, and Tang (Reference Bali, Hirshleifer, Peng and Tang2021)), “high volatility” (Clifford et al. (Reference Clifford, Fulkerson, Jame and Jordan2021)), and “high skewness” (Bessembinder (Reference Bessembinder2018), Farago and Hjalmarsson (Reference Farago and Hjalmarsson2023)).
To identify lottery stocks, we first calculate MAX as a stock’s return on the best day of the quarter.Footnote 11 Then, we designate a stock as a lottery stock in a quarter if its MAX is larger than the 90th percentile of all stocks in that quarter. We use a 90% cutoff to correspond to our definitions of home runs. Home runs are different from lottery stocks in at least two ways. First, we define home runs by a stock’s cumulative returns over a quarter, whereas lottery stocks’ definition is based on a single day’s return. Second, home runs’ extreme performance is relative to each stock’s market capitalization and book-to-market peers, while lottery-like performance is based on raw returns. Similarly, we calculate each stock’s volatility and skewness of daily portfolio-adjusted returns for 250 trading days. Then, we designate a stock as a high-volatility (high-skewness) stock in a quarter if its volatility (skewness) is larger than the 90th percentile of all stocks in that quarter.
In each quarter, we measure a stock’s average probability of being defined as i) a home run only, ii) a lottery stock only, iii) both a home run and a lottery stock, and iv) neither a home run nor a lottery stock. We measure these probabilities by dividing the number of stocks in each of these four groups by the total number of stocks in the CRSP universe.Footnote 12 We then average these probabilities across all quarters in our sample and repeat the same exercise for high-volatility and high-skewness stocks.
Panel A of Table 2 reports these probabilities. In our sample, 83% of stocks are neither a home run nor a lottery stock in a given quarter. On average, 6.8% of stocks are lottery stocks and 8.54% are home runs. More importantly, only 1.41% of stocks are identified as both a home run and a lottery stock. The probabilities of being both a home-run and a high-volatility or a high-skewness stock in the same quarter are very similar at 1.91% and 1.37%, respectively. If home runs and other extreme returns designations were randomly assigned, the unconditional probability of a stock being a home run and one other designation (lottery, high-volatility, or high-skewness) would be 1%. Hence, the probabilities of 1.37–1.91% suggest that there is little overlap between home runs and these measures of extreme performance.
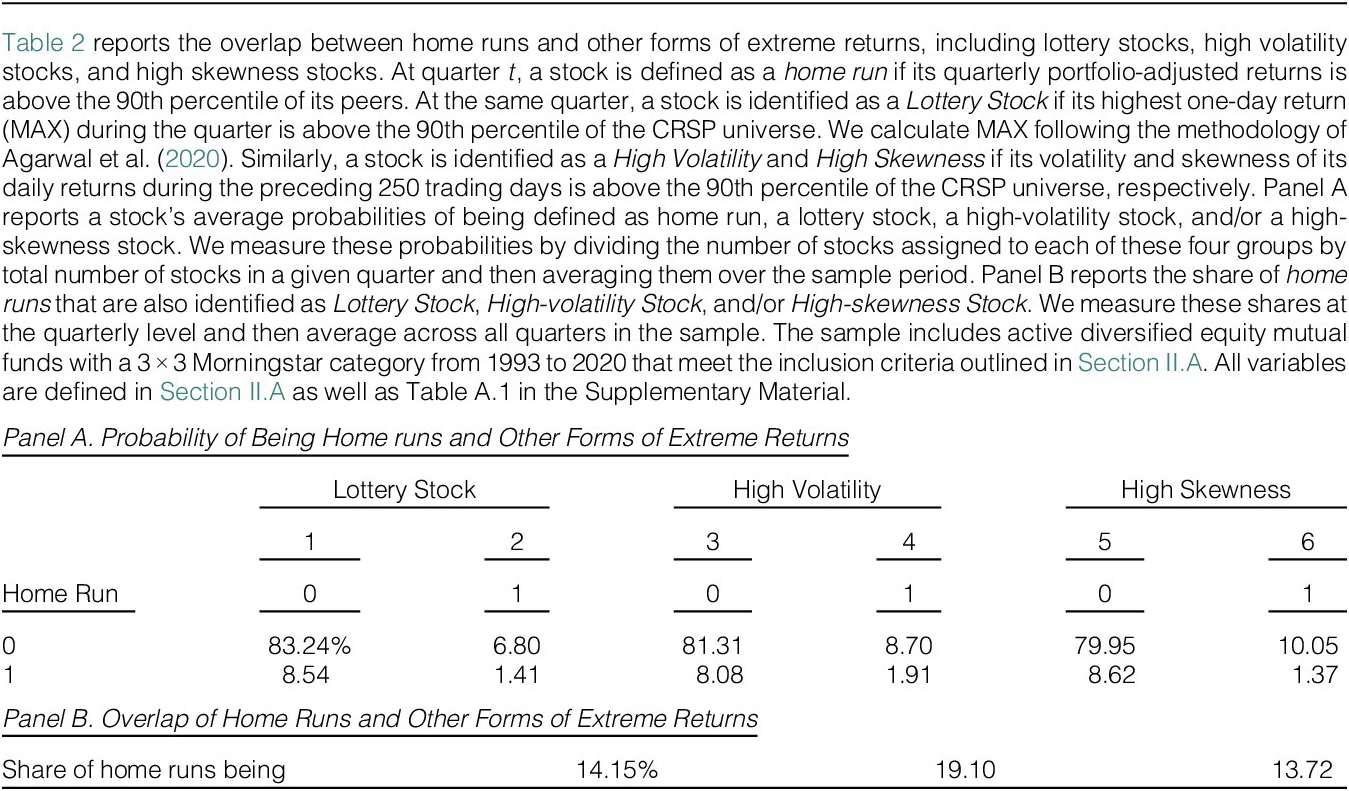
In Panel B of Table 2, we report the share of home runs that are also designated as one other extreme performer in a given quarter.Footnote 13 Panel B of Table 2 shows that only 14% of all home runs are also designated as lottery stocks, 19% are also high-volatility stocks, and only 13% are also high-skewness stocks. This analysis implies that the stock picking strategy that we call swinging for the fences captures a different feature of stock holdings than lottery-ness, volatility, and skewness.Footnote 14
III. Swing for the Fences Versus Bat for Average
In this section, we present evidence on the persistence of the SF and BA strategies in equity mutual funds. We also provide evidence on mutual funds’ home run and strikeout disclosures. Next, we offer some stylized facts regarding strategy choice and fund characteristics. Finally, we evaluate whether SF is related to documented investment strategies such as momentum or value.
A. Persistence
A stepping stone to exploring whether SF and BA are indeed strategies is to determine whether they demonstrate persistence from one quarter to the next. We estimate autocorrelations of SF and BA strategy measures with up to four quarterly lags.
Because home runs and strikeouts are potentially more likely in funds with more aggressive styles (e.g., small stocks), we account for style (market capitalization and book-to-market) in two ways. First, when defining home runs and strikeouts at the stock level, we evaluate a stock’s return relative to the comparable FF25 portfolio to control for size and value at the stock level. Second, in all our model specifications, we include Morningstar category fixed effects to control for the mutual funds style. Therefore, our inferences are drawn from variation within each of the nine style categories. These mutual fund style fixed effects allow us to compare like funds and avoid drawing inferences from comparisons between, for example, a small-cap fund and a large-cap fund.
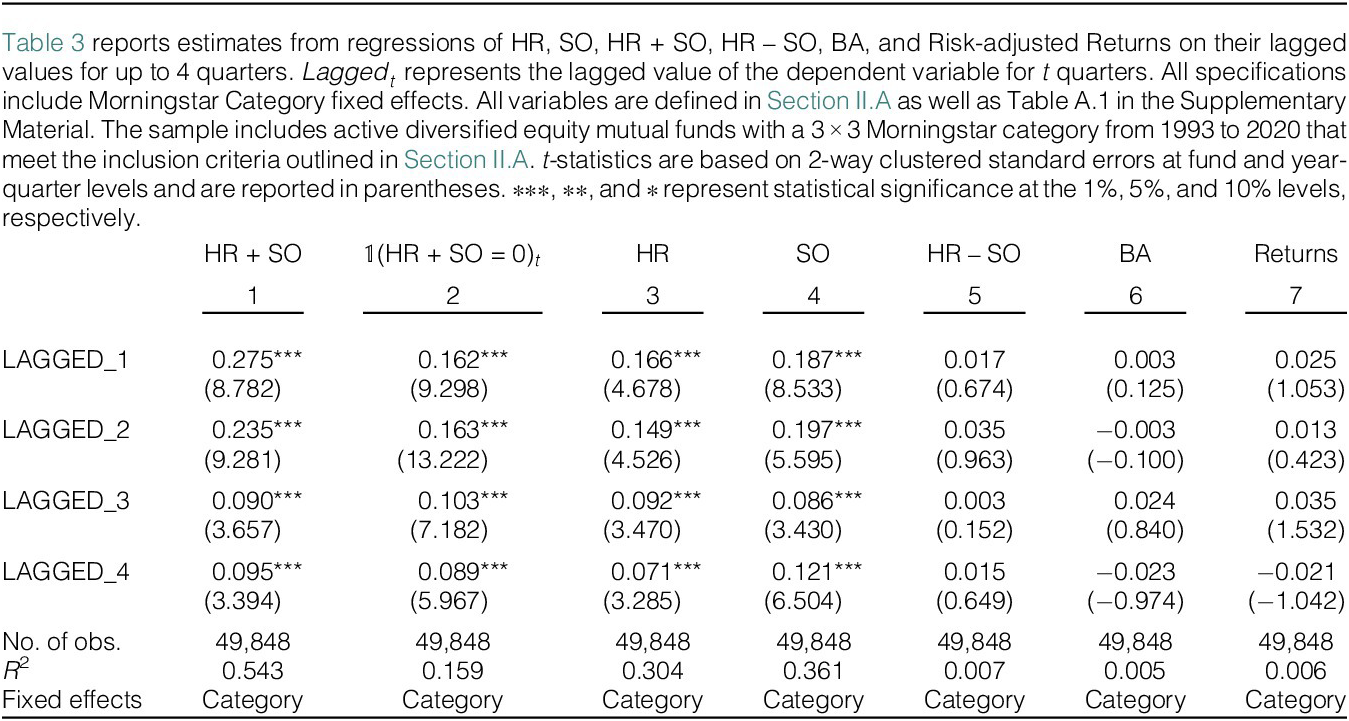
Table 3 reports the estimation results for our strategy variables. We believe that HR + SO, HR, and SO reflect an SF strategy. In contrast, we define an indicator variable, $ \unicode{x1D7D9} $
(HR + SO = 0), that takes the value of 1 when the fund has neither home runs nor strikeouts in a quarter. We believe this indicator variable reflects the strategy choice to not swing for the fences. For each of these four variables, the autocorrelation coefficients on four quarterly lags are positive and highly statistically significant,Footnote
15 suggesting that the strategy to swing for the fences, or not, is a persistent feature that we interpret as an investment strategy. We interpret HR – SO, BA, and benchmark-adjusted returns to reflect performance measures. In other words, does the manager have more HR than SO, have a majority of stocks that beat the market, or have positive benchmark-adjusted returns. We do not find evidence of persistence in these performance measures (i.e., HR – SO, BA, or benchmark-adjusted returns), which is consistent with fund performance being unpredictable. Throughout the article, we refer to
$ \unicode{x1D7D9} $
(HR + SO = 0), that takes the value of 1 when the fund has neither home runs nor strikeouts in a quarter. We believe this indicator variable reflects the strategy choice to not swing for the fences. For each of these four variables, the autocorrelation coefficients on four quarterly lags are positive and highly statistically significant,Footnote
15 suggesting that the strategy to swing for the fences, or not, is a persistent feature that we interpret as an investment strategy. We interpret HR – SO, BA, and benchmark-adjusted returns to reflect performance measures. In other words, does the manager have more HR than SO, have a majority of stocks that beat the market, or have positive benchmark-adjusted returns. We do not find evidence of persistence in these performance measures (i.e., HR – SO, BA, or benchmark-adjusted returns), which is consistent with fund performance being unpredictable. Throughout the article, we refer to $ \unicode{x1D7D9} $
(HR + SO = 0) as a measure of a fund’s strategy to bat for average or “not” be an SF fund. BA captures the fund’s success in trying to bat for average.
$ \unicode{x1D7D9} $
(HR + SO = 0) as a measure of a fund’s strategy to bat for average or “not” be an SF fund. BA captures the fund’s success in trying to bat for average.
As another assessment of persistence, we calculate transition matrices for our measures in Table A.2 in the Supplementary Material. At quarter-end $ t $
, we sort all funds into five portfolios based on one of the strategy measures (e.g., HR). We then sort the funds at quarter-ends
$ t $
, we sort all funds into five portfolios based on one of the strategy measures (e.g., HR). We then sort the funds at quarter-ends $ t+1 $
and
$ t+1 $
and $ t+4 $
, into an updated set of five portfolios. Table A.2 in the Supplementary Material reports the transition rates for each fund’s strategy portfolio in quarter
$ t+4 $
, into an updated set of five portfolios. Table A.2 in the Supplementary Material reports the transition rates for each fund’s strategy portfolio in quarter $ t $
to the fund’s strategy portfolio in quarters
$ t $
to the fund’s strategy portfolio in quarters $ t+1 $
and
$ t+1 $
and $ t+4 $
. We observe that the numbers on the diagonals are significantly larger than the numbers off the diagonals, implying that both HR and SO are persistent in funds. For example, 32% of funds in the low-HR portfolio in each quarter stay in the low-HR portfolio in the next quarter, while only 6% of those funds move to the high-HR portfolio. This pattern is observed for funds in each of the five portfolios and persists for four quarters. Moreover, we find similar transition rates when we sort funds based on SO or HR + SO.
$ t+4 $
. We observe that the numbers on the diagonals are significantly larger than the numbers off the diagonals, implying that both HR and SO are persistent in funds. For example, 32% of funds in the low-HR portfolio in each quarter stay in the low-HR portfolio in the next quarter, while only 6% of those funds move to the high-HR portfolio. This pattern is observed for funds in each of the five portfolios and persists for four quarters. Moreover, we find similar transition rates when we sort funds based on SO or HR + SO.
B. Marketing Swinging for the Fences
In this section, we examine the Management Discussion of Fund Performance section in mutual funds’ N-CSR filings between 2003Footnote 16 and 2020 to test whether mutual funds disclose their home-run and strikeout holdings to their investors. As described in Section III.C, by reading these sections, we identify whether the fund managers discussed their home-run and strikeout holdings as key contributors and detractors. We define two indicator variables MENTIONED_HR and MENTIONED_SO, taking value of 1 if the fund mentions at least one home run as a contributor and at least one strikeout as a detractor, respectively.
Between 2003 and 2020, 46.5% of funds mentioned at least one home-run holding as a contributing factor to the fund’s performance, while 39.5% of funds mentioned a strikeout holding as a factor that detracted from their portfolio’s performance in that year. We also find that the likelihood of mentioning holdings as performance factors is associated with swinging for the fences. Specifically, we sort funds into five quintiles based on HR and compute the average likelihood that a fund mentions home runs as performance factors (MENTIONED_HR) for the funds in each quintile. We repeat this sort for strikeouts, calculating the average likelihood of mentioning strikeouts as performance factors (MENTIONED_SO). Figure 2 calculates, for each HR and SO quintile, the likelihood that fund management mentions specific holdings in the managerial discussion section of the fund’s N-CSR.
Figure 2 shows the likelihood that a fund manager mentions home-run and strikeout holdings in the managerial discussion of performance in its N-CSR form. We identify a fund as mentioned if it mentions at least one home-run or strikeout holding when discussing factors that contributed to or detracted from the performance of the fund. Then, we sort funds according to HR (blue) and SO (orange) into quintiles and calculate the average for the mentioned indicator.
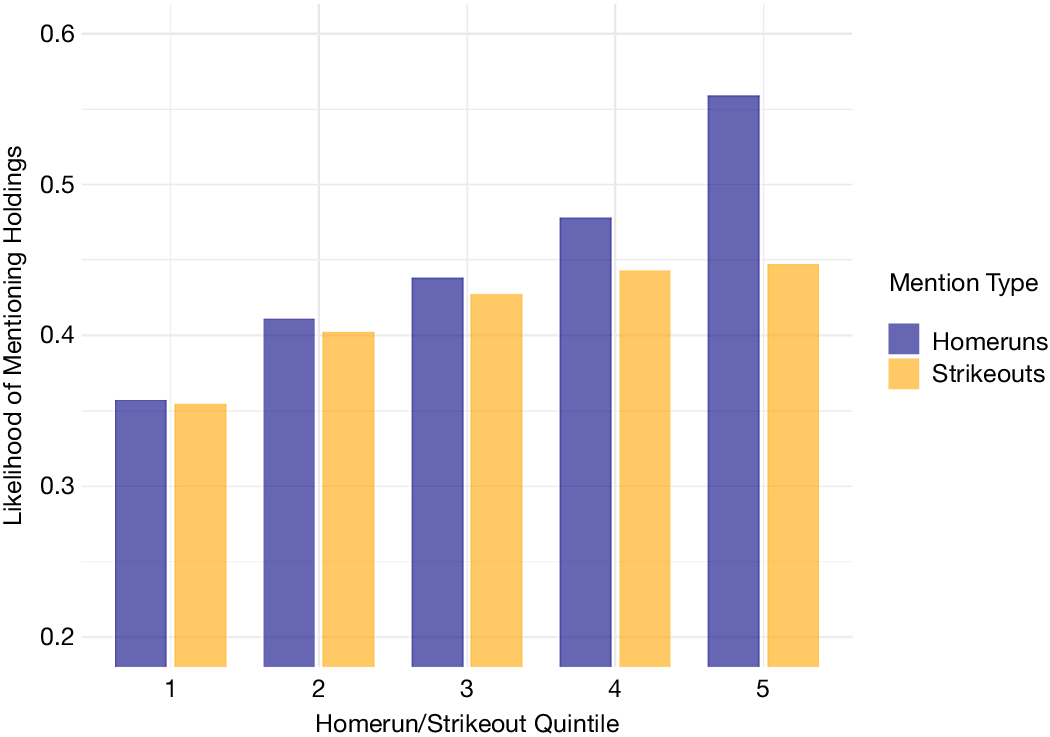
Figure 2 documents two interesting facts. First, funds in the first quintile, with the lowest HR or SO, have the lowest likelihood of mentioning holdings as performance factors. As the propensity to swing for the fences increases, the likelihood of mentioning holdings in the managerial discussion of performance increases monotonically. This fact is consistent with the hypothesis that SF funds deliberately pick stocks with the potential to deliver extreme performance and are more likely to discuss these holdings as factors that affected the fund’s performance, either as a contributor or a detractor. Second, the propensity to mention holdings is asymmetric. In every quintile, managers are more likely to mention their home runs than their strikeouts. This asymmetry is largest for quintile 5 funds that most aggressively pursue the SF strategy. In a given year, a fund in HR quintile 5 has a 57% likelihood of mentioning specific home runs, while SO quintile 5 funds have a 44% likelihood of mentioning specific strikeouts.
While Figure 2 shows that funds with higher HR and SO are more likely to disclose their home-run and/or strikeout holdings as performance factors in their managerial discussion of performance, it does not account for differences across other fund attributes, such as fund size, fund age, managerial experience, that are also related to HR and SO. In Table 4, we estimate the relation between managers’ mentions of specific holdings and SF strategy measures in a multivariate regression. In column 1, we regress MENTIONED_HR on HR and other characteristics. In column 2, we regress MENTIONED_SO on SO and other characteristics. First, higher HR and SO are related to a higher likelihood of mentioning home runs and strikeouts in the N-CSR. This is consistent with the pattern in Figure 2. Second, funds with higher returns are more likely to discuss holdings as performance factors. Not surprisingly, the point estimate is larger for home runs relative to strikeouts. Third, funds from larger families are more likely to mention holdings. Last, we find that younger funds and funds with a retail focus are more likely to discuss home-run and strikeout holdings as performance factors.
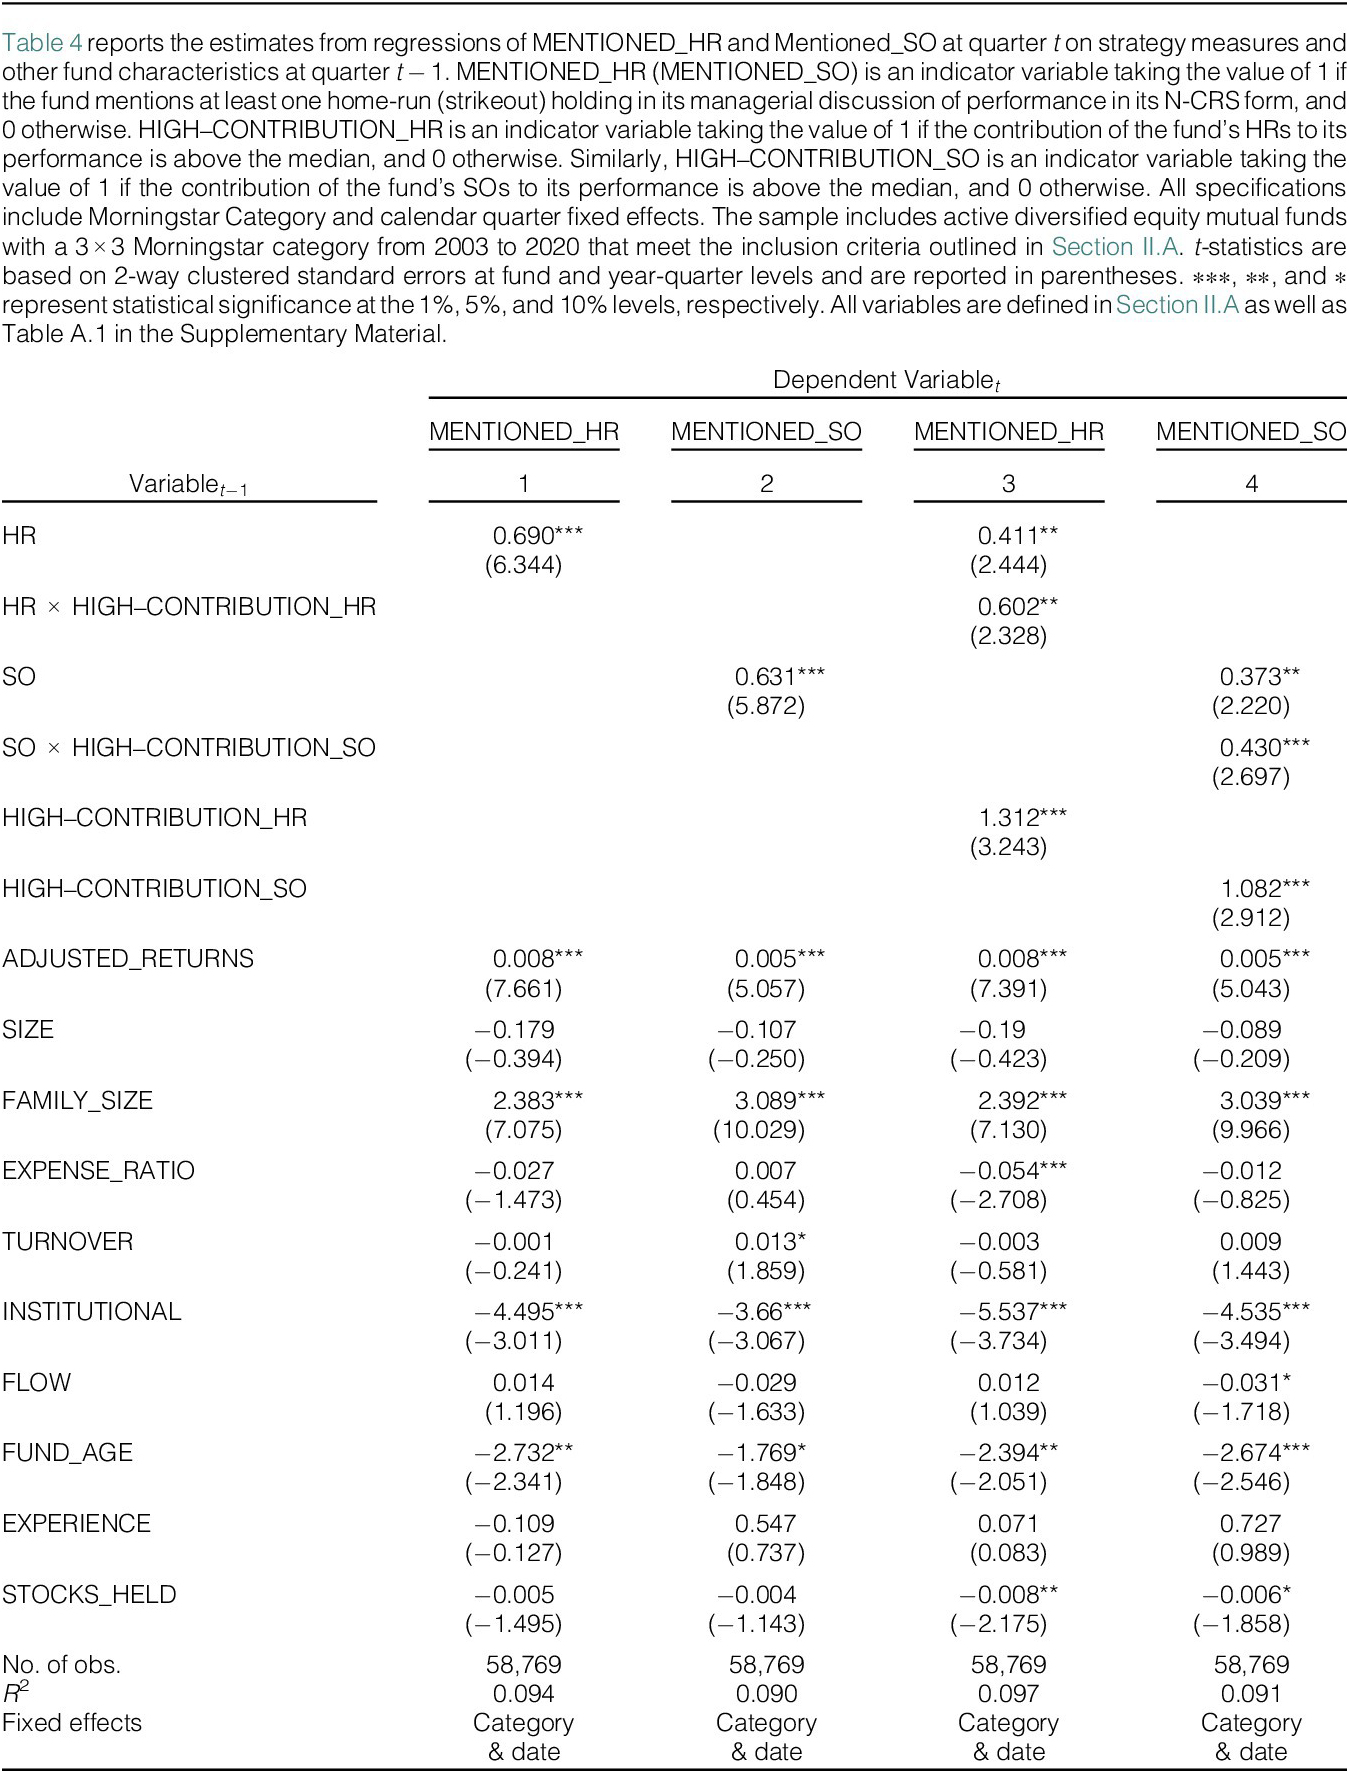
Our next test regarding disclosure of home runs and strikeouts investigates whether funds are more likely to mention their home runs or strikeouts when they are more economically meaningful. A home run may be more salient if it accounts for a larger portion of the portfolio and if it delivers a very large quarterly return. We calculate Contribution of home-run (strikeout) holdings to be the fraction of the fund’s portfolio returns that the home-run (strikeout) holdings deliver in each quarter. The magnitude of Contribution is increasing in both the portfolio weight as well as the quarterly return of the home-run (strikeout) holdings, with larger values when the fund has more economically salient home runs (strikeouts). We then define HIGH–CONTRIBUTION_HR as an indicator variable that takes a value of 1 if the fund’s home runs have a contribution to portfolio return that is larger than the median contribution for all sample funds in all quarters. Similarly, we define HIGH–CONTRIBUTION_SO when the fund’s strikeouts have a contribution to portfolio return that is below the sample median.Footnote 17
To examine whether more important home runs and strikeouts are more likely to be discussed in managerial commentary, we include in our regressions an interaction term between HR and SO and High–Contribution indicators and report the estimates in Table 4. In column 3, we interact HR with HIGH–CONTRIBUTION_HR and find that managers are more likely to mention their home-run holdings when the home runs have a larger impact on performance. Specifically, while a 1% increase in HR is associated with 3.17% ( $ 7.718\times 0.41 $
) increase in the likelihood of mentioning home runs, the same increase in HR among funds with more impactful home runs leads to 7.79% (
$ 7.718\times 0.41 $
) increase in the likelihood of mentioning home runs, the same increase in HR among funds with more impactful home runs leads to 7.79% ( $ 7.718\times \left(0.41+0.60\right) $
) increase in the likelihood of being mentioned. In column 4, we investigate the effect of important strikeouts. Similarly, high-contribution SOs are more than twice as likely to be mentioned relative to low-contribution SOs.
$ 7.718\times \left(0.41+0.60\right) $
) increase in the likelihood of being mentioned. In column 4, we investigate the effect of important strikeouts. Similarly, high-contribution SOs are more than twice as likely to be mentioned relative to low-contribution SOs.
In our analysis of fund disclosures, we find that mutual funds that swing for the fences are more likely to mention the specific names of the stocks that delivered home runs and strikeouts in their performance disclosures, particularly when these holdings have a greater economic impact on returns. This tendency is stronger for home runs than strikeouts, revealing an asymmetric disclosure pattern, suggesting that marketing incentives are likely to influence fund managers’ communications to investors. We believe this provides evidence of a credible mechanism that connects SF to fund flows, which we examine in Section III.A.
C. Which Funds Swing for the Fences?
To identify mutual fund characteristics that are associated with swinging for the fences and batting for average, we regress these strategies on lagged fund characteristics and report the results in Table 5. These predictive regressions reveal some interesting patterns and provide some new stylized facts about mutual funds.
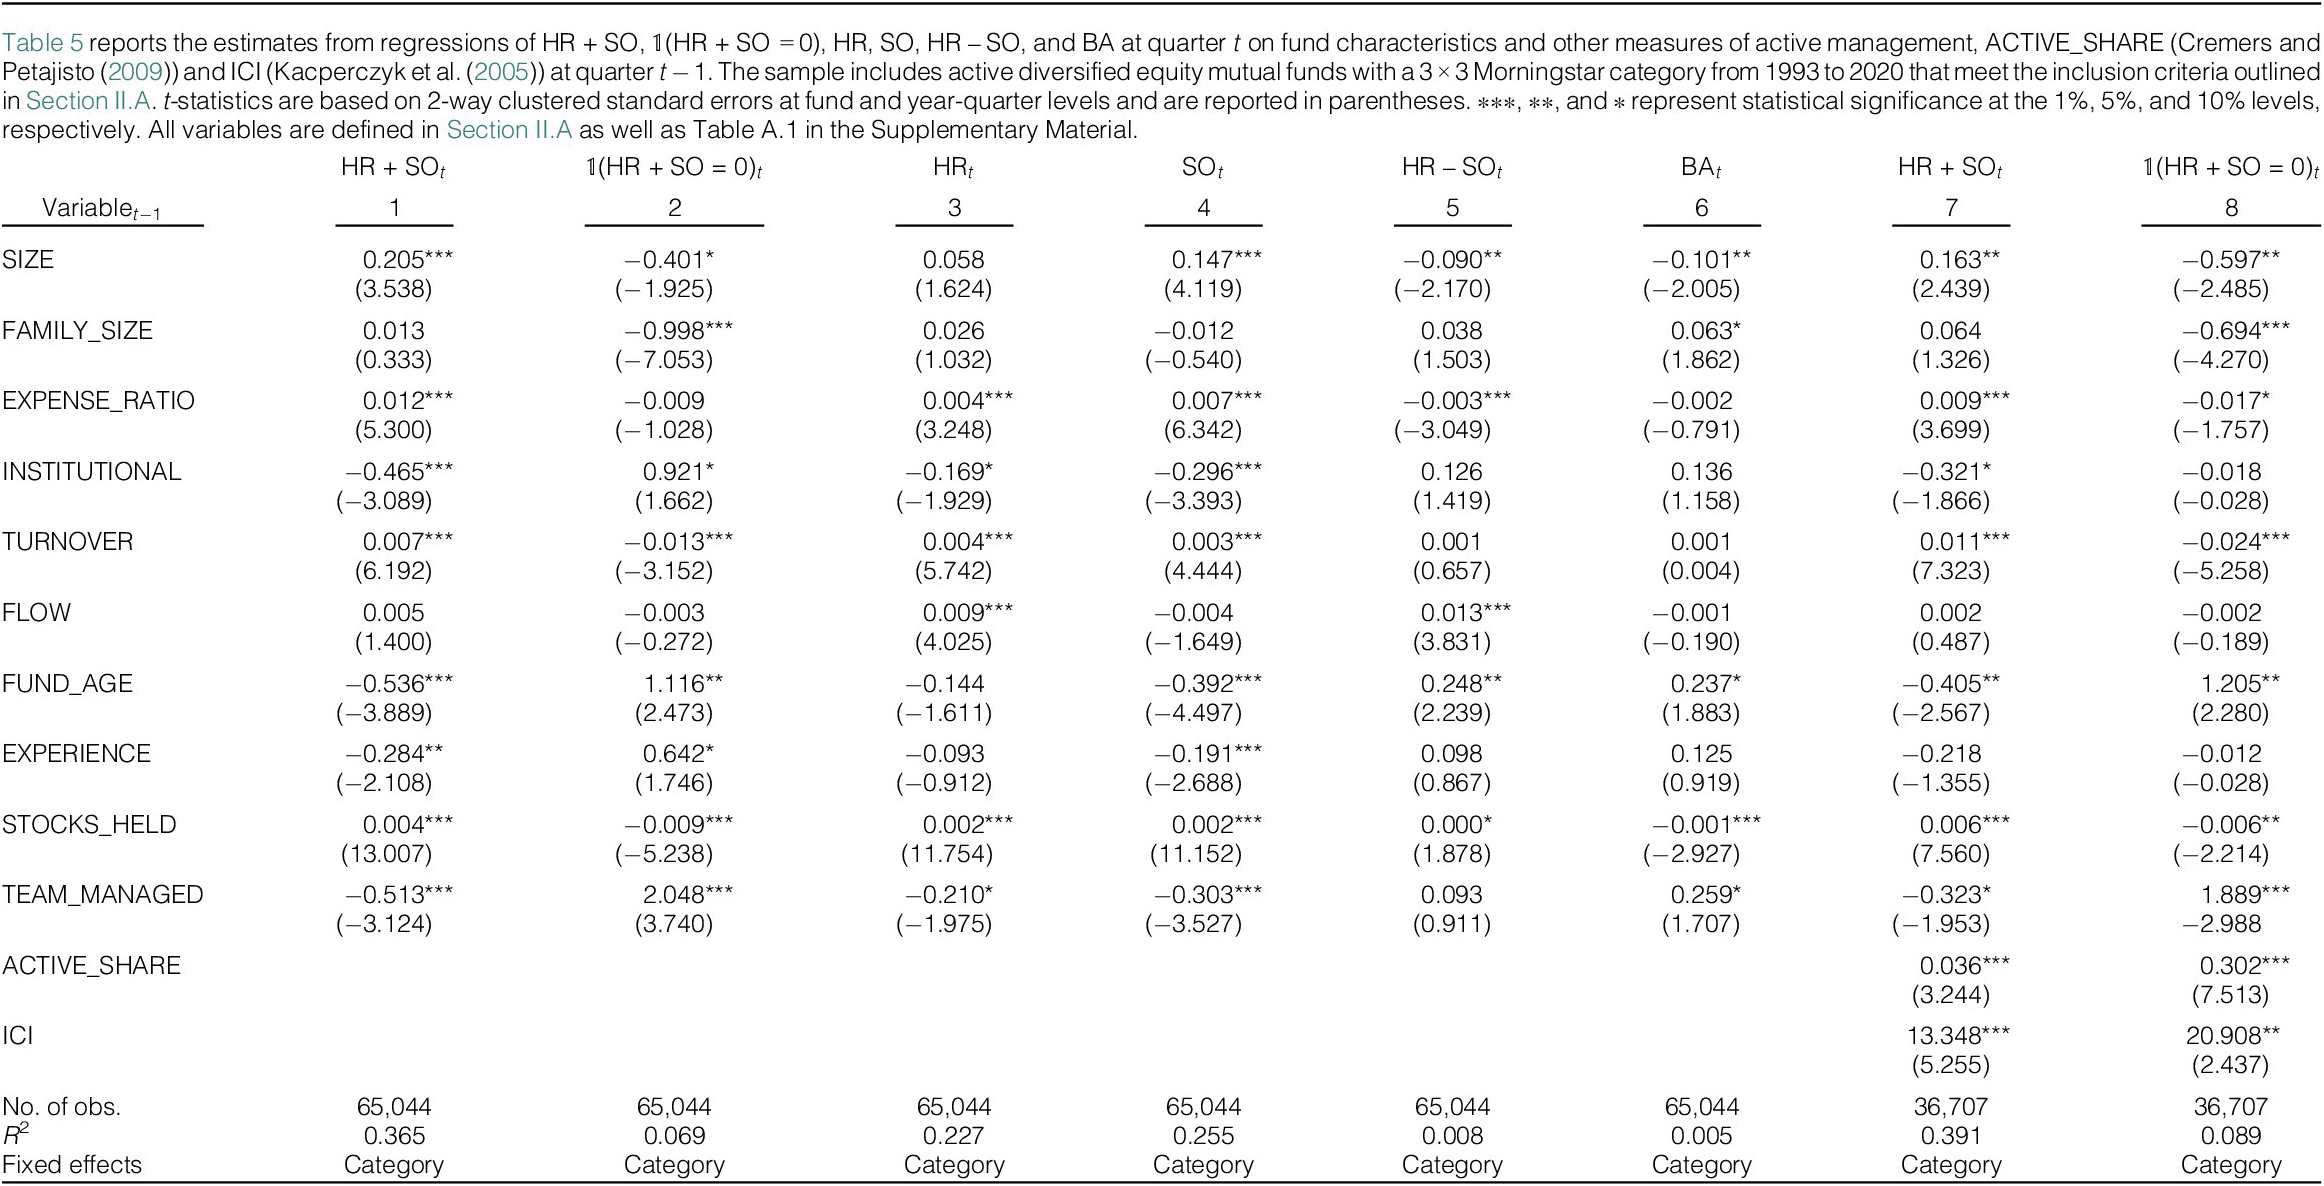
First, we find that funds with higher turnover and expense ratios are more likely to swing for the fences. In column 1, we find that a 1-standard-deviation increase in the turnover ratio is associated with 0.82% increase in HR + SO,Footnote
18 our measure of swinging for the fences. Column 2 shows a significantly negative relationship between turnover and the batting-for-average strategy as measured by $ \unicode{x1D7D9} $
(HR + SO = 0). In columns 3 and 4, we find consistent evidence that funds with higher portfolio turnover are more likely to have home runs and strikeouts in their portfolios. This conforms to the notion that funds cannot swing for the fences without frequently making changes to their portfolios. Furthermore, we find evidence that higher fees are positively associated with swinging for the fences. We explore the relation to fees in more detail in Section III.B.
$ \unicode{x1D7D9} $
(HR + SO = 0). In columns 3 and 4, we find consistent evidence that funds with higher portfolio turnover are more likely to have home runs and strikeouts in their portfolios. This conforms to the notion that funds cannot swing for the fences without frequently making changes to their portfolios. Furthermore, we find evidence that higher fees are positively associated with swinging for the fences. We explore the relation to fees in more detail in Section III.B.
Second, we find that a fund’s investor base is related to its strategy choice. Specifically, funds that primarily sell to institutional investors are less likely to swing for the fences. Column 1 shows that funds with institutional focus have 46 bps fewer home-run and strikeout holdings in their portfolios. Columns 3 and 4 examine home runs and strikeouts separately and show that the decrease in HR + SO is driven by both home runs and strikeouts.
Third, we find that both strategies suffer from decreasing returns to scale. Berk and Green (Reference Berk and Green2004) argue that, due to liquidity constraints, diminishing returns to scale erode fund performance as funds grow larger. Whereas a small fund can put all of its capital in its best ideas, a large fund has to invest in its second-best ideas and/or take larger positions in its existing stock holdings relative to what is optimal.Footnote 19 In Table 4, column 3, in the HR regression, the coefficient on SIZE is positive, but not significant. In column 4, SO increases significantly with fund size. Consistent with these coefficients, in column 5, the spread between HR and SO decreases with fund size. In other words, as funds get larger, they are less successful at swinging for the fences. An increase of one log magnitude in SIZE translates into a 14.7 bps increase in strikeouts and, ultimately, a decrease of 9 bps in HR−SO, which represents the performance of SF. For brevity, we do not tabulate, but this effect is significantly stronger at 38 bps when we include fund fixed effects, suggesting that when a fund grows by one log magnitude, its ability to successfully swing for the fences declines by 38 bps. These results are consistent with the hypothesis that the probability of a strikeout increases as asset size increases since funds must dig deeper into their preferred stock picks. Moreover, column 6 shows that larger funds tend to have a lower BA as well. A one-logarithm increase in fund size is associated with 10.1 bps decrease in the fund’s BA. The effect of fund size on HR, SO, and BA suggests that both strategies are likely to suffer from diseconomies of scale.
Furthermore, we find that younger funds and younger managers are more likely to swing for the fences. Specifically, as FUND_AGE increases, HR + SO decreases, suggesting older funds engage less in SF. Likewise, $ \unicode{x1D7D9} $
(HR + SO = 0) increases in probability as funds grow older, suggesting older funds prefer to bat for average or not SF. This relationship is consistent with the hypothesis that younger funds have stronger incentives to stand out in the competition at the earlier stages of their life cycle. Figure A.1 in the Supplementary Material illustrates the relationship between fund age and SF as a strategy by showing average HR + SO, HR, SO, and HR – SO for funds at different ages. It appears that funds aggressively swing for the fences in the first few years after their inception. Average HR + SO for funds under 5 years is 10.8%, average HR is 6.1%, and average SO is 4.9%, all of which are significantly higher than the full-sample averages. Subsequently, HR and SO experience a modest yet steady drop for about 20 years. For comparison, average HR + SO, HR, and SO for funds older than 20 years are 8.6%, 4.5%, and 3.9%, respectively. These averages correspond to 21%, 26%, and 21% decrease in these measures, respectively. We find evidence that as fund managers’ experience increases, SO decreases at a significantly higher rate than HR, suggesting that managers learn to pick potential home runs as they gain more experience and have fewer strikeouts for each home run. This is consistent with the role of experience in mutual fund performance (Chevalier and Ellison (Reference Chevalier and Ellison1999), Kempf et al. (Reference Kempf, Manconi and Spalt2017)).
$ \unicode{x1D7D9} $
(HR + SO = 0) increases in probability as funds grow older, suggesting older funds prefer to bat for average or not SF. This relationship is consistent with the hypothesis that younger funds have stronger incentives to stand out in the competition at the earlier stages of their life cycle. Figure A.1 in the Supplementary Material illustrates the relationship between fund age and SF as a strategy by showing average HR + SO, HR, SO, and HR – SO for funds at different ages. It appears that funds aggressively swing for the fences in the first few years after their inception. Average HR + SO for funds under 5 years is 10.8%, average HR is 6.1%, and average SO is 4.9%, all of which are significantly higher than the full-sample averages. Subsequently, HR and SO experience a modest yet steady drop for about 20 years. For comparison, average HR + SO, HR, and SO for funds older than 20 years are 8.6%, 4.5%, and 3.9%, respectively. These averages correspond to 21%, 26%, and 21% decrease in these measures, respectively. We find evidence that as fund managers’ experience increases, SO decreases at a significantly higher rate than HR, suggesting that managers learn to pick potential home runs as they gain more experience and have fewer strikeouts for each home run. This is consistent with the role of experience in mutual fund performance (Chevalier and Ellison (Reference Chevalier and Ellison1999), Kempf et al. (Reference Kempf, Manconi and Spalt2017)).
Last, Table 5 shows that funds that are managed by a team of managers (TEAM_MANAGED) are less likely to swing for the fences than solo-managed funds. Specifically, column 1 shows that HR + SO is 51 basis points lower for team-managed funds, and column 2 shows that team-managed funds are 2.05% more likely to have neither home-run nor strikeout holdings in their portfolios. This effect could be driven by the fact that a manager trusted to operate solo may have enough human capital or confidence to take the risk to swing for the fences.
D. Fund Strategies Versus Other Measures of Active Management
A fund’s stock-picking strategy is an active investment decision. Therefore, it is natural to ask whether SF and BA are related to other measures of active investment. For example, funds with high levels of active share (Cremers and Petajisto (Reference Cremers and Petajisto2009)) potentially deviate from the passive benchmark in hopes of picking outperforming stocks. Moreover, (Kacperczyk et al. (Reference Kacperczyk, Sialm and Zheng2005)) argue that funds with concentrated portfolios within industries pick outperforming stocks and thus deliver higher returns. To address potential overlap between existing measures of active management and the SF strategy, we include ACTIVE_SHARE and INDUSTRY_CONCENTRATION_INDEX (ICI) as control variables in the regression models in Table 5. The estimates are reported in columns 7 and 8.Footnote
20 Comparing column 1 to column 7, and column 2 to column 8, we find that the inclusion of ACTIVE_SHARE and ICI does not change the inferences drawn from the estimated coefficients on other fund characteristics. Moreover, we find that both ACTIVE_SHARE and ICI are positively related to both SF and BA, as captured by $ \unicode{x1D7D9} $
(HR + SO = 0).
$ \unicode{x1D7D9} $
(HR + SO = 0).
We conclude from these estimates that the distinction between SF and BA strategies is not driven by these measures of active investment. Both strategies are positively correlated with active share. This positive correlation is not surprising because the SF and BA are active investment strategies. A fund can actively pick stocks that are expected to have extreme returns (i.e., swing for the fences), while another fund can be equally active in picking stocks that are expected to have moderate returns (i.e., batting for average). Therefore, both groups are active managers deviating from the passive benchmark to seek alpha and thus exhibit a positive relation to active share.
Another potential active investment strategy is momentum. In the presence of a static fund portfolio that holds momentum stocks, we may observe persistence in home-run and strikeout holdings in those momentum stocks. In other words, a fund that holds a certain home-run stock may choose to continue to hold that stock over the next quarter, and that stock may happen to be a home run again, leading to persistence in the fund’s HR even in the absence of an intentional strategy of swinging for the fences. We do not believe this to be the case. First, Hartzmark (Reference Hartzmark2015) shows that mutual funds are more likely to promptly sell their best and worst performers in their portfolios. So, if a fund experiences a home run, it is more likely to sell it by the end of the following quarter than keep it in the portfolio. Second, Table 5 shows that funds with higher HR and SO tend to have higher turnover ratios, suggesting that they have less static portfolios than peers that bat for average.
Nonetheless, we directly investigate whether funds that swing for the fences systematically chase momentum relative to other funds. Our hypothesis is that if SF funds simply follow a momentum strategy and hold their home runs over multiple quarters, then their quarterly returns are expected to correlate with the momentum factor. To test this hypothesis, we regress SF and BA strategy measures on the fund’s loading on the momentum factorFootnote 21 alongside other control variables and report our estimation results in Table A.4 in the Supplementary Material. The results show that the coefficients on the momentum factor are not statistically significant for SF or BA variables. We conclude that the persistence in HR and SO is unlikely to be an artifact in the data brought about by momentum in stock returns. Rather, we believe that our evidence supports the hypothesis that fund managers are deliberate in picking stocks that are part of an SF strategy.
Although we show that swinging for the fences is inherently different from active share, industry concentration, and momentum, the existing literature has documented many other factors that predict future abnormal returns (McLean and Pontiff (Reference McLean and Pontiff2016), Harvey, Liu, and Zhu (Reference Harvey, Liu and Zhu2016), and Feng, Giglio, and Xiu (Reference Feng, Giglio and Xiu2020)). Therefore, mutual funds may actively exploit these factors in hopes of generating abnormal returns. It is possible that swinging for the fences is not a deliberate stock-picking strategy and may simply result from exposure to one or more of the known factors. Using a comprehensive list of factors from The Open Asset Pricing Project,Footnote 22 we address this question at both the stock and fund return levels.
At the stock level, we estimate each home-run stock’s exposures to all factorsFootnote 23 and identify its top five. If certain factor(s) drive home-run outcomes, they should appear frequently among these top exposures. Instead, we find that the 10 most common factors, on average, are relevant to only 6.7% of home-run stocks, indicating no single factor explains their home-run performance. At the fund level, we sort funds into HR quintiles and measure how often each factor is relevant within each group. Again, the 10 most common factors appear for only 15.7% of funds. More importantly, if loading on a factor causes high HR, exposure to the factor should concentrate in the High–HR group. Contrary to this expectation, we find that each factor’s prevalence is similar across quintiles, suggesting that while funds are exposed to certain factors, this exposure is not related to their tendency to swing for the fences.
We provide a more detailed description of this analysis in Section B of the Supplementary Material, including the estimation of factor exposures, the top factors, and the results, to further address that swinging for the fences is different from exposure to existing factors found to predict returns.
IV. Fund Performance
In this section, we investigate the performance implications of SF and BA strategies. We first examine whether either of these strategies generates superior risk-adjusted returns, and then we examine whether these strategies are associated with fund volatility.
A. Returns
We focus on benchmark-adjusted net returns, ADJUSTED_RETURNS, which we define as the fund’s quarterly net-of-fee returns in excess of its Morningstar-designated benchmark index. Benchmark adjustment accounts for fund style and risk, but unlike factors that are long-short portfolios, index portfolios are easily implemented by mutual fund managers, which makes them appropriate benchmarks. In addition, Cremers, Petajisto, and Zitzewitz (Reference Cremers, Petajisto and Zitzewitz2008) argue that factor adjustment produces biased assessments of fund performance. Nonetheless, we show in Section A of the Supplementary Material that our performance results are robust to using Carhart (Reference Carhart1997) four-factor alpha as an alternative measure of performance.
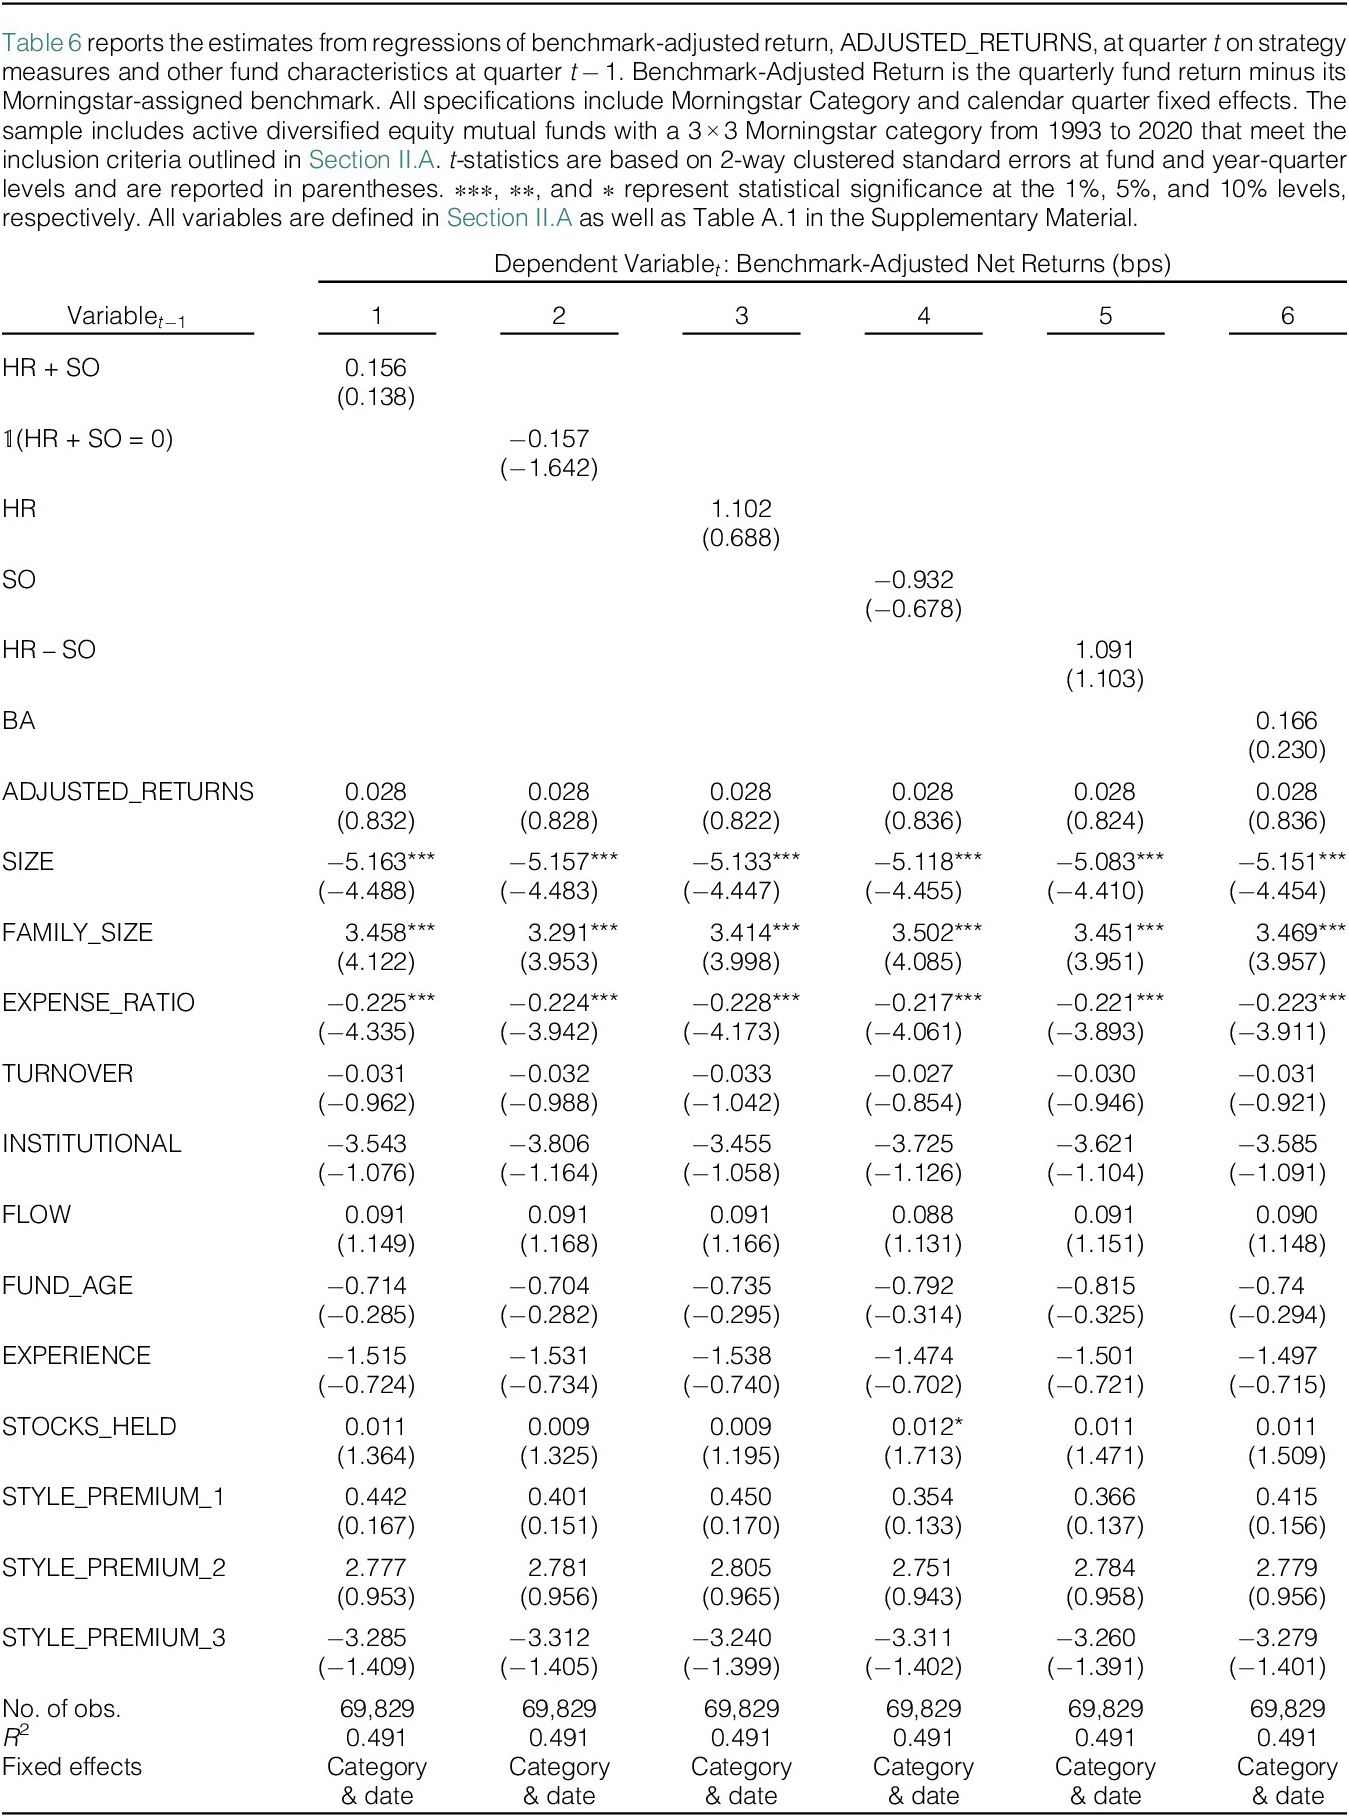
We regress ADJUSTED_RETURNS on our strategy measures while controlling for other fund characteristics. The fund characteristics included in these regressions are lagged ADJUSTED_RETURNS, SIZE, FAMILY_SIZE, TURNOVER, EXPENSE_RATIO, INSTITUTIONAL, FLOW, AGE, EXPERIENCE, and STOCKS_HELD. Furthermore, we include three additional control variables, which we call Style Premiums, to control for the effect of potential exposures to particular styles.Footnote 24
We identify home runs and strikeouts at the stock level based on their returns relative to one of the FF25 benchmark portfolios. As discussed previously, this mitigates the concern that the presence of home runs and strikeouts in a fund’s portfolio is driven by market capitalization or growth/value effects. In addition, we include Morningstar style category fixed effects in our regressions to further control for any fund-level style effects. Therefore, our inferences regarding the effect of the strategies on performance are drawn from variation within style categories. We also include calendar date fixed effects to absorb macro-level market conditions that may affect performance.
We report the estimation results in Table 6. First, as documented in the literature, we confirm that past returns do not predict future returns (Elton, Gruber, and Blake (Reference Elton, Gruber and Blake1996), Carhart (Reference Carhart1997), French (Reference French2008), Fama and French (Reference Fama and French2010), Glode (Reference Glode2011), and Del Guercio and Reuter (Reference Del Guercio and Reuter2014)). The coefficient on past returns is not significant in any of the specifications. Furthermore, none of the coefficients on the strategy measures are significant, suggesting that these measures do not carry information about future returns. Column 1 shows that a higher tendency to swing for the fences, measured by HR + SO, does not translate to higher returns. Similarly, column 2 shows that a higher tendency to bat for average, as measured by $ \unicode{x1D7D9} $
(HR + SO = 0), does not translate into higher performance either. Columns 3 to 6 estimate the effect of HR, SO, HR – SO, and BA on performance and report insignificant effects. These results imply that neither of the two strategies benefits fund investors through superior returns beyond the benchmarks of similar risk.
$ \unicode{x1D7D9} $
(HR + SO = 0), does not translate into higher performance either. Columns 3 to 6 estimate the effect of HR, SO, HR – SO, and BA on performance and report insignificant effects. These results imply that neither of the two strategies benefits fund investors through superior returns beyond the benchmarks of similar risk.
In Table A.5 in the Supplementary Material, we show that our results are robust to alternative model specifications as well as alternative measures of performance. First, we replace the style category fixed effects with fund fixed effects. In columns 1 to 6, we show that these strategies are not associated with superior fund returns. Next, we replace our dependent variable with the Carhart (Reference Carhart1997) four-factor alpha. In columns 6 to 12, we continue to find qualitatively similar results.
Our primary strategy measures used in Table 6 are equal-weighted and thus place more emphasis on small holdings. It is possible that the lack of performance implications may be the result of the fact that small holdings, when becoming home runs and strikeouts, do not affect portfolio outcomes significantly. We replicate our analysis in Table 6 with alternative fund-level HR, SO, and BA using three weighting schemes that emphasize larger holdings and more extreme returns and report our results in columns 1–3 of Table A.6 in the Supplementary Material.Footnote 25 In sum, the SF strategy does not generate superior returns using a number of reasonable weights for the strategy metrics.
The results in Tables 6 and A.5 in the Supplementary Material show that the strategy to swing for the fences does not deliver superior net-of-fee returns to investors. However, net-of-fee performance, while useful to evaluate investor value, fails to directly measure a fund’s ability to select better-performing stocks via a selection strategy such as swinging for the fences. This is particularly important because Table 5 shows that SF funds are associated with higher fees.
Therefore, SF funds may lack net-of-fee performance simply because the strategy does not outperform their benchmarks. Alternatively, SF funds may lack net-of-fee performance despite the strategy generating positive gross performance for SF funds. We posit that SF funds may generate higher gross returns through their stock picking ability but charge investors higher fees, allowing managers to capture the benefits of superior performance. In a competitive mutual fund industry, it is expected that much of the benefit of stock picking abilities would naturally accrue to the fund managers rather than investors (Berk and Green (Reference Berk and Green2004)).
We test this hypothesis by repeating our analysis in Table 6 using benchmark-adjusted gross returns. Specifically, we regress benchmark-adjusted gross returns on the strategy measures while controlling for fund characteristics as well as category and date fixed effects. The estimated coefficients are reported in Table A.7 in the Supplementary Material. We find that neither of the two strategies is able to deliver superior gross returns. Overall, we conclude that the strategy choice between SF and BA does not deliver superior risk-adjusted mutual fund returns.
B. Volatility
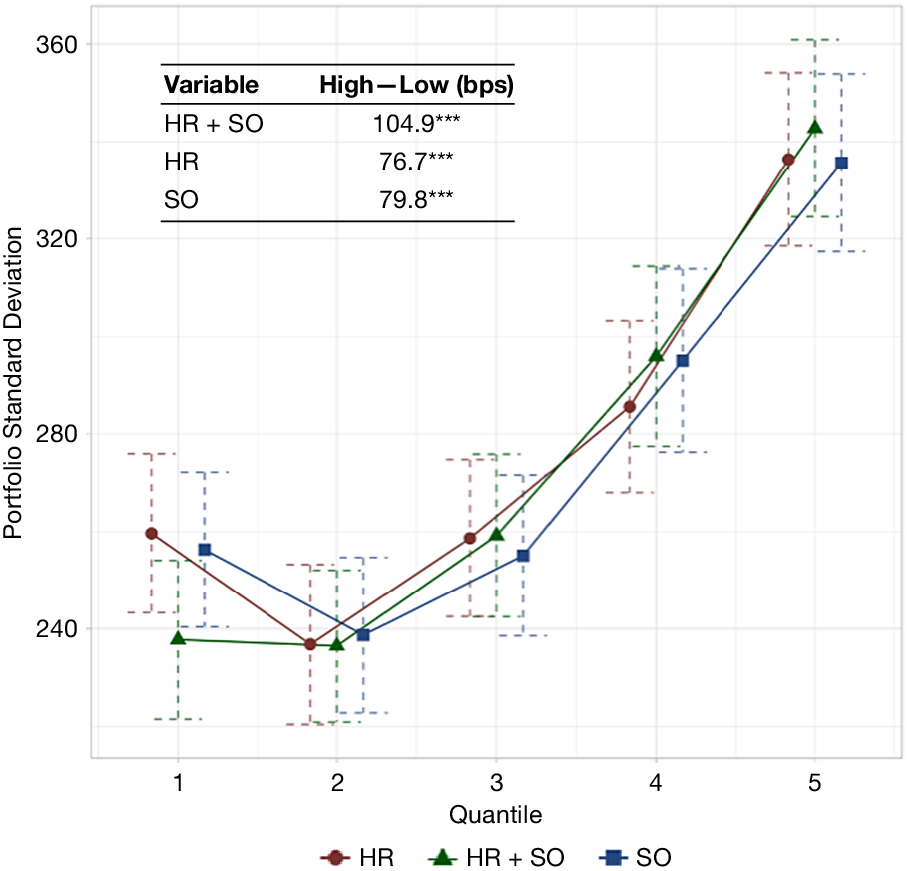
We now turn to an analysis of fund volatility. We assess the risk associated with the SF and BA strategies using two methods. First, we examine the cross-sectional standard deviation of fund returns in portfolios of funds sorted on the strategy measures. We sort funds into five portfolios in each quarter and compute the standard deviation of quarterly fund returns across all funds in each portfolio. We report time series averages of the cross-sectional standard deviations for each portfolio along with a 5% confidence interval in Figure 3. Figure 3 shows that cross-sectional volatility is significantly higher for portfolios that have higher HR + SO, HR, and SO. In other words, dispersion in returns is much higher for SF funds than for BA funds. Figure 3 also reports these average standard deviations of fund returns for these strategy portfolios during our sample. We find that the difference in cross-sectional standard deviation between the highest and lowest HR + SO portfolios (High–Low) is 1.05%, which is statistically significant at 1% confidence. The same spread is 0.77% and 0.80% for portfolios sorted on HR and SO, respectively. We show in Figure A.2 in the Supplementary Material that the results are very similar when we use cross-sectional standard deviations of four-factor alphas in lieu of benchmark-adjusted returns.
Figure 3 shows cross-sectional fund return volatility within portfolios sorted on HR + SO, HR, and SO. In each quarter, funds are sorted into five portfolios. For each portfolio, the standard deviation of the return distribution is calculated. Then, the time series average of the cross-sectional standard deviations is reported in the figure. Error bars report 95% confidence intervals. The sample includes active diversified equity mutual funds with a $ 3\times 3 $
Morningstar category from 1993 to 2020 that meet the inclusion criteria outlined in Section II.A.
$ 3\times 3 $
Morningstar category from 1993 to 2020 that meet the inclusion criteria outlined in Section II.A. $ \ast \ast \ast $
,
$ \ast \ast \ast $
, $ \ast \ast $
, and
$ \ast \ast $
, and $ \ast $
represent statistical significance at the 1%, 5%, and 10% levels, respectively. All variables are defined in Section II.A as well as Table A.1 in the Supplementary Material.
$ \ast $
represent statistical significance at the 1%, 5%, and 10% levels, respectively. All variables are defined in Section II.A as well as Table A.1 in the Supplementary Material.
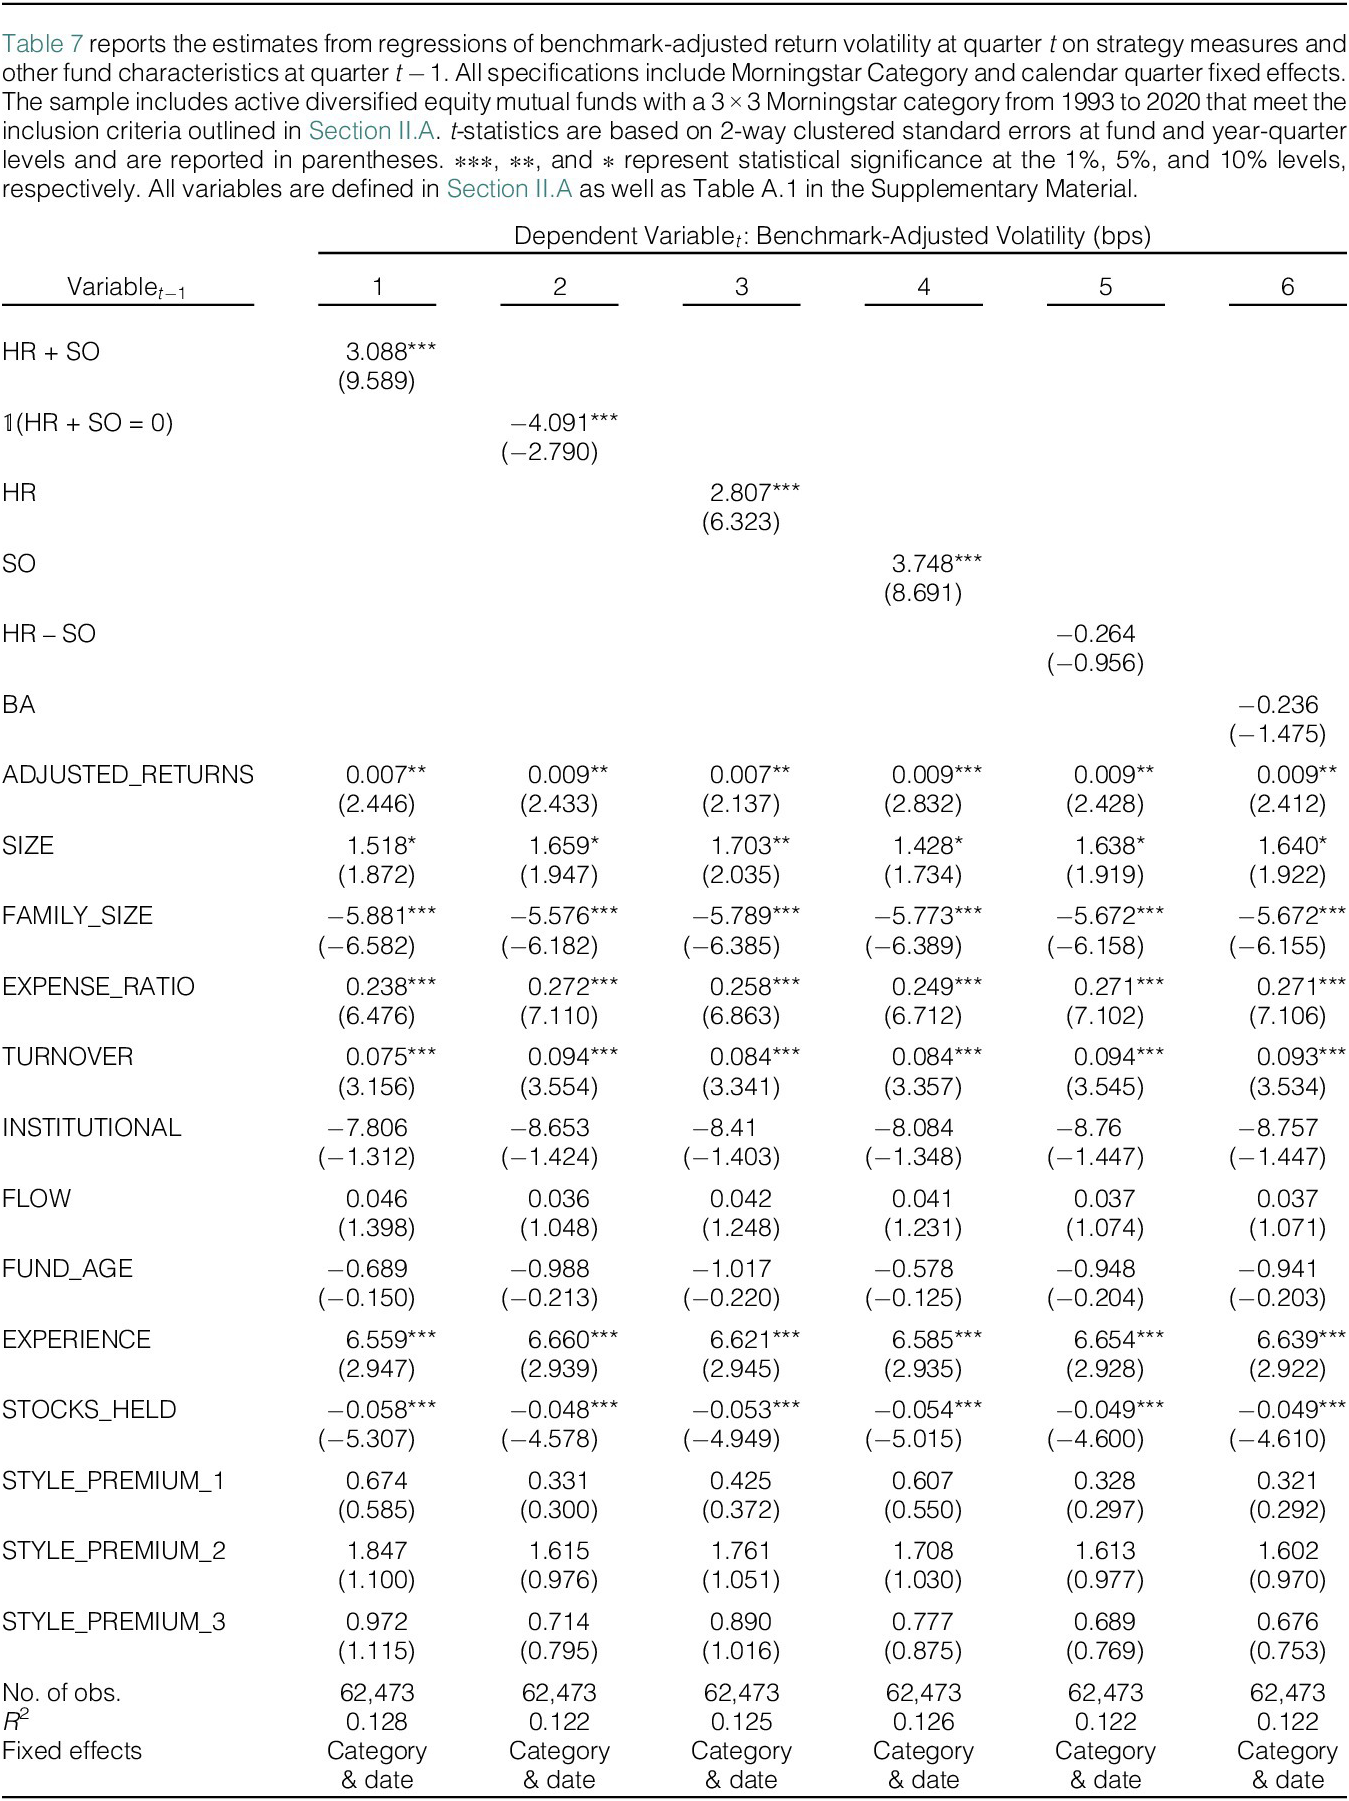
In our second analysis of portfolio risk, we regress fund-level return volatility on lagged measures of SF and BA strategies while controlling for fund characteristics. We calculate BENCHMARK-ADJUSTED_VOLATILITY in each quarter as the standard deviation of the fund’s monthly benchmark-adjusted return over the previous 12 months. The regression results are reported in Table 7, where the dependent variable is our main measure of volatility based on benchmark-adjusted net returns. In column 1, we examine whether HR + SO is positively associated with return volatility in the fund. The coefficient estimate indicates that a 1% increase in HR + SO is associated with a 3.09 bps increase in the volatility of the fund. One standard-deviation increase in HR + SO leads to an economically large increase of 22.71 bps ( $ 3.088\times 7.352 $
). Column 2 indicates that BA funds with
$ 3.088\times 7.352 $
). Column 2 indicates that BA funds with $ \unicode{x1D7D9} $
(HR + SO = 0) have 4 bps lower volatility than SF funds. Columns 3 and 4 show that home runs and strikeouts are both associated with higher fund volatility. Interestingly, columns 5 and 6 show that the performance measures, HR – SO and BA, do not exhibit a robust relation to volatility. In Table A.8 in the Supplementary Material, we repeat our analysis in Table 7, except that our dependent variable is the volatility of a four-factor alpha. We find qualitatively similar results. Moreover, we show that the results are robust to the inclusion of fund fixed effects. Therefore, both across all funds within a style category and within funds, we find that swinging for the fences is a strategy that increases fund return volatility.
$ \unicode{x1D7D9} $
(HR + SO = 0) have 4 bps lower volatility than SF funds. Columns 3 and 4 show that home runs and strikeouts are both associated with higher fund volatility. Interestingly, columns 5 and 6 show that the performance measures, HR – SO and BA, do not exhibit a robust relation to volatility. In Table A.8 in the Supplementary Material, we repeat our analysis in Table 7, except that our dependent variable is the volatility of a four-factor alpha. We find qualitatively similar results. Moreover, we show that the results are robust to the inclusion of fund fixed effects. Therefore, both across all funds within a style category and within funds, we find that swinging for the fences is a strategy that increases fund return volatility.
While our primary strategy measures are equal-weighted and thus place more emphasis on small holdings, we provide robustness tests using additional weighting schemes that emphasize larger holdings and more extreme returns and we report our results in column 4–6 of Table A.6 in the Supplementary Material. As in the weighted-return analysis, we use three weighting measures and find in all three panels that SF funds have higher idiosyncratic volatility regardless of how the strategy metrics are weighted. Our findings in this section show that, while swinging for the fences does not produce superior returns, it is a riskier strategy, as funds with a higher number of home runs and strikeouts in their portfolios exhibit higher volatility.
V. Management Incentives
Given that we find that the SF strategy incurs more risk, yet fails to deliver superior risk-adjusted returns, we now turn to managers’ incentives to pursue home runs. Specifically, we ask two questions: First, do funds use home runs to attract additional flows? Second, do fund managers use their home runs to justify higher fees? Each of these hypotheses, independently, would lead to increased fund revenue. In this section, we test these two hypotheses.
A. Fund Flows
To examine the relationship between the SF strategy and fund flows, we regress flows on strategy measures while controlling for fund characteristics, including past style premiums. Following the fund flow literature, we define QUARTERLY_Fund_FLOW in each quarter as the net flow into the fund divided by the lagged size of the fund. We control for past returns in our regressions by including lagged quarterly returns, returns over the past four quarters, and the returns for the past 3 years (Sirri and Tufano (Reference Sirri and Tufano1998)). In our regressions, we include category and calendar date fixed effects to further absorb the effects of fund investment style and general economic factors.
In Table 8, we observe the well-documented flow–performance relation (Sirri and Tufano (Reference Sirri and Tufano1998)). Past performance up to 3 years prior is correlated with fund flows. However, we find that, above and beyond the role of returns, our strategy measures significantly explain fund flows. In column 1, we find that the SF strategy (having high HR + SO) attracts additional flow. Whereas, the BA strategy $ \unicode{x1D7D9} $
(HR + SO = 0), attracts less flow. The magnitude of the effect is large. A 1-standard-deviation increase in the tendency to swing for the fences, as measured by HR + SO, is associated with 0.18% (
$ \unicode{x1D7D9} $
(HR + SO = 0), attracts less flow. The magnitude of the effect is large. A 1-standard-deviation increase in the tendency to swing for the fences, as measured by HR + SO, is associated with 0.18% ( $ 0.025\times 7.352 $
) increase in fund flow. In contrast, column 2 shows that having no home runs and strikeouts in the portfolio (HR + SO = 0) is associated with 0.04% decrease in flows. In terms of economic magnitude, the fund flow response to these strategies is meaningful. The average fund, for example, will receive $8.39 million in additional fund flows for a 1-standard-deviation increase in swinging for the fences.
$ 0.025\times 7.352 $
) increase in fund flow. In contrast, column 2 shows that having no home runs and strikeouts in the portfolio (HR + SO = 0) is associated with 0.04% decrease in flows. In terms of economic magnitude, the fund flow response to these strategies is meaningful. The average fund, for example, will receive $8.39 million in additional fund flows for a 1-standard-deviation increase in swinging for the fences.
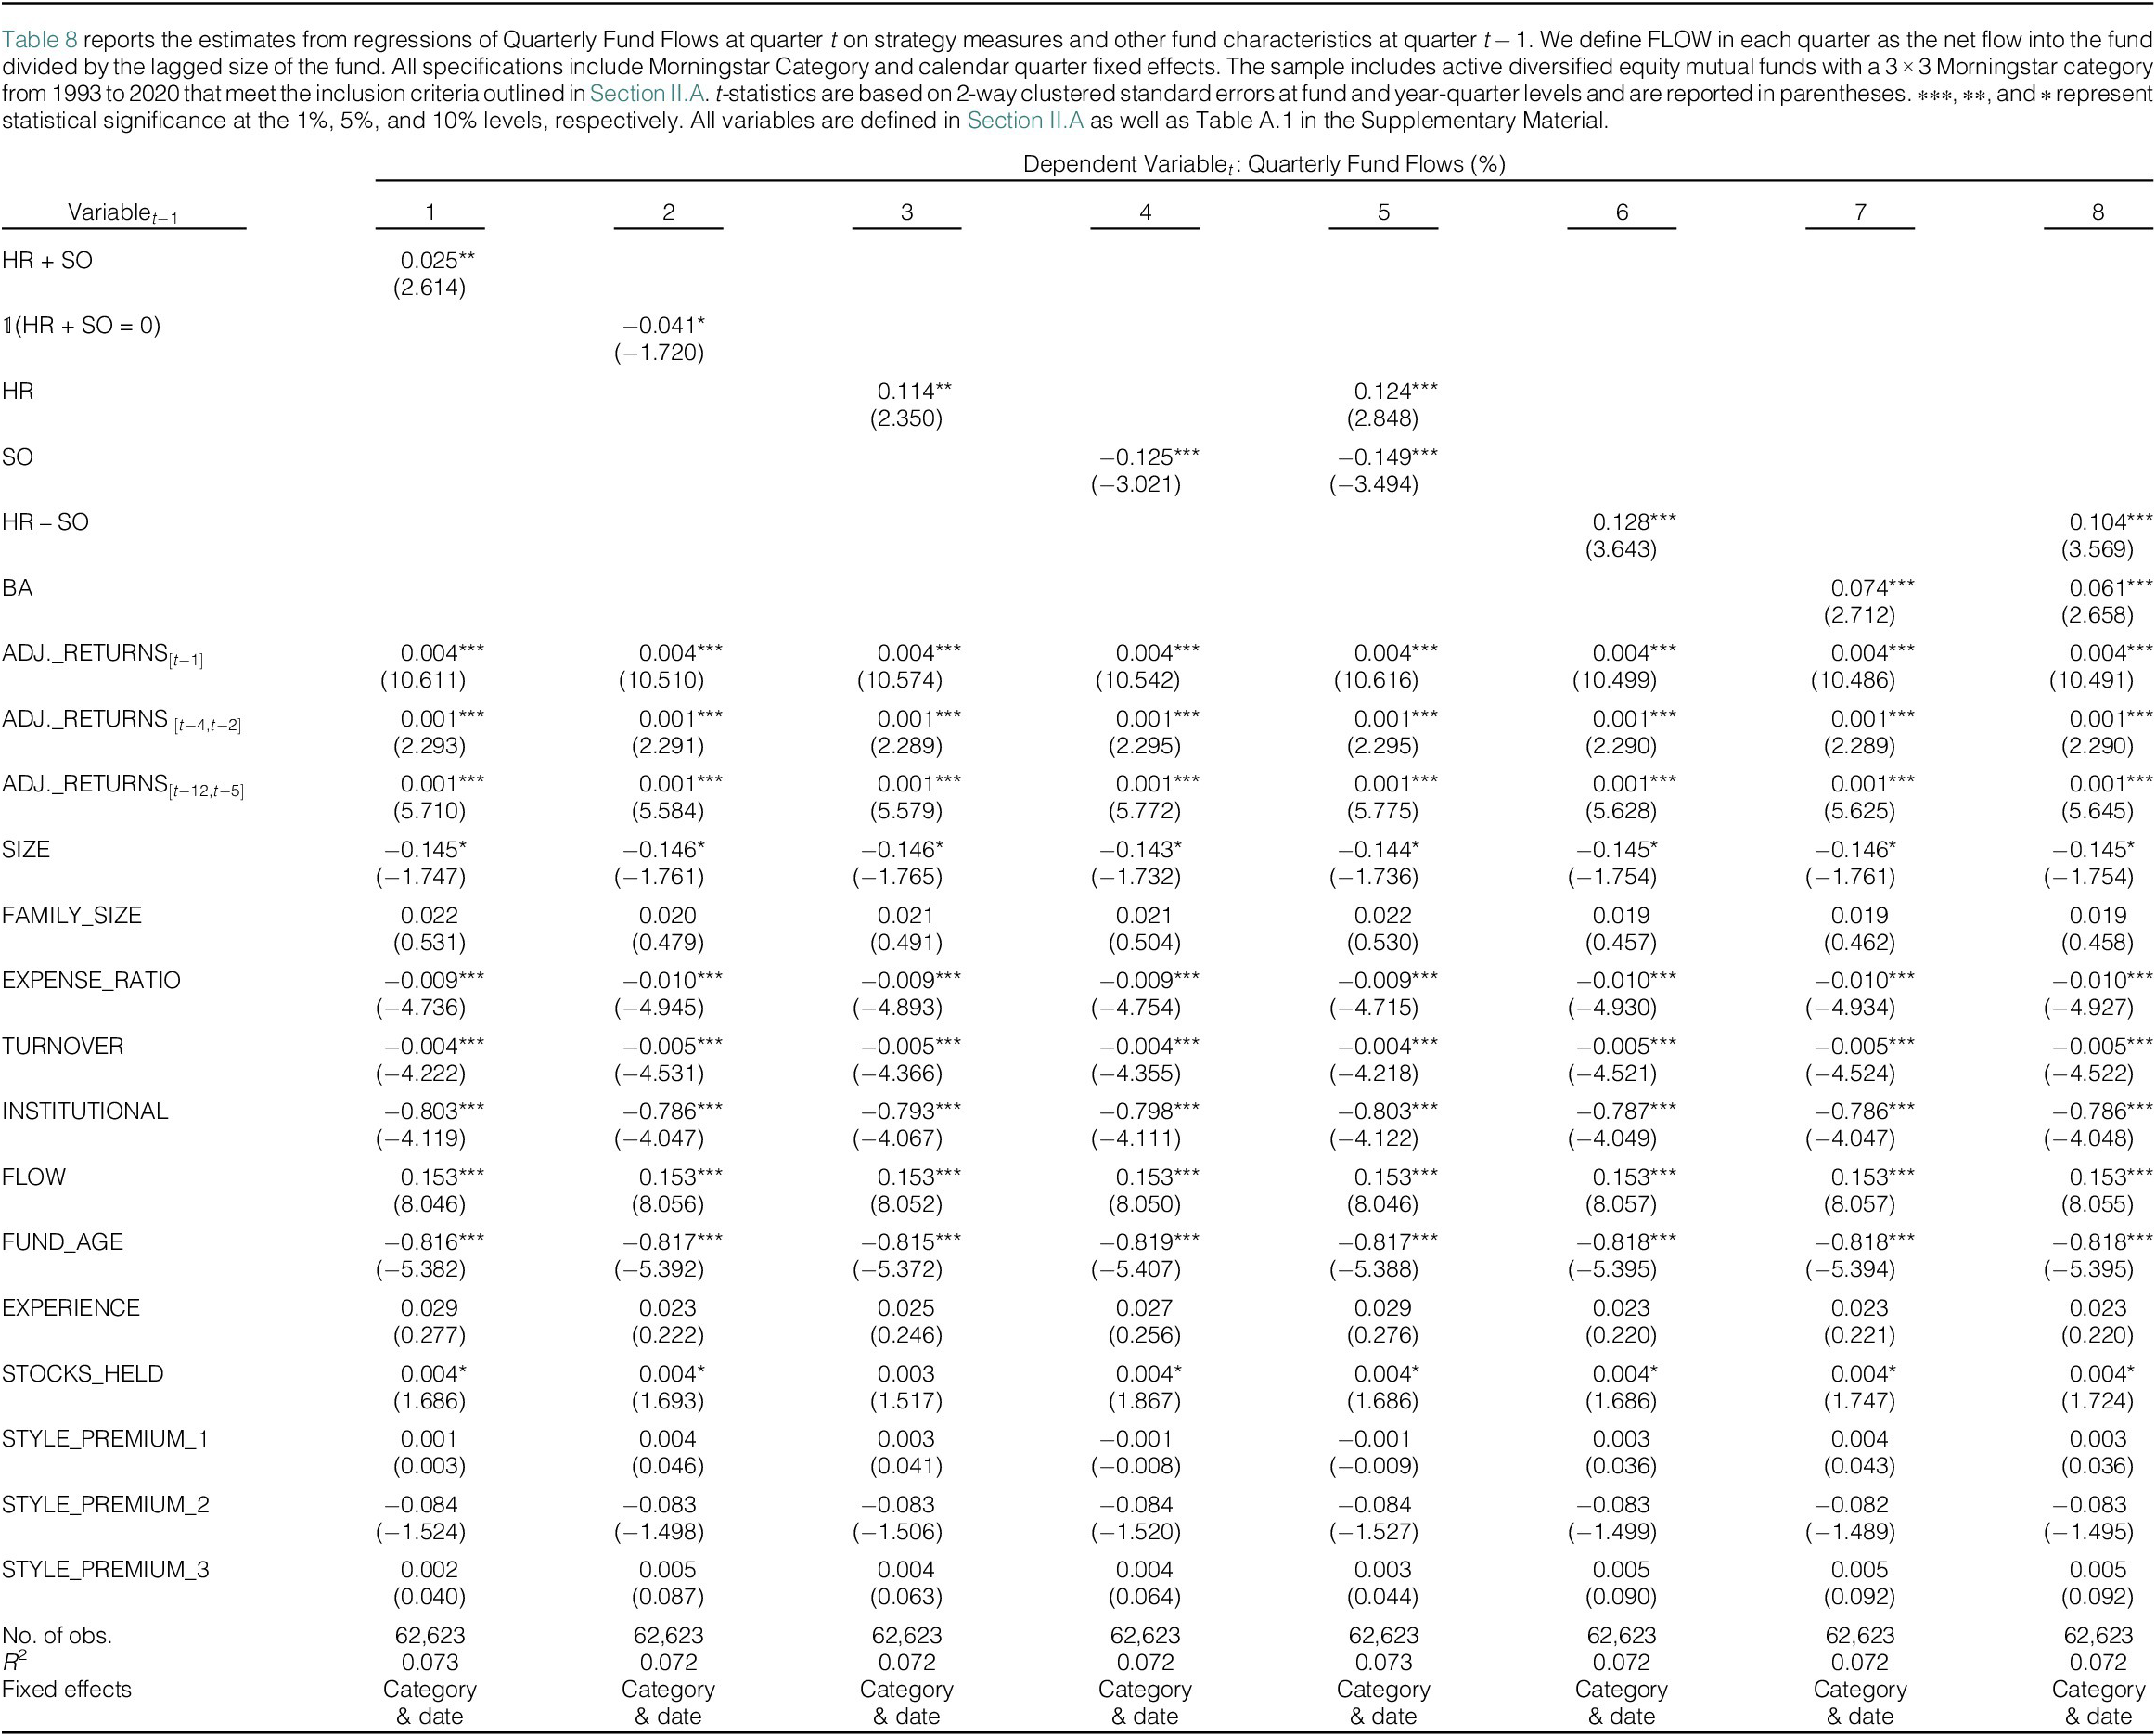
In columns 3 and 4, we examine the role of HR and SO separately. We find that having more home runs leads to additional flows, whereas more strikeouts lead to lower flows. Specifically, the estimates suggest that a 1-standard-deviation increase in HR is associated with 0.88% ( $ 0.114\times 7.718 $
) increase in flow, while the same increase in SO is associated with 0.80% (
$ 0.114\times 7.718 $
) increase in flow, while the same increase in SO is associated with 0.80% ( $ -0.125\times 6.429 $
) decrease in flows. Thus, while swinging for the fences attracts additional flows (column 1), investors reward managers for their home runs and punish managers for strikeouts.
$ -0.125\times 6.429 $
) decrease in flows. Thus, while swinging for the fences attracts additional flows (column 1), investors reward managers for their home runs and punish managers for strikeouts.
In column 5, we include both HR and SO in the flow model and document that the point estimate of investors’ response to strikeouts is slightly larger than it is for home runs. Despite these estimates, column 1 documents a net positive flow to swinging for the fences. This positive relation between the SF strategy and the fund flows is due to the fact that managers, on average, generate more home runs than strikeouts. In fact, Table 1 shows that funds do have more HRs on average than SOs, with both the mean and median being higher for HR by 1%. Specifically, using the estimated coefficients in column 5, the net flow response for the average fund—with an average HR value of 5.16 and SO value of 4.31—is 0.20%.Footnote 26 This response is very similar in magnitude to the estimated coefficient in column 1.
In columns 6–8, we examine the effect of the performance metrics, HR – SO and BA. Column 6 shows that a 1-standard-deviation increase in the spread (HR – SO) increases the additional fund flows by 0.70% ( $ 0.128\times 5.449 $
). Moreover, the same increase in BA is associated with 0.66% (
$ 0.128\times 5.449 $
). Moreover, the same increase in BA is associated with 0.66% ( $ 0.074\times 8.905 $
) increase in flow. For comparison, a 1-standard-deviation increase in ADJUSTED_RETURNS leads to 1.19% (
$ 0.074\times 8.905 $
) increase in flow. For comparison, a 1-standard-deviation increase in ADJUSTED_RETURNS leads to 1.19% ( $ 0.004\times 2.997\times 100 $
) increase in subsequent fund flows. Thus, the effect of our measures on flow is economically meaningful after controlling for the flow–performance relation.Footnote
27
$ 0.004\times 2.997\times 100 $
) increase in subsequent fund flows. Thus, the effect of our measures on flow is economically meaningful after controlling for the flow–performance relation.Footnote
27
Our primary strategy measures are equal-weighted and thus place more emphasis on small holdings. We believe the simplicity of our extreme-performer measures is in line with how an investor might notice that a home run is held in the portfolio when selecting funds. However, investors’ response to more impactful home runs and strikeouts could be amplified. We replicate our analysis in Table 8 with alternative fund-level HR, SO, and BA measures based on three weighting schemes that emphasize larger holdings and more extreme returns, and we report our results in columns 7–9 of Table A.6 in the Supplementary Material. Specifically, we define value-weighted measures using portfolio weights (Panel A), return-weighted measures using holdings’ returns as weights (Panel B), and measured based on top–20 largest holdings (Panel C). In all three panels, we find similar evidence that home runs attract flows while strikeouts decrease flows, with the SF strategy attracting a net positive flow regardless of how the strategy metrics are weighted and calculated. Furthermore, we find that strategy metrics that emphasize more economically valuable home runs and strikeouts, particularly value-weighted alternatives, are associated with larger estimated coefficients, suggesting that investors respond to more salient holdings more strongly. Following this finding, we further investigate the role of salience—both marketing activity and economic impact—in the relationship between the SF strategy and flows.
As noted, Table 8 documents investors’ reactions to home runs and strikeouts, implying that these are salient measures that affect flows. Given that the strategy to swing for the fences delivers a net positive capital flow to SF funds, managers have incentives to swing for the fences and promote their home runs to attract more flows. The evidence in Section V.B shows that fund managers that swing for the fences indeed highlight their home runs and strikeouts in their performance commentary. We now investigate whether home-run and strikeout holdings have a larger effect on flows when mutual funds mention their specific holdings in their managerial discussion of performance. To do so, we interact strategy measures with the indicators of whether the fund mentions holdings.Footnote
28 In Table 9, column 1, we interact HR with MENTIONED_HR and find that capital flows are more responsive to home-run holdings when the fund mentions the specific stocks in its performance discussion as factors that contributed to the fund’s performance. The economic impact is meaningful. A 1% increase in HR is associated with 7.1 bps increase in flows, while the same increase in HR among funds that mention home runs leads to 15.3 bps increase in flows. In column 2, we investigate the effect of being mentioned on strikeouts. Similarly, strikeouts among funds that mention them detract more than twice the flow relative to strikeouts in funds that do not mention them. The magnitude of these effects is comparable to flow/performance sensitivity. For example, 1 standard-deviation increase in HR in funds that mention them in the N-CSR is associated with 1.18% ( $ 0.153\times 7.718 $
) increase in flow, which is comparable to the 1.49% (
$ 0.153\times 7.718 $
) increase in flow, which is comparable to the 1.49% ( $ 0.005\times 2.997\times 100 $
) effect observed in response to the same increase in benchmark-adjusted net returns.
$ 0.005\times 2.997\times 100 $
) effect observed in response to the same increase in benchmark-adjusted net returns.
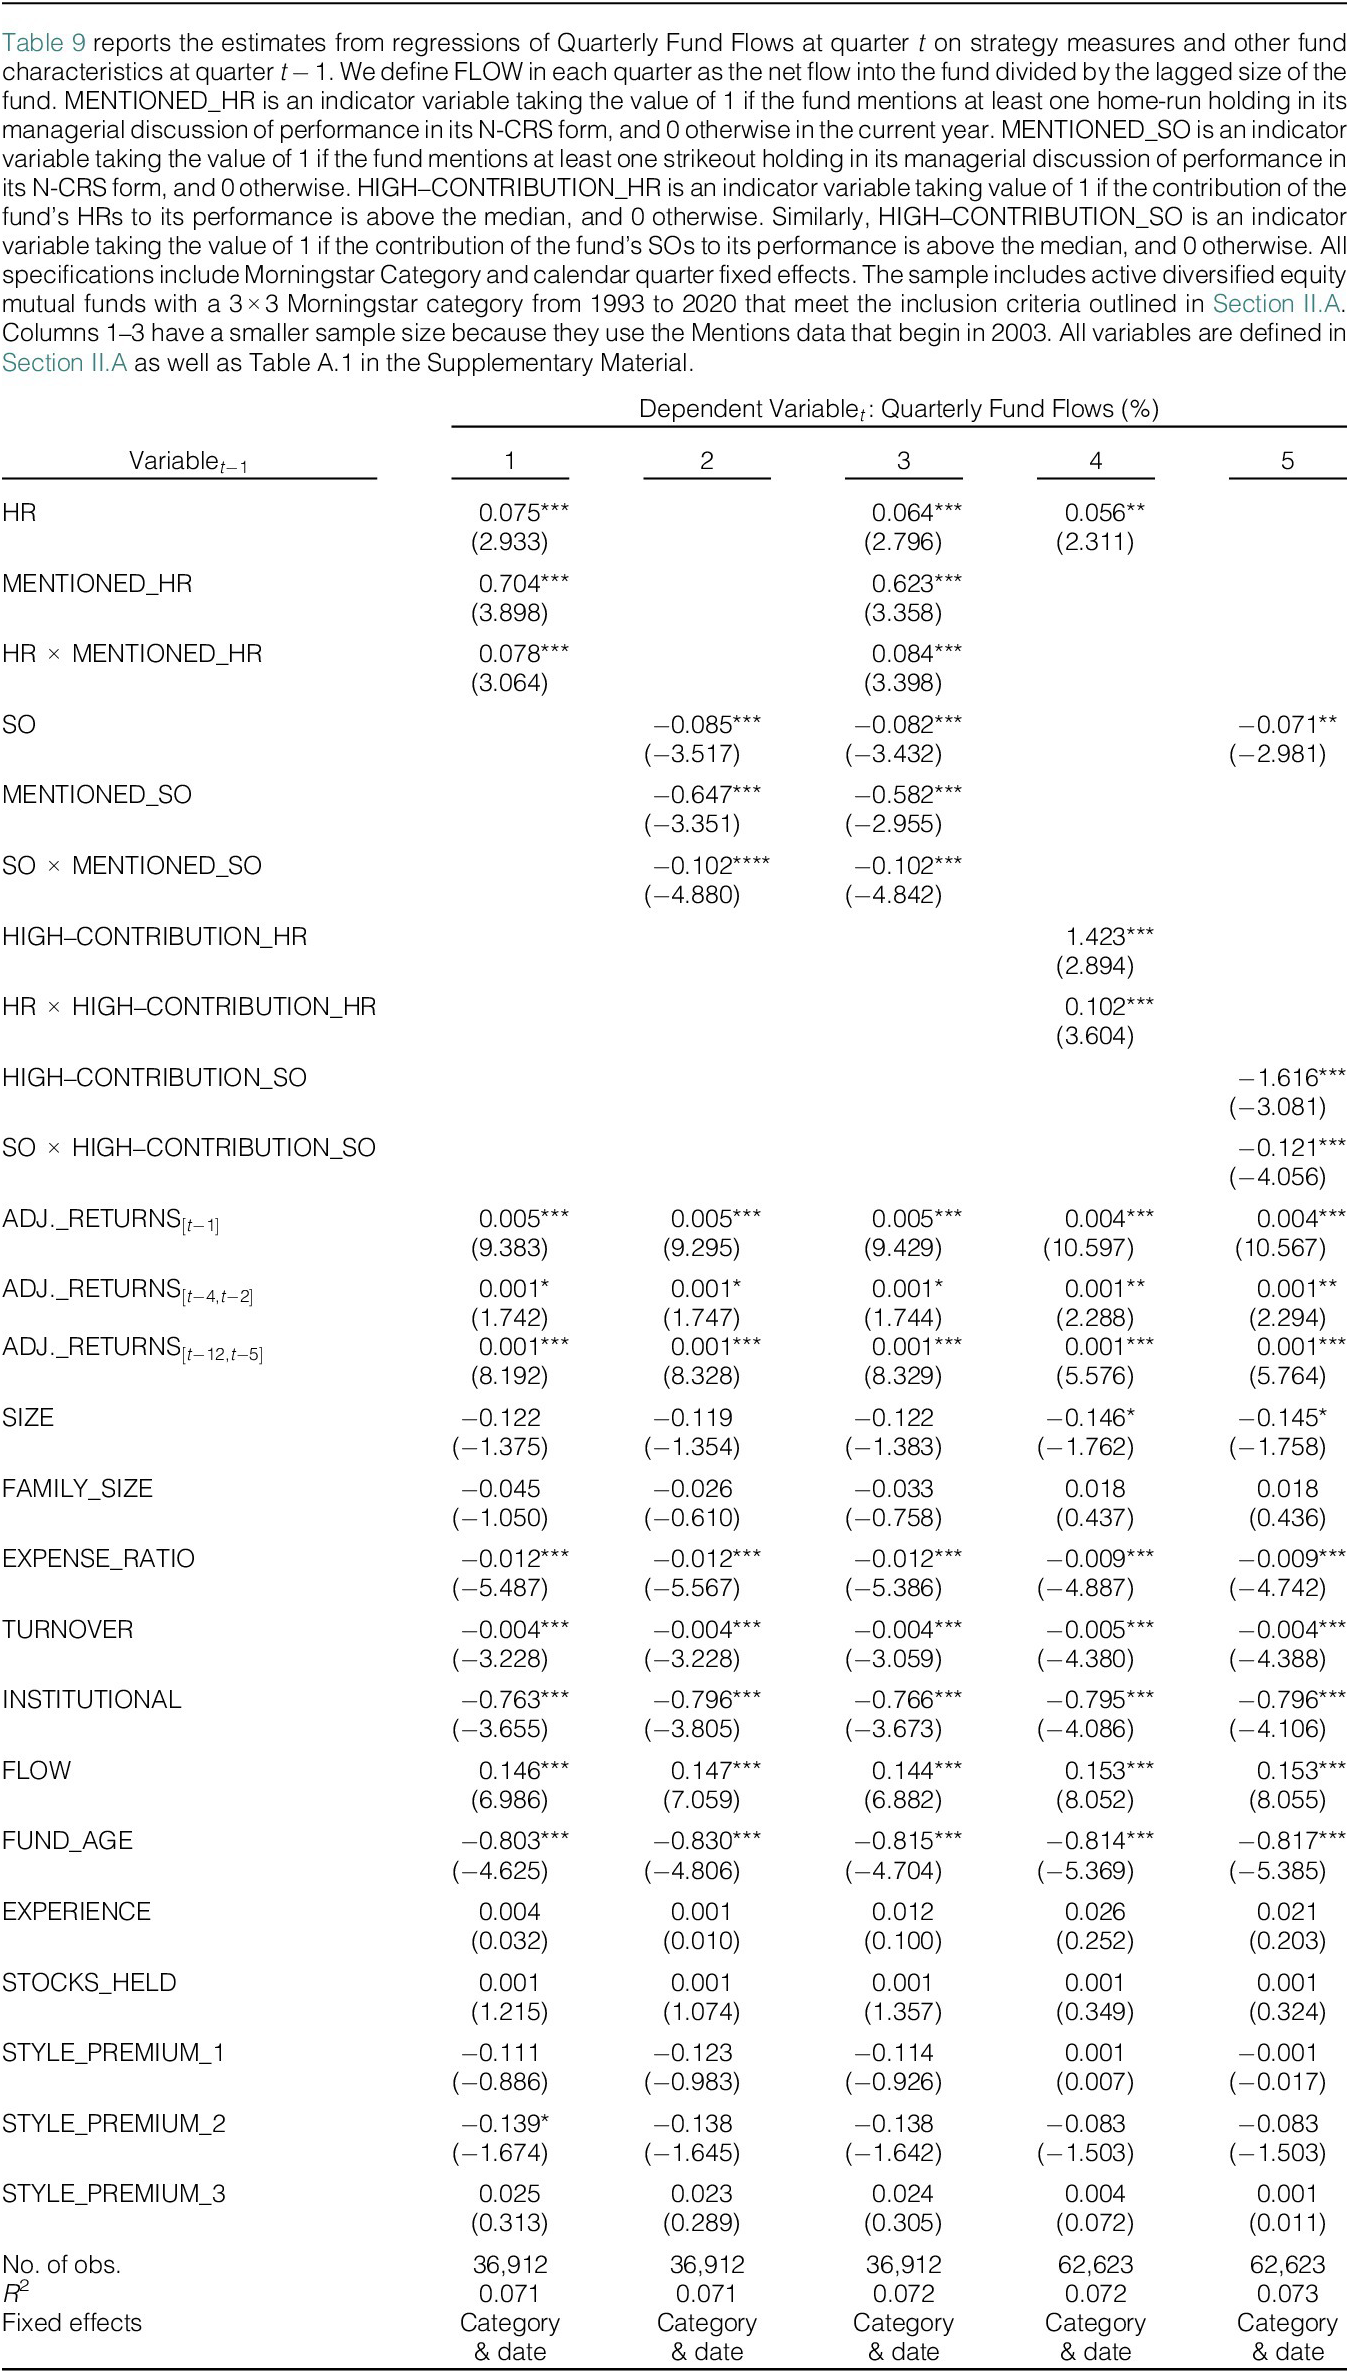
Section V.B documents that home runs and strikeouts are more likely to be named in shareholder reports when the holdings are larger or the returns are more extreme and, therefore, economically more impactful. In column 4, we examine whether these more salient holdings have a larger effect on flows. We interact with HR with HIGH–CONTRIBUTION_HR and find that HR attracts more flow when the home runs have a larger impact on performance. Specifically, while a 1% increase in low-contribution HR is associated with 0.43% ( $ 0.056\times 7.718 $
) increase in flows, the same increase in HR among funds with more impactful home runs leads to 1.22%
$ 0.056\times 7.718 $
) increase in flows, the same increase in HR among funds with more impactful home runs leads to 1.22% $ \Big(0.158\times 7.718 $
) increase in capital flows to the fund. In column 5, we investigate the effect of important strikeouts. Similarly, high-contribution SOs detract almost twice as many flows as low-contribution SOs do.
$ \Big(0.158\times 7.718 $
) increase in capital flows to the fund. In column 5, we investigate the effect of important strikeouts. Similarly, high-contribution SOs detract almost twice as many flows as low-contribution SOs do.
Our last piece of analysis on fund flows focuses on funds with primarily retail investor clients. The findings in Table 5 show that funds that primarily sell to institutional investors are less likely to swing for the fences, whereas retail-focused funds tend to invest in home runs and strikeouts more frequently. This finding is consistent with the notion that less sophisticated investors tend to interpret holding stocks with extreme performance as a measure of skill among fund managers. We now test whether the subsequent flow of capital from these investors is more responsive to past HR and SO by interacting strategy measures with RETAIL_FUND, an indicator of whether the fund primarily sells to retail clients. We report our estimation results in Table A.10 in the Supplementary Material. In sum, although the effect of strategy measures on subsequent flows is still statistically and economically significant for institutional funds, this effect is 65%–86% stronger among retail-focused funds.
The results in Tables 8, 9, and A.10 in the Supplementary Material, show that investors reward funds with more flow when they have more HRs and withdraw flows from funds with more SOs, though on net the average SF strategy leads to higher flows. These flow effects are significantly stronger when holdings are highlighted in shareholder reports and when they have a greater economic impact on fund performance. Moreover, this effect is stronger among funds with a focus on retail investors. Our findings suggest that investors interpret home runs as signals of managerial skill, especially when managers emphasize them in disclosures, creating incentives for managers to swing for the fences and strategically highlight home runs to attract capital flows.
B. Fund Fees
Fund fees charged by mutual funds directly generate revenue for mutual fund companies. These fees are meaningful and vary substantially across funds. For example, Sheng et al. (Reference Sheng, Simutin and Zhang2023) document that in the United States in 2019, fees amounted to tens of billions of dollars and ranged from 0.5% per year for the “cheapest” decile of actively managed funds to 2% for the most “expensive” decile. Given the magnitude of fee-based revenue for mutual fund families, another incentive for active mutual funds to swing for the fences is to use home-run holdings to justify higher fees.
To test this hypothesis, we sort funds into five portfolios based on their tendency to swing for the fences as measured by HR + SO in each quarter. Then, we follow two High and Low portfolios in the following quarter and examine their expense ratios. In Figure 4, we draw the distribution of expense ratios for the funds in these two portfolios. Figure 4 shows that funds in the portfolio of High HR + SO—those who tend to swing for the fences—charge substantially higher fees relative to funds in the portfolio of Low HR + SO.
Figure 4 shows the distribution of Expense Ratios within portfolios of funds with the highest and lowest HR + SO. In each quarter, funds are sorted and funds in the 20th and 80th percentile are assigned to the Low HR + SO and High HR + SO portfolios, respectively. Expense Ratios in the following quarter for each of these funds are presented in the figure. The sample includes active diversified equity mutual funds with a $ 3\times 3 $
Morningstar category from 1993 to 2020 that meet the inclusion criteria outlined in Section II.A. All variables are defined in Section II.A as well as Table A.1 in the Supplementary Material.
$ 3\times 3 $
Morningstar category from 1993 to 2020 that meet the inclusion criteria outlined in Section II.A. All variables are defined in Section II.A as well as Table A.1 in the Supplementary Material.

One potential concern with the sorting analysis in Figure 4 is that funds in the small-cap categories generally charge higher fees. This fact is relevant because our measures, HR and SO, are both naturally higher in small-cap categories. Therefore, it is possible that the result above is just an artifact of sorting funds into style categories. To address this concern, we regress fund EXPENSE_RATIO in basis points on lagged values of our strategy measures while controlling for prominent fund characteristics and style categories. We report the results in Table 10. There are several takeaways.

First, our regressions confirm previously known facts about fees: larger, older funds within larger families have lower expense ratios. Moreover, there is a negative relation between net-of-fee returns and expense ratios. What is new is that funds that swing for the fences have higher expense ratios. Moreover, this relationship is robust to the inclusion of category and date fixed effects. In terms of economic magnitude, estimates in column 1 imply that a 1-standard-deviation increase in HR + SO is associated with 3.7 ( $ 0.503\times 7.352 $
) bps increase in fund fees. This is roughly equivalent to one-tenth of a standard deviation increase in expense ratios. In contrast, column 2 shows that BA funds with
$ 0.503\times 7.352 $
) bps increase in fund fees. This is roughly equivalent to one-tenth of a standard deviation increase in expense ratios. In contrast, column 2 shows that BA funds with $ \unicode{x1D7D9} $
(HR + SO = 0) charge 1.91 bps lower fees. Moreover, columns 3 and 4 show the effect of HR and SO on expense ratios. The presence of both home runs and strikeouts in the portfolio is associated with higher fees. This is not surprising given that HR and SO tend to happen simultaneously in the portfolio.Footnote
29
$ \unicode{x1D7D9} $
(HR + SO = 0) charge 1.91 bps lower fees. Moreover, columns 3 and 4 show the effect of HR and SO on expense ratios. The presence of both home runs and strikeouts in the portfolio is associated with higher fees. This is not surprising given that HR and SO tend to happen simultaneously in the portfolio.Footnote
29
Furthermore, in columns 5–7, we examine whether performing well under either of the strategies is related to the fees and find that none of the coefficient estimates are significant. Specifically, HR – SO, a measure of high performance in hitting home runs, is unrelated to fees. Similarly, BA seems to be unrelated to expense ratios. It appears that funds that pursue SF as a strategy charge higher fees. However, fees do not seem to be sensitive to how well funds perform the strategy and hit home runs. This lack of sensitivity is not surprising given the fixed, sticky nature of fund fees.
Last, we investigate whether the association between the SF strategy and higher expense ratios is stronger when mutual funds mention their specific holdings in their managerial discussion of performance. To do so, we interact strategy measures with indicators of whether the fund mentions holdings and report our results in Table 11. In column 1, we interact HR with MENTIONED_HR and report a positive coefficient on the interaction term. In column 2, we investigate the effect of highlighting strikeouts. Similarly, SOs among funds that mention them are associated with higher fees more strongly relative to SOs in funds that do not mention them. In column 3, we include both interaction terms in our model and find similar results. While the statistical significance of these effects is small, the economic impact is meaningful. Specifically, the effect of SF measures on higher fees is 17–38% higher when the fund highlights holdings in its performance discussion.Footnote 30

The results in Tables 10 and 11 show that funds pursuing the SF strategy tend to charge higher expense ratios. These flow effects are significantly stronger when holdings are highlighted in shareholder reports. Our findings suggest that investors interpret home runs as signals of managerial skill, creating incentives for managers to swing for the fences and strategically highlight home runs as justification for higher fees.
VI. Evidence from Passive Funds
If swinging for the fences is an investment strategy utilized by actively managed funds to stand out as skilled stock pickers, we would not expect to observe this behavior in passive funds. As a falsification test, we use a sample of passively managed funds to investigate whether our SF and BA measures are meaningfully related to fund characteristics. To construct our sample of passive funds, we follow the same procedure used to construct our active sample. Our final sample of passive mutual funds consists of 218 unique funds and 7,826 fund-quarter observations from 1993 to 2020.
We begin our examination of our strategy measures in passive funds by repeating our analysis from Table 5. Specifically, we regress our measures on a set of fund characteristics and report our estimates in Table 12. In contrast to active funds, fund size has no relation with HR and SO, suggesting there are no decreasing returns to scale among passive funds. Furthermore, there is no significant difference between funds with institutional clients and those with retail clients. Fees and turnover ratios are not related to the SF and BA strategies either. More importantly, contrary to actively managed funds, where younger funds and younger managers were more likely to swing for the fences, no relation exists between the strategy measures and fund age or manager experience. Figure A.3 in the Supplementary Material clearly shows this lack of relation between age and strategy. Specifically, all measures of swinging for the fences—HR + SO, HR, SO, and HR – SO—are fairly constant across funds of varying ages in our sample. This lends credence to our hypothesis that the negative relation between age and swinging for the fences is indeed a strategy for younger funds that allows managers to stand out from the competition and is thus motivated by career concerns.
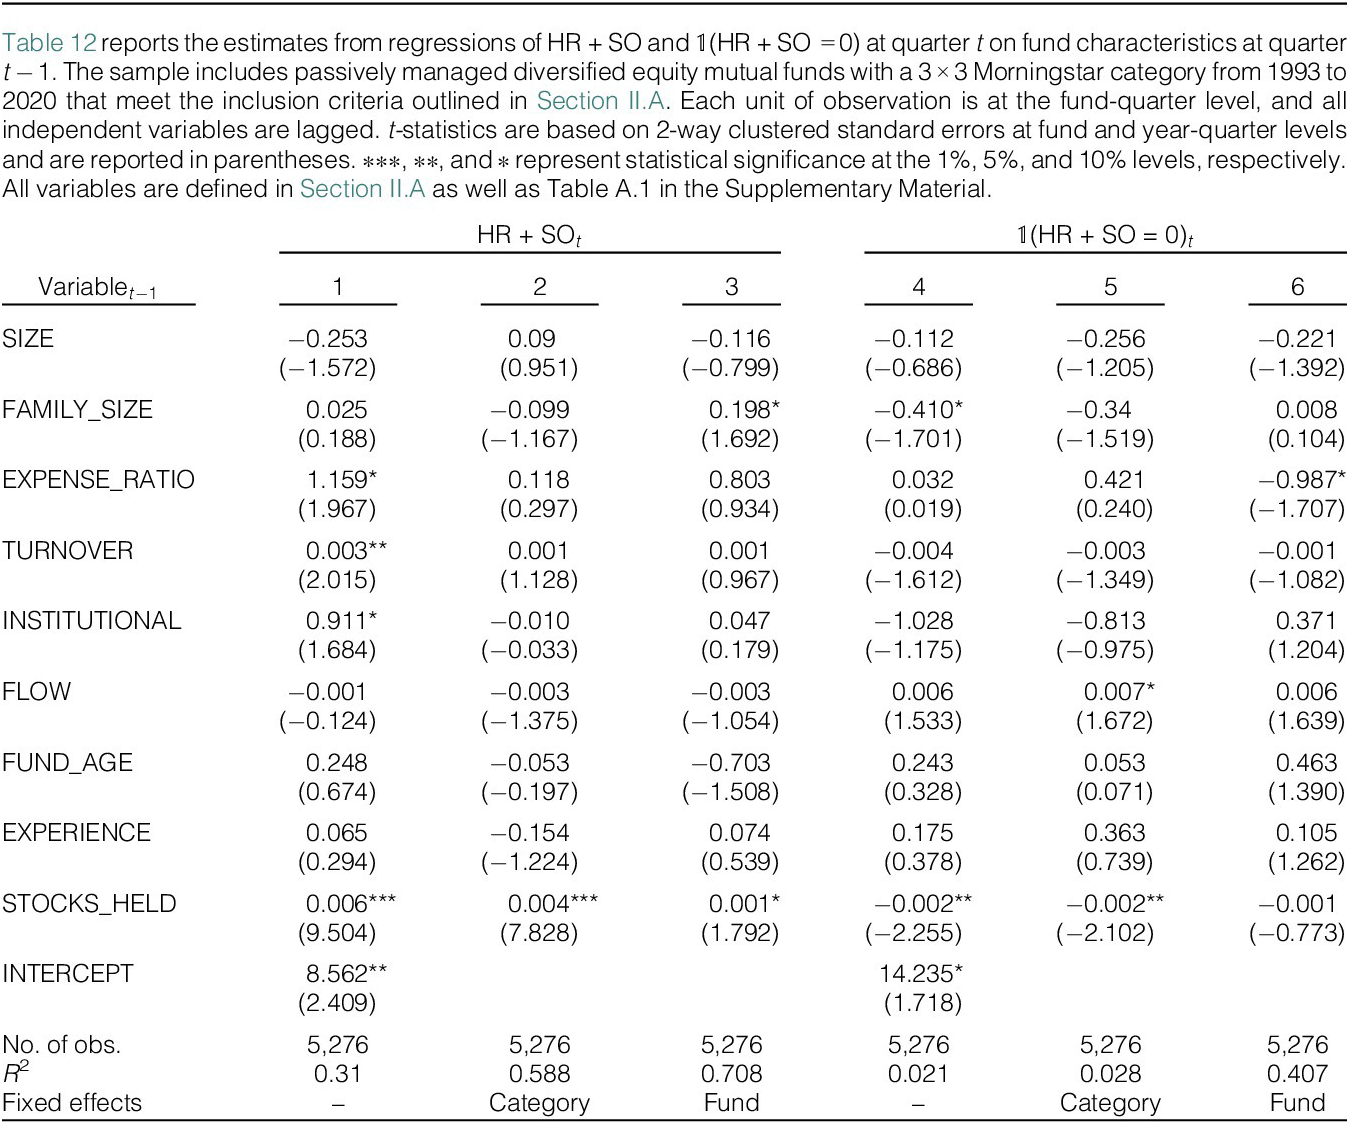
The second part of our analysis of passive funds involves investigating the effect of our measures on performance, flows, and fees. Specifically, following the same specifications, we regress measures of performance, flows, and fees on lagged values of the strategy measures, past performance, and other fund characteristics for passive funds. In columns 1–4 of Table 13, where we regress fund benchmark-adjusted net returns and volatility on the two strategy measures, HR + SO and $ \unicode{x1D7D9} $
(HR + SO = 0), we find no evidence that passive funds’ returns or volatility are related to our measures of swinging for the fences or batting for average. This is important because, unlike active funds, HR and SO do not explain portfolio risk. We study fund flows in columns 5 and 6. The coefficient estimates of both measures are statistically insignificant, suggesting that investors do not reward passive funds for having home runs and strikeouts in their portfolios. In columns 7 and 8, we examine expense ratios for passive funds and find a similar result. Neither HR + SO nor
$ \unicode{x1D7D9} $
(HR + SO = 0), we find no evidence that passive funds’ returns or volatility are related to our measures of swinging for the fences or batting for average. This is important because, unlike active funds, HR and SO do not explain portfolio risk. We study fund flows in columns 5 and 6. The coefficient estimates of both measures are statistically insignificant, suggesting that investors do not reward passive funds for having home runs and strikeouts in their portfolios. In columns 7 and 8, we examine expense ratios for passive funds and find a similar result. Neither HR + SO nor $ \unicode{x1D7D9} $
(HR + SO = 0) is associated with higher expense ratios among passive funds. These findings further suggest that home runs and strikeouts that happen naturally in passive portfolios do not carry information for investors that alters fund flows or results in higher fees.
$ \unicode{x1D7D9} $
(HR + SO = 0) is associated with higher expense ratios among passive funds. These findings further suggest that home runs and strikeouts that happen naturally in passive portfolios do not carry information for investors that alters fund flows or results in higher fees.
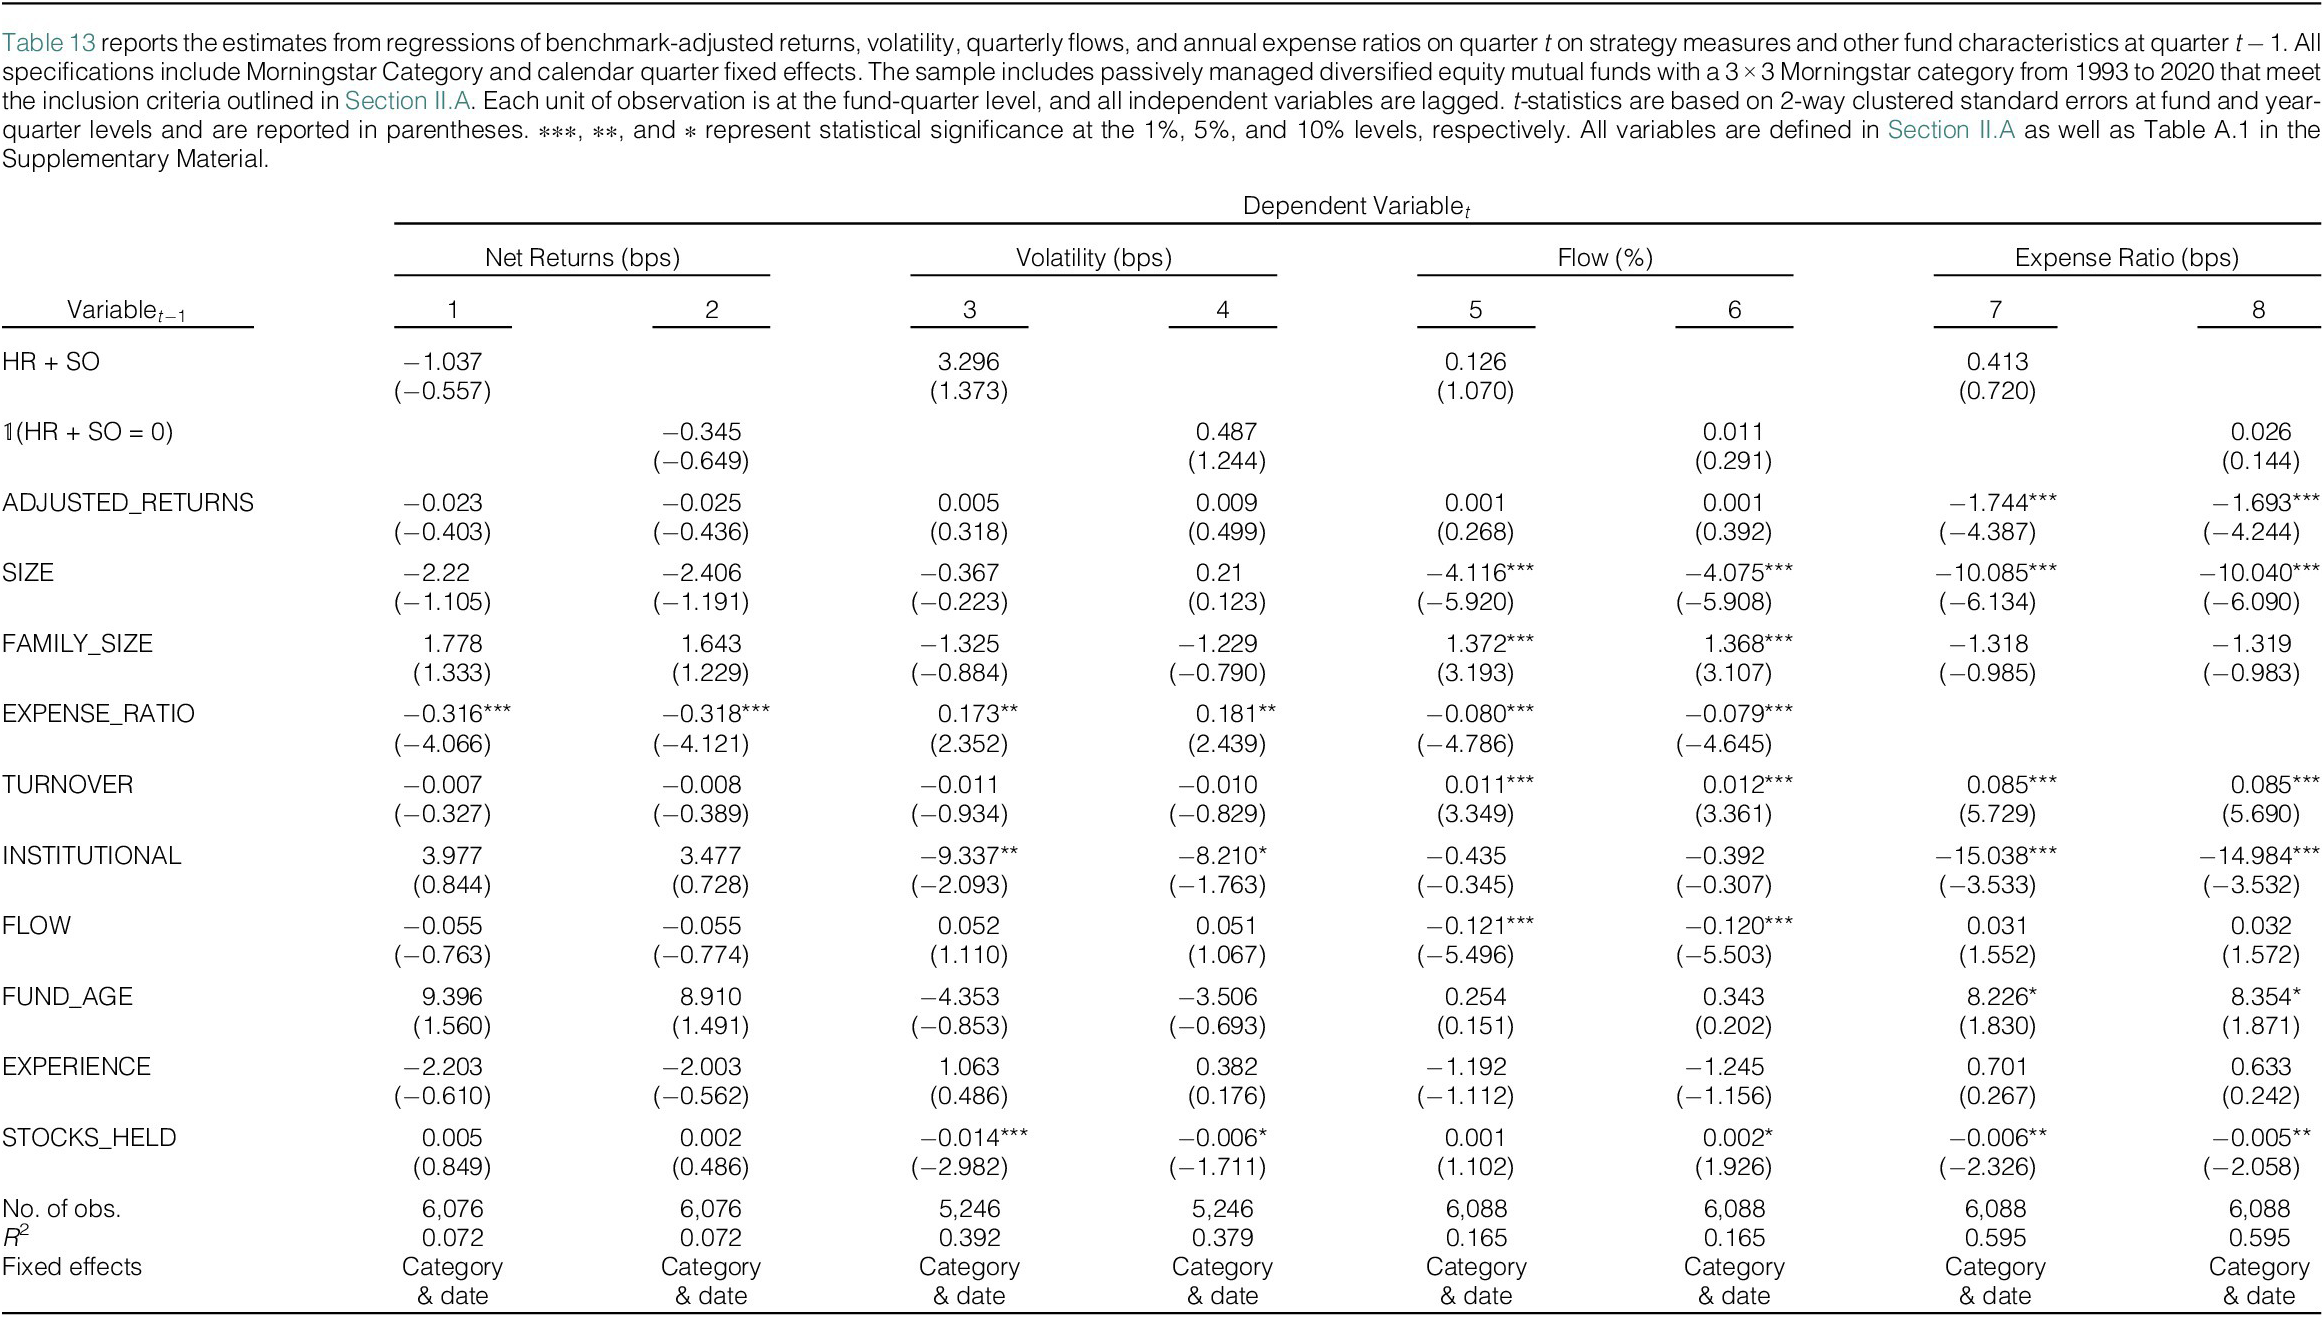
VII. Conclusion
We characterize mutual funds’ stock-picking strategies by documenting that some funds swing for the fences in hopes of hitting home runs, which we define as stocks with returns in the top decile of their FF25 portfolio of peers. These funds successfully hit home runs but often strike out, defined as holding stocks with returns in the bottom decile of the FF25-adjusted return distribution. Other funds simply bat for average and avoid extreme stock performance.
We find strong evidence that SF and BA represent persistent, intentional strategies rather than variations in active management or exposure to known risk factors. The distinction between these two stock-picking strategies helps explain many of the stylized facts surrounding variables that are commonly used in the mutual fund literature.
We document that younger funds and early-career managers, as well as funds with a focus on retail investors, are more likely to swing for the fences. We also show that funds that swing for the fences deliver similar benchmark-adjusted returns while exhibiting higher return volatility. Despite this, SF funds attract higher future capital flows, especially when their home runs are highlighted in shareholder reports, suggesting a marketing motive behind the strategy. Overall, it appears that investors are attracted to funds that swing for the fences, despite the fact that they do not receive superior risk-adjusted performance.
Using a set of falsification tests with passively managed funds that do not share the same stock-picking objectives, we confirm that the observed patterns are specific to active management decisions. Passive funds do not exhibit similar associations between strategy measures and performance, flows, or fees, supporting the interpretation that SF and BA are deliberate stock-selection strategies.
This article makes three main contributions. First, it introduces and empirically validates the SF and BA frameworks as distinct, persistent mutual fund strategies. Second, it provides new insights into how fund characteristics, such as age, manager experience, client type, and fund size, shape strategic choices and investor responses. Third, it extends the literature on mutual fund flows and fees by showing that extreme past outcomes—both positive and negative—jointly affect capital allocation and may be used to justify higher fees. In doing so, we highlight how active fund managers use performance salience to compete for investor attention, even in the absence of superior risk-adjusted performance.
Supplementary Material
To view supplementary material for this article, please visit http://doi.org/10.1017/S0022109026102865.




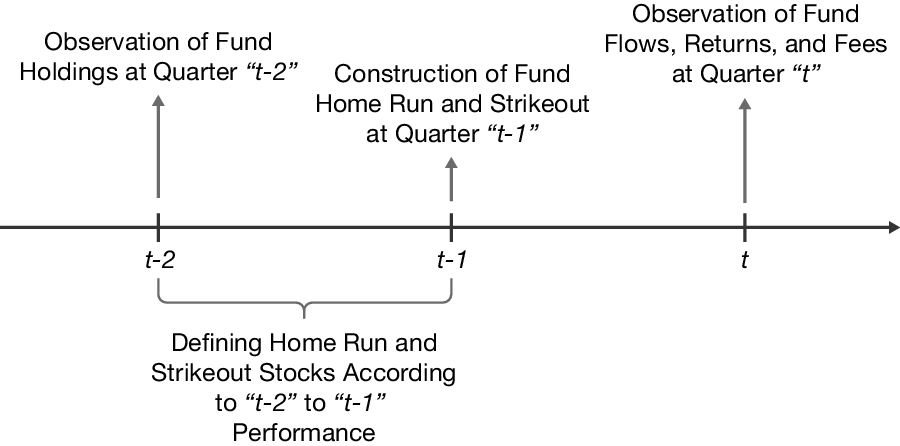


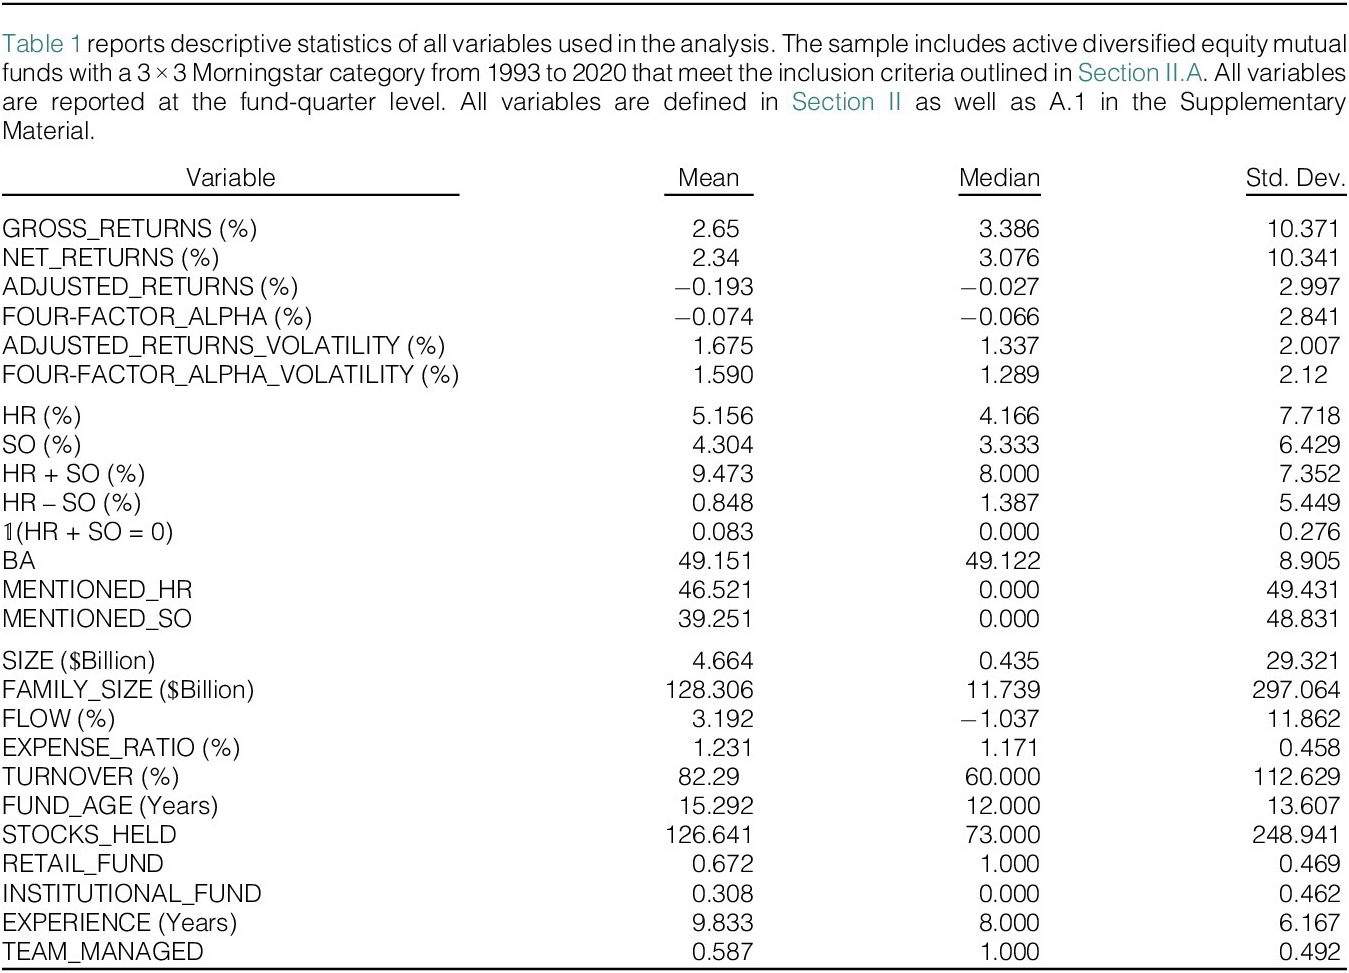
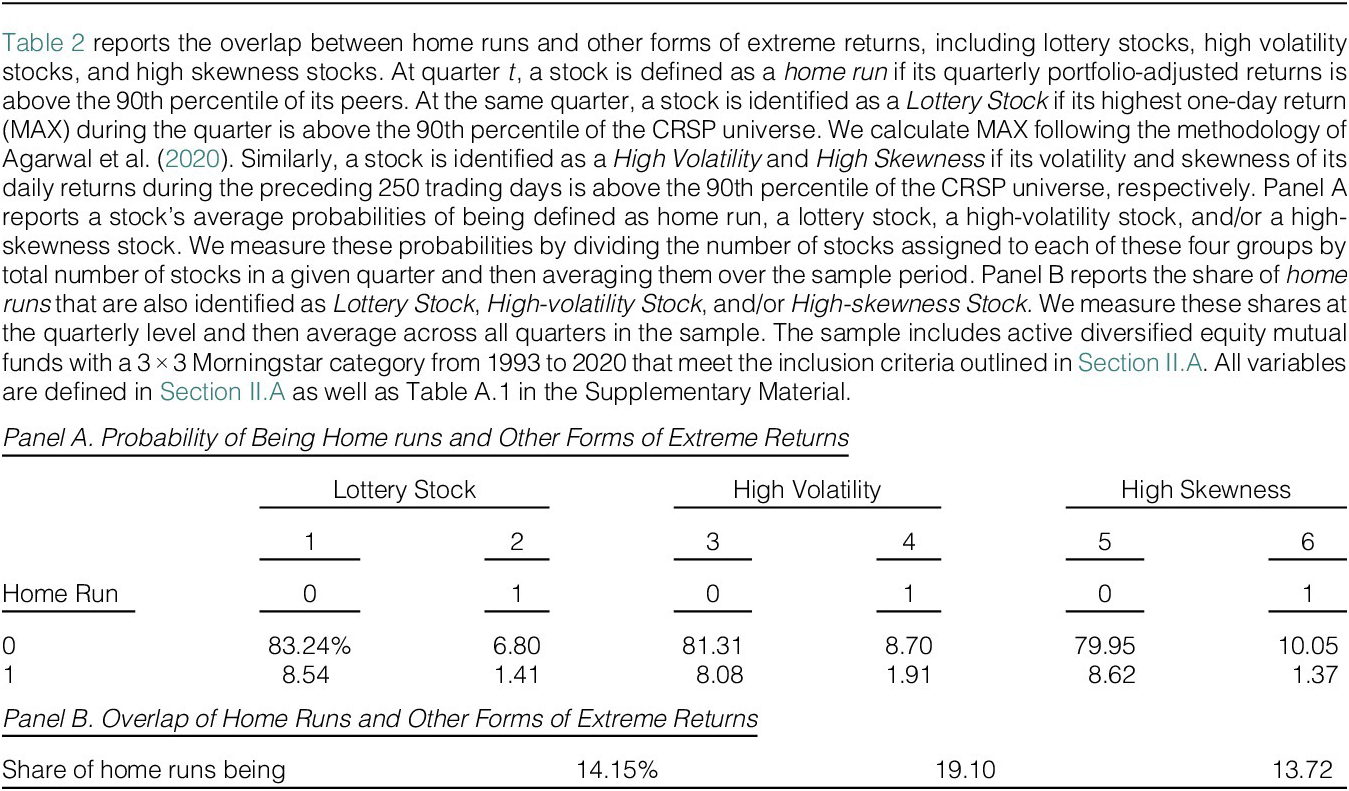
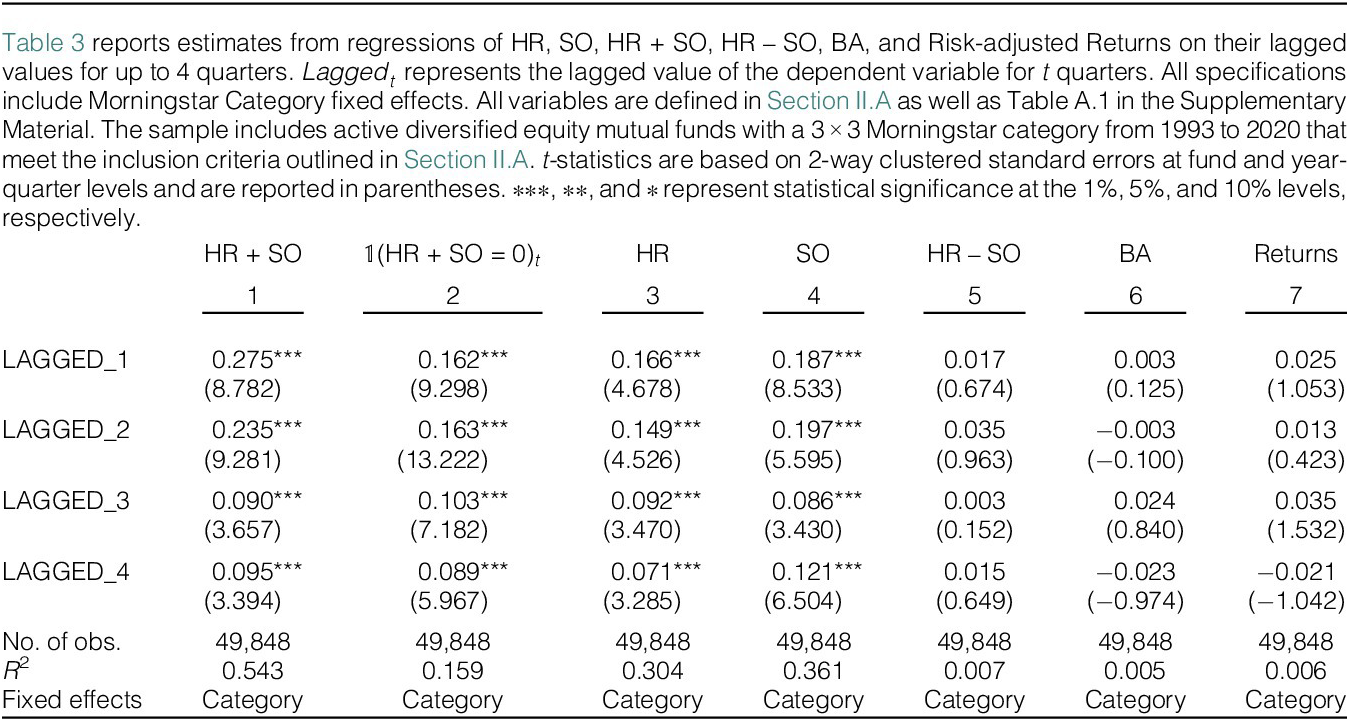
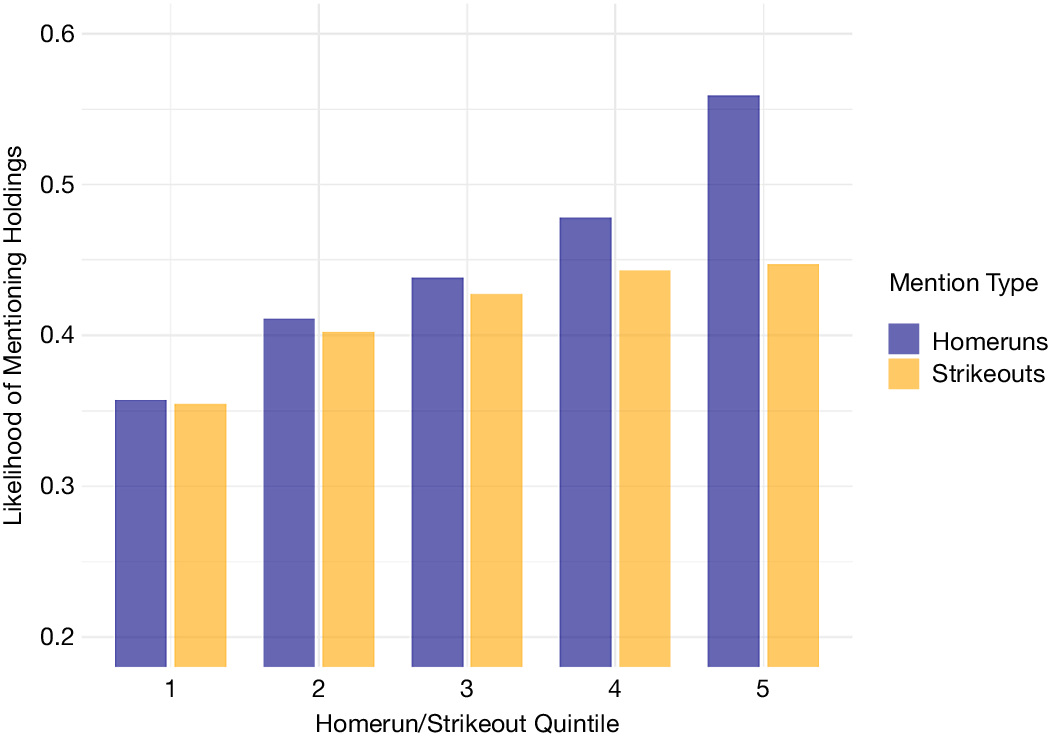
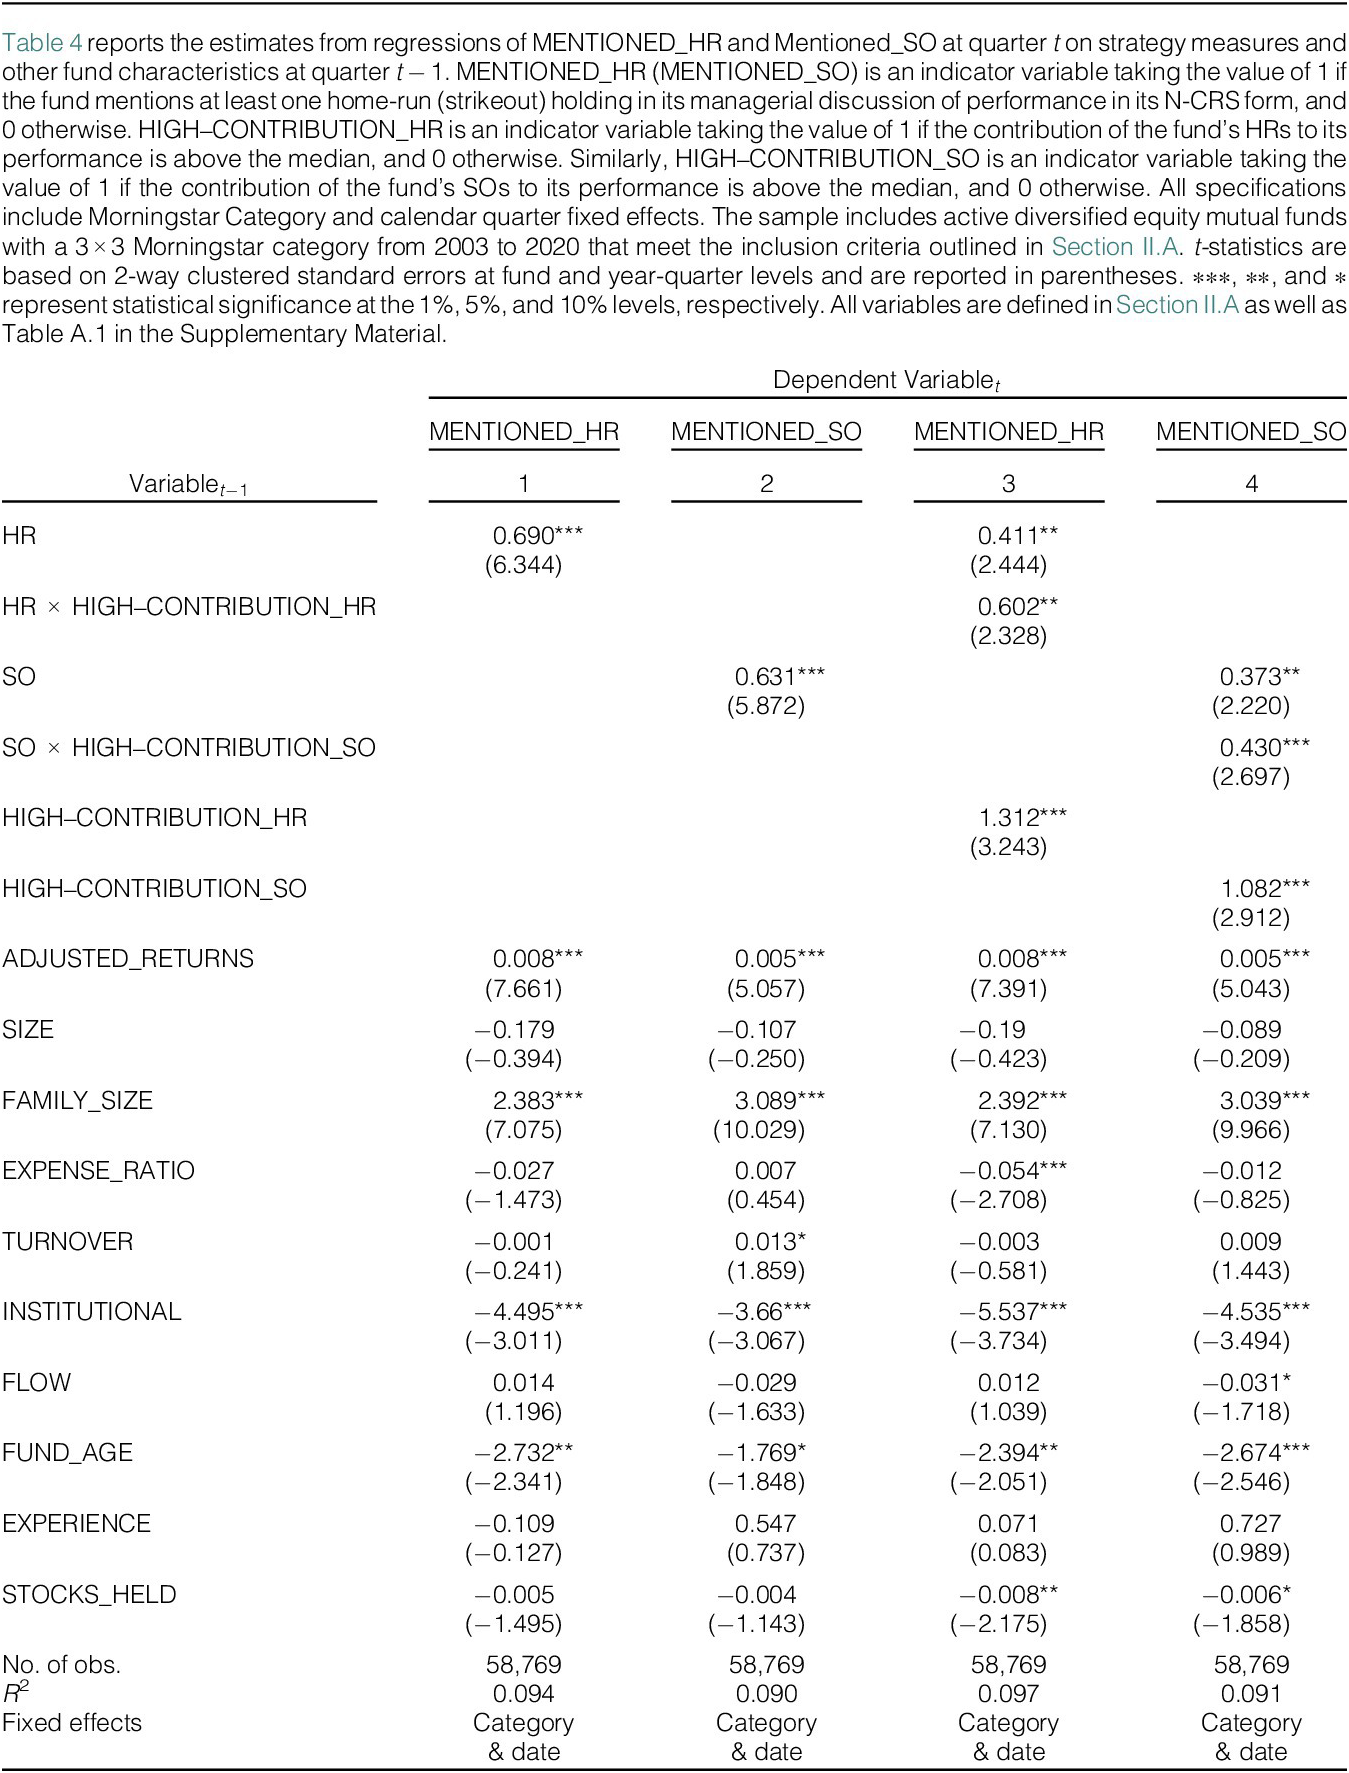
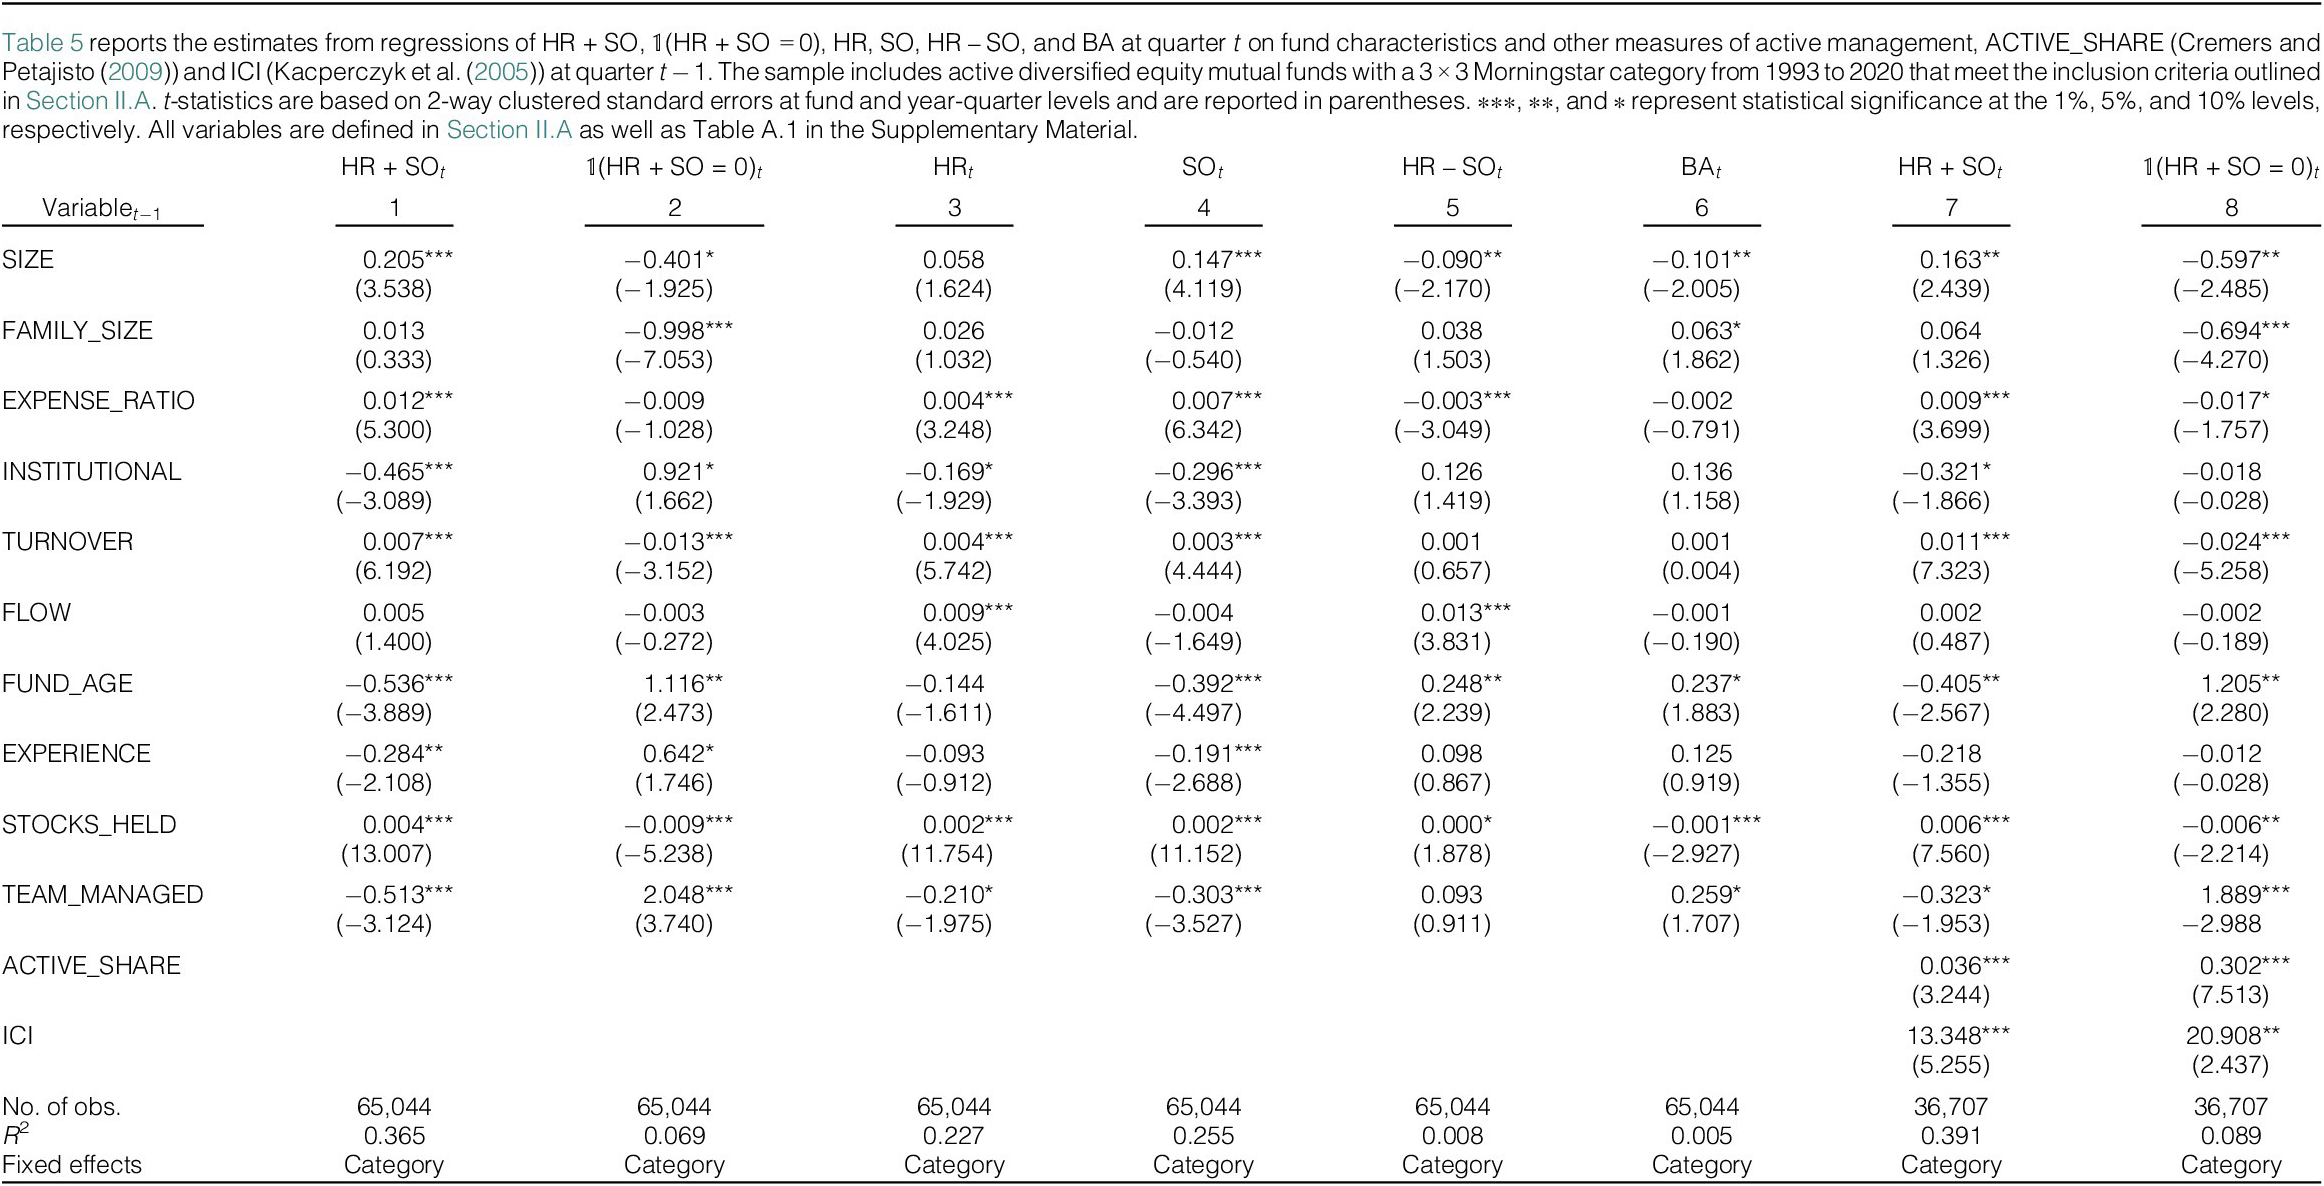
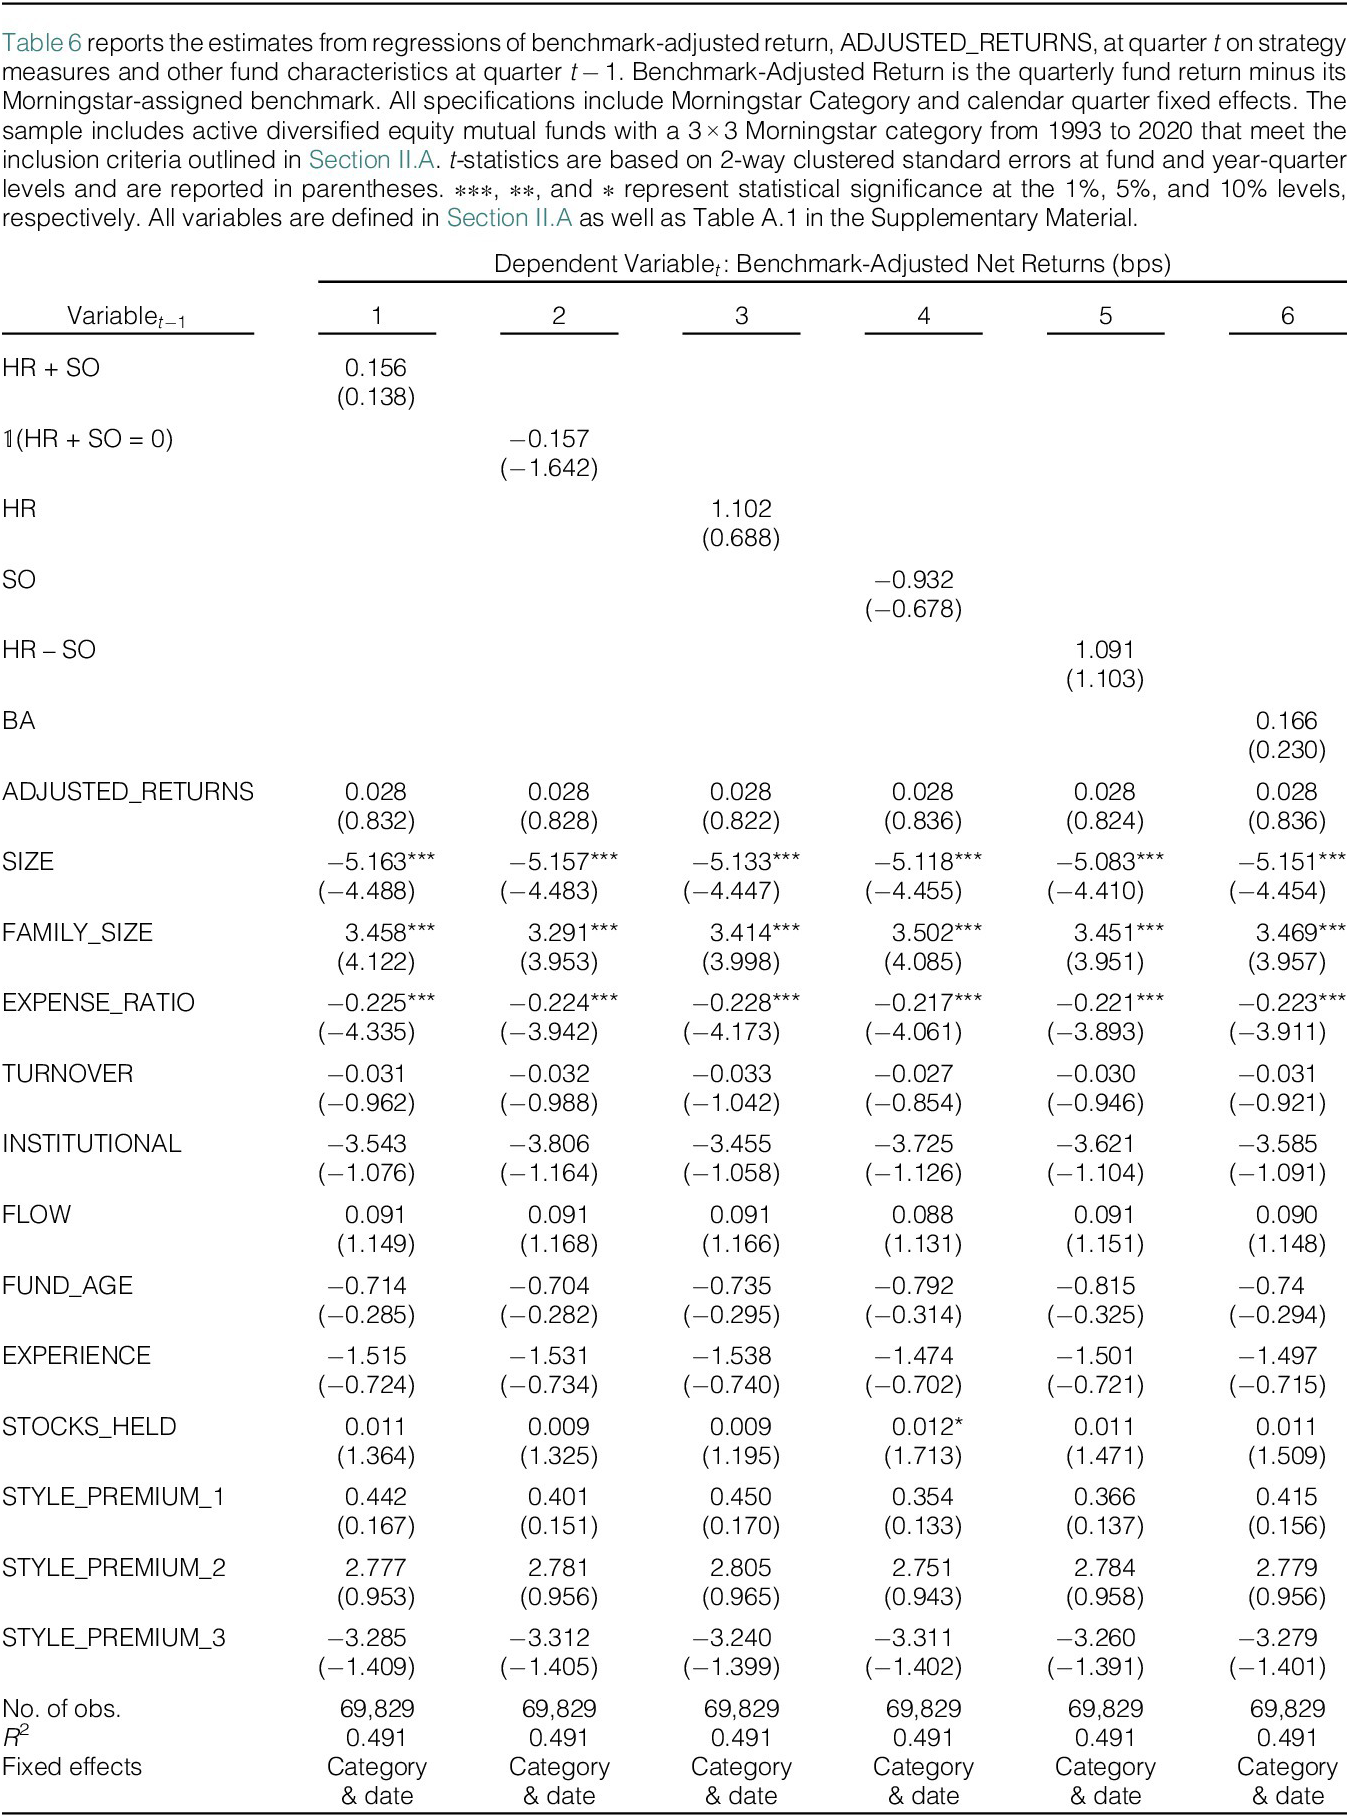
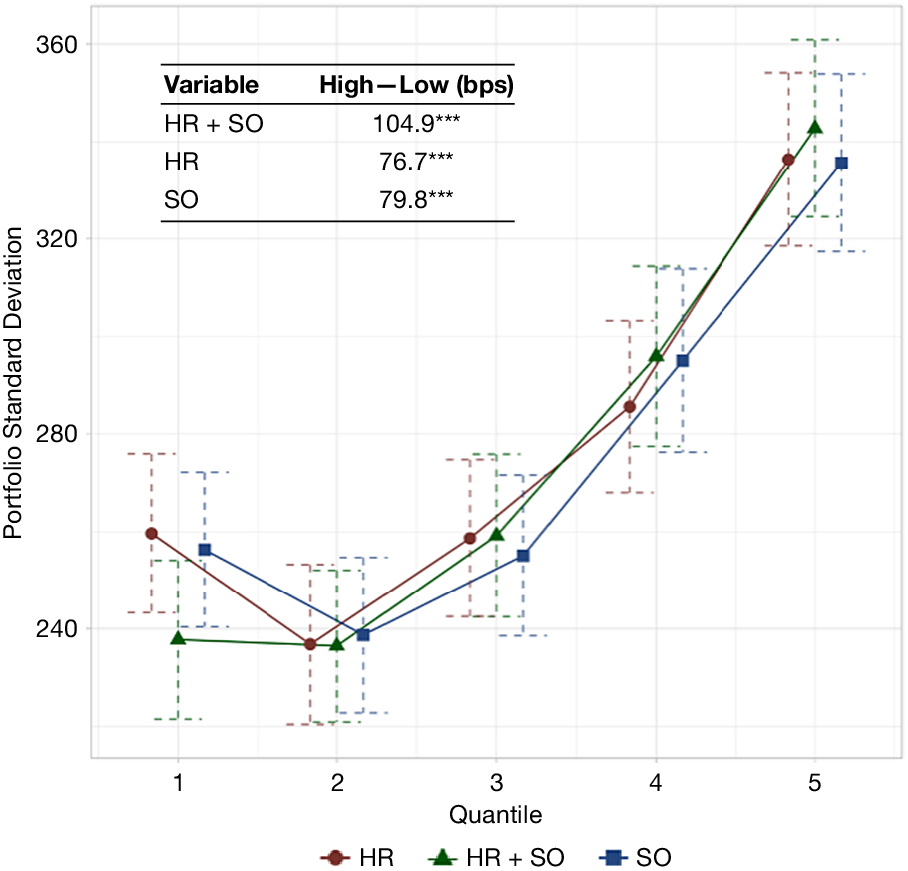


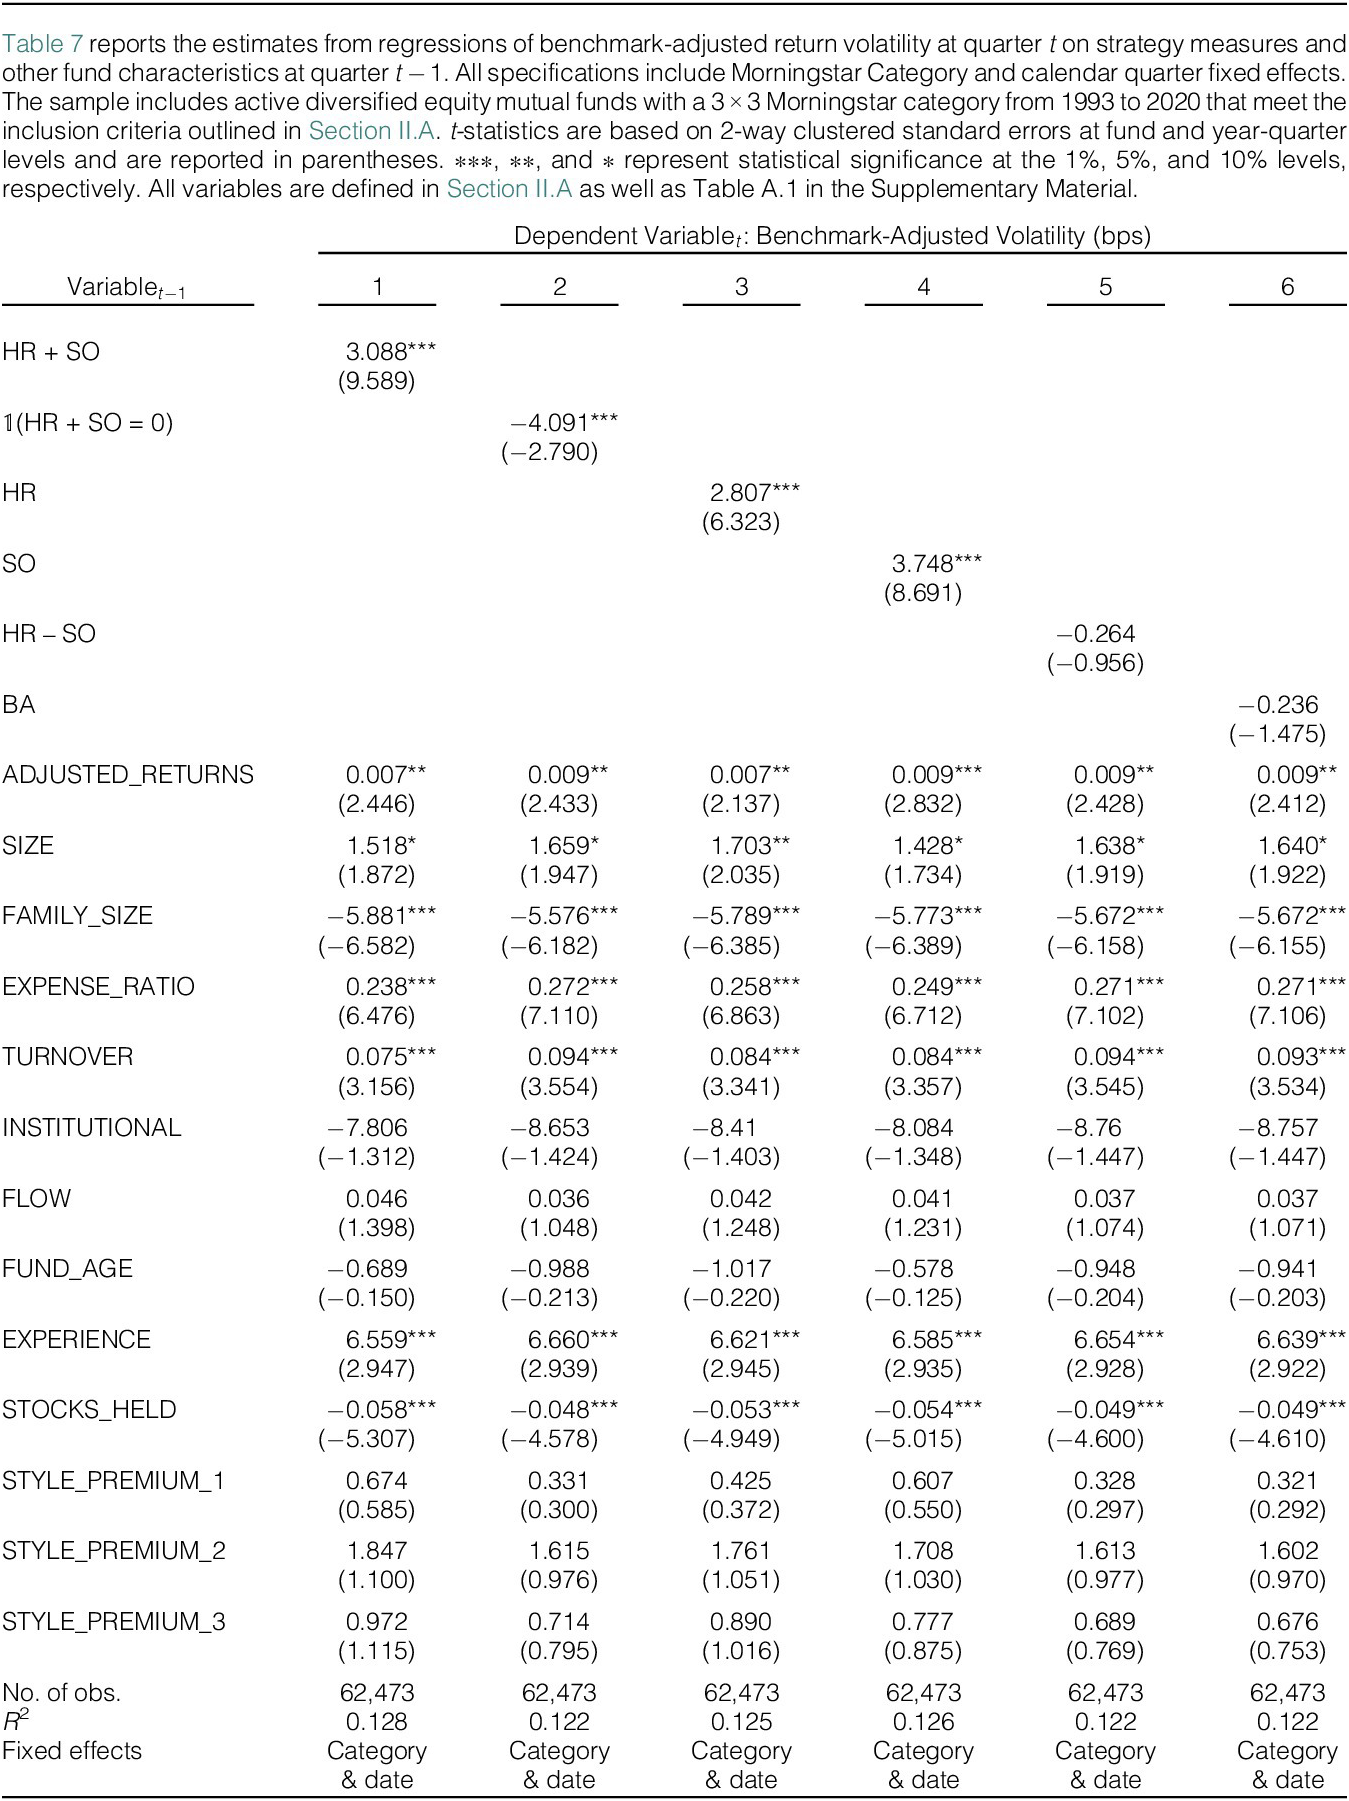
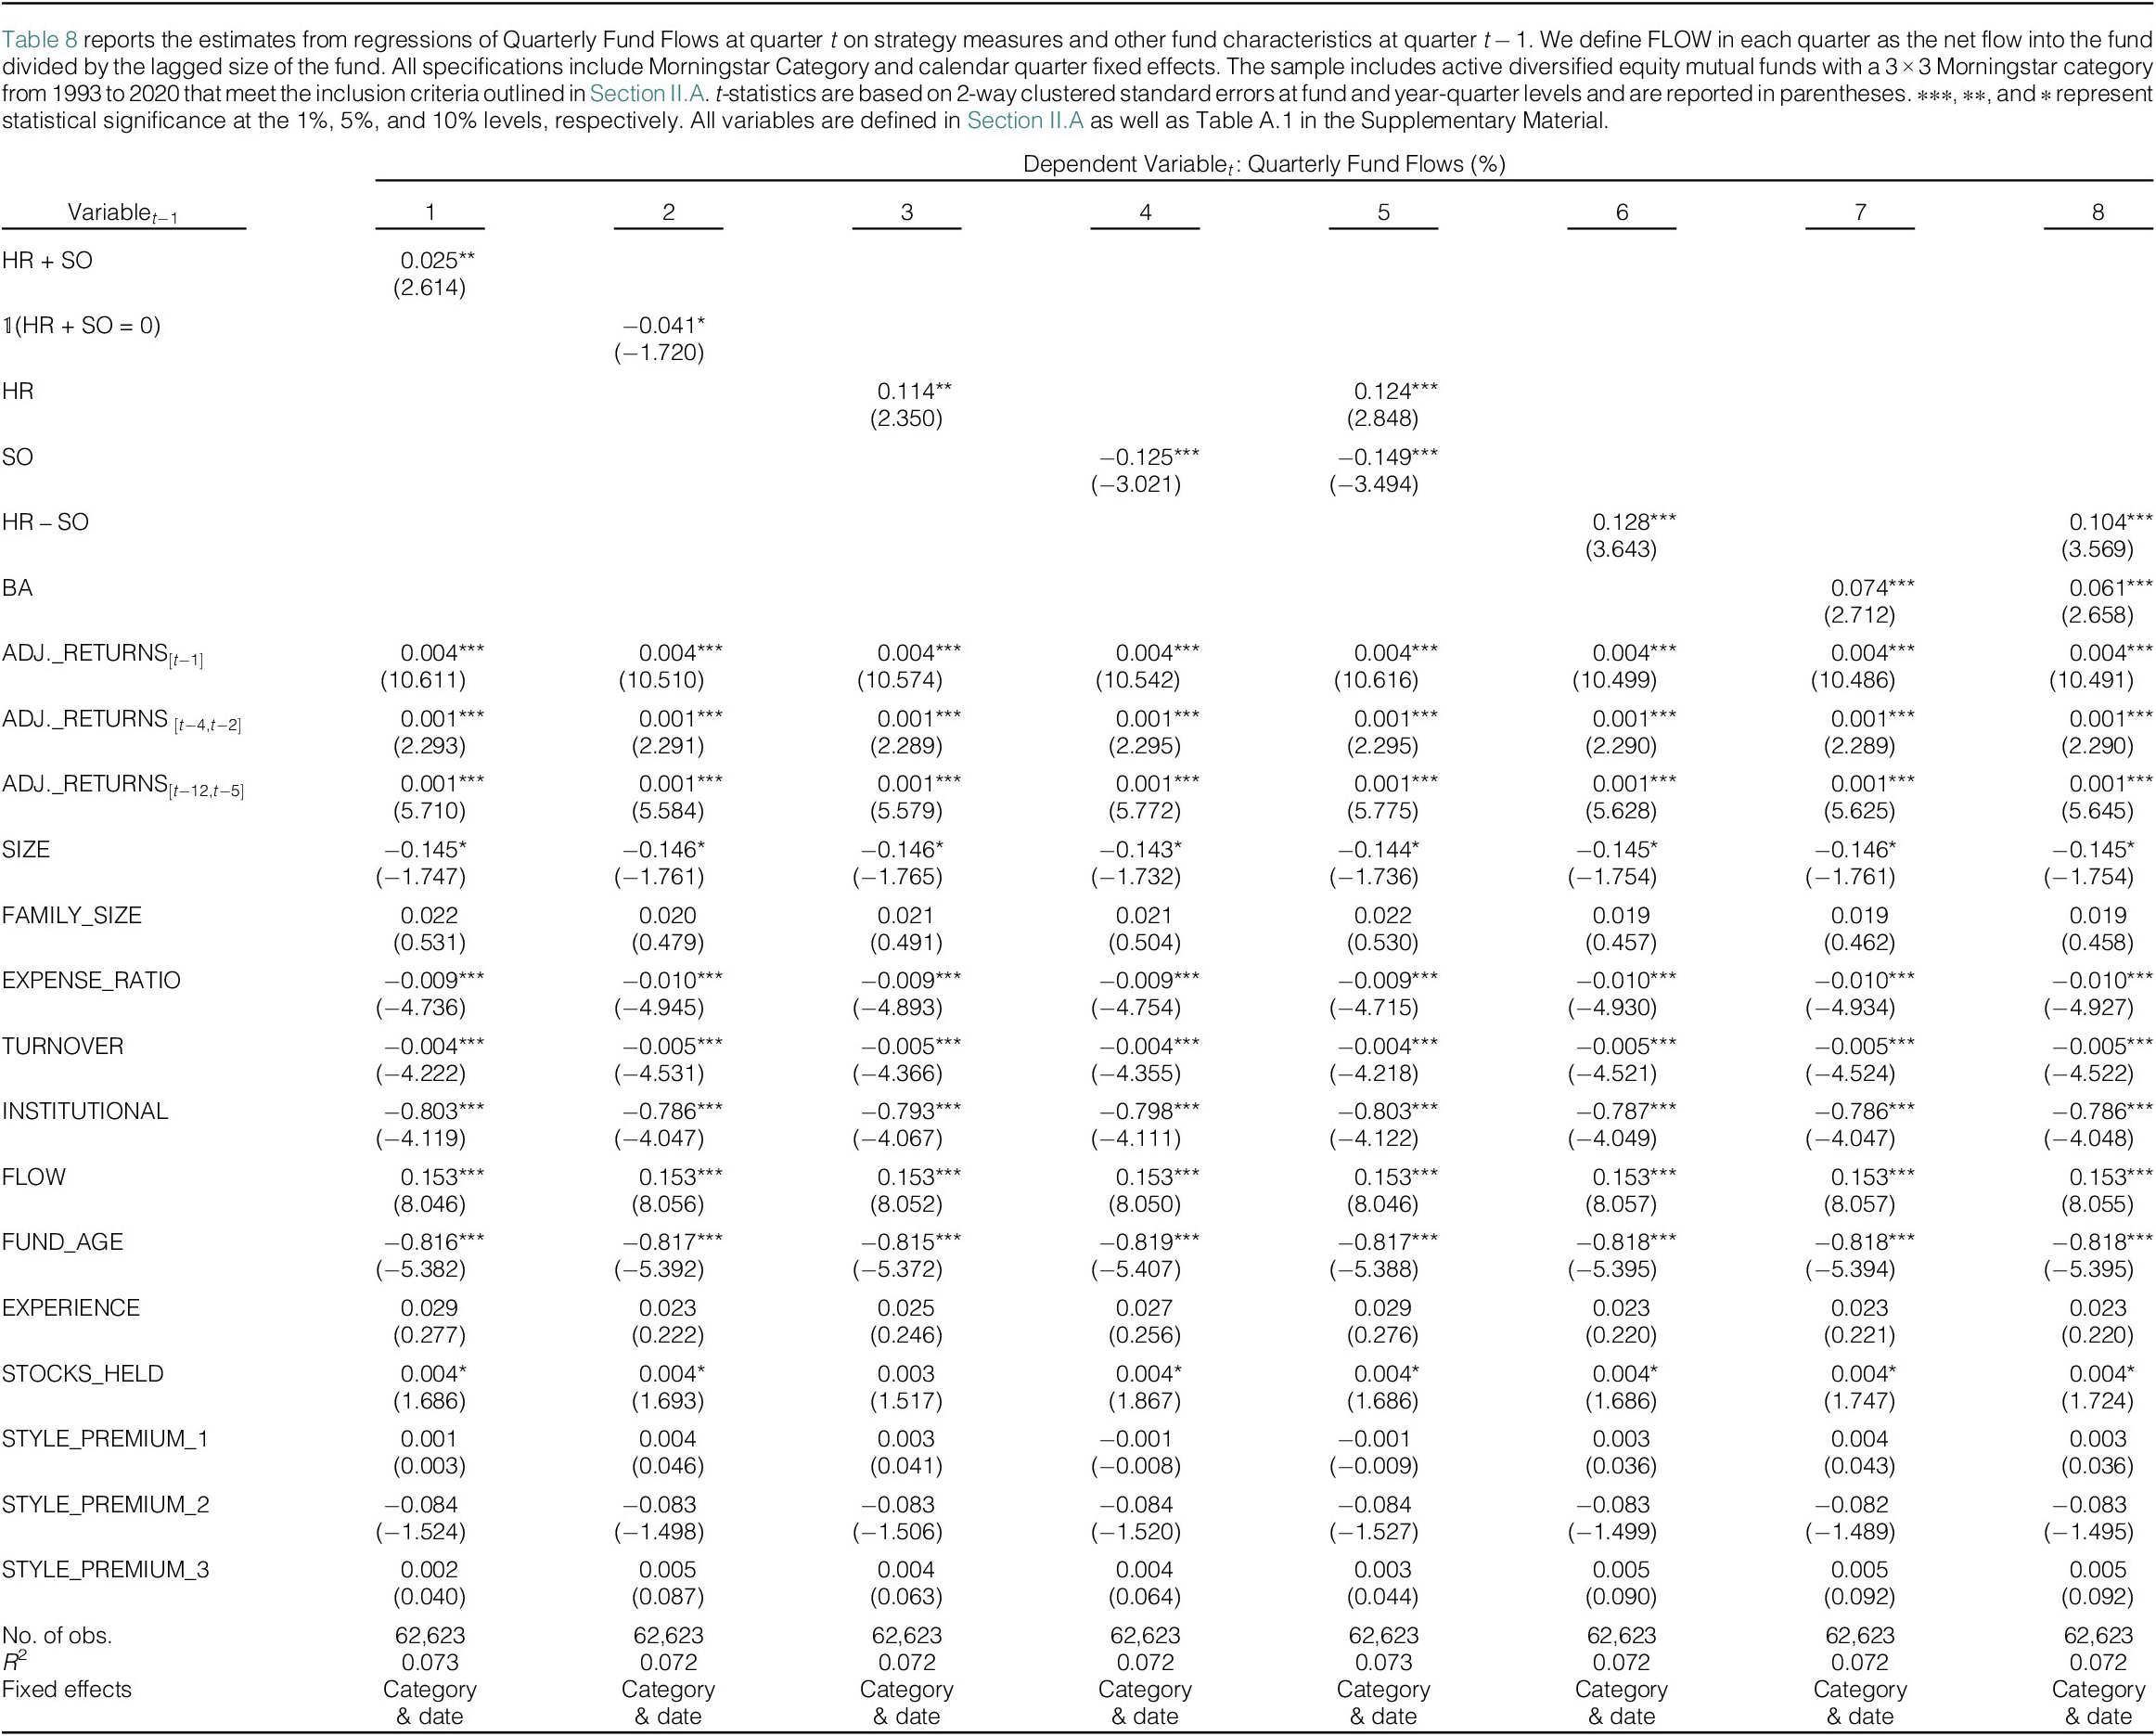
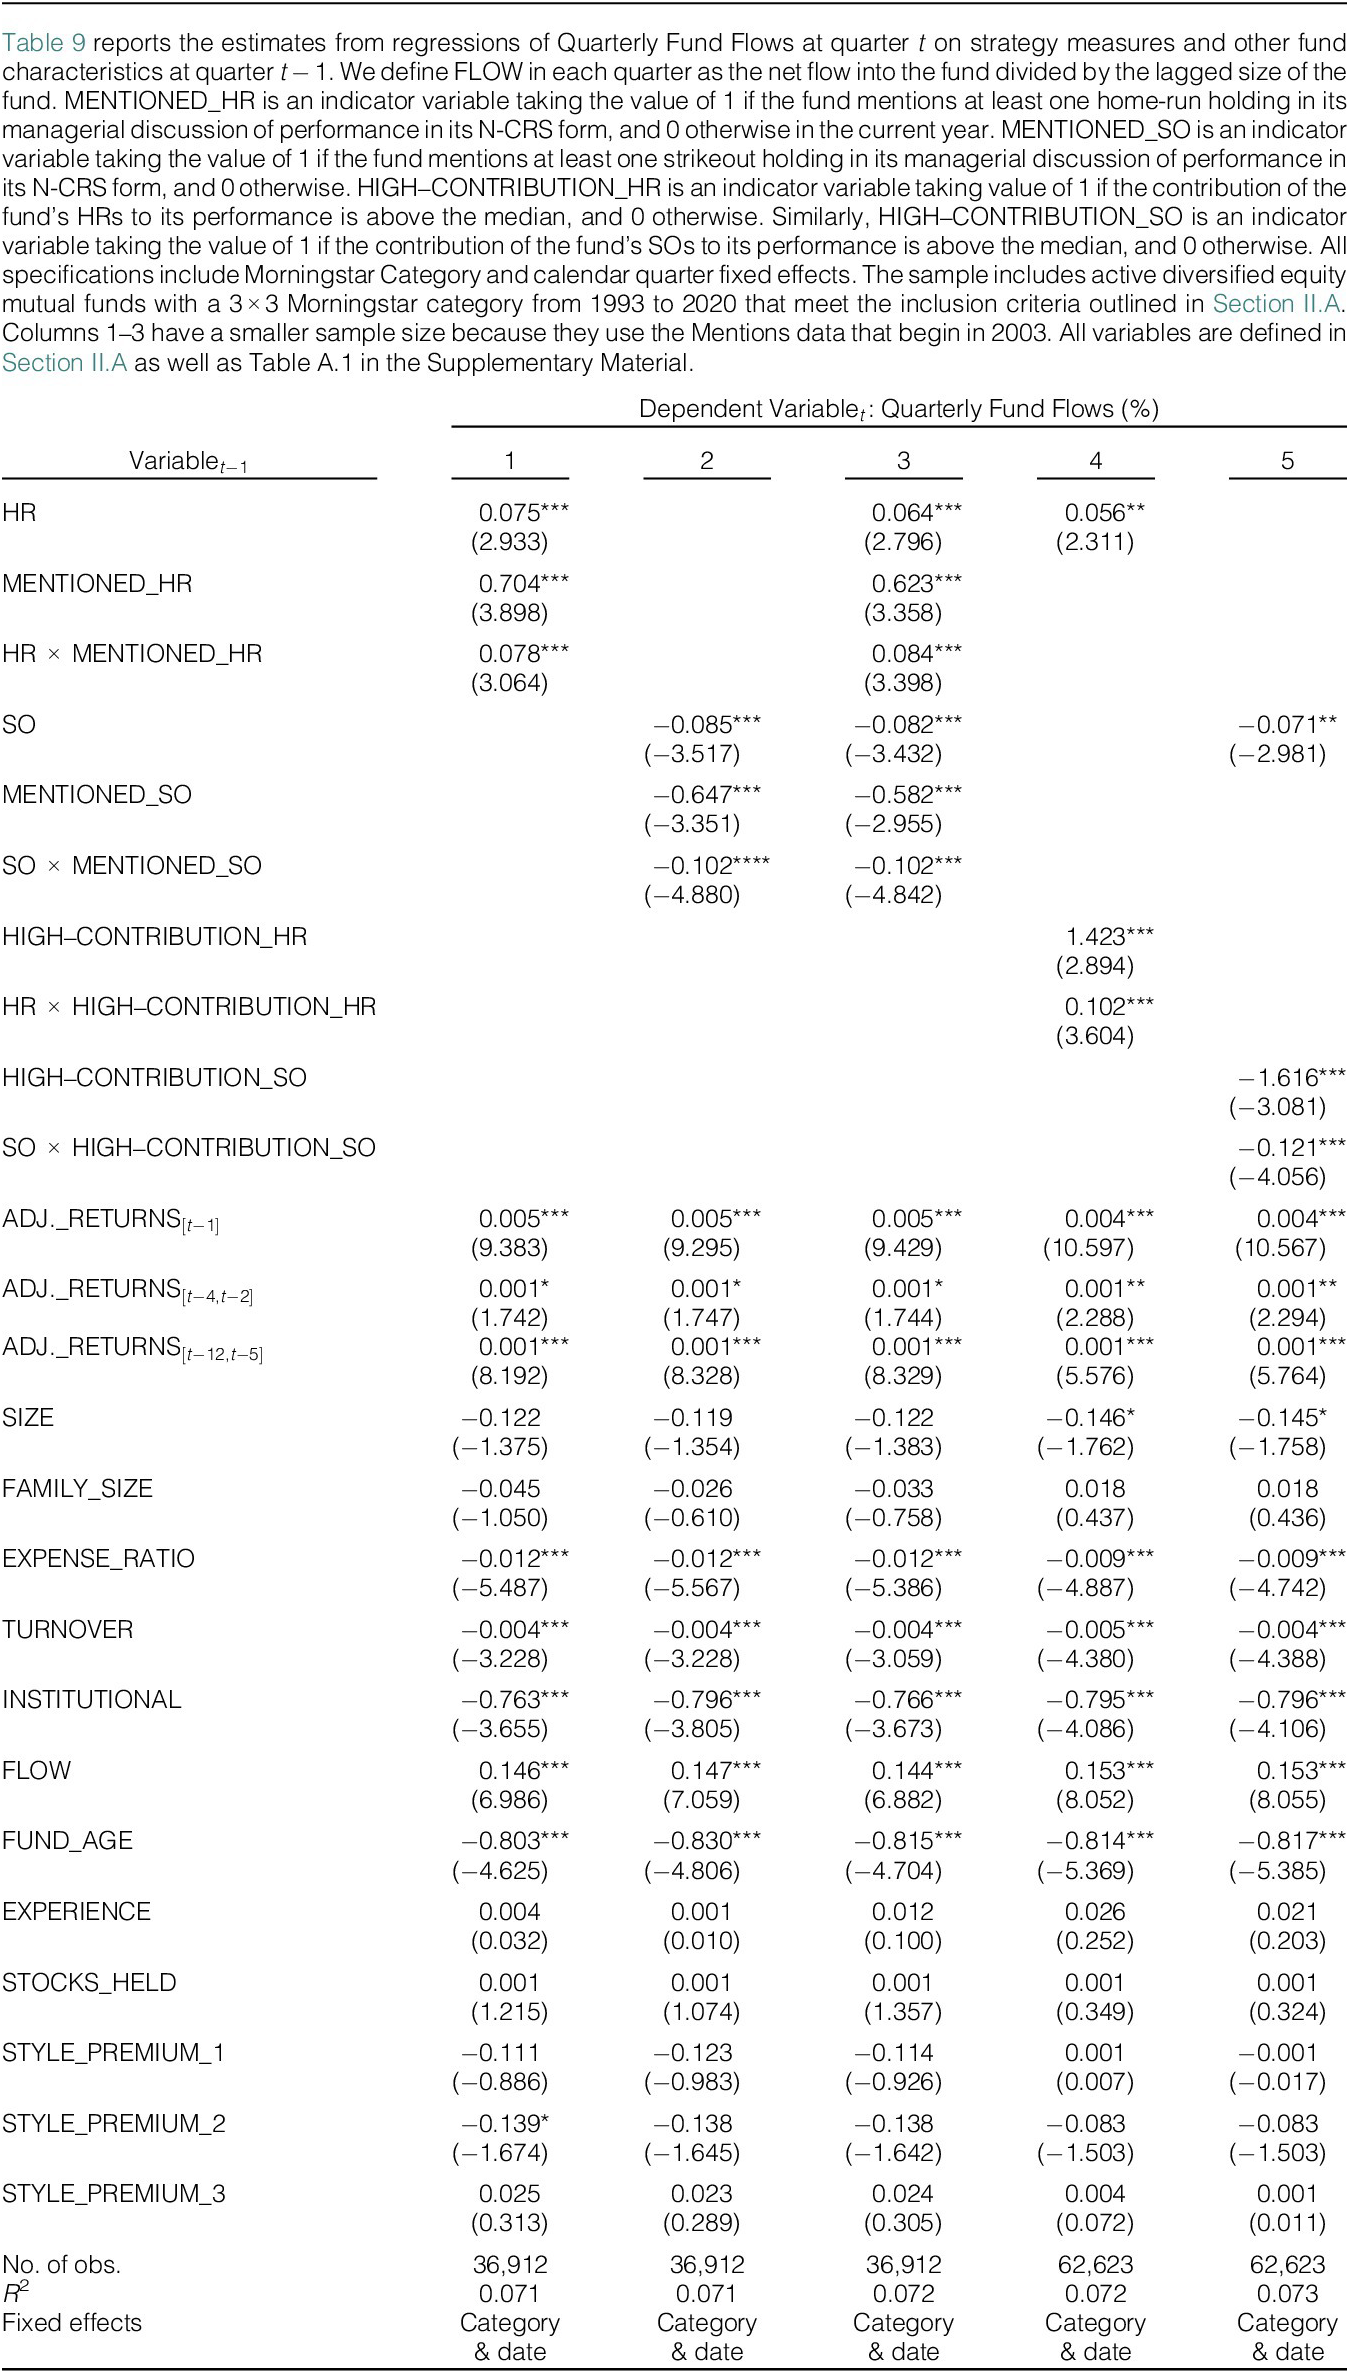
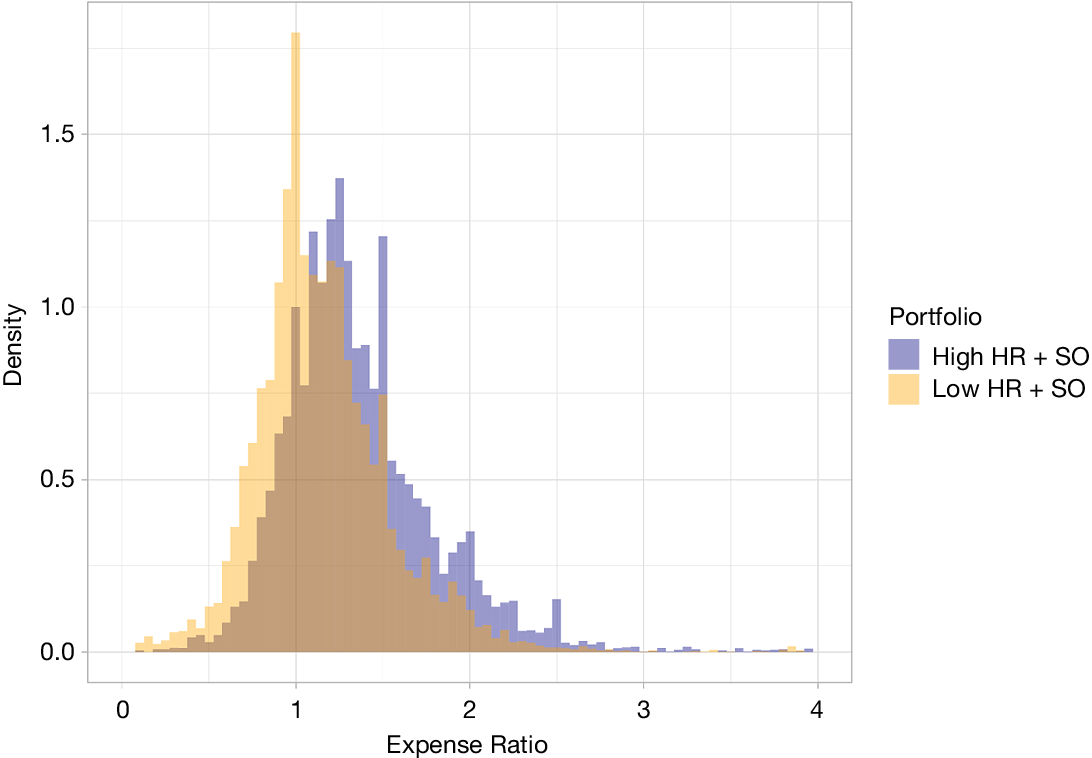

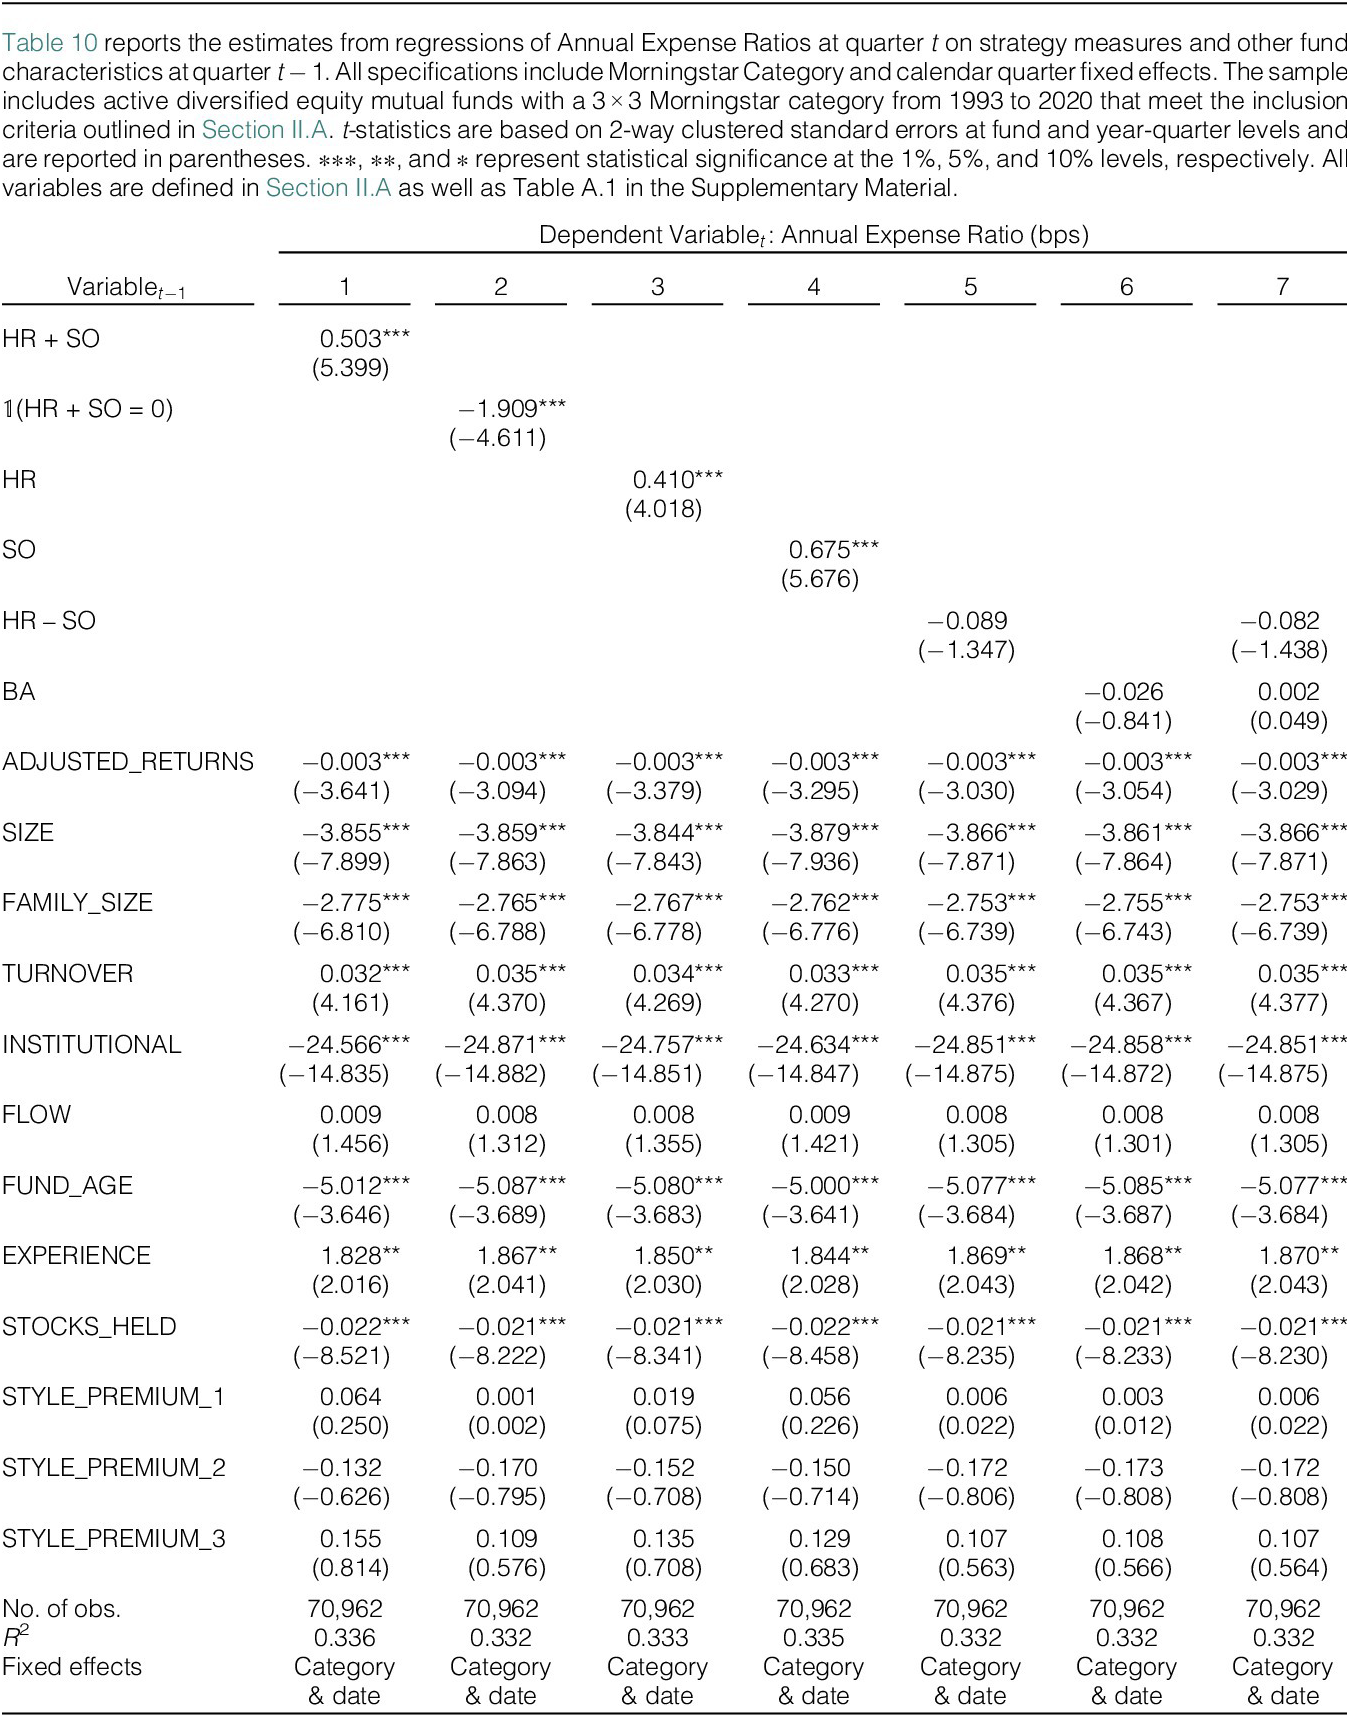
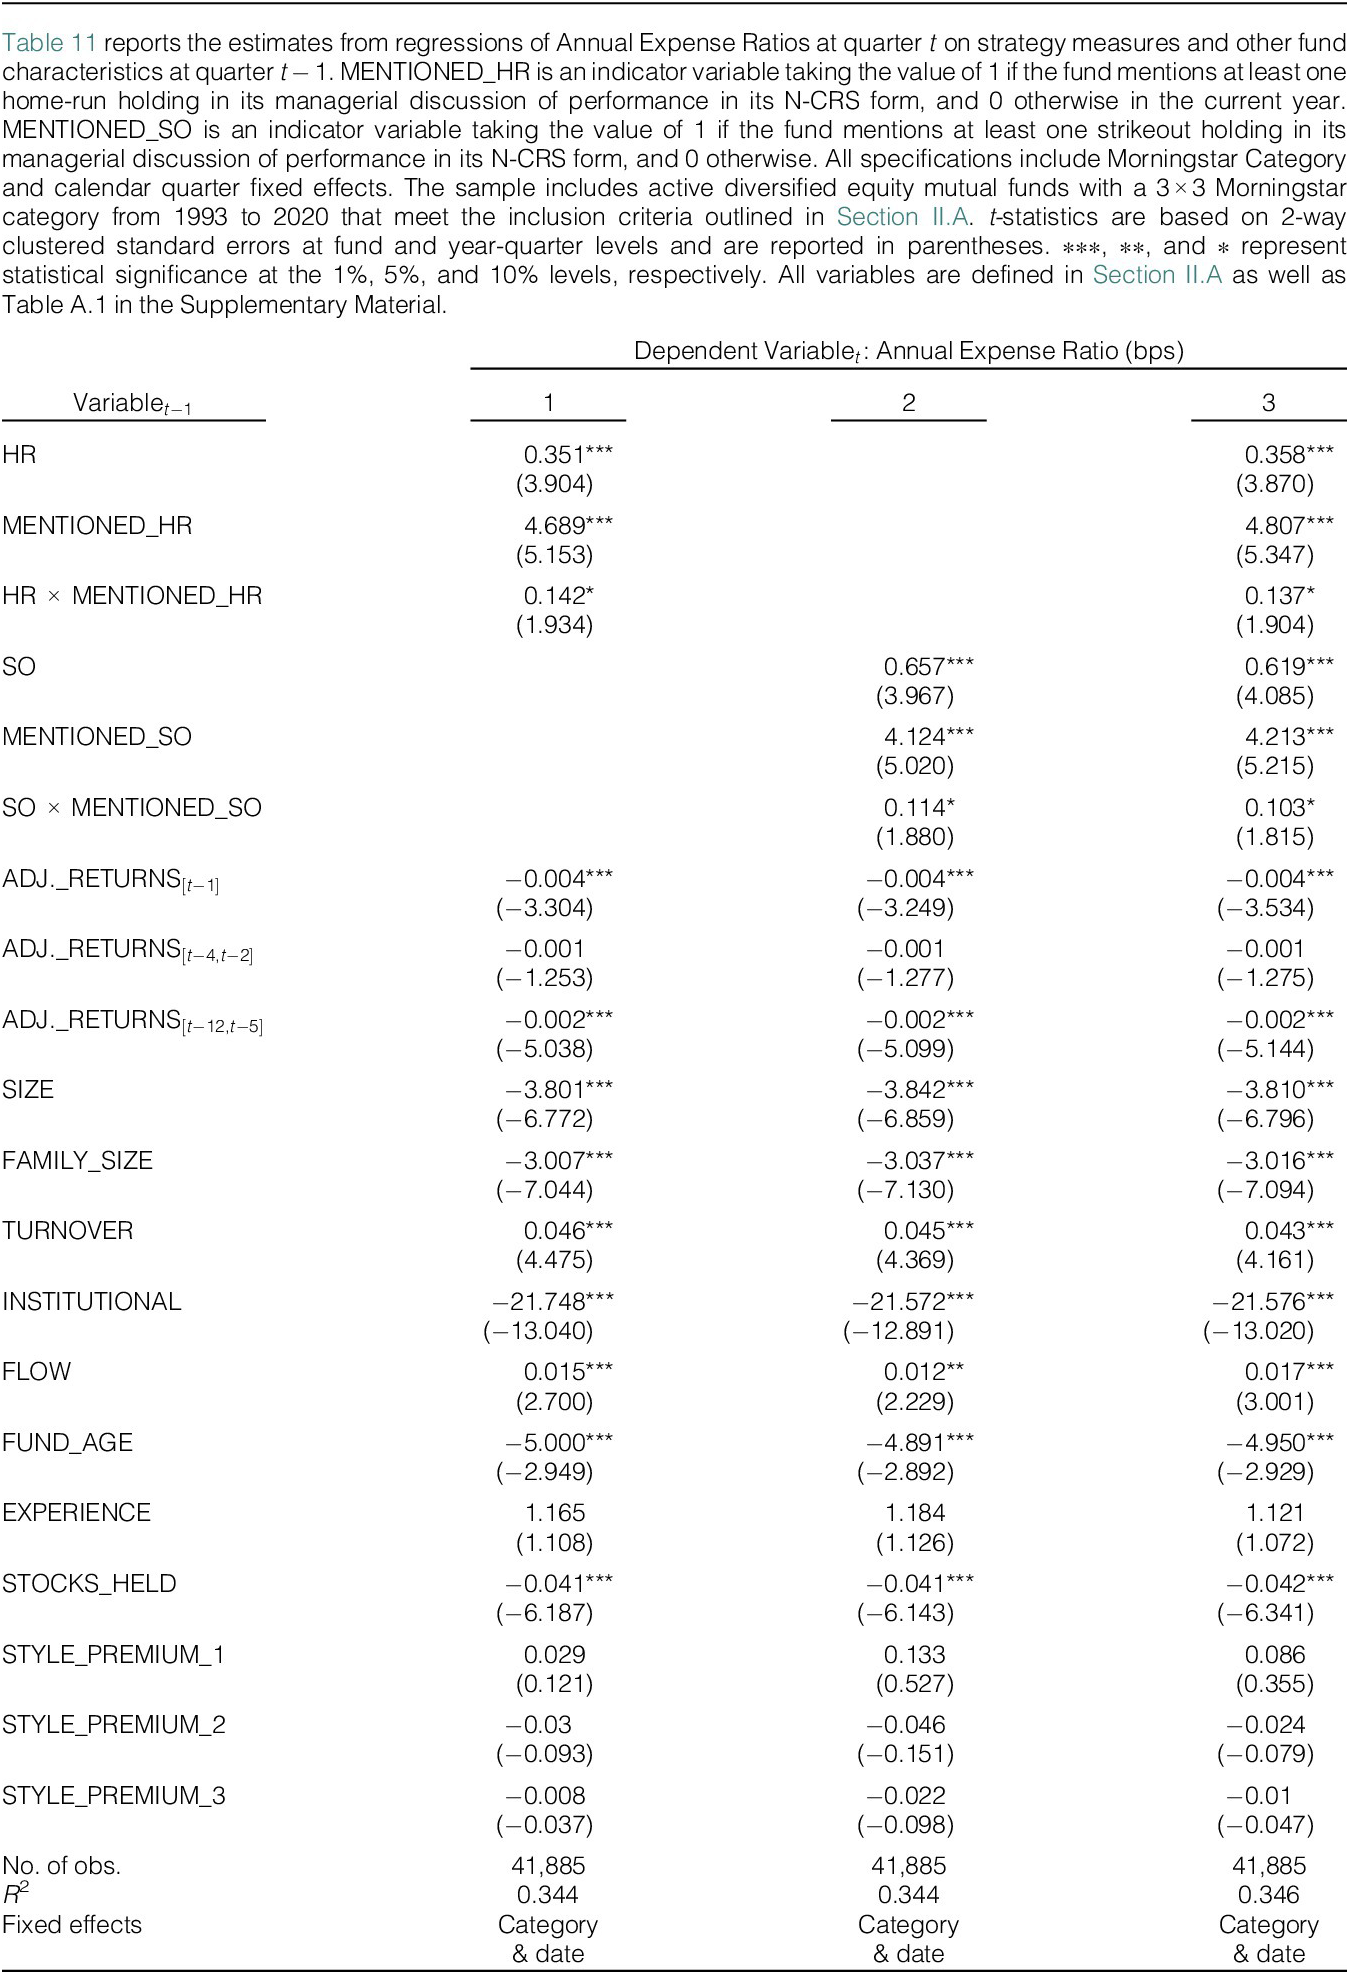
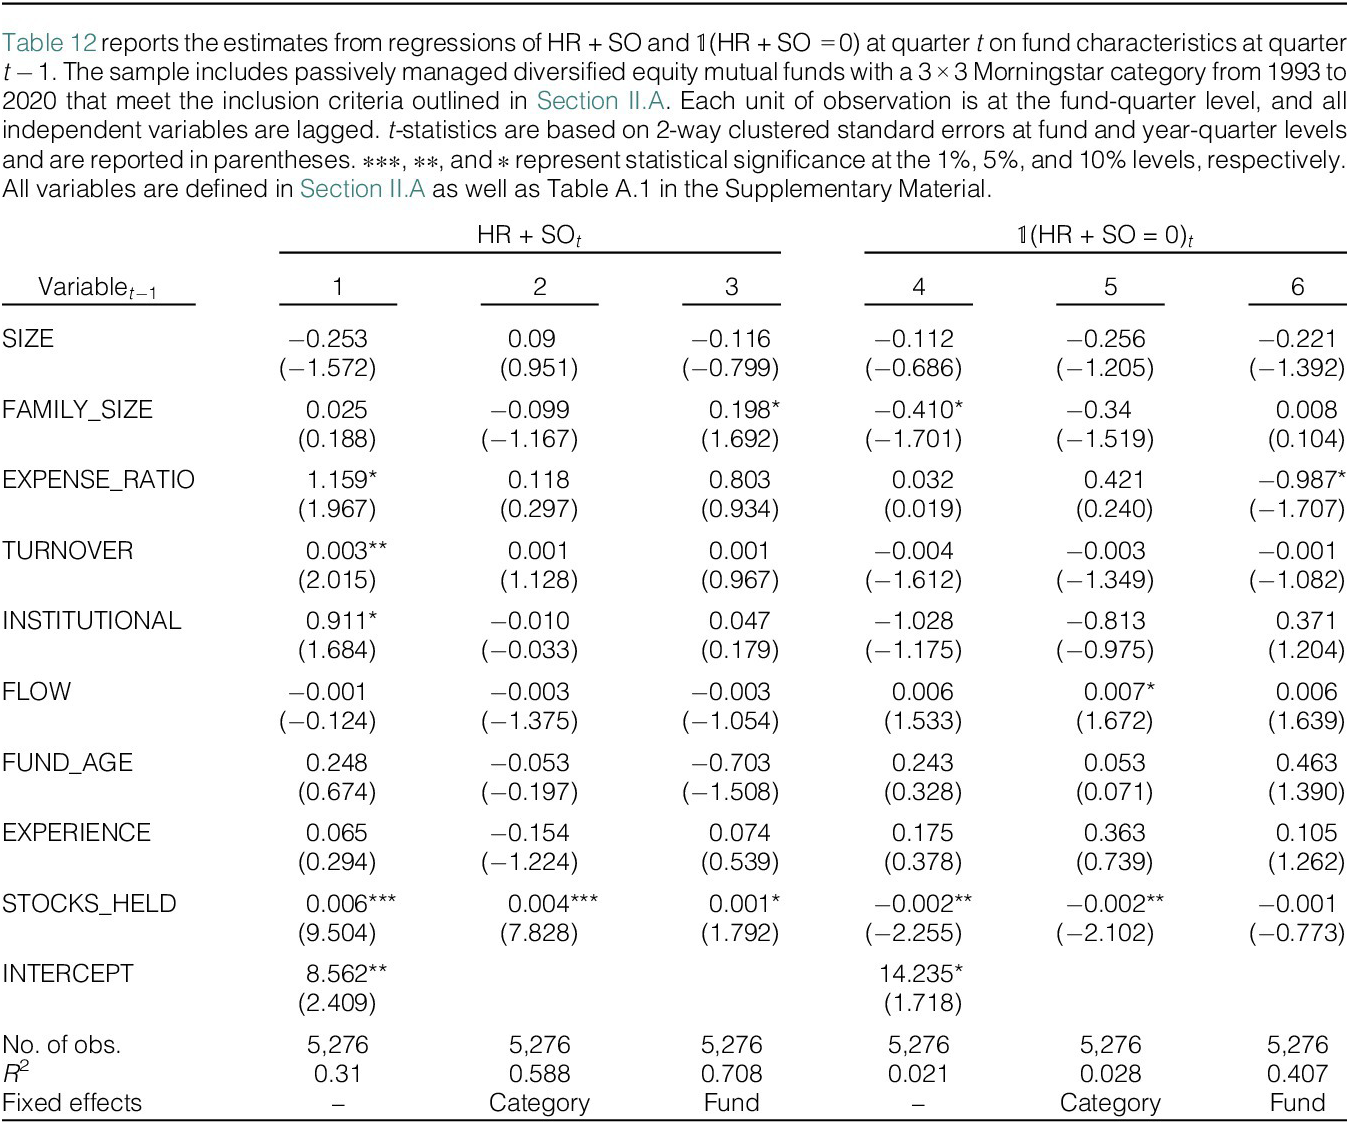
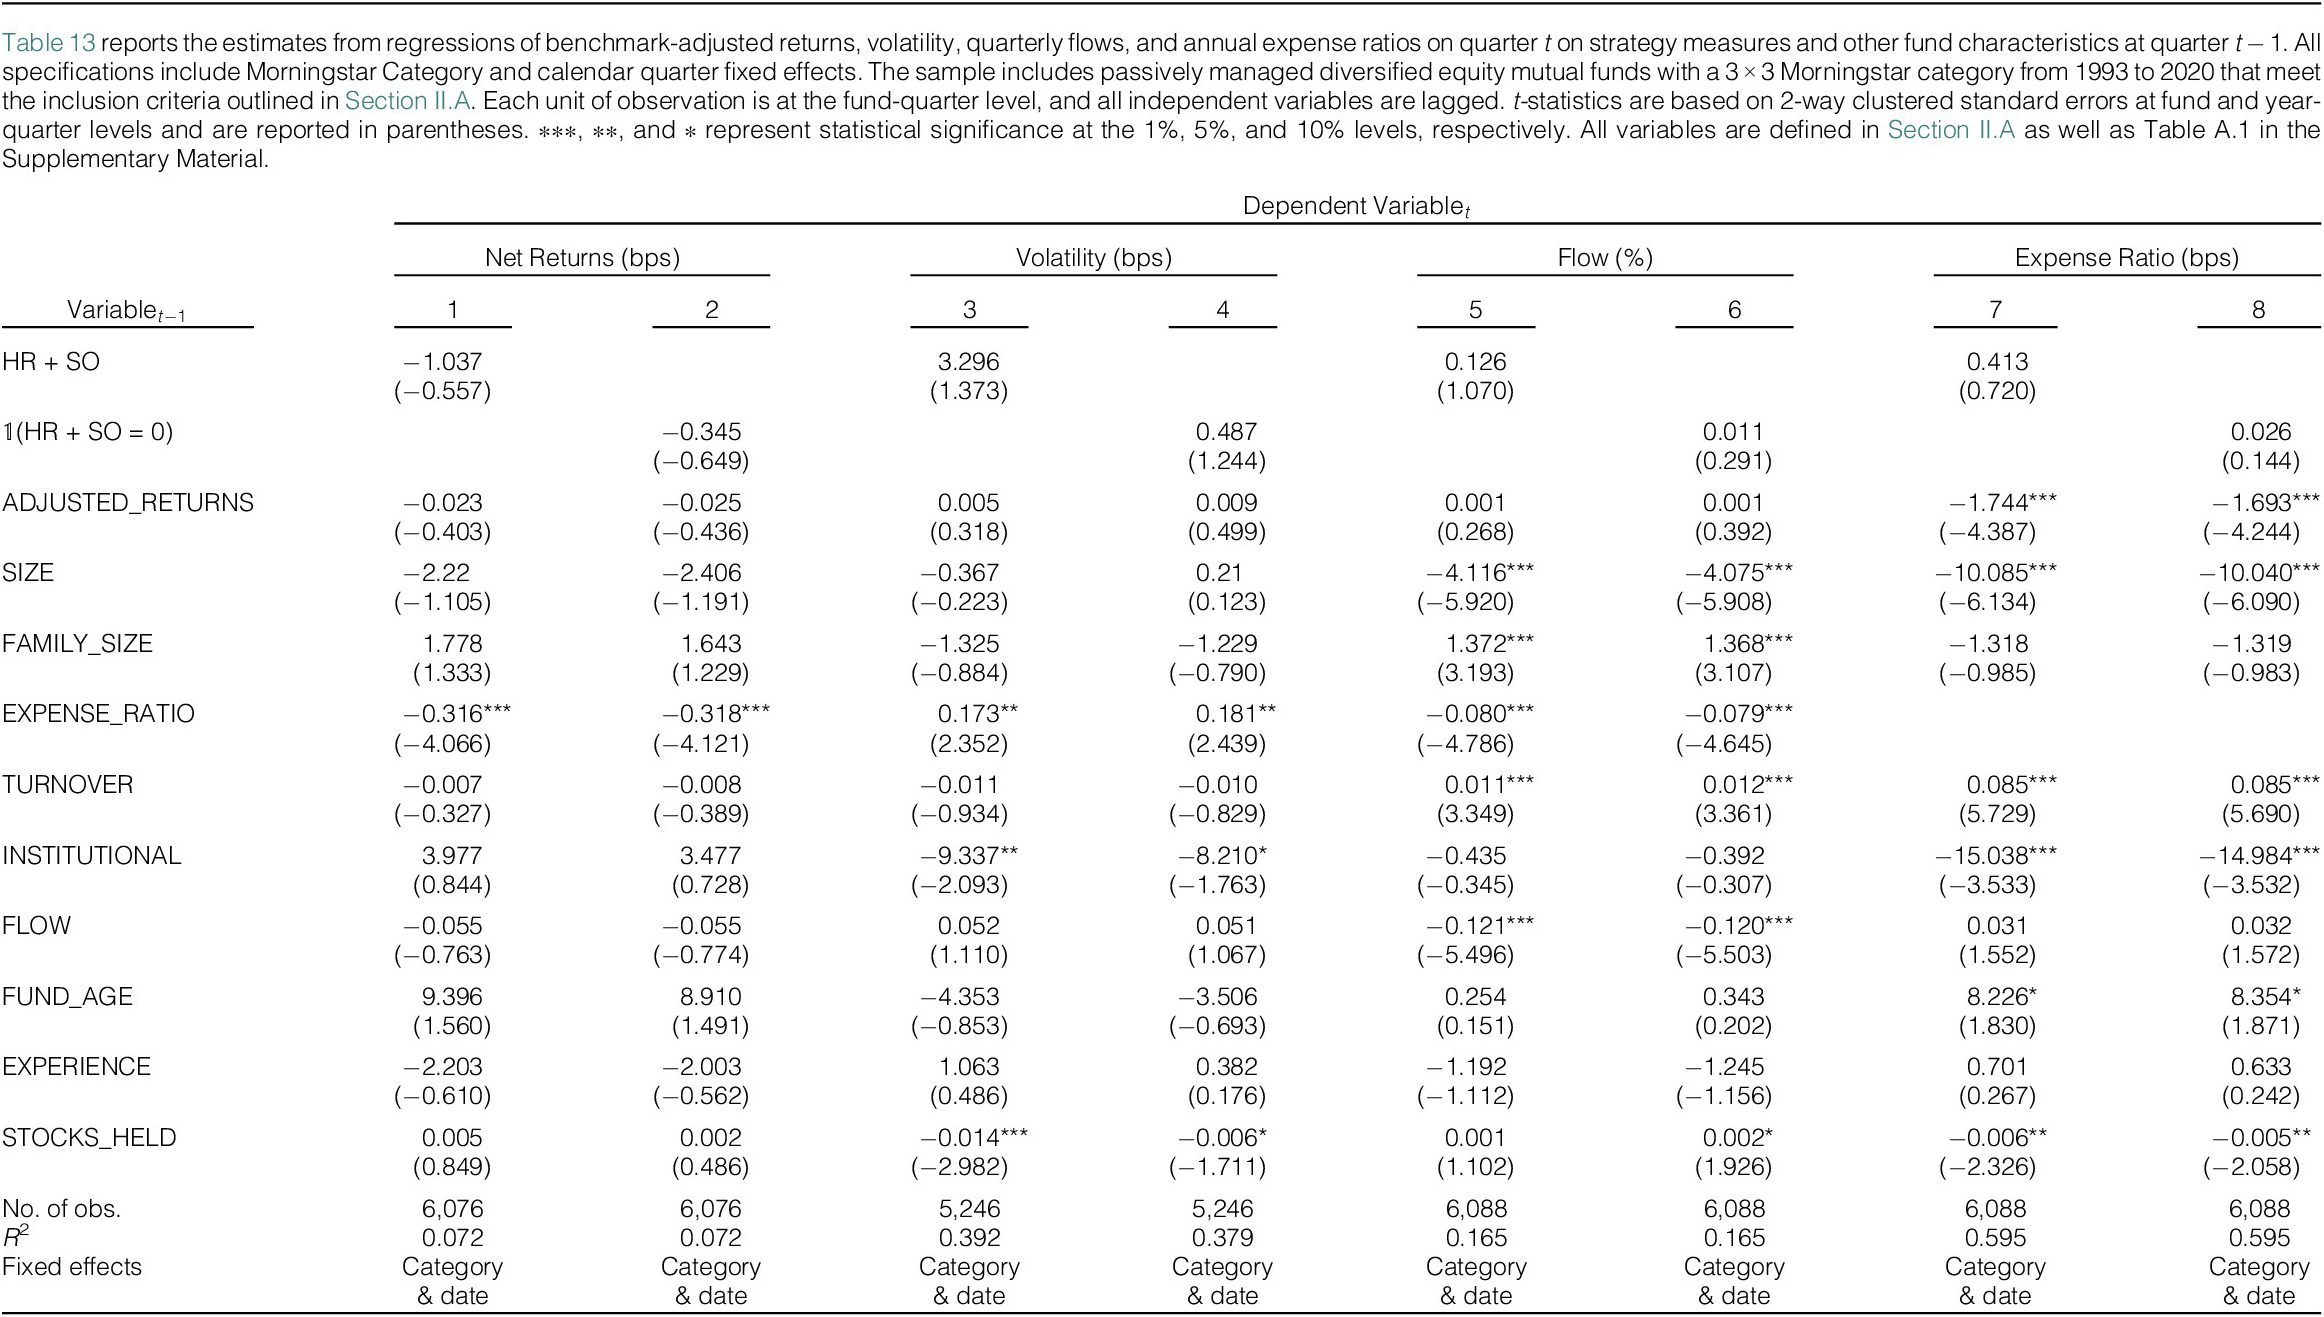


 Open access

