


Folic acid (FA) is the synthetic oxidised monoglutamyl form of folate that is widely used in vitamin supplements and food fortification. Towards the end of the twentieth century, new potential roles for FA in the prevention of neural tube defects (NTD) were reported( 1 , Reference Czeizel and Dudás 2 ). Discussion today primarily focuses on whether the recommendation for FA supplementation during early pregnancy should be widened to include the entire pregnancy, as well as the postnatal period, particularly as perinatal nutrition appears to influence the incidence of certain diseases later in life( Reference Hussain 3 ). The evidence that FA reduces the risk of NTD has led many governments to recommend that women take at least 0·4 mg of synthetic FA daily, 2–3 months before conception and during pregnancy( 4 ). These considerations suggest that pregnant women and their fetuses are exposed to high amounts of FA( Reference Plumptre, Masih and Ly 5 ). Using different animal models, we previously showed that FA deficiency compromises normal methionine metabolism, whereas supplementation with either moderate (8 mg/kg) or supranormal (40 mg/kg) levels of FA does not show an additional positive effect compared with a control diet in growing rats( Reference Partearroyo, Ubeda and Alonso-Aperte 6 ). In mature 18-month-old rats, dietary FA deficiency negatively affected methionine metabolism, whereas excessive supplementation appeared unnecessary for maintenance of optimal methylation levels or hippocampal integrity( Reference Partearroyo, Pérez-Miguelsanz and Úbeda 7 ).
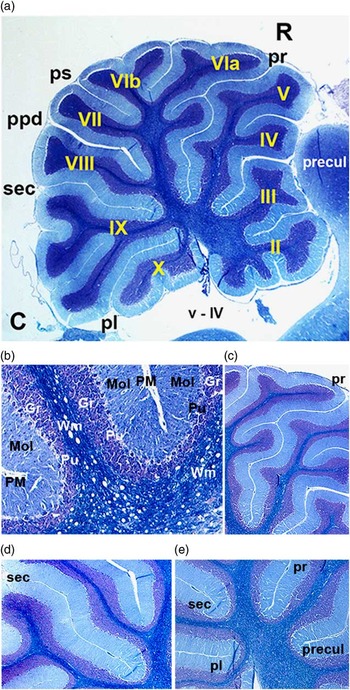
The cerebellum is a major brain structure that contributes to the control of voluntary movements, posture, balance and motor learning, as well as cognitive and emotional functions( Reference Tavano, Grasso and Gagliardi 8 ). Sagittal sections of the cerebellar vermis show a morphologically unique, yet apparently simple, structure consisting of folia separated by fissures of different lengths (Fig. 1). Indeed, cytological disorganisation of the cerebellum is associated with clumsiness and abnormal motor behaviour in disorders such as autism, Asperger’s syndrome, schizophrenia( Reference Fatemi, Aldinger and Ashwood 9 ) and dyslexia( Reference Nicolson, Fawcett and Dean 10 ).
Sagittal section of a control rat cerebellum stained with the Klüver–Barrera technique. (a) The different folia and main fissures that constitute the cerebellum are shown. The primary fissure is easily recognised by its greater length, followed by the secondary fissure. The sections of the cerebellar vermis were examined according to the criteria of Larsell & Jansen( Reference Larsell and Jansen 32 ). 4× Magnification. (b) Cells are ordered in three main layers: the molecular layer is in contact with the pia mater, the intermediate Purkinje cell monolayer and the internal granular layer (which is next to the white matter). 20× Magnification. (c) High-power magnification of the primary fissure. 10× Magnification. (d) High-power magnification of the secondary fissure. 10× Magnification. (e) High-power magnification of the deepest part of the cerebellum, showing the ends of fissures with pia mater. 10× Magnification. C, caudal; pl, posterolateral fissure; ppd, prepyramidal fissure; precul, preculminate fissure; ps, posterior superior fissure; pr, primary fissure; sec, secondary fissure; R, rostral; Roman numerals (in yellow; II, III, IV, V, VIa, VIb, VII, VIII, IX and X) denote corresponding folia; Black labels, v–IV: ventricle fourth; Gr, granular layer; Mol, molecular layer; PM, pia mater; Pu, Purkinje layer; Wm, white matter.
Folate and vitamin B12 are important dietary sources that act as cofactors that are involved in methylation reactions( Reference Davis and Uthus 11 ). Deficiency in folate and other methyl donors increases birth defects and produces persistent cognitive and learning disabilities through impaired plasticity and hippocampal atrophy( Reference Guéant, Namour and Guéant-Rodriguez 12 ). In mammals, the brain continues to develop and establish new connections after birth. Early postnatal development in the rat brain corresponds approximately to late gestation in humans( Reference Morgane, Mokler and Galler 13 ). In rats, cerebellar development continues up to about postnatal day 30. During this postnatal period, developing neurons undergo proliferation and programmed cell death, and radial glial cells guide granule cell migration. In addition, extensive cellular proliferation occurs in the external granule cell layer (EGL). Post-mitotic cells in the EGL migrate to their final destination in the internal granule cell layer and concomitantly undergo differentiation( Reference Altman and Bayer 14 ). These critical late developmental processes are highly complex and tightly regulated, and are susceptible to external and internal perturbations. Such perturbations can disrupt cell proliferation and migration, and impair the correct positioning of specific cell populations. During the developmental period, several studies have reported effects of diets lacking in methyl donors on the state of DNA methylation in the brain, and on brain functions such as emotional behaviours( Reference Pogribny, Karpf and James 15 , Reference Tomizawa, Matsuzawa and Ishii 16 ). In particular, deficiency of the folate-metabolising enzyme serine hydroxymethyltransferase 1, which regulates folate-dependent de novo thymidylate biosynthesis, affects hippocampal function at both the cellular and behavioural levels in adult mice( Reference Abarinov, Beaudin and Field 17 ).
Epidemiological studies and animal models indicate that susceptibility to adult-onset chronic disease is influenced by prenatal and early postnatal nutrition( Reference Burdge and Lillycrop 18 ), probably through epigenetic regulation. According to Kim( Reference Kim 19 ), evidence from animal, human and in vitro studies suggests that the effects of folate deficiency and supplementation on DNA methylation are gene- and site-specific, and appear to depend on cell type, target organ, stage of development and the degree and duration of folate depletion/repletion.
To the best of our knowledge, no study has yet examined how FA dietary intake can affect the cerebellum during postnatal development. Therefore, in the present study, we examined the effects of different dietary FA levels on the cytoarchitecture and organisation of the cerebellar folia during early postnatal development.
Methods
Experimental animals
A total of forty male OFA rats (a Sprague–Dawley strain; 5 weeks old, weight 85–127 g; Animal Service, Universidad CEU San Pablo, Madrid) were classified into four groups (which differed in terms of the experimental diet administered). Procedures involving animals were performed according to European Union guidelines (2003/65/CE). Animals were individually housed in metabolic cages and were maintained on a 12-h light–12-h dark cycle, under controlled temperature and humidity conditions at the Animal Care Unit at Universidad CEU San Pablo.
Treatment
Rats were fed a pure amino acid diet (Dyets)( Reference Walzem and Clifford 20 ), adjusted to their nutritional and energetic requirements. Each of the diets differed only in terms of FA content, as follows: FA-deficient diet (0 mg/kg FA), n 10; FA-supplemented diet (8 mg/kg FA), n 10; FA supra-supplemented diet (40 mg/kg FA), n 10; and control diet (2 mg/kg FA), n 10. The control diet is generally accepted as the basal dietary requirement for rats( 21 ). The diet containing 8 mg/kg FA provides moderate folate supplementation, at four times the basal dietary requirement, and was selected to approximate to 1·6 mg/d FA in humans, which corresponds to levels that may be consumed in specific subpopulations (e.g. a section of the North American population was identified with a total FA intake above 1 mg/d)( Reference Bailey, Dodd and Gahche 22 ).
Nutrient intake values set by different countries for folate vary substantially. Several countries have reported a range for individual nutrient level at the 98th percentile, needed to maintain normal folate status during preconception and early pregnancy, of 300–750 µg( Reference Stamm and Houghton 23 ). In addition, it was specified that women who have already had an NTD birth should increase the dose up to 4 mg/d( 24 ), which corresponds to an approximate 20-fold increase compared with the established recommendation for non-pregnant women (which varies between 200 and 460 µg of dietary folate equivalents per d)( Reference Stamm and Houghton 23 ). Therefore, the diet containing 40 mg/kg FA was aimed at achieving folate supplementation at twenty times the basal dietary requirement. On the other hand, we have shown that fortification levels declared by manufacturers in the Spanish market ranged from 15 to 430 % of the RDA( Reference Samaniego Vaesken, Alonso-Aperte and Varela-Moreiras 25 ).
The experimental diets and animals models used in this study have been successfully used in previous studies by our research group( Reference Partearroyo, Ubeda and Alonso-Aperte 6 , Reference Partearroyo, Pérez-Miguelsanz and Úbeda 7 , Reference Varela-Moreiras and Selhub 26 – Reference Achón, Alonso-Aperte and Varela-Moreiras 31 ). Rats were fed their respective diets ad libitum for 30 d.
Tissue collection and staining
Anaesthetised animals were killed by decapitation. The cerebellum was quickly removed, and the meninges were detached, except for the pia mater, before histological assessment. The cerebella were immersed for 3 d in two successive 4 % formaldehyde solutions, cleared in water and maintained in 70 % ethanol until processed. Tissues were then embedded in paraffin wax and cut into sections (5–7 μm thick), according to standard protocols. All studies and evaluations were performed on sagittal sections through the cerebellar vermis, which is located in the central zone of the cerebellum. In all, ninety to 100 paraffin sections were sequentially stained following Klüver–Barrera, Nissl and haematoxylin–eosin techniques for morphological analysis. The cerebellar vermis sections were examined according to the consensus criteria established by Larsell & Jansen( Reference Larsell and Jansen 32 ).
To identify the various cell types, slides were immunostained for glial fibrillary acidic protein (GFAP) to label Bergmann glia, calbindin to label Purkinje cells and NeuN to label post-mitotic neurons. Sections were incubated in 2 % hydrogen peroxide in methanol for 10 min in the dark at room temperature to quench endogenous peroxidase activity. Non-specific binding was blocked with a mixture of 0·1 % fetal bovine serum (Gibco) and 0·1 % bovine serum albumin (Sigma) in PBS containing 0·4 % Triton X-100 (PBT) for 30 min. Sections were then incubated with rabbit anti-GFAP polyclonal (1:500; Chemicon International) or rabbit monoclonal anti-calbindin antibodies (1:2000; Sigma) overnight at 4°C in a dark humidified chamber. For NeuN staining, sections were pre-treated by heating in 0·01 m citrate, pH 6, for 40 min, in an oven at 140°C for antigen retrieval. Sections were then incubated with a mouse NeuN monoclonal antibody (1:100; Chemicon International) diluted in PBT for 1 h at 37°C. Post-processing and preparation of negative control sections were performed as described in our previous report( Reference Partearroyo, Pérez-Miguelsanz and Úbeda 7 ).
Statistical analyses
Values are expressed as percentage affected per group. The χ 2 test was used to assess whether the number of animals affected by alterations in cytoarchitecture and organisation of the cerebellar folia during early postnatal development differed among the groups. Differences were considered significant for P values≤0·05. The data were analysed using SPSS for Windows, version 18.0 (SPSS Inc.).
Results
The cerebella showed no evident macroscopic defects, such as asymmetry or absence of folia, in any of the dietary groups. The cerebellar vermi were examined according to the criteria of Larsell & Jansen( Reference Larsell and Jansen 32 ), whereby sagittal sections of the whole cerebellar vermis in normal cerebellum show the pia mater inside the fissure that separates the opposite molecular layers between the two folia, next to the Purkinje and granule layers. The pia mater usually extends to the deepest part of the fissure, where the molecular layer from one folium curves and then continues to form the adjacent folium. The primary fissure is easily recognised because it is the longest, followed by secondary fissure (Fig. 1). All rats in the control groups exhibited these organisational characteristics at the light microscope level.
The alterations found in the experimental groups, in which rats were fed FA-modified diets, occurred only in the primary and secondary fissures. In both fissures, two types of alterations were observed (Table 1):
-
∙ F: fusion of a fissure where the pia mater partially disappeared, with consequent loss of the fissure because of adhesion of the opposing molecular layers (Fig. 2–7).
-
∙ F+E: fusion of a fissure associated with neuronal ectopia (E), whereby the granule cells did not occupy their usual position in the granular layer, but formed an ectopic islet inside the molecular layer. Ectopic granular cells were always positioned in the fused areas (Fig. 3–5).
Sagittal section of a cerebellum from a folic acid-deficient diet rat stained with the Klüver–Barrera technique. (a) Whole cerebellum showing primary and secondary fissures. The squared area is magnified in (b). 4× Magnification. (b) High-power magnification of the deepest part of the cerebellum. Partial disappearance of pia mater ( ) and fusion of primary and secondary fissures are observable (*), with fusion of the opposite molecular layers. 20× Magnification. (c) The deepest part of the cerebellum (control). Pia mater () reaches the ends of the fissures. 20× magnification. pr, Primary fissure; sec, secondary fissure; roman numerals (in yellow; IV, V, VIII and IX) denote corresponding folia; Mol, molecular layer; precul, preculminate fissure; ppd, prepyramidal fissure; precul, preculminate fissure.

Sagittal section of a cerebellum from a folic acid-supplemented diet rat stained with the Klüver–Barrera technique. (a) Whole cerebellum showing folia and main fissures. The primary fissure (squared area) is magnified in (b). 4× Magnification. (b) High-power magnification of the boxed area in the primary fissure in (a). 10× Magnification. (c) High-power magnification of the boxed area in (b). 20× Magnification. (d) High-power magnification of the boxed area in (c). point to ectopic granule cells within the granular layer. 40× Magnification. (e) High-power magnification of a normal secondary fissure. 10× Magnification. pr, Primary fissure; sec, secondary fissure; Gr, granular layer; Mol, molecular layer; PM, pia mater; Pu, Purkinje layer; Wm, white matter.

Sagittal section of a cerebellum from a folic acid supra-supplemented diet rat stained with the Klüver–Barrera technique. (a) Whole cerebellum showing folia and main fissures. The primary fissure (squared area) is magnified in (b). 4× Magnification. (b) High-power magnification of a normal secondary fissure. 10× Magnification. (c) High-power magnification of the boxed area in (a). The pia mater is absent in the deepest part of the primary fissure. Ectopic granular layers of two different folia are fused, fragmenting the continuity of the molecular layer. The squared area is magnified in (d). 20× Magnification. (d) High-power magnification of the boxed area in (c). Purkinje cells ( ) are visible in their usual locations, at the boundary between the molecular and ectopic cell clusters. 40× Magnification. pr, Primary fissure; sec, secondary fissure; Gr, granular layer; Mol, molecular layer; PM, pia mater; Wm, white matter.

Sagittal section of a cerebellum showing fusion and ectopic granular cells in the primary and secondary fissures immunostained for NeuN. These alterations appeared in the three experimental groups (folic acid-deficient, supplemented and supra-supplemented diet groups). (a) Whole cerebellum showing the location of granular cells in folia and the main fissures. The squared area is magnified in (b). 4× Magnification. (b) High-power magnification of the boxed area in (a), showing the deepest part of the cerebellum with the end of fissures. 10× Magnification. (c) High-power magnification of the normal preculminate fissure. 20× Magnification. (d) High-power magnification of the secondary fissure in which the pia mater ( ) disappears at the fissure fusion point (*), where a small number of ectopic granular cells are located (). 20× Magnification. (e) High-power magnification of a primary fissure. * Mark the fissure fusion point, where ectopic granular cells are located (). 20× Magnification. pr, Primary fissure; precul, preculminate fissure; sec, secondary fissure; Gr, granular layer; Mol, molecular layer; PM, pia mater; Wm, white matter.

Sagittal section of a cerebellum showing fusion and ectopic granular cells in a primary fissure immunostained for calbindin. These alterations appeared in the three experimental groups (folic acid-deficient, supplemented and supra-supplemented diet groups). (a) Whole cerebellum showing folia and main fissures. Primary fissure (squared area) is magnified in (b). 4× Magnification. (b) High-power magnification of a normal secondary fissure. The soma of Purkinje cells appeared strongly stained between the molecular and granular layers (). 10× Magnification. (c) High-power magnification of the boxed area in (a) showing alterations in the primary fissure, which had ectopic granular cells in the deepest part. The soma of Purkinje cells appeared strongly stained in their normal place between the molecular and granular layers () (these cells do not migrate with ectopic granule cells). 10× Magnification. (d) High-power magnification of a normal secondary fissure showing Purkinje cell trees. 20× Magnification. (e) High-power magnification of a primary fissure showing Purkinje cell trees in the area of fissure fusion, where the dendrites appear to invade the opposite molecular layer (*). 20× Magnification. pr, Primary fissure; sec, secondary fissure; Gr, granular layer; Mol, molecular layer; PM, pia mater; Wm, white matter; Pu, Purkinje cells.

Sagittal section of a cerebellum showing fusion and ectopic granular cells in a primary fissure immunostained for glial fibrillary acidic protein. These alterations appeared in the three experimental groups (folic acid-deficient, supplemented and supra-supplemented diet groups). (a) A normal prepyramidal fissure and alterations in the primary fissure are shown. The Bergmann glia extend processes from the Purkinje layer up to the surface of the molecular layer, forming perfect palisades () with the characteristic normal parallel-running fibres, as in the prepyramidal fissure. In the primary fissure, radial glial fibres were severely disorganised, irregular and misguided () in the absence of the fissure. 10× Magnification. (b) High-power magnification of the normal prepyramidal fissure showing the parallel running Bergmann fibres (). Gr, granular layer; Mol, molecular layer. 20× Magnification. (c) High-power magnification of the altered primary fissure in the fused region, showing clumps of Bergmann glial processes extending in random directions, which cross into the opposite slope of the folium to form whorl-like structures (). 40× Magnification. Roman numerals (IV, V and VIII) denote corresponding folia; Mol, molecular layer; Gr, granular layer; ppd, prepyramidal fissure; pr, primary fissure; Wm, white matter; PM, pia mater.

Presence of alterations in primary and secondary fissures in each folic acid (FA) dietary group (Number of rats and percentages)
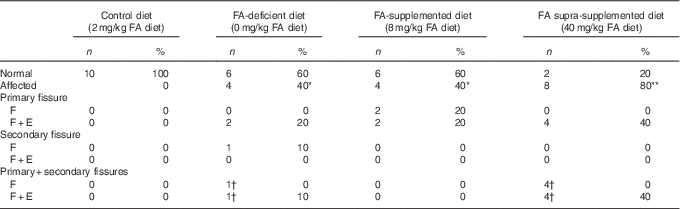
F, fusion of a fissure where the pia mater partially disappeared; F+E, fusion of a fissure associated with neuronal ectopia.
Statistically significantly different from the control group: *P<0·05, **P<0·01 (χ 2 test).
† On the same cerebellum.
The control group, however, showed neither of these alterations.
Isolated fusion was observed in the deepest part of the fissure for two rats in the FA-supplemented dietary group (in the primary fissure), in two rats in the FA-deficient dietary group (only in the secondary fissure in one rat and, in the other, in the prima fissure and the ectopic granular cells of the secondary fissure) and in four rats in the supra-supplemented dietary group (with fusion of the secondary fissure and ectopia in the primary fissure). The fusion extended from five to ten sections (an approximate distance of 35–42 μm).
Fusion in the presence of ectopic granular cells (F+E) was the most frequent alteration (Table 1). The size of lesions was variable, ranging from the presence of a few granular cells (Fig. 6) to uncountable clusters (Fig. 4, 5 and 7) extending from five to fifty-seven sections (an approximate distance of 35–399 μm).
NeuN labelling clearly showed that ectopic cells were granule cells located inside the molecular layer (Fig. 5). Calbindin staining showed that Purkinje cells were unaffected (Fig. 6). GFAP staining showed that radial glial fibres were severely disorganised, irregular and mistargeted in affected fissures exclusively in the fusion area, in contrast to the characteristic parallel-running normal fibres (Fig. 7).
The frequency of defects varied markedly according to the dietary FA group. Within the FA-deficient diet group (0 mg/kg FA diet), 40 % of the rats showed cerebellar alterations (P≤0·05, Table 1). In the FA-supplemented diet group (8 mg/kg FA diet), 40 % of the rats showed changes in the primary fissure (P≤0·05), whereas the secondary fissure was unaffected (Table 1). Finally, the supra-supplemented diet group (40 mg/kg FA) showed the highest incidence of abnormalities (80 %) compared with the control group (P≤0·01), with the F+E alteration apparent in all eight rats (Table 1).
Discussion
The present study is the first to demonstrate that cerebellar morphological defects can arise from deficient, as well as high, FA levels in the diet.
Growth is a developmental stage especially vulnerable to modifications in FA status because of the importance of this vitamin in biological processes such as cell division, methylation potential and gene expression( Reference Ly, Hoyt and Crowell 33 ). The present study investigated the potential for dietary FA deficiency, or moderate v. high supplementation, to modify postnatal morphology of the cerebellum in growing rats.
As we have previously reported, neither FA deficiency nor supplementation altered the average weight gain of these animals throughout the study period( Reference Partearroyo, Ubeda and Alonso-Aperte 6 ). We also previously showed that FA deficiency compromises normal methionine metabolism, as FA deficiency resulted in a significant increase in serum homocysteine (Hcy) concentration compared with control animals( Reference Partearroyo, Ubeda and Alonso-Aperte 6 ). Other studies have demonstrated that folate deficiency increases Hcy levels, inducing apoptosis of neurons( Reference Kruman, Culmsee and Chan 34 – Reference Moore, El-sherbeny and Roon 38 ). Unfortunately, we were not able to measure folate or other metabolites in the brain in the present study, because of tissue size/weight. Moreover, tissue samples had been fixed for morphological determinations and analysis. However, on the basis of analysis of biochemical parameters, a deficiency in FA levels was clearly evident( Reference Partearroyo, Ubeda and Alonso-Aperte 6 ). Moreover, Berrocal-Zaragoza et al. ( Reference Berrocal-Zaragoza, Sequeira and Murphy 39 ) showed that hepatic folate, but not brain folate, was significantly decreased with FA dietary deficiency in rats. Despite this, these authors still concluded that FA deficiency caused learning and memory deficits.
In the present study, we found that FA-deficient and supra-supplemented diets may compromise cerebellar morphology in growing rats. The cerebellum undergoes postnatal development in mammals, and it is vulnerable to adverse environmental factors( Reference Tavano, Grasso and Gagliardi 8 , Reference Morgane, Mokler and Galler 13 ). Dietary FA manipulation in growing rats produced a number of abnormalities in the experimental groups (Table 1). The defect patterns observed in the present study are comparable to those shown by Sakata-Haga et al. ( Reference Sakata-Haga, Sawada and Hisano 40 ) and Kotkoskie & Norton( Reference Kotkoskie and Norton 41 ) in the primary fissure after prenatal exposure of rats to excess ethanol, and to those observed by Sievers et al. ( Reference Sievers, Mangold and Berry 42 , Reference Allen, Sievers and Berry 43 ) after intracisternal injections (in the fourth ventricle) of 6-hydroxydopamine. The latter study suggests that impaired corticogenesis produces similar cytoarchitectonic changes. On the basis of the examination of cerebellar morphology, our findings indicate that FA at high supplementation may act more as a xenobiotic than as an essential nutrient, at an early stage after the end of development. Sievers et al. ( Reference Sievers, Mangold and Berry 42 , Reference Allen, Sievers and Berry 43 ) found that all fissures were affected, instead of only two, and this was accompanied by the disappearance of the pia mater (a key event in the pathological fusion of two adjacent folia). In addition, fusions were also associated with impaired cerebellar corticogenesis. Similar cerebellar defects have been observed at the perinatal stage in Gpr56 knockout mice, including ectopic granule cell clusters, disorganised Bergmann arborisation with processes extending out in random directions and pia mater disruption. All of these defects may contribute to motor deficits( Reference Koirala, Jin and Piao 44 ). In contrast, FA supplementation in a homozygous methylenetetrahydrofolate reductase gene knockout model( Reference Jadavji, Deng and Leclerc 45 ) induced a marked reduction in the size of the cerebellum and cerebral cortex, and enlarged lateral ventricles. These mice show perturbed granule cell maturation (but not neurogenesis), depletion of external granule cells and disorganisation of Purkinje cells, mainly confined to the anterior lobe of the cerebellum.
Similarly, adverse effects were observed with FA supplementation in three genetic murine NTD mutants, with increased incidence of NTD in homozygous mutants, occurrence of NTD in heterozygous embryos and embryonic lethality before neural tube closure( Reference Marean, Graf and Zhang 46 ). Microarray analysis also revealed that higher gestational FA levels may alter expression of genes in the cerebellum of mice( Reference Barua, Kuizon and Chadman 47 ).
In adults, FA supplementation has been found to prevent colorectal cancer( Reference Fortmann, Burda and Senger 48 ) and improve immune function( Reference Wintergerst, Maggini and Hornig 49 ), and it has been hypothesised that FA supplementation reduces CVD risk by lowering Hcy levels( Reference Clarke, Halsey and Lewington 50 ). However, these potential benefits of FA may be counteracted by some adverse effects. The best-known adverse effect of exposure to high doses of FA is the possible masking of vitamin B12 in pernicious anaemia( Reference Mills 51 ). In addition, it has been suggested that high FA supplementation may enhance the development and progression of already existing, undiagnosed premalignant and malignant lesions of the colon( Reference Kim 52 ). High FA supplementation may also have a negative effect on dietary metabolic protein utilisation in virgin rats, pregnant rats and growing rats( Reference Achón, Reyes and Alonso-Aperte 53 , Reference Achón, Alonso-Aperte and Ubeda 54 ). Moreover, during gestation, this effect may be associated with reduced fetal growth( Reference Achón, Reyes and Alonso-Aperte 53 ). Possible adverse effects caused by excess FA intake in humans may relate to alterations in immune function and cognitive decline( Reference Troen, Mitchell and Sorensen 55 , Reference Morris, Evans and Bienias 56 ). Finally, an imbalance between dietary vitamin B12 and FA levels may also affect several immunological parameters, such as natural killer cytotoxicity and B lymphocytes, after only a short-term dietary treatment( Reference Partearroyo, Úbeda and Montero 57 ). Therefore, although FA should be considered as a safe vitamin, more research is needed on possible negative effects, even in low-risk populations, after prolonged and high consumption, particularly as supplementation and fortification is increasingly common in Western countries.
Epigenetic processes play a central role in regulating the tissue-specific expression of genes. Alterations in these processes can lead to profound changes in phenotype and have been implicated in the pathogenesis of many human diseases. There is growing evidence that environmental factors – particularly variations in diet and nutrient status during specific developmental periods – can induce changes in the epigenome, which are then stably maintained throughout life and influence susceptibility to disease in later life( Reference Lillycrop and Burdge 58 ). In this context, FA deficiency appears to enhance the methylation of genes in the brain, affecting cognitive and behavioural functions, and can accelerate several processes associated with ageing( Reference Partearroyo, Pérez-Miguelsanz and Úbeda 7 ). FA deficiency has been shown to result in hepatic DNA hypomethylation, but high-dose FA supplementation does not appear to induce higher methylation( Reference Partearroyo, Ubeda and Alonso-Aperte 6 ). Our results are consistent with a study by Waterland & Jirtle( Reference Waterland and Jirtle 59 ), which showed that dietary supplementation with high FA levels, vitamin B12, choline and betaine – long presumed to be purely beneficial – may have deleterious effects on gene regulation in humans at epigenetically susceptible loci.
Early growth may also be susceptible to the effects of dietary folate intervention. Small and large animal models suggest that the fetal-to-early postnatal periods are highly susceptible to internal and external factors, which can strongly affect phenotype in later life. Early postnatal over-nutrition leads to a reduction in spontaneous physical activity and energy expenditure in females, and early postnatal life is a critical period during which nutrition can affect hypothalamic developmental epigenetics( Reference Li, Kohorst and Zhang 60 ). The current state of evidence reveals that folate has a role in the development and plasticity of the nervous system even after birth, particularly during childhood and adolescence( Reference Breimer and Nilsson 61 ). An FA-supplemented diet (8·0 mg/kg FA diet), compared with a control diet of laboratory chow (2·7 mg/kg FA diet), in rats fed ad libitum from 30 to 60 d of age, provoked deficits in motivation and spatial memory, and also decreased levels of thyroxine and triiodothyronine in the periphery and decreased protein levels of thyroid receptor-α1 and -α2 in the hippocampus( Reference Sittig, Herzing and Xie 62 ).
The effects of FA supplementation may differ among the various tissues and organs, to the extent of inducing opposing effects, possibly associated with differential effects on the epigenome. This represents a potential major challenge for nutritional recommendations for the general population and for the design of studies in humans. General assumptions on the safety of FA may need to be reconsidered, taking into account the epigenetic effects on organs that complete their development after birth. However, there is no doubt that the diet must contain adequate levels of FA throughout critical developmental periods, during pregnancy and lactation, as well as throughout early life, until cerebellar development is complete.
In conclusion, our present results show that low quantities of FA may result in defects similar to those produced by excessive amounts, affecting the primary and secondary fissures in the cerebellum. The effects of FA deficiency and supplementation should be investigated, taking into account the effect on epigenetic gene regulation. Such studies should provide insight into the long-term effects of FA deficiency, or supra-supplementation, in early life in humans. Thus, whether these findings in rodents apply equally in humans is not yet known, and further studies are needed to determine the relevance of these observations on the role of FA in the cerebellum.
Acknowledgements
The authors thank Alicia Cerro and Dolores Arroyo, Departamento de Anatomía y Embriología Humanas, Facultad de Medicina, Universidad Complutense de Madrid, for their help in the preparation of histological sections.
This work was supported by ‘Plan Nacional de I+D+I 2000–2003’, ref no. BFI2003-09538 grant (Ministry of Science and Innovation, MICINN, Spain).
The authors’ contributions are as follows: T. P., N. U. and G. V.-M. designed the study. T. P. and N.U. conducted the animal study. J. P.-M., A. P.-M. and C. M.-d.-l.-C. analysed the data. T. P., J. P.-M., A. P.-M. and G. V.-M. wrote the article. All authors read and approved the final version of the manuscript.
The authors declare that they have no conflicts of interest.



