


Diabetes mellitus (DM) is an important and growing public health problem worldwide and considered one of the most common chronic non-communicable diseases(1). Its incidence is on the rise among young adults from developing countries, including Brazil, and the prevalence of women with pre-gestational DM (PGDM) has also increased in recent decades(1–3). The increase in the prevalence of DM in pregnancy is alarming, since hyperglycaemia during pregnancy is responsible for high rates of perinatal morbidity and mortality, especially in cases of PGDM(4–6).
Nutritional therapy is one of the cornerstones of the global treatment of DM at all stages of life and has a significant impact on glycaemic control. Glycaemic control is associated with a substantial reduction in the frequency of short- and long-term DM complications, such as hypertensive disorders of pregnancy, prematurity, macrosomia and even the emergence of chronic diseases in adulthood(2,5) . Preprandial plasma glucose monitoring is recommended to adjust fast- or ultrafast-acting insulin doses. Adequate postprandial plasma glucose is related to better glycaemic control and a reduced risk of preeclampsia and macrosomia(2).
The DASH (Dietary Approaches to Stop Hypertension) diet is one of the dietary strategies recommended by different scientific and health committees(2,5) . Nutritional intervention using the DASH diet in women with gestational DM has been associated with an improved glycaemic profile and reduced blood pressure(Reference Asemi, Samimi and Tabassi7–Reference Asemi, Samimi and Tabassi9). The same studies also indicate beneficial effects of the DASH diet on lipid metabolism, antioxidant concentrations and inflammatory profile, and consequently better perinatal outcomes in pregnant women and their offspring(Reference Asemi, Samimi and Tabassi7–Reference Asemi, Samimi and Tabassi9).
The DASH diet encourages the consumption of unprocessed and minimally processed foods (PF) such as fruits, vegetables, whole grains and low-fat dairy products, which are the sources of the key nutrients in this diet. It discourages the intake of PF and ultraprocessed foods (UPF), which have high energy density and are rich in fats, sugars and Na(Reference Harsha, Lin and Obarzanek10–Reference Sacks, Obarzanek and Windhauser12). Its beneficial effects on metabolic control and the management of chronic diseases such as DM are attributed to the fact that it contains antioxidants, Ca, K, Mg, unsaturated fats and dietary fibre and has a low glycaemic index(Reference Asemi, Samimi and Tabassi7,Reference Asemi, Tabassi and Samimi8,Reference Avignon, Hokayem and Bisbal13) .
In Brazil, the government’s Dietary Guidelines for the Brazilian Population provides nutritional recommendations based on how processed the foods are and what the purpose of the processing is(14). Foods are accordingly classified into four categories. Group 1 is composed of unprocessed foods – edible parts of plants or animals, mushrooms, algae and water, directly after extraction from nature – and minimally PF – the same foods after undergoing simple processes such as the removal of inedible parts, fractionation, packaging and refrigeration. Group 2 covers substances extracted directly from group 1 foods and consumed in culinary preparations, such as salt, sugar, oils and fats(14).
Group 3 consists of PF, which are made by adding salt or sugar to an unprocessed or minimally PF for the purposes of preservation or flavour enhancement. Group 4 consists of UPF, which are industrial formulations that contain multiple ingredients, including substances used exclusively in manufacturing. They usually contain few or no unprocessed foods, but incorporate techniques designed to mimic the appearance and sensory qualities of food. They are intended to be durable, convenient, highly palatable and profitable(14).
The diet and eating habits of the Brazilian population have changed over the years, in line with the global trend for the increased consumption of PF and UPF and the reduced intake of unprocessed and minimally PF and processed culinary ingredients(Reference Martins, Levy and Claro15,Reference Monteiro, Moubarac and Cannon16) . The high consumption of UPF has been associated with a diet with worse nutritional characteristics, obesity and the metabolic syndrome, which in turn also influences gestational weight gain and glycaemic control in pregnant women with DM(Reference Monteiro, Cannon and Lawrence17–Reference Rohatgi, Tinius and Cade20).
In this context, the adoption of the DASH diet adapted to the Brazilian culture could be a strategy for the glycaemic control of women with PGDM by helping them reduce their intake of PF and UPF and encouraging the consumption of foods with a better balance of macro- and micronutrients. In women with gestational DM, nutritional intervention with the DASH diet has been associated with improved glucose tolerance, reduced insulin and glycated Hb (HbA1c) concentrations, lower blood pressure, and an improved lipid profile and antioxidant capacity of plasma. In addition, it has also been associated with better obstetric and perinatal outcomes(Reference Asemi, Samimi and Tabassi7–Reference Asemi, Samimi and Tabassi9).
We do not know of any studies that assess the impact of the DASH diet on women with PGDM. The findings of this study may therefore contribute to the development of a new nutritional intervention strategy for the treatment of PGDM and the challenging task of achieving glycaemic control in this population, thus significantly reducing the complications associated with the disease and leading to better obstetric outcomes. Accordingly, the aim of this study was to evaluate the impact of a nutritional intervention based on the DASH diet on glycaemic control and the consumption of PF and UPF in women with PGDM.
Methods
Study design and ethical approval
This study is part of the DASDIA research project, registered in the REBEC clinical trials database (RBR-4tbgv6, http://www.ensaiosclinicos.gov.br/rg/RBR-4tbgv6/). It aims to test what effect the DASH diet adapted to the Brazilian population has on the perinatal outcomes of adult women with PGDM.
The primary purpose of DASDIA is to evaluate the effect of the DASH diet on the incidence of hypertensive disorders of pregnancy in adults with PGDM. The present article explores the secondary objectives of the study, including glycaemic control and the consumption of PF and UPF.
This randomised, controlled, single-blind clinical trial was conducted with two groups of adult women with PGDM receiving prenatal care at the maternity teaching hospital of the Federal University of Rio de Janeiro (Maternidade Escola da Universidade Federal do Rio de Janeiro, ME-UFRJ), in Rio de Janeiro, Brazil, from 2016 to 2019. This institution is considered a reference for the treatment of pregnant women with DM and offers multidisciplinary prenatal care. The women did not know which study group they belonged to; only the researcher responsible for providing the nutritional guidance had this information. The methodological description of the research follows the CONSORT guidelines(Reference Kenneth, Douglas and David21). The study was conducted according to the guidelines laid down in the Declaration of Helsinki(22), and all the procedures involving human subjects were approved by the research ethics committee of ME-UFRJ on 25 October 2017 (CAAE 78617517.6.0000.5275). All the participants signed an informed consent form.
Participants
Fifty-six pregnant women were invited to participate in the study and met the following inclusion criteria: chronological age > 18 years at conception, diagnosis of PGDM, singleton pregnancy, gestational age < 28 weeks, non-smoker and non-drinker. Women with chronic arterial hypertension (n 9) were included, provided they had not been diagnosed with preeclampsia, eclampsia or HELLP syndrome, as were those with treated and controlled hypothyroidism (n 10). Women with other chronic co-morbidities (n 28), such as kidney and liver disease, or with sexually transmitted diseases, were excluded from the study.
The women were randomly allocated to the study groups: the control group (CG), who received the standard dietary recommendations given at the hospital to all patients with DM, or the DASH group (DG), who received the adapted DASH diet. Randomisation was performed using a list of random numbers prepared using Microsoft Office Excel® 2007. Each woman enrolled on the study received a number from the list of random numbers; those with an odd number were put in the CG and those with an even number were put in the DG.
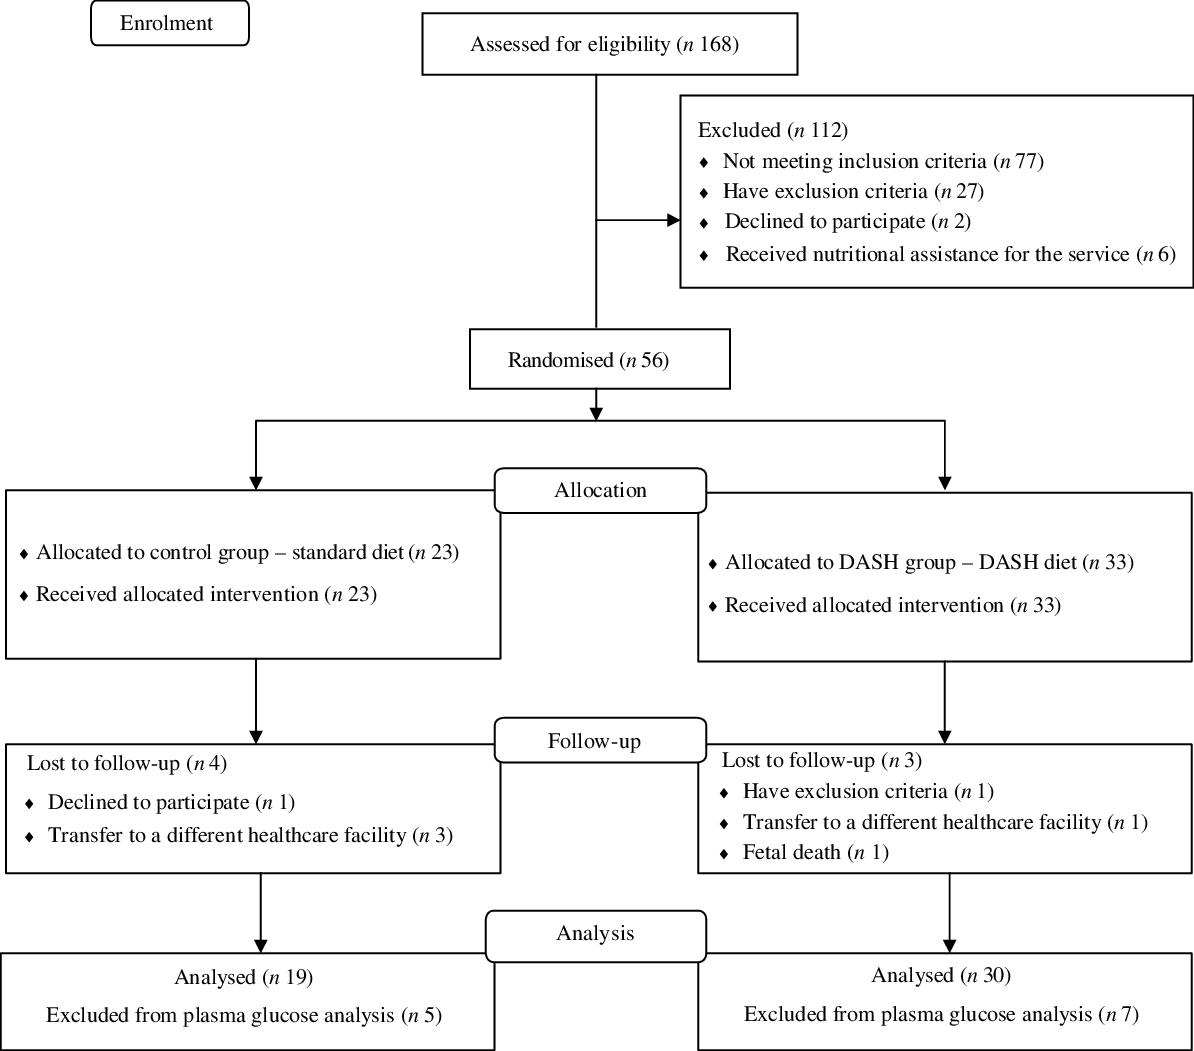
There were four follow-up losses in the CG: one woman who declined to participate and three who were transferred to a different healthcare facility. There were three losses in the DG: one woman who was transferred to a different healthcare facility, one who was diagnosed with a sexually transmitted disease and one due to fetal death after the initial consultation. Additional losses came about because not all the women had their fasting and postprandial plasma glucose measured at the right times after commencement of the intervention to enable their inclusion in the statistical analysis. Fig. 1 presents the flow chart with a detailed description of the participants’ path throughout the study.
Research flow chart.
Nutritional intervention
The CG received the standard dietary recommendations, which followed the guidelines of the American Diabetes Association(5), in which total energy intake (TEI) is distributed across groups of food with similar nutritional characteristics and energy content: fruit, bread, dairy products, meat, cereals, beans, legumes, fat and vegetables. The distribution of the food groups took into account the planned proportion of macronutrients and micronutrient needs. The women were given their dietary plan and a list of the food groups containing different food items with equivalent energy and nutritional characteristics. The dietary plan was designed to enable more flexible food choices, taking into account the women’s regular eating habits, such as full-fat or low-fat dairy products, refined or whole grains and bread, and meat options with higher or lower fat and/or cholesterol content.
The DASH diet was translated and adapted to the Brazilian population in the first phase of the DASDIA study(Reference Moreira23,Reference Santos, Moreira and Belfort24) . The adapted version includes foods available in Brazil that provide the same nutrients covered in the original DASH diet and also takes into account the social, cultural and food context of Brazilian pregnant women. The adaptation process included the translation of the diet, the adaptation of the foods and food groups, the identification of the geographical and financial accessibility of the foods and a feasibility assessment. For example, the adapted version aimed to include lower-cost, easy-access foods such as sardines and seasonal fruits and vegetables.
The adapted version includes whole grains, low-fat foods, a weekly intake of fish, chicken, lean beef and eggs (to reduce the intake of saturated fat and cholesterol), low-fat dairy products, a daily portion of seeds and nuts and a high proportion of fruits and vegetables (with emphasis on sources of key nutrients in the DASH diet). Na intake was limited to 2400–3000 mg/d, and the consumption of Na-rich foods was discouraged. The DG received a guide containing the dietary plan and a list of food substitutes. Table 1 shows the distribution of the food groups in the standard and DASH diets for a TEI of 10 042 kJ (2400 kcal).
Distribution of food groups used in the study (Maternidade Escola-UFRJ, 2016–2019, Rio de Janeiro, Brazil)*
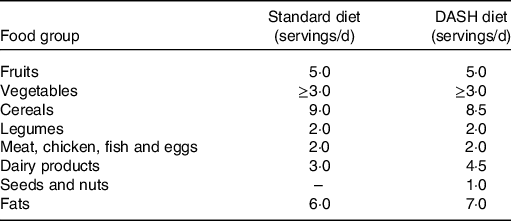
DASH, Dietary Approaches to Stop Hypertension.
* Data referring to the total energy intake of 10 042 kJ (2400 kcal).
The women in both groups also received printed matter with nutritional guidelines for the control of DM, including recommendations on the adequate use of sweeteners. The nutritional intervention provided by the research team ran until the end of pregnancy and provided for a minimum of six individual consultations with the nutritionist, in addition to three nutrition education group activities, regardless of the study group. During the appointments, adaptations were made to the dietary plan according to diet adherence, gestational weight gain, glycaemic control and potential pregnancy complications and digestive symptoms.
The dietary plan was prescribed individually, and TEI was estimated for each woman based on their weekly and total gestational weight gain plan(Reference Rasmussen and Yaktine25,Reference Padilha, Barros and Campos26) . The percentage of macronutrients was the same in each of the diets. Carbohydrates accounted for 45–55 % of TEI, protein for 15–20 % and lipids for 25–30 %. The use of sucrose was not recommended, but if the woman had chosen to consume food with sucrose, its energy value was computed in the TEI. Each dietary plan was divided into 5–6 meals a day at regular times, and the energy distribution in each of them was planned for both groups so that the main meals contained a higher proportion of energy (lunch and dinner – 20–30 % TEI) and the smaller meals contained a lower proportion (breakfast – 10–15 %; mid-morning snack – 5–10 %; afternoon snack – 10–15 %; supper – 5–10 % TEI).
To facilitate adherence to the prescribed dietary plan, the women in the DG received a portion of seeds (200 g), nuts (150 g) and skimmed milk (280 g) at each visit, and the women in the CG received a portion of oats (200 g) and reduced-fat (1–2 %) milk (300 g). All the women also received extra-virgin olive oil (500 ml) at the first visit. In addition to the aforementioned foods, a package of artificial sweetener (sucralose) was given to the women who used it regularly and/or showed an interest in receiving it as an alternative to sugar.
All the women were instructed on the routine supplementation of Fe and folic acid as is standard practice at ME-UFRJ and as recommended by the Brazilian Ministry of Health(27,Reference Bornia, Costa Júnior and Amim Júnior28) . The women from both groups with low Ca intake (<900 mg/d) which was not corrected by adhering to the prescribed diet received 500 mg/d calcium carbonate supplementation as of the 20th gestational week(6).
Two methods of dietary guidance were used in the study: carbohydrate counting and traditional(2,5,29) . The participants themselves chose which method to use, since both have been tested in women with gestational DM and PGDM, finding no significant difference between them in relation to food consumption and obstetric and perinatal outcomes(Reference Lima30–Reference Gabriel Da Silva, Rosado and De Carvalho Padilha32).
Assessment of anthropometric measures
In the first prenatal appointment, body weight (kg) was measured with a Filizola® mechanical scale and height (m) was measured using a stadiometer attached to the scale, both by trained professionals according to the recommendations of the Brazilian Ministry of Health(27). These measurements were taken at all appointments. Pre-pregnancy BMI was calculated for the classification of pre-pregnancy nutritional status(Reference Rasmussen and Yaktine25). Pre-pregnancy weight was considered as the weight measured up to the 13th week of pregnancy or as informed by the woman up to 2 months before conception(27).
Participant characteristics
The sociodemographic, biological and obstetric data investigated were: marital status (partnered or unpartnered), maternal age (years), area of residence (south zone of Rio de Janeiro or elsewhere), sanitation conditions in home (adequate – regular garbage collection, running water, sewage collection; or inadequate – absence of one or more of these services), self-reported skin colour (black or brown/white or yellow; only one participant self-reported yellow skin colour) and educational level (secondary school incomplete/secondary school graduate or higher education). Data were also collected regarding the number of previous births (nulliparous/non-nulliparous), gestational age at the first appointment (in weeks), type of DM and time since diagnosis of DM (in years).
Food consumption and adherence to diets
Food consumption was assessed in two 24-h dietary recalls (24 HR) administered during the third (7·4 weeks of intervention, interquartile range (IQR) 5·0, 12·0) and fifth (16·5 weeks of intervention, IQR 12·3, 20·0) nutritional appointments. The Multiple-Pass Method technique(Reference Conway, Ingwersen and Vinyard33) was used to administer the 24 HR, and the recommendations of the FAO of the UN(34) regarding the collection of information on food processing in food consumption surveys were observed. The interviews were conducted by trained assessors using standard procedures.
Foods were classified according to the extent and purpose of processing based on the NOVA classification and the definitions proposed in the Dietary Guidelines for the Brazilian Population(14,Reference Monteiro, Cannon and Levy35) . When insufficient detail was provided about a food to classify its level of processing, either because of a flaw in the collection procedure or because the study participant could not provide that information, it was classified according to the form in which it was most usually consumed. Such was the case, for example, of some processed fruit juices and yogurts, when the type and brand were not given. In these cases, such foods were classified as UPF.
Foods were quantified in g or ml/d using a table of domestic measurements(Reference Pinheiro, Lacerda and Benzecry36). To evaluate nutritional composition, a spreadsheet (Microsoft Office Excel®) validated by Campos et al. (Reference Campos, Queiroz and Pereira37) was used, which included foods and their nutrient contents according to the following food composition tables: the Brazilian Table of Food Composition(38), the Institute of Nutrition of Central America and Panama food composition table(39), the United States Department of Agriculture data on chemical composition of foods(40) and the Table of Nutritional Composition of Foods Consumed in Brazil(41). The nutritional information tables provided by the manufacturers were also consulted when the PF were not found in the tables described above. Subsequently, the proportion of energy in the diet from unprocessed or minimally processed foods, processed culinary ingredients, PF and UPF(14) was calculated.
Adherence to the intervention was assessed in all follow-up appointments and used four criteria based on food consumption and weekly gestational weight gain(Reference Della Líbera, Ribeiro Baião and De Souza Santos42): (1) the amount of food ingested (number and size of portions); (2) the quality of the food (food groups); (3) the pattern of food intake (percentage TEI per meal and time) and (4) the adequacy of weight gain in relation to the weight gain planned at the previous appointment. Adherence to the first three criteria was measured against the participants’ individual dietary plans. Weight gain was considered adequate when a woman’s weight gain was up to 20 % more or less than her recommended weight gain, and inadequate when it exceeded that percentage. Overall, adequacy of adherence was classified as low when just one of the four criteria was met, average when two or three were met, and high when all four criteria were met.
Biochemical assessment
Glycaemic control was assessed using fasting plasma glucose and 1-h postprandial plasma glucose, measured after consuming a standard snack provided by the maternity hospital, using a colorimetric enzymatic method. Plasma glucose is one of the parameters monitored as standard practice at ME-UFRJ and was taken every 15 d when possible, with the frequency being adapted individually as agreed between the team and the patient(Reference Bornia, Costa Júnior and Amim Júnior28). The plasma glucose measurements taken closest to 8 and 12 weeks after the commencement of the intervention were used. Blood tests done up to 15 d before or after the respective times (8 and 12 weeks) were accepted. The women were classified as having good glycaemic control when their fasting glucose was <5·3 mmol/l and their 1 h postprandial glucose was <7·8 mmol/l. If one or both of the parameters was above the cut-off point, glycaemic control was classified as inadequate(5).
Statistical analysis and sample size calculation
The sample size calculation was performed based on the primary outcome of the DASDIA study (prevalence of hypertensive disorders of pregnancy). To calculate the sample, a type I error of 5 % (α = 0·05), 80 % power, an estimated 25 % prevalence of hypertensive disorders of pregnancy in pregnant women with DM, and effect size w = 0·5(Reference Cohen43) were considered. Thus, a minimum sample of sixteen women was estimated for each group(Reference Asemi, Tabassi and Samimi8). Considering the longitudinal design of the study and possible follow-up losses (about 20 %), the minimum sample size for each group was set at twenty participants.
The normality of the data was assessed using the Shapiro–Wilk test and visual inspection. Data were presented as means and standard deviations or medians and IQR for parametric and non-parametric variables, respectively. Qualitative variables were described using absolute and relative frequencies.
Student’s t test was used to analyse the means between the groups. Levene’s test was used to test the homogeneity of the variances. The Mann–Whitney U test was used to compare medians. The χ 2 test or Fisher’s exact test was used to assess the difference between proportions. The Poisson regression model with robust variance estimate-adjusted intervention time (in days) was used to evaluate the effects of the intervention on the incidence of poor glycaemic control, by means of the incidence rate ratio with 95 % CI.
Changes in plasma glucose levels over time were determined using the Wilcoxon test. Intra-group variation of food consumption was assessed by comparing the mean energy intake from unprocessed or minimally PF, processed culinary ingredients, PF and UPF between the third and fifth appointments (6–8 and 12–14 weeks of intervention), with Student’s t test for paired data.
The quartiles of the sample distribution of energy intake from UPF were calculated, and individuals were classified into first, second or third quartiles, or fourth quartile. The Mann–Whitney U test was used to compare the plasma glucose medians between the UPF consumption categories.
Nutrient consumption was described for the data adjusted for energy consumption using the energy density method(Reference Willett and Howe44). All analyses were performed per-protocol and by intention-to-treat (ITT). The ITT population included all the randomised women who had at least one outcome measurement using the Last Observation Carried Forward technique, while the per-protocol population included all the women who had completed the trial at each time point. A significance level of 5 % was adopted, and the statistical package used was SPSS for Windows, version 23.
Results
The participants had an average age of 31 (sd 5·9) years, pre-pregnancy BMI of 28·4 (sd 5·2) kg/m2, an average gestational age of 15 (sd 5·7) weeks at baseline and 59·2 % (n 29) had one or more births. The median time since diagnosis of DM was 8 years (IQR 2·0, 15·0); 49·0 % (n 24) of the women had type 1 DM and 51·0 % (n 35) had type 2 DM. Most of the women’s self-reported skin colour was black or brown (63·3 %; n 31), most reported living with a partner (79·6 %; n 39) and most had up to 9 years in formal education (71·4 %; n 35). Regarding their area of residence, 18·4 % (n 9) lived in the south zone of Rio de Janeiro and 98·0 % of their homes had adequate sanitation (data not shown).
There was no statistically significant difference between the study groups at baseline for the participants’ sociodemographic, biological or anthropometric characteristics (Table 2). There was also no difference when it came to the method of dietary guidance used. Among the women in the CG, 70·6 % (n 12) received dietary guidance based on the traditional method, while 29·4 % (n 5) received dietary guidance based on carbohydrate counting. In the DG, 82·1 % (n 23) received dietary guidance based on the traditional method and 17·9 % (n 5) based on carbohydrate counting (P = 0·47) (data not shown).
Dietary adherence was similar between the groups throughout the intervention, and there was an improvement in adherence as the number of appointments with a nutritionist increased. At the third appointment, 31·6 % (n 6) of the women in the CG and 40·0 % (n 12, P = 0·55) in the DG had medium or high adherence. At the fifth appointment, 46·7 % (n 7) of the women in the CG and 60·0 % (n 12, P = 0·43) in the DG had medium or high diet adherence.
A lower average carbohydrate intake was observed in the DG than in the CG, but this difference was not statistically significant (P = 0·09). In relation to n-3, the median consumption was significantly higher in the DG than in the CG (P = 0·04). No statistically significant differences were found between the study groups for the other nutrients analysed (Table 3).
Sociodemographic, biological and anthropometric characteristics of the study participants at baseline, by study group (Maternidade Escola-UFRJ, 2016–2019, Rio de Janeiro, Brazil)
(Numbers and percentages; mean values and standard deviations; median values and interquartile ranges (IQR))
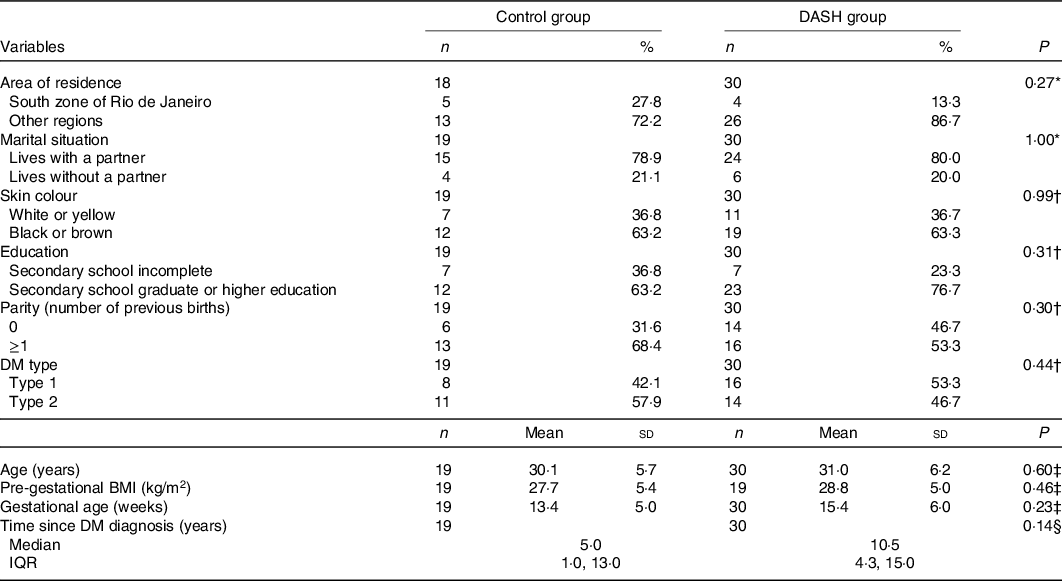
DASH, Dietary Approaches to Stop Hypertension; DM, diabetes mellitus.
* Fisher’s exact test.
† χ 2 test.
‡ Student’s t test.
§ Mann–Whitney U test.
Estimated food consumption of pregnant women with diabetes mellitus by study group (Maternidade Escola-UFRJ, 2016–2019, Rio de Janeiro, Brazil)*
(Mean values and standard deviations; median values and interquartile ranges (IQR))
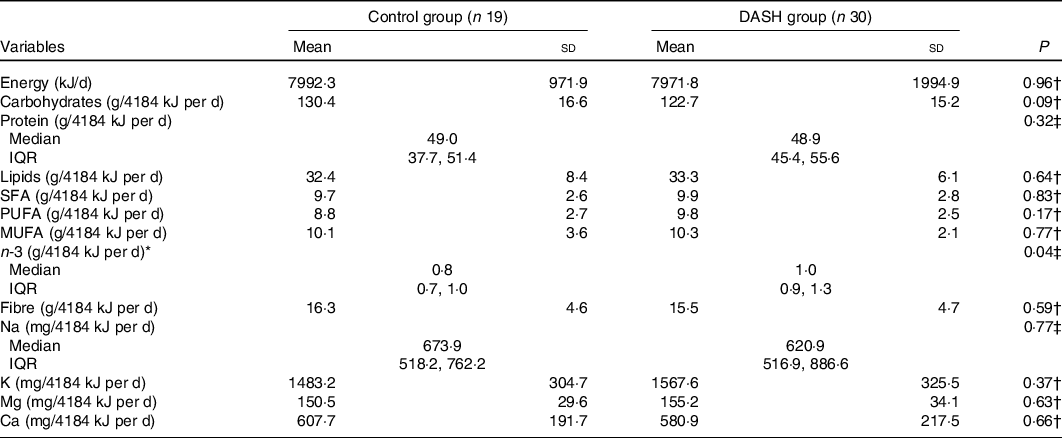
DASH, Dietary Approaches to Stop Hypertension.
* The average of the nutrient values reported in the 8th and 12th weeks of intervention was used to estimate food consumption using intention-to-treat analysis.
† Independent t test.
‡ Mann–Whitney U test.
The average consumption of the foods per category by the study participants, regardless of the group, was: 18·7 % (sd 9·3) TEI for UPF, 9·0 % (sd 8·4) for PF, 10·0 % (sd 3·5) for processed culinary ingredients and 62·5 % (sd 10·9) for unprocessed or minimally PF. The main PF consumed were: savoury breads, low-fat cheeses, high-fat cheeses, preserves and salted nuts. The most cited UPF were biscuits and crackers (predominantly savoury crackers and, to a lesser extent, unfilled biscuits and whole-grain crackers), whole-grain bread, margarine, processed cheeses and processed drinks. Biscuits were the main UPF consumed by the women in the CG, while bread was the main UPF consumed by the women in the DG (data not shown).
The consumption of UPF was lower in the DG at the fifth appointment with the nutritionist (−9·9 %, P = 0·01), with no other differences found in relation to the other levels of processing between the groups. Over the course of the intervention, the CG was found to have a reduction in the percentage of TEI corresponding to unprocessed or minimally PF (P < 0·01) concomitantly with an increase in the consumption of UPF (P = 0·03). In the DG, the percentage of TEI corresponding to UPF (P = 0·05) tended to decrease, while the consumption of unprocessed or minimally PF (P = 0·10) tended to increase between the third and fifth appointments with the nutritionist (Table 4).
Proportion of energy intake during pregnancy from foods with different levels of processing by women with diabetes mellitus, per study group (Maternidade Escola-UFRJ, 2016–2019, Rio de Janeiro, Brazil)*
(Mean values and standard deviations; median values and interquartile ranges (IQR))
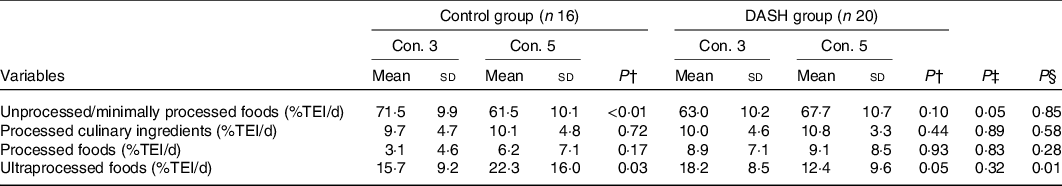
DASH, Dietary Approaches to Stop Hypertension; TEI, total energy intake; con., consultation.
* Intervention time at con. 3: 7·4 weeks, IQR 5·0, 12·0; intervention time at con. 5: 16·5 weeks, IQR 12·3, 20·0. Analysis performed per-protocol.
† Paired t test used for intra-group comparison.
‡ Student’s t test used for between-groups comparison at con. 3.
§ Independent t test used for between-groups comparison at con. 5.
In the per-protocol analysis, the DASH-based intervention yielded better glycaemic control after 12 weeks of intervention than the standard diet (P = 0·01), where the incidence of glycaemic control was lower (incidence rate ratio 0·47; P = 0·02). This result was borderline significant according to the ITT analysis (P = 0·06, data presented in online Supplementary material). Per-protocol and ITT associations did not change even after adjusting for the proportion of energy from UPF in the diet (data not shown). No statistically significant association was observed with glycaemic control after 8 weeks of intervention in any of the analyses (Table 5, online Supplementary material).
Fasting plasma glucose, postprandial plasma glucose and glycaemic control of pregnant women with diabetes mellitus, by intervention time and study group (Maternidade Escola-UFRJ, 2016–2019, Rio de Janeiro, RJ, Brazil)*
(Median values and interquartile ranges (IQR); numbers and percentages; incidence rate ratios (IRR) and 95 % confidence intervals)
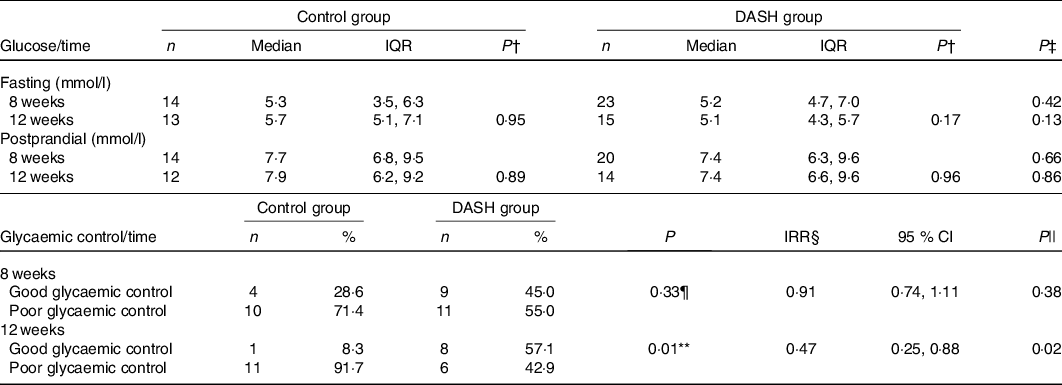
DASH, Dietary Approaches to Stop Hypertension.
* Analysis performed per-protocol.
† For the within-groups analysis performed using the Wilcoxon test, the n was: fasting glucose (control group n 8; DASH group n 11); postprandial glucose (control group n 8; DASH group n 12).
‡ Mann–Whitney U test.
§ Model adjusted by the intervention time (in days).
|| Poisson regression.
¶ χ 2 test.
** Fisher’s exact test.
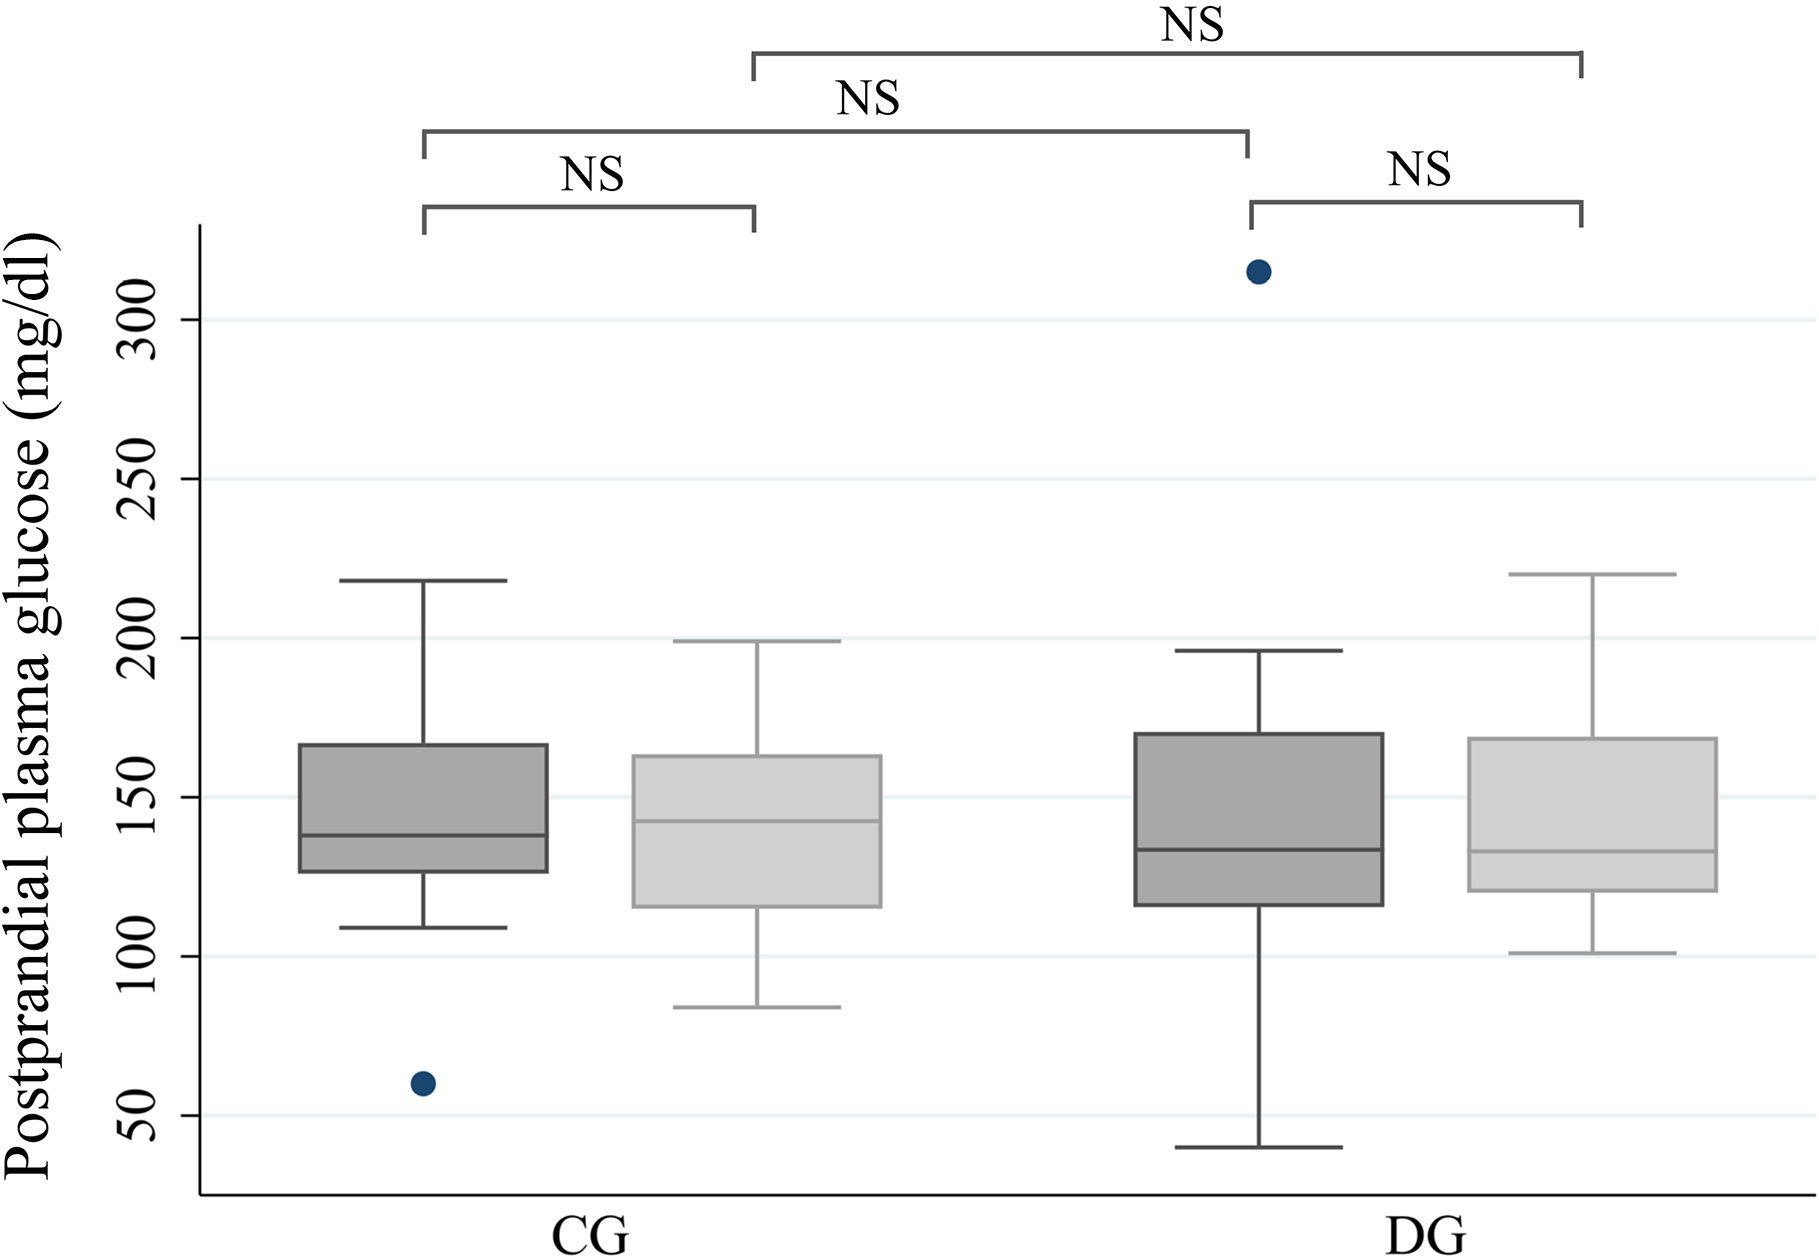
Regarding fasting and postprandial plasma glucose, which were analysed continuously, no statistically significant differences were found between or within the groups in the per-protocol (Table 5) or ITT analysis (online Supplementary material). Although no significant difference was found, the median values of fasting and postprandial plasma glucose levels observed in the DG were lower than in the CG, both after 8 weeks of intervention (−0·1 mmol/l, P = 0·43, for fasting plasma glucose and −0·2 mmol/l, P = 0·67, for 1-h postprandial plasma glucose) and after 12 weeks (−0·7 mmol/l, P = 0·14, for fasting plasma glucose and −0·5 mmol/l, P = 0·86, for 1-h postprandial plasma glucose). Figs. 2 and 3 show the distribution of median plasma glucose levels in the groups throughout the study.
Fasting plasma glucose 8 and 12 weeks after introduction of the control diet (CG) or Dietary Approaches to Stop Hypertension (DASH) diet (DG). Values are expressed as medians. Comparison between study groups was obtained using the Mann–Whitney U test. Intra-group comparison was obtained using the Wilcoxon test. Analysis was performed per-protocol. NS, no statistical difference. Intervention period: ![]() , 8 weeks;
, 8 weeks; ![]() , 12 weeks. To convert mg/dl to mmol/l, multiply by 0·0555.
, 12 weeks. To convert mg/dl to mmol/l, multiply by 0·0555.

Postprandial plasma glucose 8 and 12 weeks after introduction of the control diet (CG) or Dietary Approaches to Stop Hypertension (DASH) diet (DG). Values are expressed as medians. Comparison between study groups at both times was obtained using the Mann–Whitney U test. Intra-group comparison was obtained with the Wilcoxon test. Analysis was performed per-protocol. NS, no statistical difference. Intervention period: ![]() , 8 weeks;
, 8 weeks; ![]() , 12 weeks. To convert mg/dl to mmol/l, multiply by 0·0555.
, 12 weeks. To convert mg/dl to mmol/l, multiply by 0·0555.
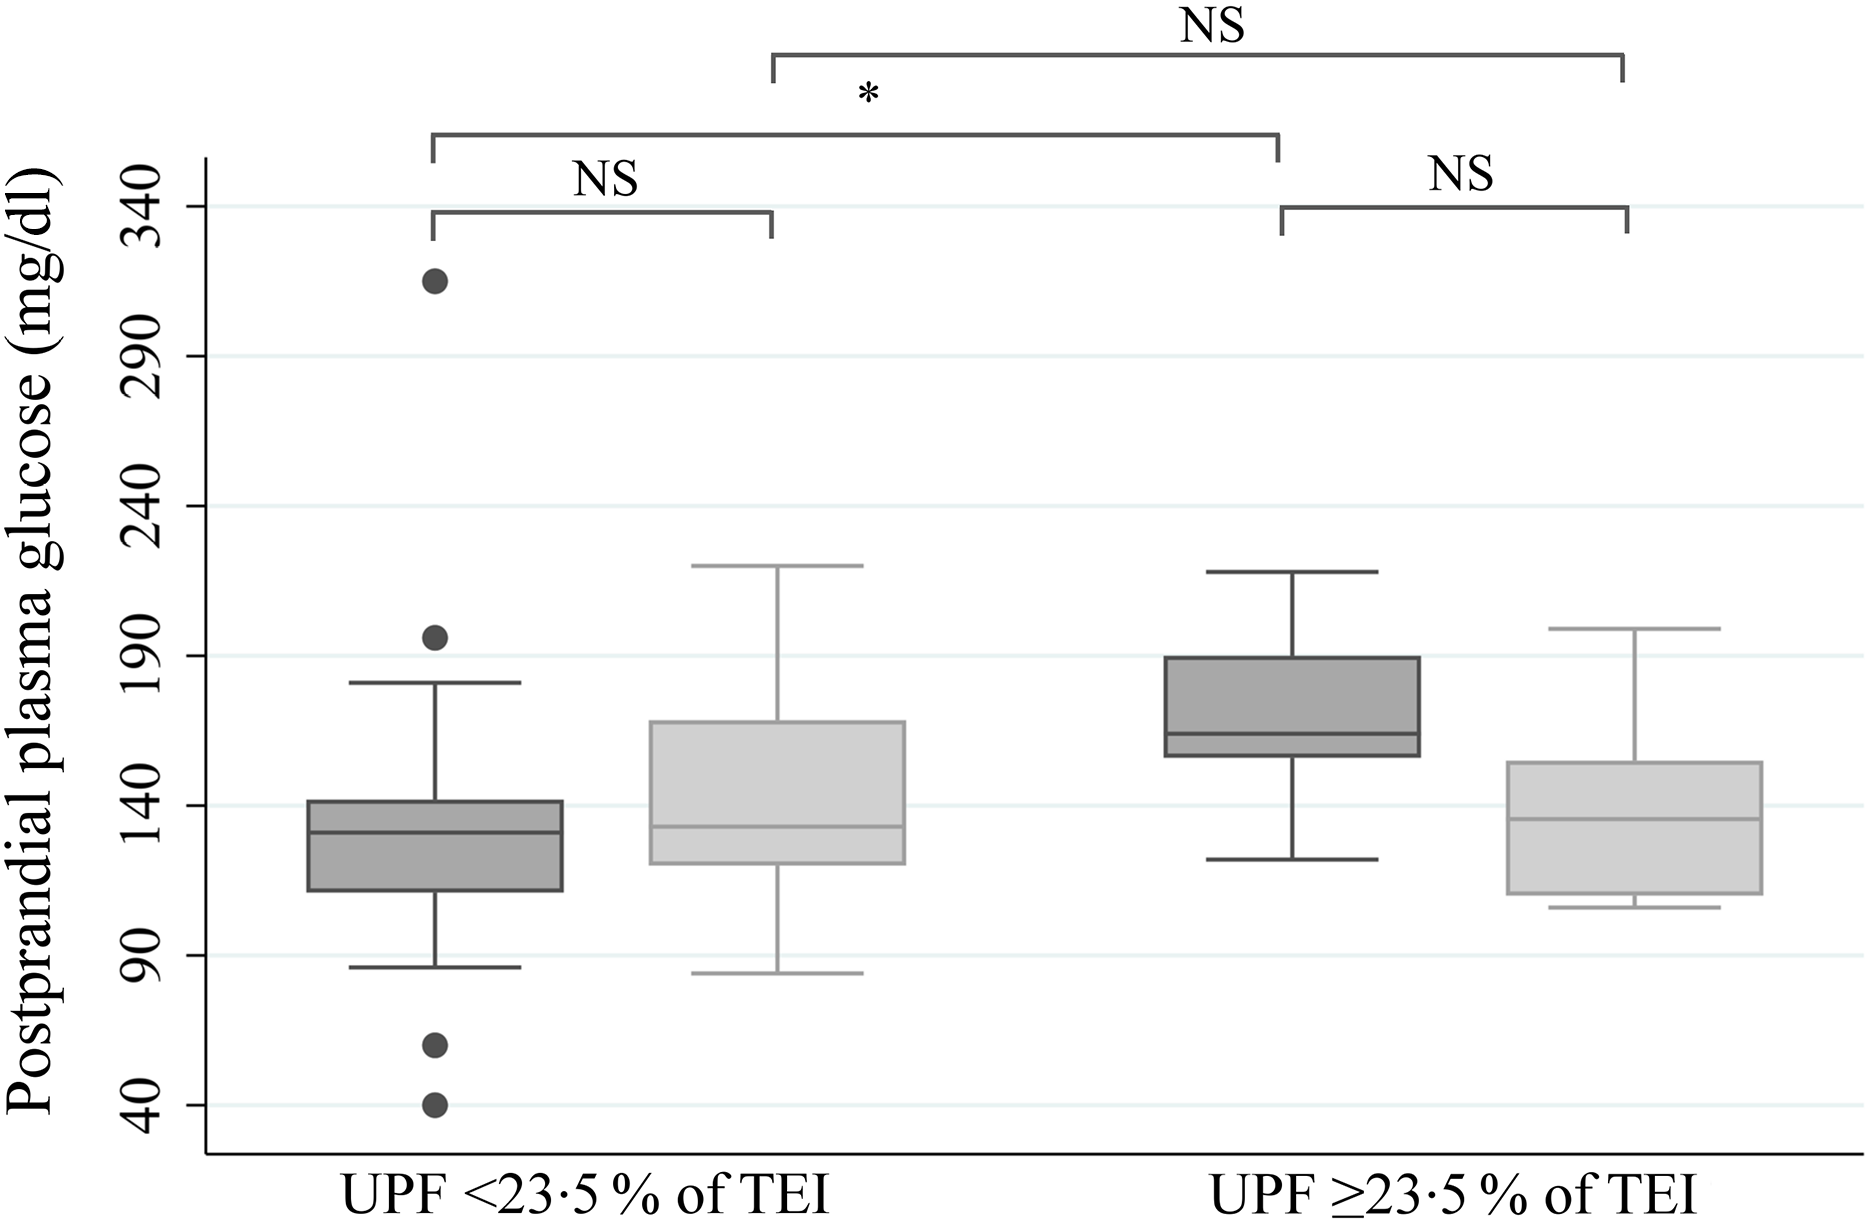
A direct association was observed between the consumption of UPF and postprandial plasma glucose (Fig. 4). In the analysis of the total sample, the women whose UPF consumption was in the upper quartile (>23·5 % of TEI) had higher median 1-h postprandial plasma glucose than the women in the first, second and third quartiles (9·1 mmol/l, IQR 7·8, 10·7 v. 7·3 mmol/l, IQR 6·1, 8·5, P = 0·02, Fig. 4). A similar association was found when this analysis was performed within the CG (10·5 mmol/l, IQR 9·2, 11·7 v. 7·3 mmol/l, IQR 6·1, 8·2, P = 0·01; data not shown). In the DG, although higher median postprandial glycaemia was observed in the upper quartile of UPF consumption, the difference was not statistically significant (8·7 mmol/l, IQR 6·9, 10·0 v. 7·3 mmol/l, IQR 6·2, 9·8, P = 0·38; data not shown).
Postprandial plasma glucose value at 1 h according to the consumption of ultraprocessed foods (UPF) 8 and 12 weeks after commencement of intervention, regardless of the study group. Values are expressed as medians. Comparison between the quartiles of UPF in proportion to total energy intake (TEI) at both times obtained using the Mann–Whitney U test. Interquartile comparison, obtained using the Wilcoxon test. Analysis performed per-protocol. * P = 0·02. NS, no statistical difference. Intervention period: ![]() , 8 weeks;
, 8 weeks; ![]() , 12 weeks. To convert mg/dl to mmol/l, multiply by 0·0555.
, 12 weeks. To convert mg/dl to mmol/l, multiply by 0·0555.
Discussion
The adapted DASH diet was found to improve the glycaemic control of women with PGDM after 12 weeks of intervention. However, there was no statistically significant difference between the groups regarding fasting and 1-h postprandial plasma glucose. Nutritional guidance based on the DASH diet also resulted in lower UPF consumption after 12 weeks of intervention, and an association between UPF consumption and 1-h postprandial plasma glucose was demonstrated after 8 weeks of intervention in the total sample and in the CG.
Asemi et al. (Reference Asemi, Samimi and Tabassi7,Reference Asemi, Tabassi and Samimi8) , who evaluated the consumption of the DASH diet by women with gestational DM in Iran for 4 weeks, found that fasting plasma glucose values were 0·4(Reference Asemi, Samimi and Tabassi7) and 0·3 mmol/l(Reference Asemi, Tabassi and Samimi8) lower with the DASH diet than with the control diet. In the present study, we observed that the values of the DG were 0·1 mmol/l lower after 8 weeks and 0·7 mmol/l lower after 12 weeks of intervention than the corresponding values of the CG. Regarding 1-h postprandial plasma glucose, we found less marked differences when comparing plasma glucose values between the groups: 0·2 and 0·5 mmol/l lower after 8 and 12 weeks of intervention, v. the 0·9 mmol/l reduction found by the authors in Iran(Reference Asemi, Tabassi and Samimi8).
In a case–control study with 460 healthy women with gestational DM, an inverse relationship between the DASH diet and fasting glucose was demonstrated. Women in the highest DASH tertiles had significantly lower plasma glucose concentrations (mean 5·3 mmol/l) than those in the lowest tertile (6·3 mmol/l)(Reference Izadi, Tehrani and Haghighatdoost45). Although we did not find any difference between the study groups’ fasting and postprandial blood glucose values, the values of the women from the DG were within those recommended by committees specialised in DM(2,5) .
Adequate glycaemic control is important for preventing complications related to DM during pregnancy, but in clinical practice, it is very difficult to achieve, especially by women with PGDM(Reference Buhary, Almohareb and Aljohani46). In a retrospective cohort study to determine the relationship between glycaemic control and pregnancy outcomes, Buhary et al. (Reference Buhary, Almohareb and Aljohani46) analysed data from a sample of 325 women with gestational DM. While 53·1 % of the women had good glycaemic control, only 24·2 % with type 2 DM and 16·9 % with type 1 DM kept their plasma glucose under control.
In our study, 53·0 % of the participants achieved good glycaemic control after 12 weeks of intervention. Also, 45·0 and 57·1 % of the women from the DG showed good glycaemic control after 8 and 12 weeks of intervention, respectively. Indeed, the levels of glycaemic control observed in the DG were higher than those observed in other studies conducted with women with PGDM at the same maternity hospital, where on average 35·5 % of the women achieved good glycaemic control in the third trimester of pregnancy(Reference Monteiro, Cannon and Lawrence17,29) .
The better glycaemic control observed among the women who received nutritional guidance based on the DASH diet can be explained by the lower carbohydrate intake of this group, even though this difference was not statistically significant. It could also be justified by the quality of the carbohydrates stimulated in this diet, which tend to have a low glycaemic index. There is a consensus about the impact that the quality and quantity of carbohydrates have on glycaemic response(2,Reference De Munter, Hu and Spiegelman47) .
The women in the DG also consumed more n-3 fatty acids than the women on the standard diet. The role this fat plays in reducing inflammatory markers has an impact on insulin sensitivity(Reference Lin, Shi and Li48,Reference Abbott, Burrows and Thota49) . Finally, the better glycaemic control in the DG may be due to the lower consumption of UPF. Our analyses identified a direct association between UPF consumption and postprandial plasma glucose. Da Silva(Reference Monteiro, Cannon and Lawrence17) also demonstrated that UPF consumption was associated with HbA1c and postprandial glycaemia in women with PGDM. In this study, a 4·184 kJ (1 kcal) increase in TEI from UPF corresponded to a 0·007 % increase in HbA1c and a 0·007 mmol/l increase in postprandial glucose in the third trimester of pregnancy.
The consumption of UPF is closely correlated with the overall quality of a diet and is associated with an unfavourable nutritional profile(Reference Monteiro, Moubarac and Cannon16). A study of the relationship between UPF consumption and the dietary content of nutrients with a protective effect or associated with a predisposition to non-communicable diseases found a positive association between UPF and the proportion of dietary sugar and a significant inverse relationship between UPF and dietary fibre content in the diet in all eight countries where these associations were studied(Reference Monteiro, Moubarac and Cannon16). This is consistent with Fardet(Reference Fardet50), who found a correlation between the degree of food processing and glycaemic response. In this study, the more processed the food, the greater the impact on plasma glucose. The high sugar content and low supply of dietary fibre characteristic of UPF could be behind the association we found between it and plasma glucose.
The average consumption of UPF by the women in our research was 22·6 and 35·7 % lower than that of healthy pregnant women in Rio de Janeiro and the USA, respectively(Reference Da Silva18,Reference Alves-Santos, Eshriqui and Franco-Sena19) . This difference could be partially explained by the fact that in these studies, there was no differentiation between the varieties of bread consumed, all of which were classified as UPF. The Dietary Guidelines for the Brazilian Population classifies breads prepared with wheat flour, yeast, water and salt as PF. We followed this guide to categorise bread in our study(14). This is reflected in the PF consumption found in our study, which came out three times higher than in a study of healthy Brazilian pregnant women conducted by Alves-Santos et al. (Reference Da Silva18).
It is also likely that women with PGDM are already more concerned about their diet, possibly having already received nutritional therapy, since it is recommended for all people with DM(2,5) . Another consideration has to do with the fact that the women in our study received prenatal nutritional care at a referral hospital for pregnancy complicated by DM, which included multidisciplinary monitoring and a set schedule of individual appointments with a nutritionist and group nutritional education actions, which may have contributed to the lower percentage of UPF consumed, regardless of the diet followed. The effectiveness of this strategy is confirmed in a previous study with women with DM at the same maternity unit, 16·1 % of whose energy intake came from UPF(Reference Monteiro, Cannon and Lawrence17).
In addition, the improved eating habits of the women from the DG during pregnancy, marked by a reduced consumption of UPF and increased intake of fresh or minimally PF, may be down to the characteristics of the DASH diet, which encourages the consumption of unprocessed and minimally PF such as fruits, vegetables, whole grains and low-fat dairy products, while discouraging highly PF and foods with high energy density and high Na, sugar, and saturated and trans fat content(Reference Harsha, Lin and Obarzanek10–Reference Sacks, Obarzanek and Windhauser12).
In the 24 HR, the women from the DG reported consuming fewer biscuits and crackers, which may indicate a decision to eat healthier snacks. The consumption of healthier snacks, following the guidance of a culturally adapted DASH diet, has been described in African Americans with hypertension(Reference Whitt-Glover, Hunter and Foy51). Interestingly, sliced wholemeal bread, the UPF most cited by the women who received guidance based on the DASH diet, is actually considered a reformulated or ‘premium’ UPF because it has added fibre, vitamins and minerals, despite being categorised as ultraprocessed. Therefore, it is important to provide guidance on how to read labels and choose the healthiest options(34).
There was no statistically significant difference between the study groups in the consumption of key nutrients from the DASH diet, such as Ca and Mg. The variation in the adherence to the diets observed in the two groups throughout the study, in addition to Brazilian cultural eating habits, could help explain this finding(52). In addition, the diet that is traditionally used at the maternity unit where the trial was run, which specialises in prenatal care for women with DM and was defined in our study as a control diet, already advises a high consumption of fruits, vegetables and reduced-fat dairy products. The benefits of this nutritional care in outcomes such as macrosomia and glycaemic profile have been described elsewhere(Reference Monteiro, Cannon and Lawrence17,Reference Silva, Saunders and Zajdenverg53) . This may also explain why we did not find more significant differences in plasma glucose between the two diets.
Our study has certain limitations. The plasma glucose levels used were dependent on the timing of the routine prenatal care blood tests, making it difficult to standardise the collection date. Accordingly, there were some gaps in the fasting and postprandial plasma glucose data at the intervention times analysed. For the same reason, plasma glucose values could not be assessed at baseline. Similarly, we have no information on the participants’ diet at baseline to classify it into the food processing groups used in the study; the 24 HR were only performed after the intervention had begun. Although no statistically significant differences were found between the study groups at enrolment, including variables that are known to be associated with plasma glucose and UPF consumption, such as age, education and, pre-pregnancy BMI, we may not confirm that the groups are comparable at the baseline and interpretation of the results needs to be done in light of these considerations(1,2,Reference Caixeta54–Reference Berti, Rocha and Curioni57) .
The groups were slightly unbalanced in terms of the number of participants. We believe this is due to the randomisation method used for such a small sample size. We assume that as the number of participants increased, this imbalance would be corrected. Nonetheless, we would stress that the randomisation was effective in forming similar groups, as described in Table 2. Follow-up losses and the modest sample size meant the study had limited power to detect significant small to medium effect sizes associations, and this should be kept in mind when interpreting non-significant results.
One strength of our study is the evaluation of food consumption by means of 24 HR, which, despite being subject to underestimation and overestimation bias and being influenced by the individual’s capacity to remember and accurately report the foods consumed(Reference Scagliusi, Ferriolli and Pfrimer58), is considered to have high potential for collecting data on food consumption where the objective is to estimate intake from the perspective of the level of food processing(34). The interviewers who administered the 24 HR questionnaires were given specific training and followed standard procedures(Reference Conway, Ingwersen and Vinyard33,34) . In addition, patients were subsequently contacted by phone when it was not clear what type or brand of food they had reported, which made the classification of the foods quite accurate. Finally, another factor to be considered is novelty, since this is the first study that evaluated the impact of the DASH diet on the glycaemic control of pregnant women with PGDM.
To conclude, we found that the adoption of the DASH diet adapted to Brazilian dietary habits resulted in the improved glycaemic control of women with PGDM after 12 weeks of intervention in comparison with a control diet. Nutritional guidance based on the DASH diet also contributed to a lower consumption of UPF as the number of appointments with the nutritionist increased and adherence to the guidelines improved. This lower consumption may favour the glycaemic profile, since the highest quartile of UPF intake (>23·5 % of TEI) was associated with higher postprandial plasma glucose during pregnancy. The results therefore suggest that the adoption of the adapted DASH diet may provide better glycaemic control and contribute to lower UPF consumption, constituting a promising nutritional intervention strategy in assisting pregnant women with PGDM. However, further studies should be conducted to understand and highlight the effect of the DASH diet on glycaemic profile and to evaluate its effectiveness for women with PGDM.
Acknowledgements
The authors wish to thank the research students and nutritionists of the Research Group on Maternal and Child Health (GPSMI) of ME-UFRJ, who participated in the nutritional consultations, educational actions, and the collection and tabulation of the research data. The authors are also grateful to their colleagues from the Nutrition Service and the entire multiprofessional prenatal care team and board of directors of ME-UFRJ for their support during the research.
This study received financial support from FAPERJ (Cientista do Nosso Estado−2016, grant number E-26/202.972/2016) and CNPq (Universal-2016, grant number 409032/2016-6), CNPq research grant (2016-2019) to C. S. (grant number 307013/2015-4), in addition to undergraduate research grants (PIBIC; CNPQ/UFRJ and FAPERJ, grant number) and outreach grants (PIBEX/UFRJ, no grant number) for undergraduate students of the Nutrition Course at the Josué de Castro Nutrition Institute of the Federal University of Rio de Janeiro. The funding agencies played no role in the design, analysis or writing of this article.
The authors’ contributions were as follows: C. S. was responsible for the research design; S. F, C. S. and D. R. F. planned the study; S. F., C. S., G. P. B., K. S., T. S. U. L. and M. S. S. conducted the research; S. F. and D. R. F. performed the statistical analysis. All the authors wrote the paper and contributed to the discussion or interpretation of the data. S. F. was primarily responsible for the final draft. The authors have read and approved the final manuscript.
None of the authors has any conflicts of interest to declare.
Supplementary material
For supplementary material referred to in this article, please visit https://doi.org/10.1017/S0007114520004791


