


Introduction
For decades, Palmer amaranth (Amaranthus palmeri S. Watson) has ranked among the most troublesome and common weed species in most southern row-crop production systems (Norsworthy et al. Reference Norsworthy, Griffith, Griffin, Bagavathiannan and Gbur2014; Van Wychen Reference Van Wychen2022; Webster and Nichols Reference Webster and Nichols2012). The pernicious effects of A. palmeri are a result of its high competitiveness with the crop for available resources, rapid growth rate, and prolific seed production (Chandi et al. Reference Chandi, Jordan, York, Milla-Lewis, Burton, Culpepper and Whitaker2012; Horak and Loughin Reference Horak and Loughin2000). With a prolonged emergence period that aligns with most row-crop production systems and noteworthy growth rate when in competition for available resources, A. palmeri can accumulate sufficient aboveground biomass to interfere with crop development substantially (Bell et al. Reference Bell, Norsworthy and Scott2015; Jha and Norsworthy Reference Jha and Norsworthy2009; Klingaman and Oliver Reference Klingaman and Oliver1994; Mahoney et al. Reference Mahoney, Jordan, Hare, Leon, Roma-Burgos, Vann, Jennings, Everman and Cahoon2021). As a result, negative yield impacts associated with the season-long survival of A. palmeri have been well documented in corn (Zea mays L.) (Massinga et al. Reference Massinga, Currie, Horak and Boyer2001), cotton (Gossypium hirsutum L.) (MacRae et al. Reference MacRae, Webster, Sosnoskie, Culpepper and Kichler2013; Norsworthy et al. Reference Norsworthy, Schrage, Barber and Schwartz2016b), and soybean [Glycine max (L.) Merr.] (Klingaman and Oliver Reference Klingaman and Oliver1994). However, the competitive ability of A. palmeri is not restricted to the growing season in which it emerges, because its high fecundity can affect management strategies in future years due to sufficient replenishment of the soil seedbank (Schwartz et al. Reference Schwartz, Norsworthy, Young, Bradley, Kruger, Davis, Steckel and Walsh2016).
To understand the impact of A. palmeri on crop yields, it is important to recognize the interactions between the crop and weed at developmental stages, which will also ensure successful crop management (Myers et al. Reference Myers, Curran, VanGessel, Calvin, Mortensen, Majek, Karsten and Roth2004). Crop yield loss is primarily influenced by weed density and interspecific interference between two species (Shekhawat et al. Reference Shekhawat, Rathore and Chauhan2020; Smith et al. Reference Smith, Flinchum and Seaman1997). Additionally, the timing of weed emergence relative to the crop is a critical factor affecting yield loss and is the most vital component in crop–weed interactions (Knezevic et al. Reference Knezevic, Weise and Swanton1994; Kropff and Spitters Reference Kropff and Spitters1991; Swanton et al. Reference Swanton, Nkoa and Blackshaw2015). Thus, successful and timely weed management strategies can be applied with awareness of weed biology and establishment time relative to the crop (Korres et al. Reference Korres, Norsworthy, Brye, Skinner and Mauromoustakos2017; Wyse Reference Wyse1992).
Traditionally, A. palmeri has not been a problematic weed in conventional flood-irrigated rice production systems due to the continual flood acting as a weed-suppression mechanism for most terrestrial weeds (Bagavathiannan et al. Reference Bagavathiannan, Norsworthy and Scott2011). However, a non-flooded, furrow-irrigated rice production system has increased prominence by more than 18-fold since 2015 (Hardke Reference Hardke2022). As a result, new weed control challenges emerge due to furrow-irrigated rice production practices being comparable to those associated with cotton, soybean, and corn production (Norsworthy et al. Reference Norsworthy, Griffith and Scott2008, Reference Norsworthy, Scott, Bangarwa, Griffith, Wilson and McCelland2011). In a furrow-irrigated system, A. palmeri is problematic throughout the entirety of the growing season due to the aerobic conditions providing a conducive environment for weed emergence, which makes weed management increasingly problematic (Beesinger et al. Reference Beesinger, Norsworthy, Butts and Roberts2022; Norsworthy et al. Reference Norsworthy, Griffith and Scott2008, Reference Norsworthy, Scott, Bangarwa, Griffith, Wilson and McCelland2011).
A 2020 survey of Arkansas rice producers and consultants showed that A. palmeri was the fifth and second most problematic weed in flood- and furrow-irrigated rice, respectively (Butts et al. Reference Butts, Kouame, Norsworthy and Barber2022). The problematic nature of A. palmeri in a furrow-irrigated rice systems can cause herbicide expenditures to be elevated if left uncontrolled throughout the growing season (Bagavathiannan et al. Reference Bagavathiannan, Norsworthy and Scott2011; Barber et al. Reference Barber, Bateman, Butts, Hamilton, Henry, Lorenz, Mazzanti, Norsworthy, Roberts, Wamishe and Watkins2021). Additionally, A. palmeri has evolved resistance to many previously effective preemergence and postemergence rice herbicides (Norsworthy et al. Reference Norsworthy, Korres, Walsh and Powles2016a). Therefore, growers must utilize a well-rounded approach that includes chemical, cultural, biological, and mechanical control methods to reduce weed infestations and focus on controlling A. palmeri early in the year (DeVore et al. Reference DeVore, Norsworthy and Bryce2013; Harker and O’Donovan Reference Harker and O’Donovan2013).
The primary goal when creating management strategies for controlling A. palmeri is to prevent weed seed production and the potential for herbicide resistance spread (Shekhawat et al. Reference Shekhawat, Rathore and Chauhan2020). With A. palmeri having the innate ability to emerge over an extended period, effective weed management is crucial during the summer months (Jha and Norsworthy Reference Jha and Norsworthy2009). Although an economic threshold approach has been considered for some weeds (Jones and Medd Reference Jones and Medd2000), researchers have recommended a “zero-tolerance” approach for A. palmeri because of its potential to spread over the landscape quickly (Barber et al. Reference Barber, Smith, Scott, Norsworthy and Vangilder2015; Norsworthy et al. Reference Norsworthy, Griffith, Griffin, Bagavathiannan and Gbur2014). Therefore, it is crucial to not rely on chemical applications alone for controlling A. palmeri due to herbicide resistance and lack of control under optimal climatic conditions (Bagavathiannan and Norsworthy Reference Bagavathiannan and Norsworthy2012; Butts et al. Reference Butts, Kouame, Norsworthy and Barber2022).
In Arkansas, soybean is commonly rotated with rice due to the convenient implementation of herbicide programs that target troublesome monocot weeds in a dicot crop (Burgos et al. Reference Burgos, Norsworthy, Scott and Smith2008, Reference Burgos, Butts, Werle, Bottoms and Mauromoustakos2021; Nalley et al. Reference Nalley, Massey, Durand-Morat, Shew, Parajuli and Tsiboe2022). With A. palmeri being among the most problematic weed species in Arkansas soybean, flood-irrigated rice tended to reduce the soil seedbank because of the weed’s inability to survive anaerobic conditions (Beesinger et al. Reference Beesinger, Norsworthy, Butts and Roberts2022; Riar et al. Reference Riar, Norsworthy, Steckel, Stephenson, Eubank and Scott2013). With the increased popularity of furrow-irrigated rice and widespread herbicide-resistant weed species across both cropping systems, A. palmeri infestations are likely to occur each year, which may lead to increased soil seedbank inputs (Butts et al. Reference Butts, Kouame, Norsworthy and Barber2022; Norsworthy et al. Reference Norsworthy, Bond and Scott2013). However, rice production systems have not quantified A. palmeri interference and seed production. Therefore, this research aimed to (1) evaluate the impact of A. palmeri interference on rice growth and yield and (2) assess A. palmeri biology in response to competition with rice.
Materials and Methods
Amaranthus palmeri Area of Influence in Furrow-irrigated Rice
A field experiment was conducted in 2022 and 2023 at the Milo J. Shult Agriculture Research and Extension Center in Fayetteville, AR (coordinates: 36.09352 N, 94.16890 W), to determine the impact of A. palmeri emergence time relative to rice on A. palmeri seed production and rice grain yield in a furrow-irrigated system. The experiment was set up as a completely randomized design, and the experimental area was ∼0.10 ha. Amaranthus palmeri emergence was random and could not be blocked, but management thereafter was controlled. In both site-years, the soil was a Leaf silt loam (fine, mixed, active, thermic Typic Albaquults) composed of 18% sand, 69% silt, 13% clay, and 1.6% organic matter with a pH of 6.6. Before rice planting, the fields were disked, tilled, and hipped into 91-cm-wide beds. The soil was amended for fertility before planting based on the University of Arkansas System Division of Agriculture Marianna Soil Test Lab fertility recommendations (Roberts et al. Reference Roberts, Slaton, Wilson and Norman2018). Additionally, the entire experimental area in both years was over-sprayed with clomazone (Command® 3ME, FMC, Philadelphia, PA 19104) at 336 g ai ha−1 before planting to minimize the occurrence of annual grasses. All herbicide applications were made with a CO2-pressurized backpack sprayer calibrated to deliver 140 L ha−1 at 276 kPa using four AIXR 110015 (TeeJet® Technologies, Glendale Heights, IL 60139) nozzles at 4.8 km h−1.
On April 17, 2022, a hybrid long-grain cultivar ‘RT 7301’ (RiceTec, Alvin, TX 77512) was planted at 36 seeds m−1 of row at a 1-cm depth in a 19-cm row spacing; and on April 22, 2023, a hybrid long-grain cultivar ‘Full Page RT 7321FP’ (RiceTec) was sown using the same planting methods. Rice emerged on May 9 and May 8 in 2022 and 2023, respectively. Within each trial, a natural population of A. palmeri was allowed to germinate and emerge throughout the growing season. The experiment consisted of six A. palmeri emergence timings, beginning 1 wk before rice emergence to 4 wk after. At each emergence timing, 10 cotyledon-stage Amaranthus palmeri plants were marked randomly and considered as replications within the experiment. There were 129, 123, 110, 64, and 54 replications for week −1, week 0, week 1, week 2, and week 3 to 4 evaluation timings, respectively. To reduce competition from adjacent weeds, marked plants were separated by at least 5 m from one another. At each evaluation, the marked A. palmeri plants were covered with buckets, and the trial was over-sprayed with propanil (STAM, UPL, King of Prussia, PA 19406) at 4,486 g ai ha−1 to remove unwanted weed species while still allowing new A. palmeri plants to emerge. Once the rice reached the V5 growth stage, the trials were irrigated using standard furrow-irrigated rice methods, and nitrogen, as urea (460 g N kg−1), was applied at a total of 135 kg N ha−1 in three separate applications at 2-wk intervals (Barber et al. Reference Barber, Bateman, Butts, Hamilton, Henry, Lorenz, Mazzanti, Norsworthy, Roberts, Wamishe and Watkins2021).
At rice harvest, the height of each surviving A. palmeri plant was recorded. Additionally, each surviving A. palmeri plant was cut at the soil surface, bagged, and dried at 66 C for 2 wk to constant mass, and dry biomass was recorded. Each female plant was then threshed, and the residual material was separated from the seeds using a 20-mesh sieve and a vertical air column seed cleaner (Miranda et al. Reference Miranda, Jhala, Bradshaw and Lawrence2021). After being cleaned, 200 seeds from three plants at each emergence timing were counted and weighed, and the average weight of each subsample was divided by the total weight of seed for each plant in order to quantify the total seed produced. Rice grain yield was collected using rice sickles. A square ladder was made from a polyvinyl chloride (PVC) pipe measuring 2.4-m long, and quadrats within the ladder were 0.30-m wide by 0.30-m long and were used for portioning rice grain into 8 sections radiating in two directions from the center of the A. palmeri (Figure 1). After the A. palmeri plants were removed from the field, the center of the first quadrat was placed directly on top of the origin where the weed emerged. Rice panicles were harvested by hand in each quadrat in opposite directions and later averaged to determine rice yield loss as a function of distance from the weed. The rice panicles were threshed using an Almaco small bundle thresher (Almaco, Nevada, IA 50201), and weighed to calculate yield in each quadrat for each marked A. palmeri plant. After the weight of rice in each quadrat was obtained, three random quadrat samples were combined and inserted into a DICKEY-john® mini GAC™ 2500 portable grain moisture analyzer (DICKEY-john, Auburn, IL 62615) to obtain an average moisture content. Rice yields from each quadrat were then adjusted to 12% moisture.
Rough rice yield collection as a function of distance from Amaranthus palmeri at each emergence timing relative to rice. The numbers inside the ladder represent each quadrant from which rice grain was collected. Quadrat 1 was not duplicated because the ladder was only turned in a different direction to obtain yield from a separate location.

Statistical Analysis
All data were analyzed in JMP Pro v. 17.0 (SAS Institute, Cary, NC 27513). Regression analysis was used to quantify A. palmeri interference in furrow-irrigated rice as a function of time of emergence relative to the crop. Because two different rice hybrids were planted in separate years, a three-parameter logistic model (logistic 3P) curve was fit by year to determine the maximum yield potential for each rice cultivar, which helped account for year-to-year variation. The initial exploratory analysis included probit, Gompertz, Weibull, and logistic curves, with the logistic 3P (Equation 1) having the lowest Akaike information criterion (AIC) of 8598.25,
 $$\eqalign{& & {\rm{maximum\;yield\;potential}} \cr & & ={{{{\rm{Asymptote}}}}\over{{\left\{ {1 + {\rm{exp}}\left[ { - {\rm{growth\;rate\;}} \times {\rm{\;}}\left( {{\rm{distance}} - {\rm{inflection\;point}}} \right)} \right]{\rm{\;}}} \right\}}}}}$$
where maximum yield potential (kg ha−1) is the dependent variable; asymptote, growth rate, and inflection points are the parameters; and distance (m) from the A. palmeri plant is the independent variable. Parameters to fit the logistic 3P curve can be found in Table 1. The model included male and female A. palmeri plants after determining that gender did not influence rice yield loss based on all model parameters not being statistically different at α = 0.05 (data not shown). The maximum yield in each year was based on the asymptote of the model with hybrids RT 7301 and RT 7321 FP reaching a maximum yield potential of 8,700 and 10,600 kg ha−1, respectively.
List of model parameters for the logistic 3P curve of yield (kg ha−1) predicted by distance (m) from Amaranthus palmeri for each site-year, with R2 value presented to display the percentage of variability explained by the model.

a All model parameters were significant χ2 (P < 0.0001). Sigmoidal model and parameters determined using JMP Pro v. 17 with the Fit Curve Platform.
b Abbreviation: CI, confidence interval.
c Asymptote was used as the maximum yield potential for each site-year.
After maximum yield potential was determined, the rice grain yield of each quadrat was made relative to this potential within each year. To determine rice yield loss (%) as a function of distance from the A. palmeri plants, two- and three-parameter curves were fit within the Fit Curve platform in JMP with A. palmeri time of emergence relative to rice as a grouping variable. The three-parameter exponential decay (exponential 3P) model (Equation 2) achieved the lowest AIC and an R2 = 0.63.
 $${\rm{Yield\;loss\;}} = {\rm{Asymptote}} + {\rm{scale\;}} \times {\rm{exp}}\left( {{\rm{growth\;rate\;}} \times {\rm{distance}}} \right)$$
where yield loss is the dependent variable; asymptote, scale, and growth rate are parameters; and the distance in meters is the independent variable (Figure 2). Parameter estimates for the exponential 3P decay model can be found in Table 2. Inverse predictions were made for the distance in meters required from A. palmeri plants to observe 5% and 50% yield loss for each time of emergence relative to rice (Table 3). Prediction estimates were compared using mean 95% confidence intervals. Relative grain yield and A. palmeri data were combined over site-years to increase the number of observations and provide a stronger prediction estimate. Additionally, relative yield and weed data were pooled for A. palmeri plants emerging 3 and 4 wk after the crop to make 3.5 wk due to mortality of some plants and few observations at 3 and 4 wk than at earlier emergence times. The increased number of observations also allowed for more accurate predictions.
Three-parameter exponential decay model
 $$\left[ {y = a + b*{\rm{exp}}\left( {c \, * \, {\rm{distance}}} \right)} \right]$$
, where
$$\left[ {y = a + b*{\rm{exp}}\left( {c \, * \, {\rm{distance}}} \right)} \right]$$
, where
 $$a$$
= asymptote,
$$a$$
= asymptote,
 $$b = $$
scale, and
$$b = $$
scale, and
 $$c = $$
growth rate, to determine yield loss data as a function of distance from Amaranthus palmeri in 2022 and 2023. Inverse predictions were made from the fitted lines, giving an accurate representation of the required distance from A. palmeri to observe 5% and 50% rice yield loss (Table 3). (A–E) The individual predicted line for each weed emergence timing and corresponding 95% confidence interval, highlighted by the solid and dotted lines, respectively. (F) The predicted lines of the entire model for the five emergence timings of A. palmeri relative to rice.
$$c = $$
growth rate, to determine yield loss data as a function of distance from Amaranthus palmeri in 2022 and 2023. Inverse predictions were made from the fitted lines, giving an accurate representation of the required distance from A. palmeri to observe 5% and 50% rice yield loss (Table 3). (A–E) The individual predicted line for each weed emergence timing and corresponding 95% confidence interval, highlighted by the solid and dotted lines, respectively. (F) The predicted lines of the entire model for the five emergence timings of A. palmeri relative to rice.

List of model parameters for the exponential 3P decay model of percent yield loss by distance from Amaranthus palmeri at each emergence timing, with R2 value presented to display the percentage of variability explained by the model.
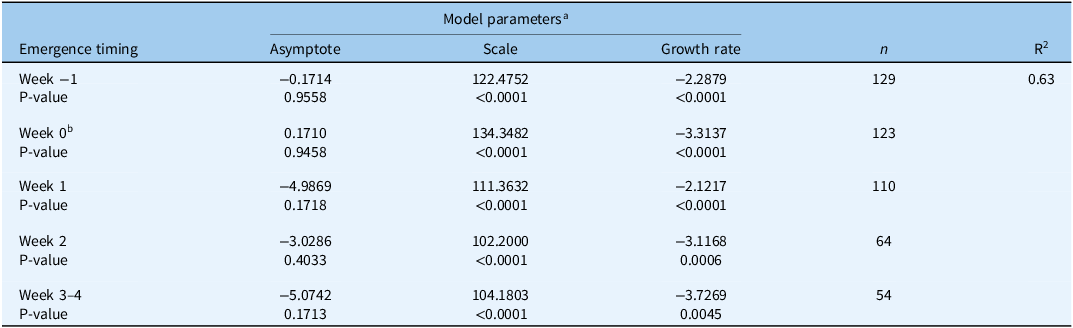
a Exponential 3P decay model and parameters determined using JMP Pro v. 17 with the Fit Curve Platform.
b The week A. palmeri emerged simultaneously with rice.
The predicted distance from Amaranthus palmeri to observe 5% and 50% yield loss at each A. palmeri emergence timing relative to rice.

a The distance in meters from A. palmeri to reach the predicted percent yield loss. Asterisks (*) show the confidence limits of an emergence timing not overlapping with the week A. palmeri emerged with the crop at the same percent yield loss.
b Displays the 95% confidence limits of the distance required from A. palmeri to reach the predicted percent yield loss. CI, confidence interval.
c The week A. palmeri emerged simultaneously with the rice crop.
A linear regression model was utilized to fit A. palmeri seed production per female plant by A. palmeri biomass per female plant (Norsworthy et al. Reference Norsworthy, Schrage, Barber and Schwartz2016b) using the Fit Curve platform in JMP Pro v. 17 (Equation 3) (Figure 3).
 $$Y = a + bX$$
Relationship between Amaranthus palmeri dry biomass and seed production per female plant in field studies conducted in 2022 and 2023. The solid line represents the fit of a linear regression model, and the dotted lines represent the 95% confidence interval of the fitted line. R2 value displays the percentage of variability explained by the fit of the line.

where
 $$Y$$
is the dependent variable (seed production per female A. palmeri plant),
$$Y$$
is the dependent variable (seed production per female A. palmeri plant),
 $$b$$
is the slope of the line,
$$b$$
is the slope of the line,
 $$X$$
is the independent variable (A. palmeri biomass per female plant), and
$$X$$
is the independent variable (A. palmeri biomass per female plant), and
 $$a$$
is the intercept when
$$a$$
is the intercept when
 $$\;X$$
is equal to zero. There was also a nonlinear relationship between A. palmeri seed production per female plant and A. palmeri time of emergence relative to the crop; therefore, a two-curve exponential decay (exponential 2P) model (Equation 4) was used to fit the relationship, considering it produced the lowest AIC and an R2 = 0.55 (Figure 4).
$$\;X$$
is equal to zero. There was also a nonlinear relationship between A. palmeri seed production per female plant and A. palmeri time of emergence relative to the crop; therefore, a two-curve exponential decay (exponential 2P) model (Equation 4) was used to fit the relationship, considering it produced the lowest AIC and an R2 = 0.55 (Figure 4).
 $$Y = {\rm{Scale}} \times {\rm{exp}}\left( {{\rm{growth\;rate}} \times {\rm{emergence}}} \right)$$
Two-parameter exponential decay model
 $$\left[ {y = a*{\rm{exp}}\left( {b \, * \, {\rm{emergence}}} \right)} \right]$$
, where
$$\left[ {y = a*{\rm{exp}}\left( {b \, * \, {\rm{emergence}}} \right)} \right]$$
, where
 $$a$$
= scale and
$$a$$
= scale and
 $$b = $$
growth rate, to estimate Amaranthus palmeri seed production per female plant as a function of A. palmeri time of emergence relative to rice. The solid line represents the fit of the two-parameter exponential decay model, and the dotted lines represent the 95% confidence interval of the fitted line. Week 0 is the week A. palmeri emerged with the crop.
$$b = $$
growth rate, to estimate Amaranthus palmeri seed production per female plant as a function of A. palmeri time of emergence relative to rice. The solid line represents the fit of the two-parameter exponential decay model, and the dotted lines represent the 95% confidence interval of the fitted line. Week 0 is the week A. palmeri emerged with the crop.

where
 $$Y$$
is the dependent variable (seed production plant−1), scale and growth rate are parameters, and A. palmeri emergence timing relative to rice is the explanatory variable.
$$Y$$
is the dependent variable (seed production plant−1), scale and growth rate are parameters, and A. palmeri emergence timing relative to rice is the explanatory variable.
Results and Discussion
Impact of Amaranthus palmeri on Furrow-irrigated Rice Yields
Maximum rice yield potential was statistically higher in 2023 than in 2022 based on the 95% confidence intervals not overlapping for the asymptote and inflection point model parameters; however, the growth rate parameter estimate was similar for both site-years, indicating that yield loss responses were consistent for both years of the experiment (Table 1). Maximum yield potential differences are attributed to the genetics of the two rice hybrids and environmental differences between years (JKN, personal observations). When the week of emergence was considered within the model, the relationship between rice yield loss and distance from the A. palmeri plant accounted for 62.7% of the variation in rice yield loss. Additionally, differences occurred between the week of A. palmeri emergence relative to rice and rice yield loss as a function of distance from the weed (Figure 2F).
Regardless of when A. palmeri emerged relative to the crop, rice yield loss was >50% within 0.15 m from the weed (Figure 2). These results are the opposite of those observed by Bensch et al. (Reference Bensch, Horak and Peterson2003), who reported that soybean yield loss was not affected by A. palmeri emerging within 15 cm of the crop 19 to 38 d after planting. However, these results likely differ due to variations in crop row spacing between planting methods and subsequent proximity to A. palmeri plants. Nevertheless, there was a reduction in rice yield loss as distance increased from the A. palmeri plant and when weed emergence was delayed relative to the crop (Figure 2).
Rice yield loss was most severe when A. palmeri emerged 1 wk before the crop, which captures a worst-case scenario for a producer in the event a burndown application fails to control all weeds before planting. At this time, inverse predictions estimate rice yield loss to be 50% and 5% at distances of 0.40 m (±0.03 m) and 1.4 m (±0.16 m) from A. palmeri, respectively (Table 3). Based on the model predicting 5% or greater rice yield loss, the crop was negatively affected in the 6.2 m2 surrounding each A. palmeri plant (π × 1.402). Weeds that emerged 3.5 wk after rice were predicted to cause 50% and 5% yield loss at distances of 0.17 m (±0.03 m) and 0.63 m (±0.13 m), an ∼5-fold reduction in area where rice yield was negatively affected compared with A. palmeri emerging before rice. A single A. palmeri emerging within 3 to 4 wk of rice emergence has the potential to impact at least 1.2 m2 of rice, assuming a 95% yield preservation. These results show that A. palmeri emerging 3 to 4 wk after rice must be removed from the crop to prevent rough rice yield loss. It should be noted that these results are from a scenario in which no additional control measures are taken once A. palmeri emerges; hence, future research should investigate the effect of different removal timings and the subsequent influence on rice yield.
Amaranthus palmeri generally had a greater influence on rice yield when emergence coincided with rice emergence (Figure 2A). These results display the effect of early-emerging A. palmeri on rice yields and the extent to which the weed can effectively compete with the rice crop for available resources. Additionally, A. palmeri that emerged 3.5 wk after rice still caused significant yield losses, which was supported by Massinga et al. (Reference Massinga, Currie, Horak and Boyer2001), who observed a 7% reduction in corn yield from 0.5 A. palmeri plants m−1 of row emerging at the 7-leaf growth stage of the crop. One factor that could influence the ability of A. palmeri to negatively impact rice yields is its C4 photosynthetic pathway and rapid root augmentation (Black et al. Reference Black, Chen and Brown1969; Massinga et al. Reference Massinga, Currie and Trooien2003; Wiese Reference Wiese1968); however, additional research is needed to confirm the effect of specific yield-limiting characteristics of A. palmeri in a furrow-irrigated rice system.
Amaranthus palmeri Seed Production as Influenced by Weed Biomass
Results of the linear regression model indicate that A. palmeri seeds per plant had a positive relationship with the dry weight of each female plant across all emergence timings and both site-years (Figure 3). Previous research in other crops has identified a strong relationship between A. palmeri dry biomass per plant and seed production, indicating that weed seed set increases as A. palmeri weight increases (Mahoney et al. Reference Mahoney, Jordan, Hare, Leon, Roma-Burgos, Vann, Jennings, Everman and Cahoon2021; Schwartz et al. Reference Schwartz, Norsworthy, Young, Bradley, Kruger, Davis, Steckel and Walsh2016; Spaunhorst et al. Reference Spaunhorst, Devkota, Johnson, Smeda, Meyer and Norsworthy2018). Seed production information may be useful in predicting the quantity of weed seed replenishment in the soil seedbank.
A 1-g increase in A. palmeri biomass plant−1 increased seed production by 447 seeds plant−1 up to a maximum of 2,500 g of dry biomass and 1.2 million seeds plant−1 (Figure 4). Similarly, Webster and Grey (Reference Webster and Grey2015) documented that A. palmeri, competing with cotton, produced 330 seeds for every gram increase in weed biomass. In general, weeds that emerge with or before the crop often produce more biomass relative to late-emerging weeds (Korres et al. Reference Korres, Norsworthy and Mauromoustakos2019), suggesting that seed production could be moderated if weed emergence was delayed until after the crop. The results of the previously mentioned studies and this research indicate a high fecundity potential for A. palmeri in rice; hence, there is an emphasis on preventing escapes and increases in soil seedbank (Norsworthy et al. Reference Norsworthy, Ward, Shaw, Llewellyn, Nichols, Webster, Bradley, Frisvold, Powles, Burgos, Witt and Barrett2012).
Amaranthus palmeri Seed Production as a Function of Time of Emergence
Across site-years, A. palmeri seed production decreased exponentially as A. palmeri emergence relative to the crop was delayed, as described by the exponential 2P model (Figure 4). On average, A. palmeri emerging 1 wk before rice produced 540,000 seeds plant−1. These findings support other researchers who reported A. palmeri produced 446,000 to 613,000 seeds plant−1 without crop competition (Keeley et al. Reference Keeley, Carter and Thullen1987; Webster and Grey Reference Webster and Grey2015). Amaranthus palmeri seed production per plant was significantly reduced when the weed emerged simultaneously with rice, producing an average of 115,000 seeds plant−1. Hence, as much as a 4-fold decrease in weed seed production occurred when there was interference between A. palmeri and rice (Figure 4).
Amaranthus palmeri fecundity did not differ among emergence dates 1, 2, and 3.5 wk after rice emergence (Figure 4). A. palmeri emerging as late as 3.5 wk after rice could still produce 500 seeds plant−1, indicating that the weed can disperse sufficient seed to contribute to increases in the soil seedbank (Crow et al. Reference Crow, Steckel, Hayes and Mueller2015; Norsworthy et al. Reference Norsworthy, Green, Barber, Roberts and Walsh2020). Amaranthus palmeri emerging 10 wk after cotton has been shown to produce up to 880 viable seeds plant−1 (Norsworthy et al. Reference Norsworthy, Schrage, Barber and Schwartz2016b). In general, A. palmeri seed production decreased as weed emergence was delayed relative to rice, indicating the competitive ability of the crop for limited resources. Although late-emerging A. palmeri can become less prolific, the offspring produced later in the season can still significantly contribute to the soil seedbank and potentially impact management strategies in subsequent years; hence, producers should not allow any A. palmeri to escape control, which supports the recommended “zero-tolerance” threshold and aids in diminishing the seedbank (Norris Reference Norris2007; Norsworthy et al. Reference Norsworthy, Griffith, Griffin, Bagavathiannan and Gbur2014).
Overall, no peer-reviewed publications quantify furrow-irrigated rice yield loss from season-long A. palmeri interference. Findings from this research support that the timing of A. palmeri emergence relative to the crop is important for determining yield loss (Chickoye et al. Reference Chickoye, Weise and Swanton1995; Knezevic et al. Reference Knezevic, Weise and Swanton1994; Massinga et al. Reference Massinga, Currie, Horak and Boyer2001), but that rice yields are also greatly affected outside the immediate area of the weed. As herbicide options for control of A. palmeri become less available and furrow-irrigated rice hectares increase, developing an understanding of the weed’s biological effects on rice yields will prove vital in incorporating successful weed management programs into a production system (Beesinger et al. Reference Beesinger, Norsworthy, Butts and Roberts2022; Korres and Norsworthy Reference Korres and Norsworthy2017).
Based on the A. palmeri seed production data presented here, female A. palmeri plants that emerge 3 to 4 wk after rice can still successfully contribute offspring to the soil seedbank (Figure 4). As a result, producers must focus on minimizing returns to the soil seedbank, which will subsequently help mitigate the additional emergence of A. palmeri seedlings in future growing seasons (Norris Reference Norris2007; Webster and Grey Reference Webster and Grey2015). Moreover, preventing A. palmeri from reaching reproductive maturity will require a combination of control measures throughout the growing season, including the use of residual preemergence herbicides, considering effective weed control options decline once weeds become established in a field (Jha and Norsworthy Reference Jha and Norsworthy2009; Webster and Grey Reference Webster and Grey2015). As a result of the consequences of allowing A. palmeri to compete with rice throughout the growing season and the need to prevent weed seed dispersal at harvest, producers should place extreme emphasis on the “zero-tolerance” approach regardless of when the weed emerges (Norsworthy et al. Reference Norsworthy, Schrage, Barber and Schwartz2016b). Although not assessed in this study, the monetary losses associated with A. palmeri interference in furrow-irrigated rice are exacerbated when harvest efficiency and quality are negatively impacted and the economic impact of A. palmeri escapes in rice will extend well beyond the year in which plants are allowed to compete and produce seed.
Funding statement
This research received no specific grant from any funding agency or the commercial or not-for-profit sectors.
Competing interests
The authors declare no conflicts of interest.


 Open access