


Introduction
Following the great drought of 1968, the second driest year of the 20th century (Garreaud and others, Reference Garreaud2025), Chilean authorities and water stakeholders recognized the importance of glaciers as a water source during exceptionally dry years. This interest was consolidated in 1971 when, under UNESCO’s International Hydrological Decade, the Course on Snow and Ice Hydrology in Latin America—taught in Santiago by L. Lliboutry, W. Ambach and G. Østrem—spurred the creation of a glacier monitoring program in Central Chile. Consequently, in 1974, the Dirección General de Aguas, or DGA (General Water Directorate), Chile’s governing body for water resources, incorporated into its activities the preparation of a forecast of meltwater flow for the September–March period in the rivers of Central Chile to support the management of the extensive network of catchments and canals that supply the population with irrigation water for agriculture. Since then, snow and ice hydrology has been regarded as a key element in predicting spring-summer water availability in the Central Andes of Chile.
In line with the above, in the spring (September) of 1975, the Hydrological Studies and Hydrometeorology section at DGA’s Hydrology Department, under the direction of engineers Humberto Peña and Javier Narbona, and with support from the University of Chile’s professor Cedomir Marangunic, began the Echaurren Norte Glacier measurement program. The program was mainly aimed at: investigating the influence of glaciers on the hydrological regime of rivers through mass and energy balances, obtaining hydrometeorological and melting process information in the Andes at elevations close to 4000 meters above sea level (m a.s.l.), and establishing a basic network for monitoring glacial fluctuations in Chile. The Echaurren Norte Glacier was selected because of its latitudinal location, which was deemed representative of the area of Central Chile with the greatest glacial influence on the hydrological regime, its relatively easy access by land and water (by boat and mule), its small size, and, in general, because it offered logistical facilities compatible with the means available at the time. Since 2009, the National Glacier Strategy, implemented by the DGA, proposes a hierarchical observation model with five levels of study. There are five monitoring levels, with Level 1 indicating the analysis of a small number of glaciers in great detail (DGA, 2009). This strategy allows for a holistic glaciological view of the country. The Echaurren Norte Glacier is a Level 1 glacier in central Chile. Currently, the DGA has a legal mandate to maintain and operate the monitoring and inventory network of glaciers and snow, which includes both measurements of volume and accumulation, as well as their characteristics and location, and must provide and publish the corresponding information.
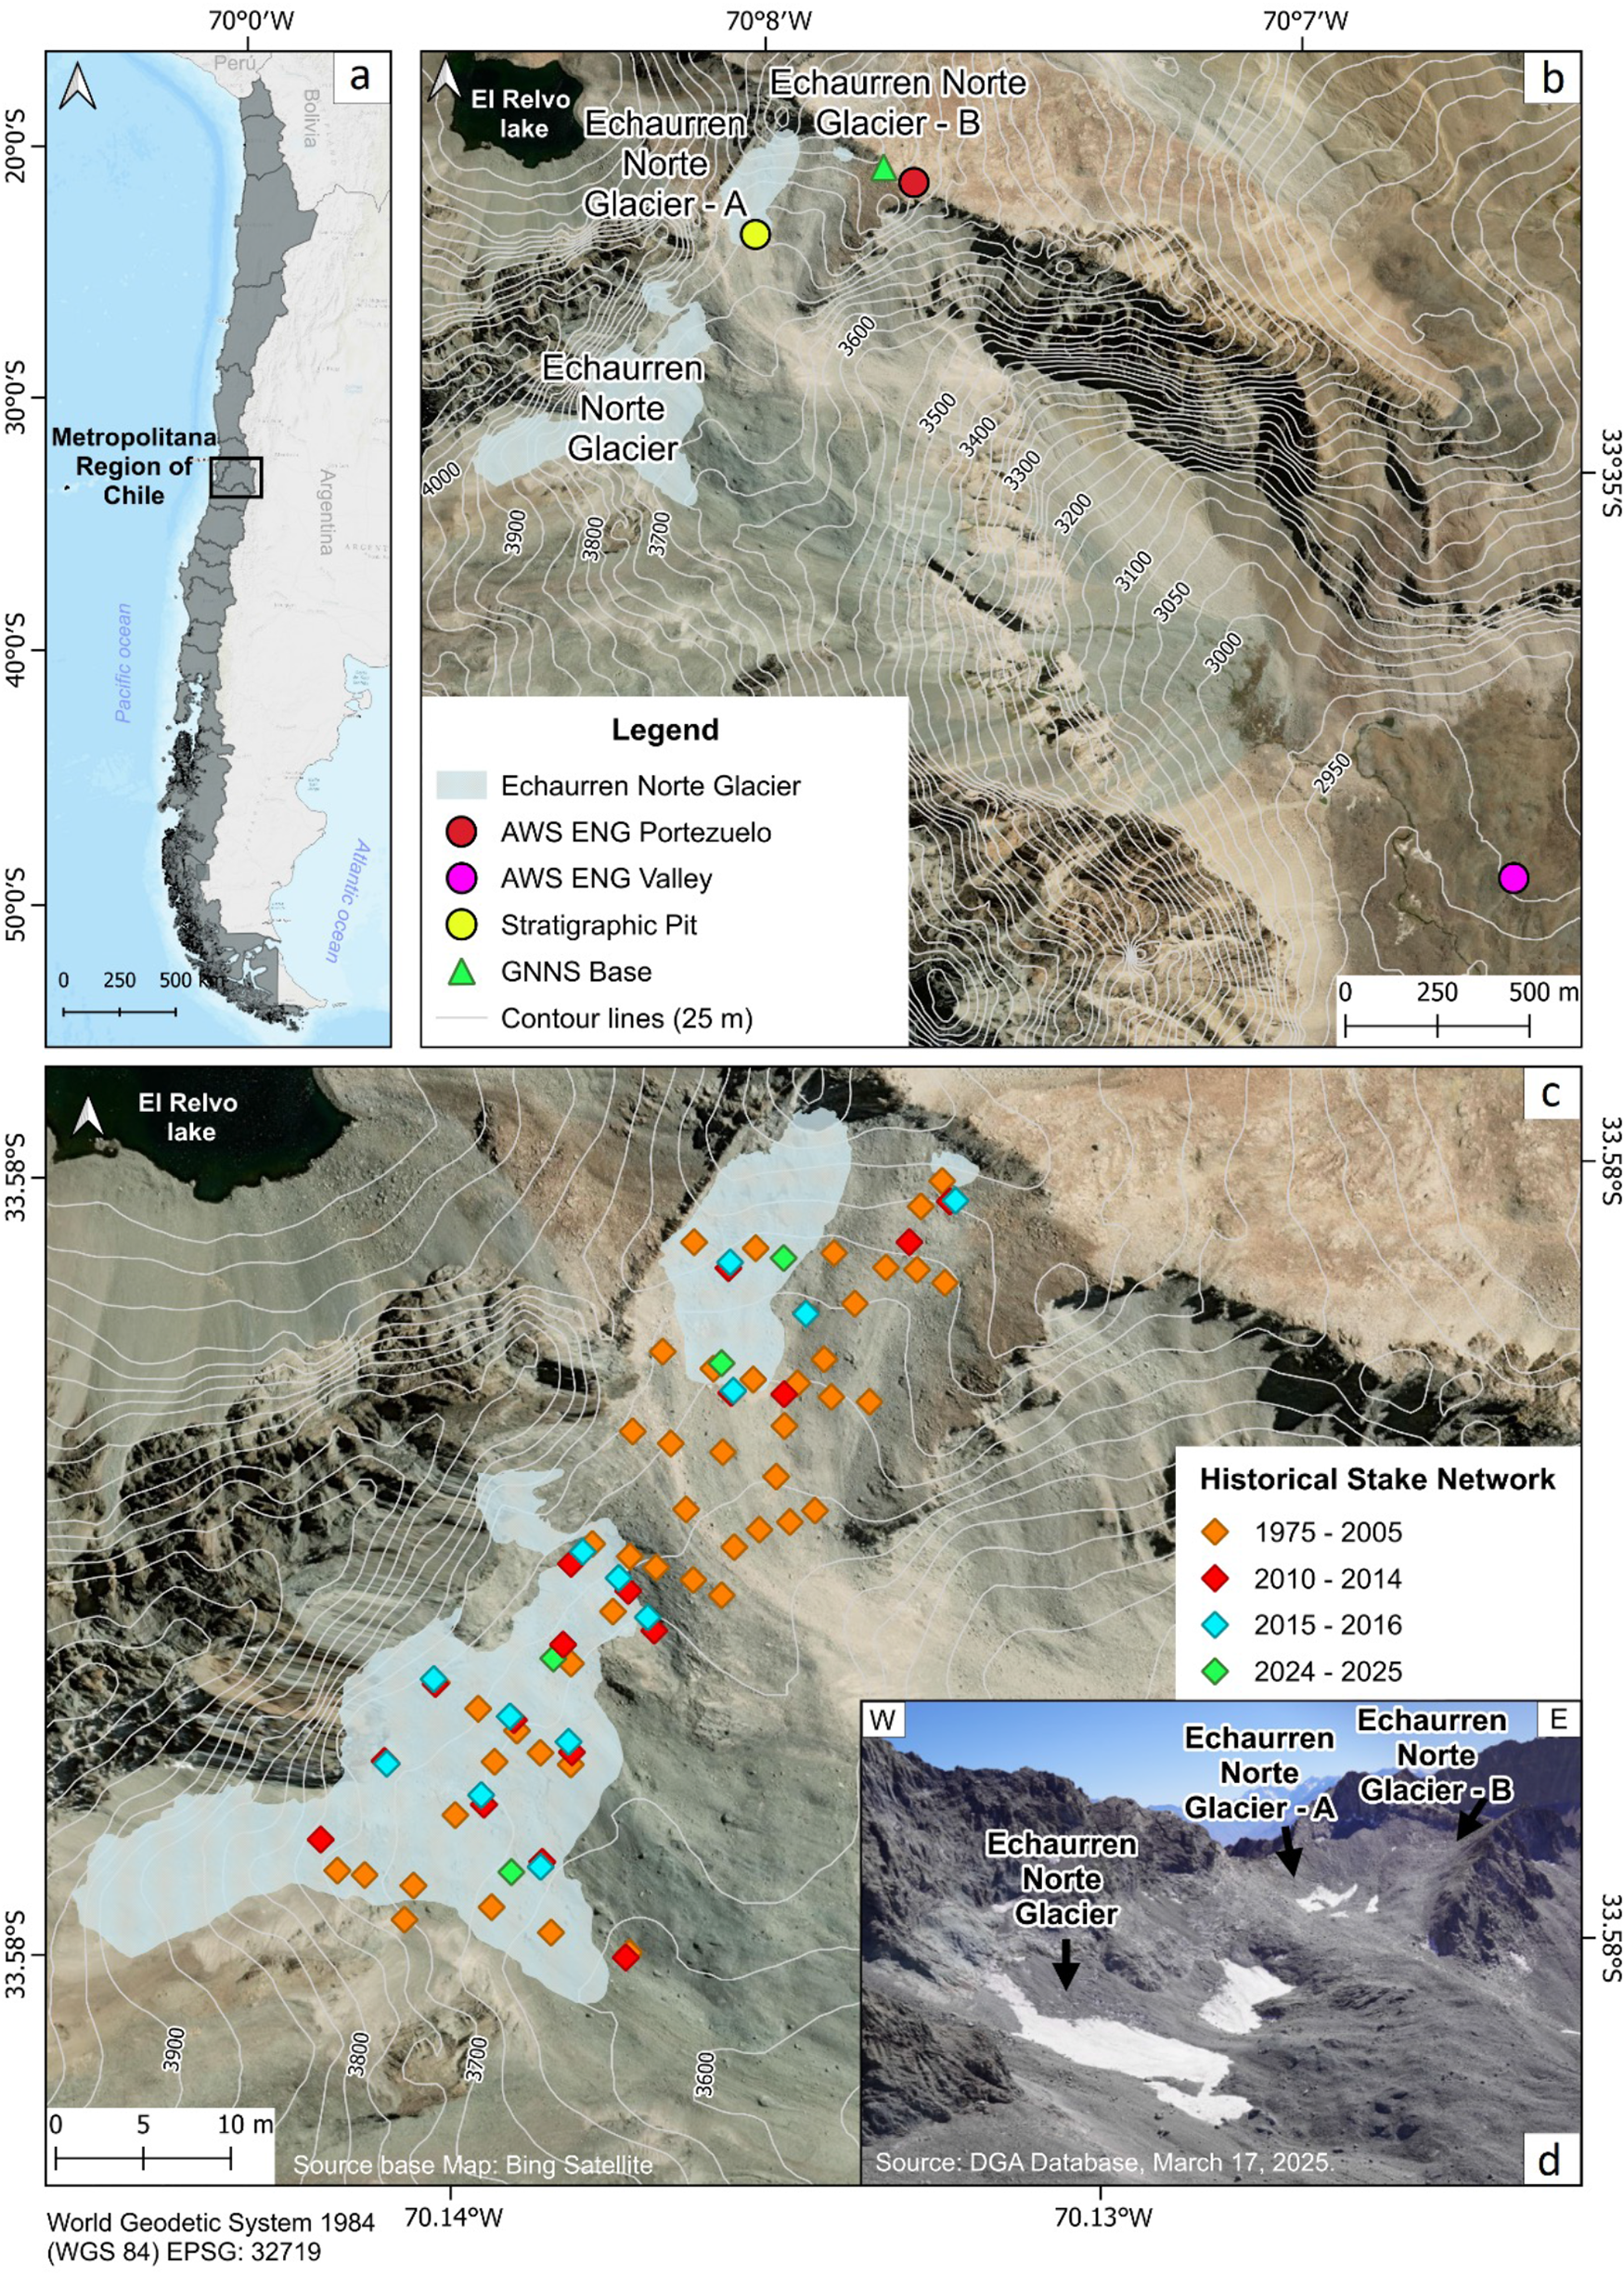
The Echaurren Norte Glacier is a small glacier located at 33°34′ S, 70°08′ W in the headwaters of the Yeso River catchment in the Metropolitan Region of Chile (Fig. 1). The glacier sits in an elevated terrace facing the south-east direction, within a 4.24 km2 catchment that drains into the ‘Laguna Negra’ mountain lake. The glacier is currently separated into three small subsections, namely Echaurren Norte, Echaurren Norte A and Echaurren Norte B, located within an elevation range between 3650 and 4038 m a.s.l., with a combined area of 0.18 km2 in 2023. The Echaurren Norte Glacier is located at the southern edge of the semi-arid portion of the Central Andes of Chile, just north of the precipitation transition zone at 34°S, where the annual precipitation regime has a step increase of almost 100%, as documented by Aravena and Luckman (Reference Aravena and Luckman2009) and González-Reyes and others (Reference González-Reyes2017). It has been long understood that El Niño Southern Oscillation (ENSO) exerts a strong influence over western South America precipitation; in Central Chile, warm ENSO3.4 phases (El Niño) have been historically associated with higher-than-average winter precipitation, whereas cold phases (La Niña) are usually linked to drought years (Aceituno, Reference Aceituno1992; Escobar and Aceituno, Reference Escobar and Aceituno1998; Montecinos and Aceituno, Reference Montecinos and Aceituno2003). Also, decadal-scale fluctuations have been shown to exert influence on the precipitation regime of southwestern South America. The Pacific Decadal Oscillation (PDO) index reflects this low-frequency variability, with cold (warm) phases being related with extended periods of drier (wetter) precipitation conditions in Central Chile (Garreaud, Reference Garreaud2009; Masiokas and others, Reference Masiokas, Villalba, Luckman and Mauget2010; Muñoz and others, Reference Muñoz2016; González-Reyes and others, Reference González-Reyes2017). Lliboutry (Reference Lliboutry1956, t2), perceived this interannual pattern of behaviour and coined the concept of ‘reservoir’ glaciers, or glaciers that are entirely in accumulation in some years and entirely in ablation the rest of the time. Between 2010/11 and 2023/24, the pattern of interannual variability of this region was disrupted by the so-called 2010 Chile megadrought (Garreaud and others, Reference Garreaud2017), which resulted in successive years with negative precipitation anomalies of approximately 30% or more relative to the climatological average, including two of the driest years on record (2019 and 2021, Garreaud and others, Reference Garreaud2025).
The Echaurren Norte Glacier, and its geographical setting, in the Central Andes of Chile. (a) National setting. (b) Echaurren Norte Glacier location within its catchment, location of the AWSs and elevation contours (source base map: Bing Satellite). (c) Location of the past and current stake networks and GNSS base. (d) North view of Echaurren Norte Glacier and its small subsections (Echaurren Norte, Echaurren Norte A and Echaurren Norte B glaciers). Source: DGA Database (17 March 2025); https://dga.mop.gob.cl/inventario-publico-de-glaciares-actualizacion-2022/.

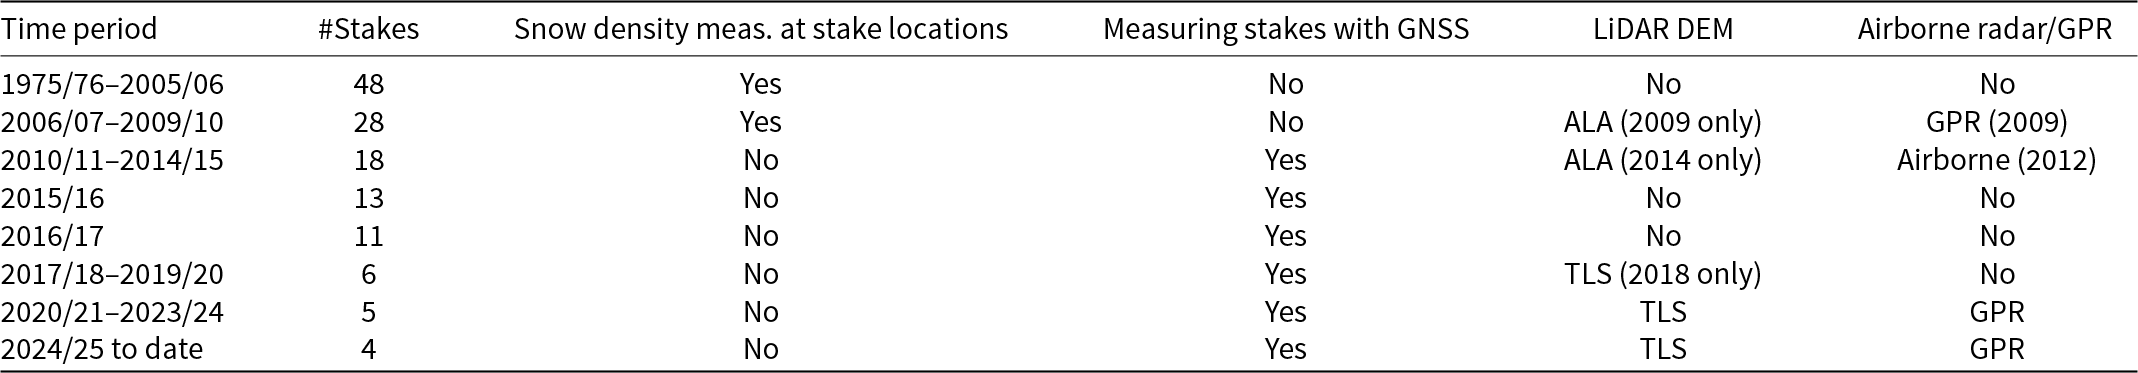
Throughout the 50 years of uninterrupted glacier monitoring activities, multiple survey techniques have been implemented at Echaurren Norte Glacier (Table 1), including novel methods at their time, such as Airborne Laser Altimetry (ALA) and Terrestrial Laser Scanning (TLS) (Barcaza and others, Reference Barcaza, Gómez, Fadic, McCracken and Tapia2025). During the first four decades of glacier monitoring, mass balance calculation at the Echaurren Norte Glacier was performed mostly following the glaciological approach, with tens of ablation stakes and the excavation of a stratigraphic pit. In recent years, measurements have been conducted by DGA with much fewer ablation stakes and applying the DEM differencing method by means of differential Global Navigation Satellite System (GNSS) and terrestrial LiDAR surveys. Snow accumulation measurements have continued at the snow pit (Fig. 2), adding, as well, snowpack characterization at the end of the winter season through Ground Penetrating Radar (GPR) measurements.
Sample photographs of the Echaurren Norte Glacier in the recent past. (a) Echaurren Norte Glacier in the early 1970s (photo courtesy of Alberto Peralta). (b) and (c) Historical snowpack characterisation measurements at Echaurren Norte Glacier. Source: Jorge Quinteros photo archive (courtesy of Philippe Boisier and Cedomir Marangunic). (d) Echaurren Norte Glacier surface and surrounding terrain at the end of the 2010 Ablation season (April 15th, 2010. Photo courtesy of Gonzalo Barcaza).

Summary of measurement techniques deployed at the Echaurren Norte Glacier since the beginning of its monitoring program.

The Echaurren Norte Glacier is one of two World Glacier Monitoring Service (WGMS) reference glaciers in the Southern Hemisphere, together with the Zongo Glacier in Bolivia (WGMS, Reference Zemp, Gärtner-Roer, Nussbaumer, Welty, Dussaillant and Bannwart2023). It provides the longest glaciological mass balance record and the most complete observational data series available for the region (Masiokas and others, Reference Masiokas2016; Farías-Barahona and others, Reference Farías-Barahona2019). These long-term in situ observations form part of the observational basis used to constrain and evaluate large-scale glacier mass-balance reconstructions at regional and hemispheric scales, including recent assessments for the Southern Hemisphere (Dussaillant and others, Reference Dussaillant2025). The mass balance time-series is publicly available through the WGMS database. However, its rapid retreat and evolution of surface properties motivate the need for assessing its possible vanishing in the near future, and its suitability for continued mass balance monitoring in the next decades.
This paper aims at i) documenting the Echaurren Norte Glacier area and debris-cover evolution along with its mass balance changes since the beginning of the systematic monitoring period, ii) highlighting how these changes are linked to climate variability and change and iii) suggesting directions for the next stages of glacier monitoring in Central Chile. Novel aspects include the addition of aerial photogrammetry data dating back to 1955, thus extending the available record of surface properties available for analysis, and the analysis of local air temperature data to characterize the possible impact of heat waves and recent warming. Our findings suggest an increased exposure of the Echaurren Norte Glacier to above-melting air temperature conditions in the last decade and indicate a likely irreversible process of debris deposition on its surface. This combination could render the Echaurren Norte Glacier less representative of the remaining glaciers in the region, as it transitions to a debris-covered glacier with different energy and mass balance dynamics. Since 2012, DGA has expanded its monitoring activities to include other glaciers in the region, including the Bello Glacier, in the headwaters of the Yeso River Basin (Barcaza and others, Reference Barcaza, Gómez, Fadic, McCracken and Tapia2025). Although in this work we focus exclusively on data collected at the Echaurren Norte Glacier, we hope to motivate the discussion regarding possible strategies for continued reference-level monitoring of glaciers in this region of the world.
Data and methods
Glacier extent and evolution of supraglacial debris cover
To analyse the debris–cover distribution of Echaurren Norte Glacier from 1955 to the present, we employed remote–sensing techniques. The dataset comprised: (i) 1955 Hycon aerial photographs provided by the Chilean Military Geographical Institute (IGM); (ii) 1996 aerial GEOTEC photographs from the Chilean Airforce Aerophotogrammetric Service (SAF); (iii) a 2009 LiDAR airborne orthophoto; (iv) high–resolution (3 m) PlanetScope satellite images from 2021 and 2023; the ALOS PalSAR digital elevation model (DEM; 12.5 m) provided by the Japan Aerospace Exploration Agency (JAXA); and vector data (shapefiles) provided by the DGA corresponding to the glacier area outlines for each analysed year. All optical images were selected to be optimal for interpretation, free of seasonal snow and cloud cover. Because of the reduced area of Echaurren Norte Glacier (0.18 km2), automated delineation techniques are inadequate. Consequently, manual delineation was performed in QGIS 3.2.2. Area uncertainty was then estimated as the weighted sum of the obtained glacier perimeter with one-pixel size of the different imagery used, following Farías-Barahona and others (Reference Farías-Barahona2019). Elevation data were employed for contour line generation, along with the assessment of the elevation metrics for the different Echaurren Norte Glacier outlines. Visible debris–covered zones were digitized on each image within the glacier outlines, distinguishing three categories: (1) clean ice, (2) partially debris–covered: a mixture of visible clean ice and debris cover and (3) fully debris–covered: no clean ice visible on the surface. The resulting assessment is limited to the supraglacial debris-cover extent only and does not incorporate debris–thickness information.
Mass balance
Annual mass balance at the Echaurren Norte Glacier has been recorded consistently by DGA personnel since the 1975/76 observation period through methods that have evolved over time with technological advances. Initially, the glaciological method was employed exclusively. A stratigraphic test-pit was (and continues to be) excavated at a single location, usually in the month of October (end-of-winter). Standard methods are used to obtain density and temperature profiles, which are then aggregated to derive a bulk end-of-winter snow density value for the year. Bulk snow density is then multiplied by an estimate of snow height over the glacier to obtain accumulation over the glacier surface. At the beginning of the monitoring program, snow height was estimated by interpolating point values obtained at the network of stakes. Between 1975/76 and 2005/06, 48 ablation stakes were inserted into the glacier, arranged in longitudinal and transversal transects. In later years, the shrinkage and fragmentation of the glacier led to a reduction in the number of ablation stakes, to 28 from 2006/07, then gradually decreasing the number (Table 1) to the current status since the 2024/25 period of only 4 ablation stakes inserted into the glacier surface.
The reduction and fragmentation of the glacier surface, together with the presence of an increasingly continuous supraglacial debris cover, have made it necessary to incorporate complementary methods to the traditional glaciological observations. Because ablation stake stability depends almost entirely on the seasonal snowpack—as steam drilling is unable to penetrate the debris layer—since the 2009/10 observation period, geodetic methods have been implemented for surface mass balance using terrestrial laser altimetry data, which have been obtained with a RIEGL VZ6000 model operating at a wavelength of 905 nm, which is ideal for minimizing absorption by ice and snow surfaces (Prokop, Reference Prokop2008). To obtain the annual mass balance (ba) for each hydrological year, scanning campaigns are conducted in October and April of each year. TLS observations are georeferenced to fixed terrain features with the aim of obtaining a standard deviation of ±0.005 m.
In recent years, a GPR survey has been conducted approximately on the same date as the snow test-pit (DGA, 2012). Snow and ice thickness measurements have been obtained using GPR with a GSSI (Geophysical Survey Systems Inc.) 350 HS antenna operating at a frequency of 350 MHz, paired with a GSSI SIR 4000 control, acquisition and data storage console. Each radar transect is georeferenced using GNSS positioning, allowing for precise spatial referencing of the radar traces and accurate interpretation of the snow–ice and ice–bedrock interfaces along each profile. For wave velocity values, a propagation speed of Vh = 0.168 m/ns is used for ice (Gades, Reference Gades1998), and Vn = 0.227 m/ns is applied for snow, derived from the average snow densities obtained from the stratigraphic test-pit (Kovacs and others, Reference Kovacs, Gow and Morey1995).
Consequently, winter accumulation is currently obtained by multiplying the bulk snow density obtained at the snow pit by the difference between the end-of-winter (October) and the end-of-summer (April) DEMs, verified against the measurements at the ablation stakes and the GPR survey. Annual balance is obtained by differencing two consecutive end-of-summer DEMs and multiplying this difference by a reference density of 900 kg/m3 (Cuffey and Paterson, Reference Cuffey and Paterson2010). Summer balance is, in turn, obtained by subtracting the winter balance from the annual estimate.
Local hydrometeorological data
In the year 2015, DGA installed an automatic weather station, or AWS (hereby referred to as ‘Portezuelo Echaurren’), which has measured meteorological data near the Echaurren Norte Glacier, on a fixed position located at an elevation of 3847 m a.s.l. (Table 2). On the other hand, in the year 2014, another AWS, ‘Valle Echaurren’, was installed downstream of the glacier at an elevation of 2968 m a.s.l. (Table 2). The observed parameters for both AWS include wind speed and wind direction, air temperature, relative humidity, atmospheric pressure, and incoming long and shortwave radiation. In the case of the Valle Echaurren station, instant precipitation has also been measured. Stations measure at 10 minute intervals, and parameter values are recorded hourly (DGA, 2018).
Installation date and location of meteorological stations in the glacier monitoring network. Coordinates in UTM Zone 19S (WGS 1984 datum).

Based on air temperature measurements from the ‘Valle Echaurren’ and ‘Portezuelo Echaurren’ AWS, a daily linear air temperature lapse rate was computed and applied to estimate air temperature at different elevations, thus allowing to estimate the 0°C isotherm elevation. The resulting isotherm time series was subsequently extended to the period before 2016 using a linear regression with daily air temperature from the El Yeso station (2475 m a.s.l.), which provides longer temporal coverage. This extended isotherm series was then used to estimate the temporal evolution of the number of days per year in which the average daily 0°C isotherm exceeded the maximum glacier elevation.
Results
Glacierized area and evolution of supraglacial debris cover
The multitemporal analysis of aerial and satellite imagery from 1955 to 2023 reveals a pronounced glacier shrinkage, accompanied by a sustained increase in supraglacial debris cover on the Echaurren Norte Glacier (Table 3). In 1955, the glacier had a continuous extent of 0.52 km2, with 58% of its surface lightly darkened by an incipient cover of supraglacial debris (Fig. 3a). In 1996, the glacier reached an area of 0.41 km2 and was divided into two fragments. The partially and fully debris-covered surface accounted for 99% of the total glacier area. By 2009, it had already fragmented into three distinct bodies, totalling 0.33 km2. That year, only 12% of the glacier surface remained with clean visible ice, while the remaining 88% showed varying degrees of debris cover, ranging from partially to fully covered debris zones (Fig. 3b).
Historical surface area and surface-cover evolution of Echaurren Norte Glacier from 1955 to 2023. (a) to (e) Glacier contour (upper row) and surface type interpretation (lower row) for years 1955 (a), 1996 (b), 2009 (c), 2021 (d) and 2023 (e), respectively. (f) Time series of total area relative to 1955 (black line) and debris cover relative to 2023 (red line).

Evolution of glacier surface at Echaurren Norte (1955–2023): covered (partially debris-covered and fully debris-covered), clean ice and total areas.

By 2021, the total glacier area had shrunk to 0.20 km2, with 93% of the surface covered by debris and only 7% remaining as clean ice. The imagery indicates extensive fragmentation and progressive burial of glacier ice, complicating the precise delineation of transitional zones (Fig. 3c). In 2023, the glacier reached a minimum extent of 0.18 km2, and, for the first time, it was observed to be entirely debris-covered, with no visible clean ice at its surface. This debris cover is generated by the weathering of easily eroded volcanic and sedimentary rocks, together with more resistant intrusive rocks that surround the glacier in the adjacent mountain slopes (Fig. 2). This pattern reflects an advanced transition towards a fully debris-covered glacier state, with its fragments now definitively separated (Fig. 3d) into three small glacierets, defined as small glaciers with a surface area below 0.25 km2 (Cogley and others, Reference Cogley2011). Lastly, we observe a negative correlation: as the glacier area decreases, the debris–covered proportion rises until it dominates the entire glacier system (Fig. 3e).
Winter balance
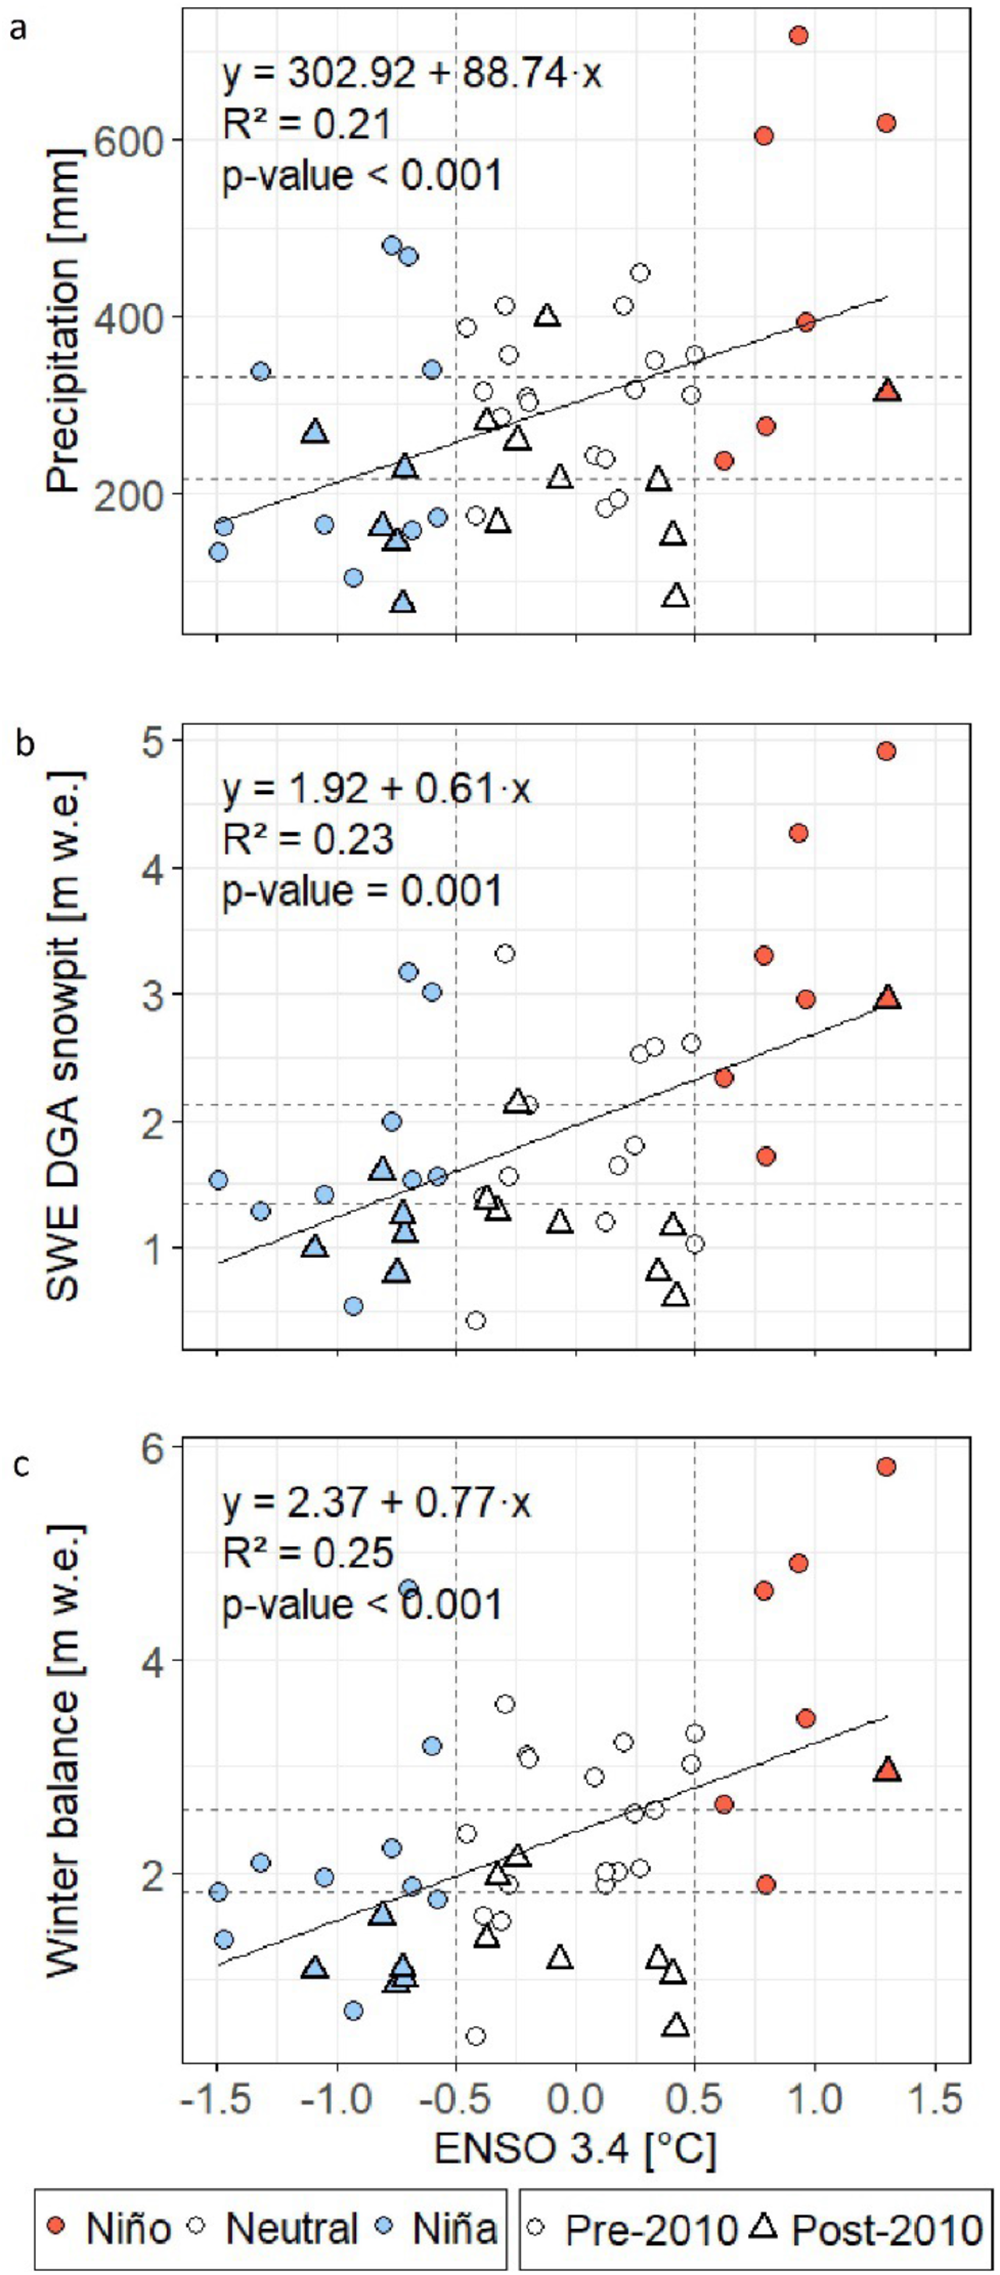
Winter balance at the Echaurren Norte Glacier is a combination of processes, including snowfall on the glacier surface, snow redistribution by wind and avalanching onto the glacier from surrounding areas, and mid-winter ablation. However, it is interesting to assess winter balance in terms of the dominant features of climate variability. We present the relationship between ENSO3.4, annual precipitation at the Quinta Normal meteorological station, snow accumulation at the DGA stratigraphic snow test-pit on the Echaurren Norte Glacier, and winter balance since 1982 as recorded by DGA and reported to WGMS (Fig. 4). Quinta Normal is operated by the Chilean Meteorological Directorate and is one of the stations with the longest record and best quality meteorological data in the country. We observe that since 1982, annual precipitation observed in Santiago has ranged between approximately 100 and 700 mm (Fig. 4). On the other hand, end-of-winter snow accumulation at the Echaurren snow pit ranged between approximately 500 and 5000 mm w.e. and winter balance was between 500 and 6000 mm w.e. This relationship only partially explains the observed variability in winter accumulation (Fig. 4). We see some wet years occurring during the cold phase (La Niña) and at least one drier-than-normal year occurring during a very strong ENSO warm phase (El Niño) (Fig. 4a). Snow accumulation at the snow test-pit follows a similar pattern, but variations with respect to Quinta Normal precipitation are apparent at the warmest and coldest ends of the ENSO spectrum. For winter balance, we plot the data for the full period of record and for the years up to 2010/11 (Fig. 4b and c), when the Chile megadrought started. Here we can appreciate how the megadrought i) results in several data points now appearing in the lower-left region of the scatterplot, and ii) disrupted the influence of ENSO over the winter mass balance, in the sense that years with average or below-average winter balance now also appear in the plot associated with very strong El Niño conditions.
Relationship between ENSO and accumulation-related variables. (a) Annual precipitation at the Quinta Normal weather station in Santiago. (b) Echaurren Norte Glacier stratigraphic snow pit (1982–2023). (c) Echaurren Norte Glacier winter mass balance for the full period of record.

Summer balance
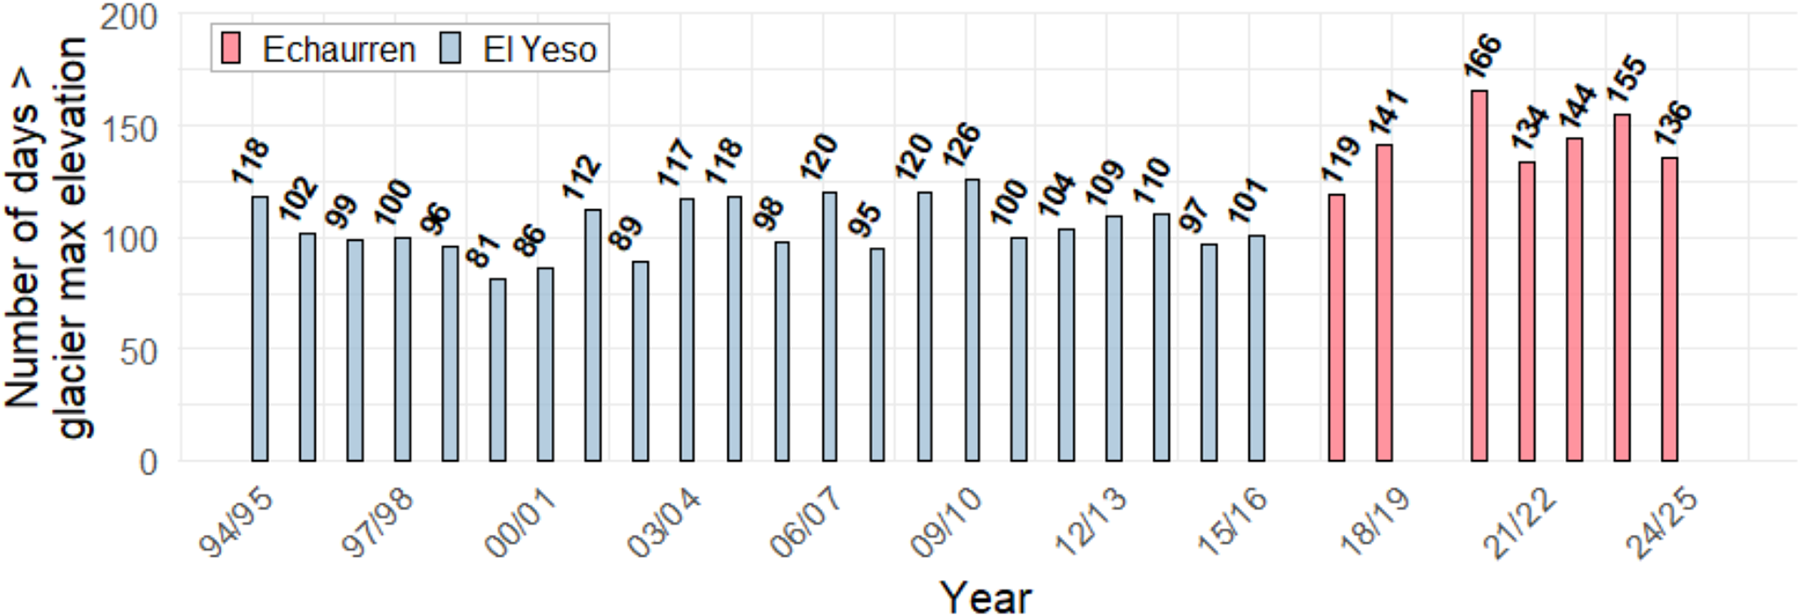
We present the number of days per year in which air temperatures are such that the daily average 0°C isotherm elevation is above the Echaurren Norte Glacier upper altitudinal limit (4038 m a.s.l.) (Fig. 5). As indicated before, the elevation of the 0°C isotherm since 2016 was obtained from temperature records at the Portezuelo Echaurren and Valle Echaurren AWS, while the values prior to 2016 were obtained through linear regression with the daily temperature recorded at El Yeso Embalse weather station (R2 of 0.95). The number of days per year in which the mean daily position of the 0°C isotherm is above the entire extent of the glacier fluctuated between 81 and 126 until the 2015/16 season, with most years displaying 110 days or less in that condition. On the other hand, since 2015, warming has been severe, and every year since then has had 119 or more days, with a maximum of 166 in 2020. This demonstrates the extreme conditions at which Echaurren Norte Glacier currently sits, allowing the snowmelt process to fully develop before the end of austral summer and thus avoiding the development of interannual snow accumulation on the glacier.
Number of days per year in which the daily 0°C isotherm elevation is above the Echaurren Norte Glacier upper elevation limit. Red columns represent values calculated based on temperature records at Portezuelo Echaurren and Valle Echaurren AWS; blue columns represent values obtained through linear regression with daily temperatures recorded at El Yeso Embalse weather station (DGA, R2 = 0.95).

The average summer mass balance value reported over the period-of-record is −2.99 m w.e., with a standard deviation of 0.80 m w.e. and extreme values of −1.70 and −5.00 m w.e. (Fig. 6c). Considering the DGA-adopted density value of 900 kg/m3 (consistent with the absence of snow and firn over the glacier surface in the end-of-summer measurements in the last several years), these values represent thinning rates between 1.89 and 5.56 m yr−1 for the entire glacier. Above-average (more negative summer balance) thinning rates can be observed throughout the period-of-record, but out of the 10 most negative summer mass balances, seven occurred after the 2000/01 season. The preponderance of summer ablation over winter accumulation since the onset of the 2010 Chile megadrought has resulted in the Echaurren Norte Glacier lacking a net accumulation area; this is, the ELA has been consistently located above the glacier highest elevation (4038 m a.s.l.) which is consistent with that reported by Carrasco and others (Reference Carrasco, Osorio and Casassa2008) and Ayala and others (Reference Ayala, Farías-Barahona, Huss, Pellicciotti, McPhee and Farinotti2020) for glaciers in the region.
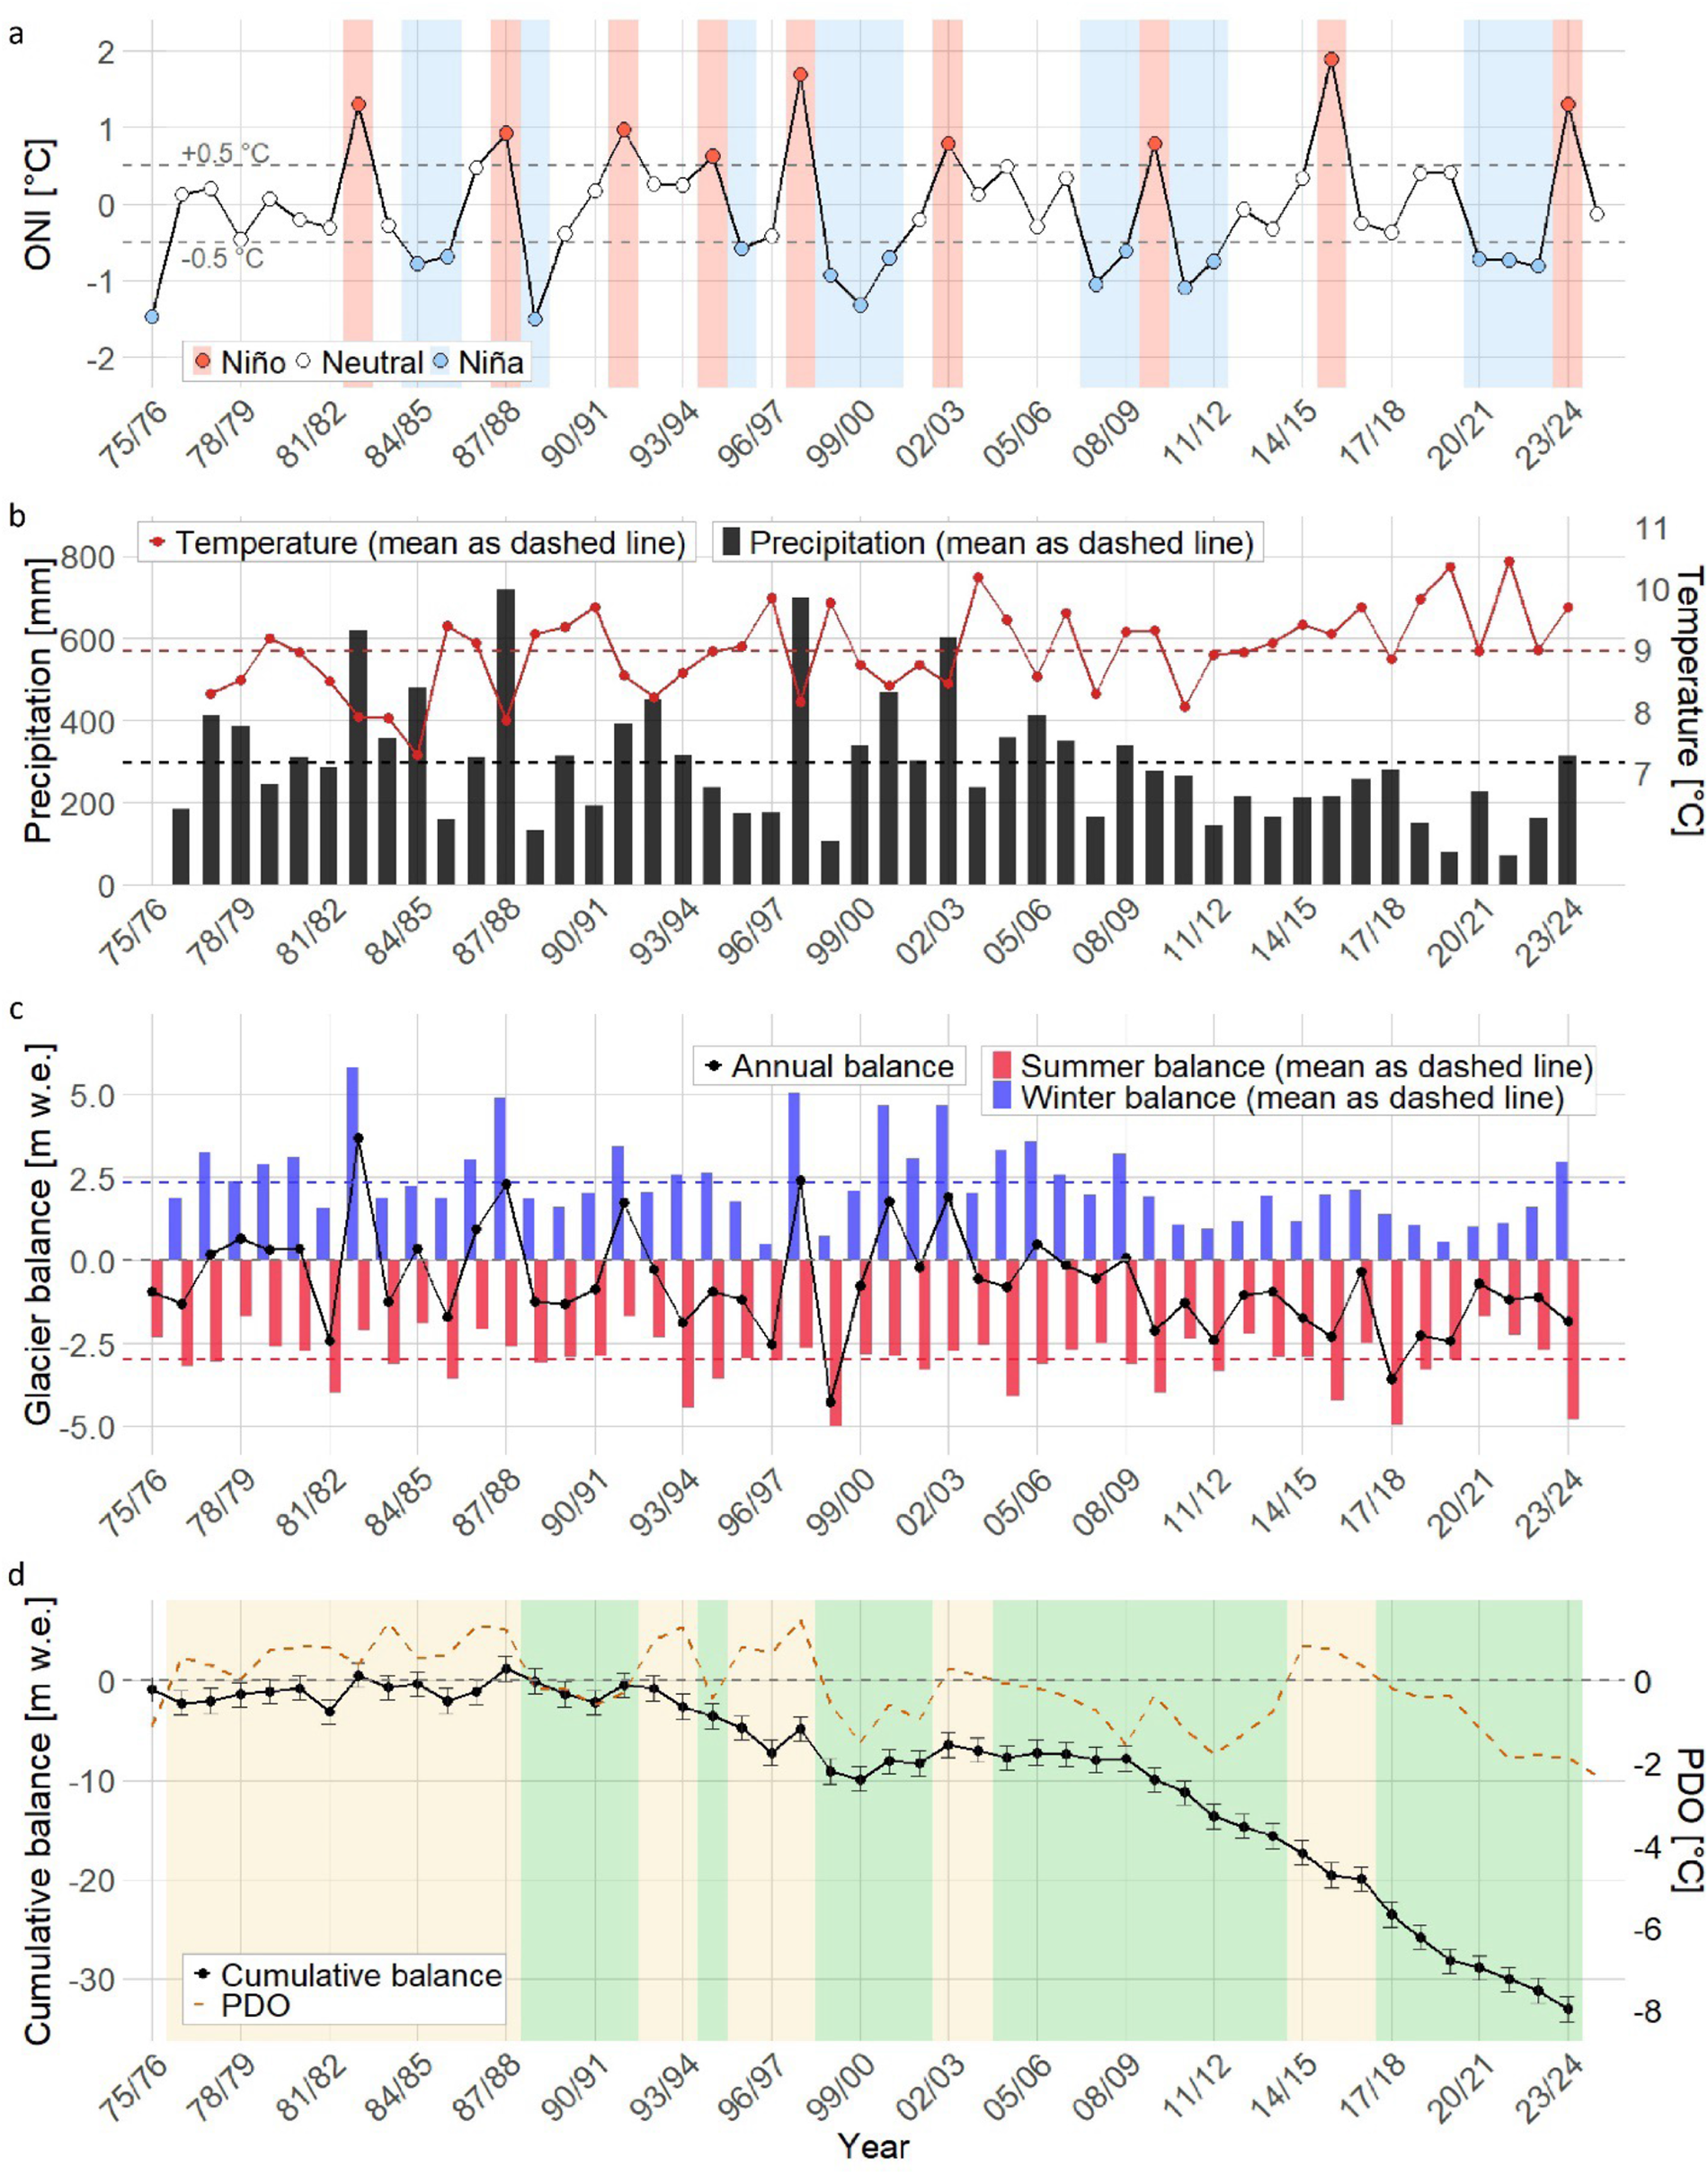
Time series of seasonal and annual mass balance and associated hydrometeorological variables (1975/76–2023/24). (a) Oceanic Niño Index (ONI). (b) Quinta Normal annual precipitation and Embalse El Yeso air temperature. (c) Winter, summer and annual balance, Echaurren Norte Glacier. (d) Cumulative mass balance and PDO.

Annual mass balance and climate connections
We analyse the interannual variability in Echaurren Norte Glacier mass balance components, together with ENSO and PDO climate patterns and regional hydrometeorological conditions (Fig. 6). The Oceanic Niño Index (ENSO3.4) is expressed as anomalies of sea surface temperatures (Fig. 6a) and oscillates between −1.5°C and +1.5°C in the analysis period. As shown in Escobar and others (Reference Escobar, Casassa and Pozo1995), the largest positive mass balance years historically corresponded to moderate or strong El Niño years (positive ENSO phase). This relationship to ENSO breaks down after 2010, when the Chile megadrought dominates interannual variability with approximately 30% annual precipitation deficits irrespective of ENSO. Air temperature recorded at the El Yeso weather station (Fig. 6b, red line), located 11.5 km to the southeast of the glacier at an elevation of 2495 m a.s.l., displays an upward trend. Mass balance records (Fig. 6c and d) systematically obtained over the past 50 years by DGA show that the Echaurren Norte Glacier exhibited slightly negative mass balance (close to equilibrium) during the near-first two decades (1975–92). Thereafter, a persistent negative trend has been observed since 2009 onwards, with an average annual mass balance of −0.24 m w.e. for the 1975–92 period versus −1.57 m w.e., on average, for the 2009–24 period. This trend may be associated to a combination of sustained atmospheric warming and a sharp decline in snow accumulation since 2009 due to the Chile megadrought (Garreaud and others, Reference Garreaud2017, Reference Garreaud, Boisier, Rondanelli, Montecinos, Sepúlveda and Veloso‐Aguila2020), in addition to the albedo effect due to enhanced debris cover, and positive feedbacks related to the glacier’s small size and surface elevation lowering, which are key factors influencing its sensitivity to climatic forcing and the acceleration of melting rates. Overall, the cumulative mass balance of Echaurren Norte Glacier for the whole analysed period, according to the reported data by DGA, is −33.06 m w.e. (Fig. 6d). We plot the cumulative mass balance together with the PDO, which has been shown to correlate well with the evolution of other glaciers in the region (Mejías and others, Reference Mejías, McPhee, Mahmoud, Farías-Barahona, Kinnard, MacDonell, Montserrat, Somos-Valenzuela and Fernandez2025). Although the steep negative slope of the cumulative mass balance after 2008 appears to concur with a predominantly cold phase of the PDO, the relative equilibrium between 1997 and 2007 also happened during a cold phase, whereas a prior multi-year decrease between 1990 and 1997 occurred during a warm phase of this index. No significant correlation was found, therefore, between these two variables. However, a slight change in slope can be inferred in 2015, whereby the negative trend in cumulative mass balance steepens. This is concurrent with the apparent increase in the number of very warm days (Fig. 5).
Discussion and conclusions
The Echaurren Norte Glacier constitutes a reference case of glacier degradation and transition in the Central Andes of Chile, exemplifying the full spectrum of contemporary glacier evolution processes: frontal retreat, surface thinning, progressive debris cover and fragmentation. A multitemporal analysis of the Echaurren Norte Glacier surface debris cover, based on remotely sensed imagery from 1955 to 2023, shows a clear trend towards progressively expanding debris–covered areas accompanied by an estimated 65% reduction in glacier area. Currently, there is no visible surface clean ice on the glacier, and the three portions of the glacier, all now fully debris-covered, comprise a surface area of 0.18 km2. The debris cover forms a heterogeneous supraglacial layer that now regulates the glacier’s mass balance at multiple scales. Fragmentation events in 2009 and 2021 split the glacier into three units, leaving it at its historical minimum extent. This division disrupted hydrological connectivity among the subunits and exposed additional ice to enhanced ablation. Consequently, the Echaurren Norte Glacier ceased to behave as an active mountain glacier and evolved into an ice body lacking a dominant accumulation zone, with virtually no ice flow and minimal basal sliding. These transformations indicate a shift from an active mountain glacier towards a debris-mantled glacieret, representing a clear trajectory of cryospheric degradation. Following this glacier shrinkage trend, it is very likely that the smaller fragments of the Echaurren Norte Glacier will vanish in the following decades, if not years. Such a trend has already been observed in small glaciers in the Central and Northern Andes of Chile for the 2018–23 period (Ugalde and others, Reference Ugalde2025).
The Echaurren Norte Glacier has been monitored since 1975 by DGA personnel, utilizing techniques that initially considered the glaciological method exclusively, but that in time evolved to incorporate geodetic methods. This evolution implies that seasonal and annual reported mass balance values may not be homogeneous, requiring data reanalysis to correct values potentially biased due to measurement protocol errors (Zemp and others Reference Zemp2013). A good example of such an analysis is that presented by Geibel and others (Reference Geibel, Huss, Kurzböck, Hodel, Bauder and Farinotti2022), who carried out a glacier mass balance reanalysis for Swiss glaciers over more than 100 years of record. A comprehensive reanalysis and homogenization of the historical mass balance data for Echaurren Norte Glacier—including stake records, LiDAR surveys and metadata integration—is currently being developed as a separate and more extensive research effort, which will be presented in a future publication. We believe, however, that the interannual variability and signals apparent in the analysed data are sufficiently strong to support the relevance of Echaurren Norte Glacier, which is coherent with other recent regional and global analyses (e.g., Medwedeff and Roe Reference Medwedeff and Roe2017; Braithwaite and Hughes Reference Braithwaite and Hughes2023).
It is highly pertinent to define new reference glaciers for the WGMS in the Central Andes of Chile, meeting the required morphological, hydrological and logistical criteria, as was the case with Echaurren Norte Glacier five decades ago. Such efforts have already been implemented by DGA with the initiation of a mass balance monitoring program at the neighbouring Bello glacier (DGA, 2018). The Bello Glacier is located in the headwaters of the Yeso River, within the same hydrological catchment as the Echaurren Norte Glacier, 20 km to the ENE of the latter. Bello Glacier faces the South direction, and its elevation ranges from 3950 to 4850 m a.s.l., approximately. Its surface area is approximately 3.84 km2 (DGA, 2024), and it is mostly free of debris, making it a suitable candidate. Since 2014, DGA has monitored the Bello glacier with a combination of glaciological and DEM-differencing methods. Although the Bello Glacier does not yet meet the requirements for reference glaciers issued by WGMS (30 years of continuous glaciological monitoring), the rapid decline and change in surface properties of the Echaurren Norte Glacier suggest that in-depth analysis of the concurrent data should be undertaken to promote a transition from the Echaurren to the Bello as the reference glacier for this region.
Although the current negative mass–balance trend, fragmentation and debris cover suggest that the Echaurren Norte Glacier could ultimately disappear, the glacier is presently in a stabilization phase, assuming the existence of an ice-core throughout the glacier, in which a thicker debris mantle confers thermal stability: its thickness governs melt rates and thus preserves the underlying ice (Whalley and Azizi, Reference Whalley and Azizi2003; Janke and others, Reference Janke, Bellisario and Ferrando2015). Debris–covered glaciers continue to supply meltwater—albeit at lower, slower discharges—and, despite their reduced ice volume, act as reservoirs that release water with a delay during especially dry summers. Hence, their relevance lies less in volumetric contribution, but in the persistence and long–term regulation they provide in the face of prolonged droughts and the sustained rise of the 0°C isotherm elevation (Carrasco and others, Reference Carrasco, Osorio and Casassa2008). While in its present form the Echaurren Norte Glacier may not possess all the properties that define a proper glacier according to the international nomenclature, we believe that it may represent an important case study of glacier transition in Mediterranean climates; it is therefore relevant to maintain its monitoring, with the aim to properly assess and understand the evolution of its surface properties and hydrological functioning.
Acknowledgements
We extend our deepest gratitude to the community of scientists and collaborators who, with unwavering dedication, have devoted their strength, experience, and knowledge to the study of Echaurren Norte Glacier. Under the leadership of the Hydrology Division of the Chilean General Water Directorate, their collective work has contributed an invaluable source of knowledge about mountain glaciers in the Southern Hemisphere. We especially acknowledge the invaluable contributions of Hernaldo Leyton, Fernando Escobar, Fernando Vidal (RIP), Javier Narbona, Jorge Quinteros (RIP), Antonio Vergara, Paulino Aguilera (RIP), Gustavo Freixas (RIP), Raúl Anabalón (RIP), and Alberto Peralta. Their long-standing commitment has built a robust legacy of data and insight that underpins this study and serves as a cornerstone for Andean glaciology. We are grateful to Dr. Gonzalo Barcaza for his insightful comments on our work and to three anonymous reviewers for their constructive criticism of previous versions of this manuscript. James McPhee and Noemí Villagra acknowledge partial support from projects FONDECYT 1251561 ANID and AFB230001 ANID. Felipe Ugalde acknowledges funding through Doctoral Scholarship EPEC 2026.


 Open access