

Data on the contribution of different energy sources to growth performance, and protein and fat deposition, are limited. Essential information is missing on the mechanism by which various energy sources affect fat deposition and its distribution within the body. A mechanistic growth model for pigs(Reference Halas, Dijkstra and Babinszky1, Reference Halas, Dijkstra and Babinszky2) clearly indicated the higher potential of dietary fat for body fat deposition compared with carbohydrates. Equal intakes of energy from glucose, long-chain fatty acids and SCFA may result in differences in fat deposition rates(3, Reference Black, Moughan, Verstegen and Visser-Reyneveld4). It is, however, unknown to what extent distribution of body fat over tissues is affected by the type of nutrient absorbed. Unlike the effect of energy source on ATP-generating potential, these effects should be studied at feeding levels above maintenance energy, and preferably under protein-limiting conditions. Also, in many studies(Reference Mersmann, Pond and Yen5–Reference Rijnen8), increased intake of one energy source is balanced by decreasing the content of other energy sources, maintaining isoenergetic intakes, but nonetheless complicating the interpretation of causal relationships. It has been reported that the energetic efficiency of digestible energy (DE) intake for energy retention depends on energy supply(Reference Halas and Babinszky9). Therefore, it is important to distinguish the effect of feeding level from the effects of energy sources.
The aim of the present trial was to study if the efficiency of extra energy intake from fermentable NSP (fNSP), digestible starch (dStarch) and digestible unsaturated fat used for fat deposition is different at different levels of intake. A further aim was to determine the location of fat deposition resulting from extra energy intake from fNSP, dStarch and digestible fat (dFat).
Experimental methods
Animals, housing and experimental procedure
A total of fifty-eight pigs (twenty-nine gilts and twenty-nine barrows), of KA-HYB hybrid, weighing 48 (sd 4) kg were used. The Hungarian hybrid, produced by KA-HYB Co. (Kaposvár, Hungary), has an average net daily gain of 520 g/d (from birth to 110 kg), feed conversion of 2·8 kg/kg, 30 % body fat and valuable meat parts of 47·5 % (according to Kovach(Reference Kovach10)). Before the experiment the pigs were fed ad libitum a diet with nutrient contents in accordance with National Research Council(11) recommendations. Ten of these pigs (five gilts and five barrows) were selected based on an average representative body weight and slaughtered at the beginning of the trial as an initial reference group for chemical body composition analysis. The remaining forty-eight pigs were allocated to one of eight experimental treatments with six pigs per treatment (three gilts and three barrows). All pigs were slaughtered at 106 (sd 3) kg live weight. Pigs were kept in individual pens during the experiment, and live weight was recorded individually once per week. The daily feed allowance was adjusted weekly after weighing the animals. Pigs received their feed twice daily and had free access to water. Feed refusals were collected and weighed daily.
The experiment was approved by the Ethical Committee of Kaposvár University, Hungary.
Treatments and experimental diets
The experimental treatments were arranged by supplementing three different additional energy sources, i.e. additional fNSP, additional dStarch and additional dFat to a control diet. This control diet was fed at either a low (2 × energy for maintenance) or high (3 × energy for maintenance) level of intake. The DE requirements for maintenance were assumed to be 475 kJ/kg0·75 per d(3). Within each energy level, daily intakes of digestible protein, ileal digestible lysine and other amino acids, vitamins and minerals were similar. The treatments (Table 1) were achieved by isoenergetic addition of each of the three energy sources (0·2 MJ DE/kg0·75 per d) to a control diet and resulted in 2·4 and 3·4 times DE requirement for maintenance at low and high energy intake levels, respectively. Additions of energy sources were 11 g fNSP/kg0·75 per d (additional fNSP), 11 g dStarch/kg0·75 per d (additional dStarch) or 5 g dFat/kg0·75 per d (additional dFat). Total tract digestibility of nutrients was measured in a separate study with identical treatments (six pigs per treatment; 88 (sd 3) kg live weight; quantitative faecal collections). Results of this study are not reported here, but are used in the calculation of digestible nutrient intakes (V Halas, L Babinszky, J Dijkstra, MWA Verstegen and WJJ Gerrits, unpublished results). The objectives of the present experiment required it to be conducted under protein-limiting conditions. Due to the lysine-controlled protein deposition, the extra energy derived from the additional energy source would be expected to be deposited as body fat, and so it was decided to maintain a lysine:DE ratio in both control groups of 0·44 g/MJ DE from 48 to 80 kg live weight. To ensure maintenance of protein limitation throughout the entire weight range, the lysine:DE ratio in the control diets was lowered to 0·36 g/MJ DE in the weight range of 80 to 106 kg, which is limiting according to the National Research Council(11) and the Dutch Central Veevoederbureau (CVB)(12). By supplementation of energy sources to the control diet, protein limitation was ensured in all treatments. The feeding trial was separated into phases 1 and 2, from 48 to 80 kg and from 80 to 106 kg body weight, respectively. The digestible crude protein:DE ratio in the control groups was 9·3 and 8·5 g/MJ, in the low feeding level groups was 7·8 and 7·1 g/MJ and in the high feeding level groups was 8·0 and 7·5 g/MJ in phases 1 and 2, respectively. The composition and the nutrient content of the experimental diets fed in phases 1 and 2 are presented in Tables 2 and 3, respectively.
Experimental design with planned nutrient intake in the experiment (g/kg0·75 per d)

* Energy additions were in addition to both control treatments, yielding eight dietary treatments in total.
Ingredient composition of experimental diets based on equal nutrient intake and the analysed nutrient content (in g, relative to 1000 g of the control diet) in the 48–80 kg body weight range

fNSP, fermentable NSP; dStarch, digestible starch; dFat, digestible fat.
* Premix contains (per kg): vitamin A, 1 204 000 IU; vitamin D3, 200 000 IU; vitamin E, 2408 mg; thiamine, 199 mg; riboflavin, 504 mg; niacin, 4005 mg; Ca-panthothenic acid, 1988 mg; piridoxin, 196 mg; vitamin B12, 3·92 mg; choline, 22 904 mg; Fe, 17 863 mg; Zn, 21 600 mg; Mn, 17 280 mg; Cu, 6500 mg; Co, 86 mg; I, 288 mg; Se, 43 mg.
† Intake of basal diet was maintained identical across treatments within feeding level. Additional ingredients were provided additional to the basal diet. Hence, the total in this row reflects relative differences in total feed intake between treatments within a feeding level.
‡ Calculated by subtracting ash, protein, fat, starch and sugars from DM.
§ National Research Council calculated value(11).
Ingredient composition of experimental diets based on equal nutrient intake and their analysed nutrient content (in g, relative to 1000 g of the control diet) in the 80–106 kg body weight range

fNSP, fermentable NSP; dStarch, digestible starch; dFat, digestible fat.
* Premix contains (per kg): vitamin A, 1 204 000 IU; vitamin D3, 200 000 IU; vitamin E, 2408 mg; thiamine, 199 mg; riboflavin, 504 mg; niacin, 4005 mg; Ca-panthothenic acid, 1988 mg; piridoxin, 196 mg; vitamin B12, 3·92 mg; choline, 22 904 mg; Fe, 17 863 mg; Zn, 21 600 mg; Mn, 17 280 mg; Cu, 6500 mg; Co, 86 mg; I, 288 mg; Se, 43 mg.
† Intake of basal diet was maintained identical across treatments within feeding level. Additional ingredients were provided as additional to the basal diet. Hence, the total in this row reflects relative differences in total feed intake between treatments within a feeding level.
‡ Calculated by subtracting ash, protein, fat, starch and sugars from DM.
§ National Research Council calculated value(11).
The experimental diets were based on cereals and soyabean meal as the main ingredients. Sugarbeet pulp, maize starch and soya oil were used to provide the energy additions. Sugarbeet pulp contains some crude protein, fat and sugar, therefore addition of fNSP was achieved by formulating a basal diet that was 95·75 and 95·40 % of the control diet for both weight ranges, respectively. The control diet was formulated as the basal diet supplemented with soya oil, maize starch and casein as well as addional Ca and P sources. Diets in other treatments were formulated by the addition of either fNSP, dStarch or dFat originating from sugarbeet pulp, maize starch and soya oil, respectively, on top of the control diet. Deviations of the sum of ingredients from 1000 g/kg therefore reflect a difference in feed intake. In order to achieve identical energy additions between feeding levels, the additions of sugarbeet pulp, maize starch and soya oil were adapted for diets used at the high feeding level.
Slaughter procedure and carcass dissection
Ten pigs were slaughtered at 48 (sd 4) kg and the remaining pigs at 106 (sd 3) kg live weight; the animals were fasted for 24 h before slaughter. After electrical stunning, pigs were exsanguinated and blood was collected quantitatively. The internal organs and the gastrointestinal tract were removed with the abdominal fat and the carcass was split longitudinally. The tail remained on the left half of the carcass. Subcutaneous fat and skin together were removed from the carcass. The carcass halves, blood, internal organs, full and empty gastrointestinal tract (stomach, intestines, gall bladder) and abdominal fat and subcutaneous fat were weighed. The following body fractions were separated: (1) head, feet and tail (offal); (2) subcutaneous fat and skin (hide); (3) intestinal organs, empty gastrointestinal tract, abdominal fat and blood (organs); (4) rest of the carcass including lean and bones (lean). Each body fraction was weighed with an accuracy of 1 g and stored in plastic bags at − 18°C until chemical analysis. Chemical body analysis was carried out by methods of Kotarbinska(Reference Kotarbinska13). All four body fractions were autoclaved at 134°C and 0·2 MPa. Autoclaving took 4·5 h for lean and offal, and 3 h for hide and organs, respectively. The fractions were ground and homogenised. The homogenised fractions were weighed and sampled and were sent to the laboratory for DM, N, lipid and ash determination.
Body composition at the start of the experiment was estimated using the initial slaughter group, slaughtered at 48 kg body weight and analysed following the procedures described below. The body composition of the initial slaughter group was expressed per kg body weight and multiplied by the measured body weight of the experimental animals at the start of the experiment to obtain initial mass of wet tissues and chemical components.
Chemical analysis
DM, protein (Kjeldahl-N × 6·25), fat and ash contents of the diets and of each body fraction were determined according to Association of Official Analytical Chemists (AOAC) procedures(14). The starch and reducing sugar contents of the diets were determined according to AOAC(15). The total content of fNSP in the diet was calculated from DM by subtraction of crude ash, protein, fat, starch and reducing sugars. DE intakes were calculated from the intake of digestible protein, dFat, dStarch and fNSP and their energy contents (24·2, 39·4, 17·0 and 17·0 MJ/kg, respectively)(12).
Statistical analysis
Consistent with the objective of the experiment, all effects were expressed relative to the control treatments. Therefore, for all dependent variables, within both energy intake levels, the treatment mean of the control group was subtracted from the observations of the energy sources and sexes and these marginal differences were subsequently treated as dependent variables. The number of pigs per treatment (n) was defined according to the formula of ![]() (Morris(Reference Morris and Morris16)), where t is Student's t value for P = 0·05 and degrees of freedom of 30, s2 is the error variance assumed to be 15 g/d (according to Bikker et al. (Reference Bikker, Verstegen and Campbell17)), and d is the size of the difference assumed to be a minimum of 20 g/d (difference in marginal fat depositions from fNSP, dStarch and digestible unsaturated fat). According to our calculation, five animals per treatment would have been enough to show significant difference.
(Morris(Reference Morris and Morris16)), where t is Student's t value for P = 0·05 and degrees of freedom of 30, s2 is the error variance assumed to be 15 g/d (according to Bikker et al. (Reference Bikker, Verstegen and Campbell17)), and d is the size of the difference assumed to be a minimum of 20 g/d (difference in marginal fat depositions from fNSP, dStarch and digestible unsaturated fat). According to our calculation, five animals per treatment would have been enough to show significant difference.
The effect of dietary energy source, feeding level and sex on the deposition of chemical components in the body and body parts was tested using SAS general linear model (GLM) procedures (SAS Institute, Inc., Cary, NC, USA)(18) with the following general model:
where Yijk is the dependent variable, μ is the mean of the treatment, ESi is the energy source where i = 1, 2, 3 (additional fNSP, additional dStarch, additional dFat), ELj is the feeding level where j = 1, 2 (low feeding level, high feeding level), Sexk is sex where k = 1, 2 (barrow, gilt) and eijk is the error.
The results of all eight treatments were used for estimating effects on body fat distribution. The effect of dietary energy source and feeding level on the distribution of percentage body fat was tested using SAS GLM procedures(18) with the following general model:
where Yijk is the dependent variable, μ is the mean of the treatment, ELi is the feeding level where j = 1, 2 (low feeding level, high feeding level), Dj is the diet where j = 1, 2, 3, 4 (control, additional fNSP, additional dStarch, additional dFat) and eijk is the error.
Pair-wise comparisons were made when energy sources differed significantly in the ANOVA, described above, after adjustments according to Tukey(18).
Results
In total, fifty-eight pigs were used in the present experiment. Ten were used to determine initial body composition, and forty-eight were allocated to one of the eight experimental treatments (control and three energy sources at each of two feeding levels). As described in the Statistics section, all results were expressed relative to the two control groups (one at each feeding level). Consequently, a maximum of thirty-six observations were available for the statistical analysis (Table 4). Due to health problems, two pigs had to be excluded from the experiment. Furthermore, some samples of whole-body analyses had to be discarded due to technical problems. Of the missing observations, five were in the control treatments and four in the additional energy treatments. Consequently, thirty-two observations were used in the statistical analysis (Table 4).
Expected and actual number of data per treatment (excluding the initial slaughter group)

fNSP, fermentable NSP; dStarch, digestible starch; dFat, digestible fat.
The treatment means for feed intake and for digestible nutrient intakes during the fattening study are presented in Table 5. Due to the experimental design the difference in energy intake was approximately 10 MJ/d between the low and high feeding levels. This extra energy derived from a higher amount of daily feed allowance, and resulted in 70–90 g extra protein intake at the high feeding level. In general the daily feed and nutrient intakes in different treatments were consistent with the pre-planned experimental contrasts. Within each feed intake level, the mean results of the control treatment were subtracted from the treatment before statistical analysis. Therefore, the effect of feeding level as represented in Tables 6–8 is the effect of a similar energy addition (0·4 × DE requirements for maintenance) averaged among energy sources in addition to the low v. the high feeding level.
Realised feed and nutrient intake during the experiment (g/d)*
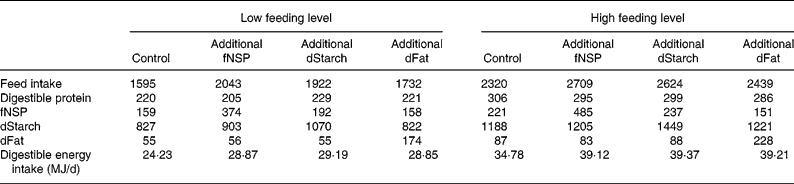
fNSP, fermentable NSP; dStarch, digestible starch; dFat, digestible fat.
* Total tract digestibility of nutrients was measured in a separate study with identical treatments (V Halas, L Babinszky, J Dijkstra, MWA Verstegen and WJJ Gerrits, unpublished results).
Effect of feeding level (FL), energy source (ES) and sex on the change in general performance

fNSP, fermentable NSP; dStarch, digestible starch; dFat, digestible fat; RMSE, root mean square error.
* Within each feed intake level the mean from the control treatment was subtracted from the observations before the statistical analysis (see Statistical analysis section).
† FL represents the effect of a similar energy addition (averaged over energy sources) added to the low v. the high FL.
‡ ES represents the effect of the source of the energy addition, i.e. fNSP, dStarch or dFat.
Effect of feeding level (FL), energy source (ES) and sex on marginal deposition rate of wet tissues in the four body fractions (g/d)

fNSP, fermentable NSP; dStarch, digestible starch; dFat, digestible fat; RMSE, root mean square error.
* Within each feed intake level the mean from the control treatment was subtracted from the observations before the statistical analysis (see Statistical analysis section).
† FL represents the effect of a similar energy addition (averaged over energy sources) added to the low v. the high FL.
‡ ES represents the effect of the source of the energy addition, i.e. fNSP, dStarch or dFat.
Effect of feeding level (FL), energy source (ES) and sex on marginal deposition rates of chemical components in the four body fractions (g/d)

fNSP, fermentable NSP; dStarch, digestible starch; dFat, digestible fat; RMSE, root mean square error.
a,b Mean values within a row with unlike superscript letters were significantly different (P < 0·05).
* Within each feed intake level the mean from the control treatment was subtracted from the observations before the statistical analysis (see Statistical analysis section).
† FL represents the effect of a similar energy addition (averaged over energy sources) added to the low v. the high FL.
‡ ES represents the effect of the source of the energy addition, i.e. fNSP, dStarch or dFat.
Growth performance
The effects of energy sources, feeding level and sex on general performance parameters (marginal data per treatment within feeding level) are presented in Table 6. The rate of body-weight gain of the control pigs at the high feeding level was higher than at the low feeding level. At the low feeding level, the energy addition resulted in significantly higher extra body-weight gain (85 g/d) than at the high feeding level (21 g/d). A similar tendency was found for extra empty body-weight gain (64 and 19 g/d in the low and high feeding levels, respectively; P = 0·06). Neither extra body-weight gain nor empty body-weight gain was affected by energy source. There were no differences in extra body-weight gain and extra empty body-weight gain between barrows and gilts (P>0·10). Feed conversion was similar in pigs with different dietary additional energy sources and also similar at different feeding levels. There was no sex effect on feed conversion (P>0·10). According to the data on body gain, the feeding level affected the length of the fattening period (P < 0·01), while the source of extra energy, and the sex, did not affect the duration of the fattening study (P>0·05). The time taken to slaughter was shortened by 27 d and 1 d by feeding extra energy at the low and high feeding levels, respectively.
Deposition of body components
The effect of energy sources, feeding level and sex on deposition rates of wet tissues, expressed as marginal values per treatments above control within feeding level, is presented in Table 7. Data indicate that extra lean tissue gain was not affected by energy source (P>0·10). The additional dietary energy increased lean tissue gain at the low feeding level, but decreased it at the high feeding level (P < 0·001). Deposition of wet tissue mass in organs was higher when pigs received the additional energy at the high feeding level (P < 0·001). The energy source has some impact on the marginal gain of organs; at the high feeding level added fNSP increased the organ fraction's weight gain by a higher extent than added dStarch and unsaturated fat (P = 0·12). The extra gain of hide and subcutaneous fat from added energy was affected by sex (P < 0·05), with barrows depositing more hide and subcutaneous fat than gilts. The extra gain in the offal fraction was higher at the high feeding level (P < 0·05), but was not affected by energy source or by sex.
Table 8 shows the effect of energy sources, feeding level and sex on deposition rates of protein, fat, water and ash in the four body parts. The marginal deposition rates of body protein and related components, such as water and ash, were affected by feeding level (P < 0·05). The additional energy intake increased body protein deposition rates at the low feeding level, but decreased it at the high feeding level. Gilts deposited more protein in their body than barrows (P < 0·05). Consistent with our expectations, added energy intake increased the fat deposition rate relative to the control groups. Most of the extra fat deposition occurred in hide and subcutaneous fat tissue (approximately 50 %). The increase in body fat deposition was, however, not affected by feeding level, source of energy, or sex (P < 0·05). As in the whole body, the deposition rate of protein, water and ash in the lean fraction was increased by additional energy at the low feeding level, but decreased by additional energy at the high feeding level. Similar to body protein, lean tissue protein was also affected by sex. The extra fat deposition in lean from additional energy intake was higher in barrows than in gilts (P < 0·05), but was not affected by dietary energy sources and feeding level. The extra organ protein deposition rate was affected by energy source (P < 0·05); additional fNSP increased the gain of this fraction, but only at the high feeding level (feeding level × energy source interaction; P = 0·08). The extra energy intake at the high energy level increased daily protein (P = 0·06), water (P = 0·001) and ash deposition (P < 0·001) in organs as a result of the fNSP treatment. The energy source × feeding level interaction was significant (P = 0·04) for extra ash deposition rates. Barrows deposited 5·2 g more fat per d in their organs than gilts (P = 0·06). Deposition rates of chemical components in hide and subcutaneous fat were independent of the dietary treatments. However, barrows deposited more fat in the subcutaneous area than gilts (P = 0·07). At the high feeding level, extra energy intake resulted in more fat, water and ash deposition in offal than at the low feeding level (P < 0·05). Neither dietary energy source nor sex affected the deposition rates of chemical components of the offal fraction (P>0·10).
Feeding level affected the fat distribution in hide, lean and offal fraction (P < 0·05), but the source of energy did not change the relative partitioning of fat deposition within the body (Table 9). On average 26, 10 and 48 % of body fat was deposited into lean, viscera and backfat area at the low feeding level and 22, 11 and 60 % of those at the high feeding level, respectively. The increase in fat deposited in the backfat area (48 and 60 % at the low and high feeding levels, respectively) largely coincided at the expense of fat in the offal fraction (15 and 8 % at the low and high feeding levels, respectively). The marginal fat deposition rate slightly increased with the feeding level in the offal fraction (Table 8). Therefore, in the case of a high energy intake when more extra fat is deposited in the body, relatively less extra fat goes to the offal fraction and more extra fat goes to lean and particularly the backfat area than with a low energy intake.
(Treatment means and standard deviations)

fNSP, fermentable NSP; dStarch, digestible starch; dFat, digestible fat; ER, energy retention; DE, digestible energy.
Discussion
Deposition of chemical components in body and body parts
The effect of sex on chemical composition and on deposition of body parts is not discussed in the present paper, since the present results are in agreement with literature data(Reference Jorgensen, Fernandez and Jørgensen19–Reference van Lunen and Cole21).
Protein, water and ash deposition
The response of body protein deposition to the added energy sources was somewhat higher at the low feeding level compared with the high feeding level. This means that, at the low feeding level, protein intake was not limiting the rate of protein deposition as intended(Reference Bikker, Verstegen and Campbell22), and the additional energy intake from fNSP and dStarch was therefore in part not completely available for body fat deposition. At the high feeding level, protein deposition was numerically lower when pigs received additional energy compared with the control group. Presumably protein deposition at high feeding levels was limited by the slightly reduced digestible protein intake compared with the control group (Table 6). Protein deposition was not affected by the energy source (Table 8). More than half of body protein is deposited in lean tissues; therefore, major changes in lean body protein deposition will probably be reflected in whole-body protein deposition as well. The extra deposition of body protein in groups fed additional energy at low feeding levels appeared almost exclusively in the lean fraction. At the high feeding level, reduced protein deposition in groups fed additional energy intake originated from reduced lean protein deposition.
Although there was a big difference in deposition rates between energy intake levels (compare control groups in Table 8), the effects of the fixed energy additions on deposition rates were much smaller and not significantly different between energy intake levels for fat (Table 8). The energy source affected organ protein deposition (P = 0·01) only; feeding a high level of fNSP increased the protein accretion in the organ fraction. Supplementing diets with NSP increased the weight of the small and large intestine(Reference Bakker, Dekker and Verstegen23–Reference Bolhuis, van den Brand and Staals25), presumably due to increased protein synthesis in the gastrointestinal tract.
Water and ash deposition rates were closely related to protein deposition rates in the body (Table 7). The water:protein deposition ratio in the body was 3·4 in the control groups and ranged between 3·1 and 3·5 in groups receiving additional energy. The ash:protein deposition ratio was approximately 0·2. Both the water:protein and the ash:protein ratios obtained in the present study are in agreement with the generally accepted values(Reference Bikker, Verstegen and Campbell22, Reference de Lange, Moughan, Verstegen and Visser-Reyneveld26, Reference Emmans and Kyriazakis27).
Fat deposition
The effect of feeding level and energy source on the fat deposition in the body and body parts is shown in Table 7. The extra energy intake at the low and high feeding levels resulted in similar extra fat deposition rates. Due to the high root mean square error (RMSE), the differences in marginal deposition were not significant among energy sources. Most net energy systems use different values for the energetic efficiency of NSP, starch and fat and therefore assume that equal amounts of DE intake from these energy sources results in different body fat deposition rates. The theoretical efficiencies of nutrient conversions into fat are usually referred to as 60–65 % for digestible or fermentable fibre, 70–80 % for starch and 90 % for animal fat containing saturated long-chain fatty acids(Reference Black, Moughan, Verstegen and Visser-Reyneveld4, Reference Schiemann, Nehring and Hoffmann28, Reference Noblet, Fortune and Shi29).
The marginal energetic efficiency of energy sources computed from our data is shown in Table 9. The data are the treatment means of energetic efficiencies based on the data calculated per pig from the marginal deposition of protein and fat and DE intake. Utilisation of energy from different sources differs at low and high feeding level. In the case of starch, the marginal energetic efficiency increased from 39 to 65 % when feeding level increased from 2·4 to 3·4 times the energy requirements for maintenance. For fNSP and unsaturated fat, the difference in marginal efficiency between the two energy levels was smaller and in the opposite direction. The energetic efficiency of NSP for fat deposition was 50 % at low feeding level; however, it does not correspond exclusively to the utilisation of fNSP, because the difference in energy intake between additional fNSP and control came from NSP (215 g/d) and some starch (76 g/d). At the high feeding level, the marginal DE intake originated from 264 g fNSP/d and only 17 g dStarch/d. The difference between the marginal efficiency is probably related to a higher maintenance energy requirement at the high feeding level. The marginal visceral mass accretion was 0 g/d at the low and 28 g/d at the high feeding level (Table 7). Organ mass significantly influences the maintenance energy requirements(Reference Noblet, Karege and Dubois30) and thereby could have contributed to the low energetic efficiency of fNSP for fat deposition.
The efficiency of starch conversion into fat was unexpectedly low at the low feeding level (39 %) but it was closer to the theoretical value at the high feeding level (65 v. 70–80 %, respectively). The low efficiency of transformation might partly be due to a higher activity and therefore an increased energy requirement of pigs fed the low feeding level. At the low feeding level, the pigs received 2·4 times their maintenance energy requirement and probably remained somewhat hungry. Any behavioural changes associated with activity as related to feed may change maintenance and thus the energetic efficiency of fat deposition(Reference Schrama, Bosch and Verstegen31, Reference Rijnen, Verstegen and Heetkamp32).
The marginal efficiency of utilisation of unsaturated fat for body fat was 51 and 46 % at the low and high feeding levels, respectively. These values are much lower than generally reported energetic efficiencies for fat (90 %). However, it has to be noted that the high efficiencies reported in the literature were largely obtained from animal (i.e. saturated) fats. Unsaturated fatty acids may well be more susceptible to oxidation than SFA, hence having a lower net energy value. For example, van Heugten et al. (Reference Van Heugten, Van den Borne, Verstegen, Ortigues-Marty, Miraux and Brand-Williams33) measured the oxidation of glucose, 18 : 0 and 18 : 2 using stable isotopes and found increased recovery of 13C in breath of pigs from 18 : 2 compared with that of 18 : 0. The CO2 enrichment reflects the composite effect of digestion, absorption and complete oxidation of nutrients. Therefore it is likely that the energetic efficiency of unsaturated fat is substantially lower than that of saturated fat. Unexpectedly, the difference between the additional dFat and control treatments was 141 g dFat/d and − 70 g fNSP/d at the high feeding level (see Table 4), which probably reduced the efficiency of fat conversion into body fat. Therefore we assume that the energetic efficiency of unsaturated fat for fat deposition is approximately 50 %. Although the efficiencies of utilisation of different energy source differ from the generally accepted values, we emphasise that our experiment was properly designed to directly compute marginal efficiencies. Most current estimates are based on multiple regression techniques from experiments not specifically designed for this purpose.
Although the effects of feeding level on protein deposition indicate that protein intake was not entirely limiting the rate of protein deposition at the low feeding level, this effect was quantitatively not important and is unlikely to be of major importance in the obtained low estimates of the energetic efficiencies for energy or fat deposition from the present study.
Distribution of fat deposition
According to de Greef & Verstegen(Reference de Greef and Verstegen34), relative fat deposition, i.e. the proportion of body fat deposited in different tissues, has to be considered by assuming similar body fat deposition in different treatments in order to study the distribution of body fat. In that case one can verify if any priority of partitioning of fat deposition from fNSP, dStarch and dFat exists (Table 10). Despite the suggestions by de Greef & Verstegen(Reference de Greef and Verstegen34), little emphasis has been given to the effect of nutrition on the distribution of chemical components into tissue groups within the body. In the present study, feeding level determined the proportion of body fat deposited in the lean, hide, subcutaneous and left-over fraction (P < 0·05). In agreement with data of de Greef & Verstegen(Reference de Greef and Verstegen34), the higher feeding level resulted in a larger fat deposition rate in the backfat area, and a smaller fat deposition rate in lean, with differences being more pronounced in the present study. The proportion of body fat deposited in visceral tissues was not affected by feed intake in the present study nor in the trial of de Greef & Verstegen(Reference de Greef and Verstegen34).
Effect of feeding level (FL) and energy source (ES) on the relative partitioning of body fat (%)

fNSP, fermentable NSP; dStarch, digestible starch; dFat, digestible fat; RMSE, root mean square error.
The source of energy did not change the partitioning of fat deposition within the body (Table 10). On average 24, 10 and 54 % of body fat was deposited in lean, viscera and backfat area, respectively. Some researchers have suggested that high fat intakes increase(Reference Mersmann, Pond and Yen5, Reference de la Llata, Dritz and Tokach7) but high fibre intakes decrease fat deposition in backfat(Reference Scipioni, Sardi and Barchi35). However, in these studies only backfat thickness was measured and no chemical body analysis was performed. It is suggested that the changes in backfat thickness is associated with a different body fat mass rather than reflecting a changed priority of fat deposition due to the fat- or fibre-rich diet.
Growth performance and wet tissue deposition
Protein deposition is accompanied by water and ash deposition, and thus determines the major proportion of weight gain. Fat deposition was approximately 20 and 30 % of empty body-weight gain in the control groups at the low and high feeding levels, respectively. In the present study, neither protein deposition nor average daily gain was influenced by dietary energy source. Schrama et al. (Reference Schrama, Bosch and Verstegen31) also found that if the tapioca was substituted (from 36 to 19 % of the diet) by pressed sugarbeet pulp (from 0 to 15 % of the diet) the growth performance and the protein deposition of growing pigs did not change. In agreement with the present results, many studies have shown that additional fat with isonitrogenous intake does not increase average daily gain(Reference Mersmann, Pond and Yen5, Reference de la Llata, Dritz and Tokach7, Reference Knowles, Southern and Bidner36). However, due to the high energy content of dietary fat, fat supplementation increases the energy concentration of the diet and therefore it might result in enhanced feed conversion (expressed as feed:gain).
Data on nutritional effects on body compartments, such as wet tissue of lean, organs and subcutaneous fat, are scarce. Since the lean fraction is approximately half of the empty body, changes in the empty body generally correspond to changes in lean gain or loss. According to data on protein deposition rates, energy addition to the low feeding level resulted in extra lean deposition, whereas a similar addition at the high feeding level decreased lean deposition, which is difficult to explain. In the present study, the depressed extra lean gain was compensated for by increased organ gain at the high feeding level, and so resulted in a lower, extra empty body gain. According to gain of the chemical entities, the energy source did not affect daily deposition rates of lean tissue. However, additional energy intake resulted in higher extra wet tissue gain of organs at the high feeding level. This effect was caused mainly by high fNSP intake. The hypertrophic effect of high-fibre diets on the gastrointestinal tract in growing pigs has been reported repeatedly(Reference Pekas, Yen and Pond37, Reference Pond, Varel and Dickinson38).
It can be seen from our data that energy level influences the extra deposition of lean and organs. At the high feeding level – if protein intake is limiting – the lean deposition had no priority and the extra tissue deposition derived from organs and hide. The marginal deposition in hide and subcutaneous fat was similar if the pigs were fed at the low or at high feeding level.
Conclusion
In conclusion, under protein-limiting conditions, incremental energy intake from fNSP, dStarch and digestible unsaturated fat resulted in similar body fat deposition. Preferential deposition of the supplemental energy intake in various fat depots did not depend on the energy source, and the extra fat deposition was similar at the low and high levels of feed intake. The marginal energetic transformation (energy retention; ER) of fNSP, dStarch and digestible unsaturated fat for fat retention (ERfat:DE) was surprisingly low: 44, 52 and 49 %, respectively. The present results do not support values of energetic efficiencies currently used in net energy-based systems. Our experimental design allows a direct calculation of these marginal efficiencies, whereas most current estimates are based on multiple regression techniques from experiments not specifically designed for this purpose. As the effects of the incremental intakes of fNSP, dStarch and digestible unsaturated fat on the rate of fat deposition were substantially lower than expected, the experimental power may have hampered solid conclusions on the differences in the energetic utilisation of these energy sources.
Feeding level affected the fat distribution in hide and lean, but the source of energy did not change the partitioning of fat deposition throughout the body. The fat deposition as a percentage relative to total fat was lower in lean and higher in backfat when pigs received the high energy intake compared with pigs fed with low energy.
Acknowledgements
V. H. was supported by a János Bolyai Research Scholarship from the Hungarian Academy of Science, which is gratefully acknowledged.
All authors contributed collectively to the final manuscript.
There are no conflicts of interest.


