

According to a new position paper, carbohydrate–protein supplementation during the post-exercise (PE) recovery period promotes muscle protein anabolism( Reference Thomas, Erdman and Burke 1 ). To achieve maximum muscle adaptation to exercise, laboratory-based nutritional studies have reported that ‘immediate’ PE consumption of protein can elicit greater muscle protein synthesis, whereas fasting for 2–3 h after exercise blunts this response( Reference Levenhagen, Gresham and Carlson 2 ). Therefore, carbohydrate–protein supplementation as soon as possible (at least within 45 min) after endurance exercise has been recommended; these recommendations are also applicable to resistance exercise( Reference Ivy and Ferguson-Stegall 3 ).
However, during and immediately after exercise, 25–70 % of endurance athletes experience transient anorexia as well as gastrointestinal (GI) symptoms, such as nausea and stomach pain( Reference Peters, Bos and Seebregts 4 – Reference van Wijck, Lenaerts and Grootjans 6 ). These exercise-induced GI symptoms can occur frequently, thereby decreasing exercise performance and subsequent recovery in athletes. Although there are numerous causes of exercise-induced GI symptoms, some recent studies considered that reduction of GI blood flow (BF) is a likely contributor( Reference van Wijck, Lenaerts and Grootjans 6 – Reference ter Steege and Kolkman 8 ). Strenuous exercise of high intensity and/or prolonged duration often reduces BF in the celiac artery (CA)( Reference Perko, Nielsen and Skak 9 ), superior mesenteric artery (SMA)( Reference Perko, Nielsen and Skak 9 , Reference Qamar and Read 10 ), gastric mucosa( Reference Otte, Oostveen and Geelkerken 11 – Reference van Wijck, Lenaerts and van Loon 13 ), portal vein( Reference Rehrer, Smets and Reynaert 14 ) and whole viscera( Reference Osada, Iwane and Katsumura 15 , Reference Rowell, Blackmon and Martin 16 ), potentially damaging the small intestine mucosal cells( Reference van Wijck, Lenaerts and van Loon 13 , Reference van Wijck, Pennings and van Bijnen 17 , Reference Kashima, Harada and Miyamoto 18 ). When the GI tract is hypoperfused following exercise, the consumption of a nutrient-rich beverage may impair digestion and/or absorption. In this regard, van Wijck et al.( Reference van Wijck, Pennings and van Bijnen 17 ) observed the appearance of plasma phenylalanine after ingestion of 20 g dietary protein immediately after high-intensity resistance exercise. Compared with a no exercise trial, plasma phenylalanine levels lowered for approximately 30–60 min during the PE phase. The authors interpreted that strenuous exercise-induced GI hypoperfusion damaged intestinal mucosal cells and consequently decreased plasma phenylalanine appearance, thereby impairing GI function, although GI BF and its associated functions were not directly measured.
To elucidate the relationship between GI function and BF, we simultaneously measured and evaluated the rate of gastric emptying (GE), CA and SMA BF after 30 min high-intensity intermittent leg cycling exercise comprising a 120 %
 $${ \dot{\rm V}\rm O}_{{\rm 2}} $$
peak for 20 s followed by 20 W for 40 s(
Reference Kashima, Harada and Miyamoto
18
). The CA supplies blood to the stomach, pancreas, spleen and liver, and the SMA primarily supplies blood to the jejunum and ileum. The participants ingested a carbohydrate–protein drink either 5 min (i.e. concurrently with decreased CA BF) or 30 min (i.e. as CA BF is recovering) PE. In the 5 min PE trial, the GE rate and SMA BF responses after ingestion of the carbohydrate–protein drink were slower than those observed in the 30 min PE trial. These results suggested that PE GI hypoperfusion acutely suppressed subsequent digestive and/or absorptive functions. As this study used a laboratory-based basic science approach, our data suggest that athletes and training enthusiasts should avoid carbohydrate–protein supplementation immediately after strenuous exercise.
$${ \dot{\rm V}\rm O}_{{\rm 2}} $$
peak for 20 s followed by 20 W for 40 s(
Reference Kashima, Harada and Miyamoto
18
). The CA supplies blood to the stomach, pancreas, spleen and liver, and the SMA primarily supplies blood to the jejunum and ileum. The participants ingested a carbohydrate–protein drink either 5 min (i.e. concurrently with decreased CA BF) or 30 min (i.e. as CA BF is recovering) PE. In the 5 min PE trial, the GE rate and SMA BF responses after ingestion of the carbohydrate–protein drink were slower than those observed in the 30 min PE trial. These results suggested that PE GI hypoperfusion acutely suppressed subsequent digestive and/or absorptive functions. As this study used a laboratory-based basic science approach, our data suggest that athletes and training enthusiasts should avoid carbohydrate–protein supplementation immediately after strenuous exercise.
Given the range of competitive sports and fitness activities, it is meaningful to examine GI effects related to timing of nutrient supplementation after exercise. Several previous reviews have summarised the effects of exercise intensity and duration on the rate of GE during ‘endurance exercise’( Reference Bi and Triadafilopoulos 19 – Reference Murray 22 ); however, there is very limited evidence on the effects of GE rate after exercise( Reference Kashima, Harada and Miyamoto 18 , Reference Evans, Watson and Shirreffs 23 ). Surprisingly, very little is known about the rate of GE during and after ‘resistance exercise’, as indicated by a recent review( Reference Horner, Schubert and Desbrow 20 ), despite the importance of promoting quick rehydration, refuelling and repair of damaged tissues following exercise( Reference Peters, Bos and Seebregts 4 , Reference Morton, McGlory and Phillips 24 , Reference Evans, James and Shirreffs 25 ). Therefore, to understand GE after resistance exercise, we investigated the effects of the timing of carbohydrate–protein supplementation on GE rate after strenuous resistance exercise. The protocol used was similar to that of our previous study to compare the responses between two different types of exercises. In addition, we examined plasma branched-chain amino acids (BCAA) and blood glucose responses, because our previous study failed to evaluate the appearance of nutrients into blood circulation after ingestion of a nutrient-rich drink( Reference Kashima, Harada and Miyamoto 18 ). Thus, the manner in which the acute alternative of GE rate (i.e. partial digestive process) could also impact the subsequent digestive–absorptive rates in the small intestines during the PE phase has not been clarified. We demonstrated that GE was suppressed nearly immediately (i.e. at 5 min, but not 30 min) after strenuous resistance exercise, which consequently delayed plasma BCAA and blood glucose appearance into the blood circulation.
Methods
Participants
In all, eleven healthy young subjects (seven females and four males; age, 21 (sd 3) years; height, 162 (sd 8) cm; weight, 56 (sd 5) kg; BMI, 22 (sd 2) kg/m2) participated in this study. The participants were young, healthy and normotensive. No participants smoked or took any medication, and none had any histories of autonomic dysfunction, as well as cardiovascular or GI tract disorders. The study protocol was performed in compliance with the Declaration of Helsinki, and the Ethics Committee of the Prefectural University of Hiroshima approved the study (approval no. HH007). Before study commencement, each participant provided written informed consent for participation.
Preliminary test session
As a baseline/pre-test, we determined the one-repetition maximum (1RM) for each of three resistance exercises (lat-pull-down, chest-press and leg-presses) using the training machines (Technogym-Element Plus Line; Technogym Co. Ltd). We defined the 1RM as the maximum amount of weight each participant could lift during one repetition. This baseline/pre-test was performed on a different day from the main protocols, as described in the forthcoming text.
Main trial session
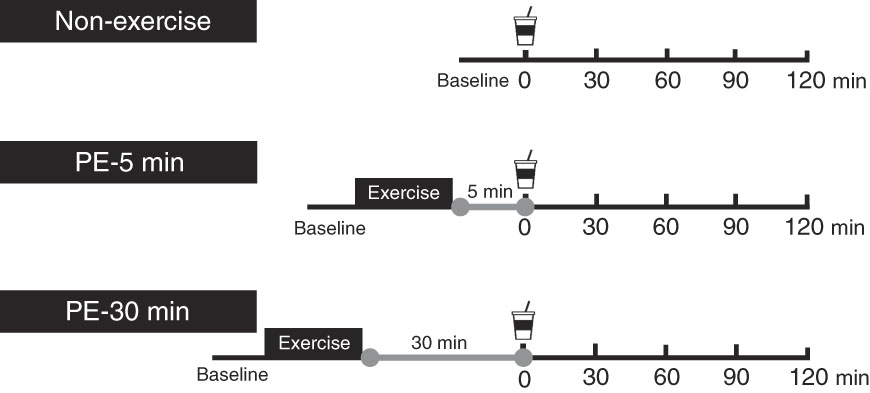
Each participant performed the following three protocols in random order. Female participants participated in each protocol during the same phase of their menstrual cycles, because menstruation affects GE and blood glucose, insulin and glucagon-like peptide-1 concentrations( Reference Brennan, Feltrin and Nair 26 ). Males participated a maximum of once per week. An overview of the exercise protocol is shown in Fig. 1. Participants arrived at approximately 08.30–10.30 hours in the laboratory, having abstained from strenuous exercise, alcohol and caffeine ingestion for at least 1 d. Each participant started three protocols during the same hour. In the 3 h before each experimental trial, participants consumed a semi-liquid standardised meal of approximately 836·8 kJ (200 kcal) (SAVAS Energy Maker Jelly; Meiji) comprising CHO (49·7 g), protein (0 g) and fat (0 g). Using ultrasonography, we confirmed that the diet had completely emptied from the stomach at experiment onset( Reference Kashima, Harada and Miyamoto 18 ). Participants were seated in a chair in a quiet resting room for 5 min (baseline measurement), where the temperature and humidity were maintained at 24±1°C and 46±4 %, respectively. After this, the participants moved to the exercise room to perform resistance exercises for approximately 30 min, where the temperature and humidity were maintained at 26±2°C and 66±9 %, respectively. Following warm-up (i.e. standardised dynamic stretching) for 2 min, a single bout of resistance exercise was performed, consisting of six sets on a circuit of abdominal curls, lat-pull-downs, chest-presses and leg-presses. During the first and second sets, the exercise intensity and volume were set at 50 % of 1RM and ten repetitions. During the third, fourth and fifth sets, the intensity and volume were set at 75 % of 1RM and ten repetitions. In the final (sixth) set, the intensity and volume were set at 75 % of 1RM and the participants repeated each exercise until exhaustion. During those exercises, duration of each concentric and eccentric action was controlled at 1·5–2 s using an electronic metronome. During the first and second sets, ten abdominal curl repetitions were performed on a flat floor with the hips and knees flexed to 90° and legs supported on a platform. The participant’s hands were placed behind his or her head and the participant’s shoulders were elevated from the flat floor. Participants sat up until their elbows touched their knees, leaving the trunk approximately 75–90° from the floor. During the third, fourth, fifth and sixth sets, the participant’s trunk was inclined backward at a 10° angle from the flat floor. During the third, fourth and fifth sets, ten abdominal curls were performed, and in the final (sixth) set, each participant completed maximal voluntary repetitions for 40 s. During abdominal curls in the first through fifth sets, the duration of each concentric and eccentric action was controlled at 1·5–2 s using an electronic metronome. Following the resistance exercises, each participant was seated in a chair to rest. During the PE period, each participant ingested 400 ml of nutrient-rich drink containing 12 g carbohydrate and 20 g whey protein (ZAVAS Protein Drink; Meiji Co. Ltd) at either 5 min (PE-5) or 30 min (PE-30) and then rested for 120 min. As a control trial (Con), each participant ingested the same nutrient-rich drink without exercise immediately after baseline measurement. Participants were instructed to consume the nutrient-rich drink for 2 min. Each participant performed the three protocols in random order. At first, participants were allocated to the Con (n 4), PE-5 (n 4) and PE-30 (n 3).
Schematic representation of the study protocol. Participants ingested the carbohydrate–protein drink either at 5 min (post-exercise (PE)-5) or 30 min (PE-30) after strenuous resistance exercise and then rested for 120 min. In the Con, participants ingested the same nutrient-rich drink without engaging in exercise.
Measurements
With the exception of during and 5 min after exercise, heart rate (HR) was continuously monitored using an electrocardiogram (Colin BP-88S; Colin Co. Ltd).
GE rate was evaluated using the 13C-sodium acetate breath test( Reference Ghoos, Maes and Geypens 27 ). After oral administration, 13C-sodium acetate is absorbed rapidly in the small intestine (but not in the stomach), metabolised and finally expired as [13CO2]. This breath test is a widely-used, reproducible and non-invasive alternative to scintigraphy (which has the drawback of radiation exposure)( Reference Ghoos, Maes and Geypens 27 ). We dissolved 100 mg of 13C-sodium acetate into the nutrient-rich drink. Participants were instructed to hold their breath for 10 s to empty end-expiratory breath in a sample foil bag. Baseline breath samples were collected using a large-capacity bag (PAYLORI-BAG5 L; Fukuda Denshi). After ingestion of the nutrient-rich drink, breath samples were collected using a small-capacity bag (PAYLORI-BAG20; Fukuda Denshi) at 5- and 10-min intervals for 5–60 and 70–120 s, respectively. [13CO2] enrichment in breath was measured using an isotope ratio mass spectrometer (POCone; Otsuka Electronics). CO2 production per body surface area was assumed to be 300 mmol/m2 per h. The body surface area was calculated according to a weight–height formula( Reference Haycock, Schwartz and Wisotsky 28 ). We determined longitudinal measures of the percentage [13CO2] recovery per hour and the cumulative percentage of [13CO2] recovery. The times when the [13CO2] recovery per hour reached a maximum (i.e. T max-calc) and when the total cumulative dose of the [13CO2] reached one-half (i.e. T 1/2) were calculated according to a standard analytical method( Reference Ghoos, Maes and Geypens 27 ). These parameters are closely correlated with GE using scintigraphy ( Reference Ghoos, Maes and Geypens 27 , Reference Braden, Adams and Duan 29 , Reference Chew, Bartholomeusz and Bellon 30 ) and the Wagner–Nelson method( Reference Sanaka, Yamamoto and Nakayama 31 ).
Blood sampling
Capillary blood samples were collected via left index and middle finger skin pricks before exercise (baseline), immediately after exercise, just before and at 15, 30, 45, 60, 90 and 120 min after ingestion of the nutrient-rich drink. Blood glucose and lactate concentrations were analysed by dedicated measurement devices (Glucocard Diameter-alpha GT-1661 and Lactate Pro2 LT-1730; Arkray). Blood samples were collected into post-heparinised 75-µl capillary tubes and centrifuged at 3000 g for 5 min at room temperature to obtain plasma samples. The plasma samples were deproteinised with acetonitrile and centrifuged at 15 000 g and 4°C for 5 min. Then, 95 µl of deproteinised supernatants samples were mixed with 5 µl of norleucine as an internal standard solution and then those samples were stored at −80°C before analysis. The mixtures were derivatised using the AccQTag Ultra Deriviatisation Kit (Waters). Plasma BCAA concentrations, which are expressed as the total concentrations of valine, isoleucine and leucine in plasma, were determined using the Waters ACQUITY Ultra Performance LC System equipped with an AccQTag Ultra Column (2·1×100 mm; Waters) and TUV detector (Waters). Blood glucose values and plasma BCAA concentrations were calculated as absolute change from baseline. BCAA responses were calculated as the incremental AUC (iAUC) above baseline values, after ingestion of the nutrient-rich drink. The inter-sample variability and reproducibility in BCAA values when comparing venous with capillary blood were acceptable (most <10 and 20 %, respectively)( Reference Abdulrazzaq and Ibrahim 32 ).
Participants’ average appetite score
We assessed participants’ GI symptoms and motivation to eat using 100-mm visual analogue scales before exercise, immediately after exercise and every 30 min thereafter. The GI symptoms of interest included distention, nausea and abdominal pain. All scales ranged from 0 mm (feel nothing at all) to 100 mm (very strong feeling). Each participant’s motivation to eat was assessed by measuring hunger, fullness, desire to eat and prospective consumption. The scales for hunger, desire to eat and prospective consumption ranged from 0 mm (no hunger, desire to eat or food consumption) to 100 mm (very hungry, strong desire to eat or consume food). For fullness, the scale ranged from 0 mm (not full at all) to 100 mm (very full). Using the scores of these four questions, each participant’s average appetite score was calculated for each measurement time point according to the following formula( Reference Anderson, Catherine and Woodend 33 , Reference Samra and Anderson 34 ):
 $$\eqalign{&{\rm Participant \rsquo s}\,{\rm average}\,\,{\rm appetite}\,\,{\rm score}\,\,\left( {{\rm mm}} \right) \cr & \quad {\rm {\equals}}\left ( {{\rm desire}\,\,{\rm to}}\,\,{\rm eat {\plus} hunger{\plus}}\left( {{\rm 100}{\minus}{\rm fullness}} \right)} \right \cr & \quad {\rm {\hskip9.5pt\plus}prospective}\,\,{\rm consumption ) \,/\,4 . }} \right)}{\rm .}$$
Power and statistical analysis
In a pilot experiment (four participants; two females and two males), we compared T max-calc (i.e. main GE rate index) during conditions of non-exercise (i.e. Con) and 5 or 30 min post-resistance exercise (i.e. PE-5 and PE-30, respectively). The mean values and standard errors of T max-calc for Con, PE-5 and PE-30 were 53·7 (sd 5·5), 80·9 (sd 19·1) and 63·5 (sd 6·5) min, respectively. Then, we ran a statistical power analysis based on this outcome using G*Power (version 3.1.9.2) with four participants per condition. We obtained an effect size of 1·435 for a critical F 2,6 of 5·143 at α error probability of 0·05 and power (1−β error probability) of 0·80. The calculated total sample size was nine and, consequently, we planned to recruit a total of eleven participants to allow for dropouts.
Data are expressed as means and standard deviations of means. The effects of time and treatment on HR, blood lactate concentrations, blood glucose and plasma BCAA concentrations and participant’s GI compliance and appetite scores were tested by two-way repeated ANOVA. When a significant effect was detected, Dunnett’s and Tukey’s post hoc tests were conducted to reveal the effects of time (change from baseline) and treatments, respectively. The effect of treatment on T max-calc and T 1/2 and iAUC for BCAA were tested by one-way repeated ANOVA. When a significant effect was detected, Tukey’s post hoc tests were conducted. The relationship between blood lactate concentration and T max-calc was evaluated by Pearson’s correlation coefficient. The two-sided statistical significance level was set at P≤0·05. All statistical analyses were performed with SPSS PASW 18 statistics software (SPSS Inc.).
Results
The mean pre-test 1RM for lat-pull-down, chest-press and leg-presses were 55 (sd 20), 49 (sd 25) and 153 (sd 46) kg, respectively.
Central circulatory responses and blood lactate concentration
Baseline HR values did not significantly differ among trials (Con: 66 (sd 9) beats per min (bpm), PE-5: 67 (sd 11) bpm, PE-30: 63 (sd 11) bpm) (Fig. 2(a)). During the PE-5 and PE-30 conditions, there were no statistically significant between-group differences in HR immediately after exercise (PE-5: 99 (sd 13) bpm, PE-30: 98 (sd 11) bpm) (P>0·05). During the post-ingestion phase, HR values were the highest during the PE-5 condition (P<0·05). The values were higher during the PE-30 condition than during the Con condition (P<0·05).
Longitudinal heart rate (a) and blood lactate (b) responses, except for those obtained during exercise. The upper, middle and lower panels indicate no exercise (Con), 5 min post-exercise (PE-5) and 30 min post-exercise (PE-30), respectively. At 0 min, the vertical dotted line denotes the timing of carbohydrate–protein supplementation. Heart rate and blood lactate levels were tested by two-way repeated ANOVA. When a significant difference was detected, we conducted Dunnett’s and Tukey’s post hoc tests to determine the effects of time (the change from baseline) and treatments, respectively. Values are means, with standard deviations represented by vertical bars. * Mean value was significantly different (v. baseline; P<0·05); † Mean value was significantly different for PE-5 v. Con (P<0·05). ‡ Mean value was significantly different for PE-5 v. PE-30 (P<0·05). § Mean value was significantly different for Con v. PE-30 (P<0·05).
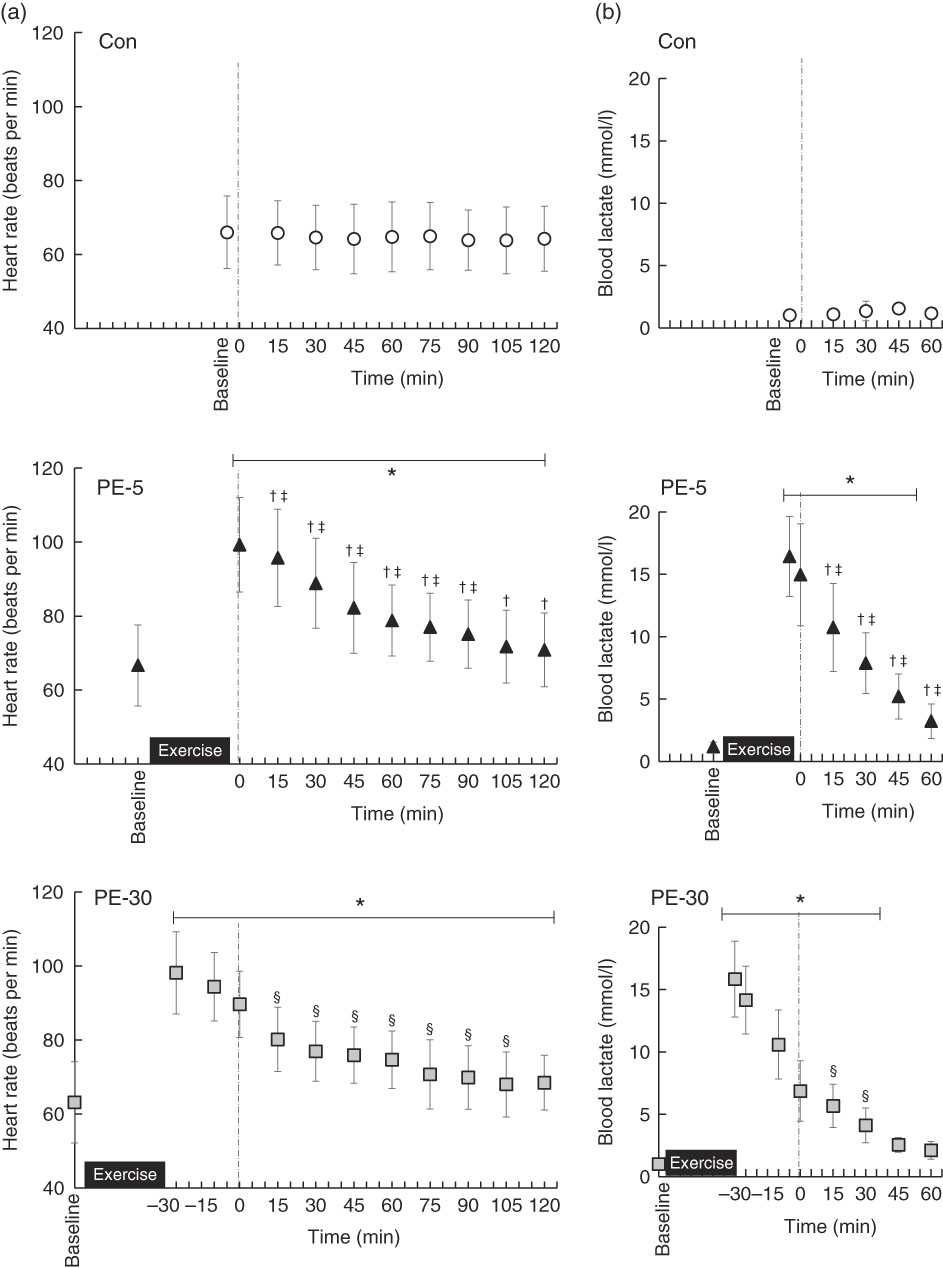
Baseline blood lactate concentrations did not significantly vary among the trials (Con: 1·1 (sd 0·3) mmol/l, PE-5: 1·2 (sd 0·3) mmol/l, PE-30: 1·0 (sd 0·3) mmol/l) (Fig. 2(b)). During the PE-5 and PE-30 conditions, there were no statistically significant between-group differences in blood lactate concentrations immediately after exercise (PE-5: 16·4 (sd 3·2) mmol/l, PE-30: 15·8 (sd 3·0) mmol/l) (P>0·05). Blood lactate concentrations just before ingestion of the nutrient-rich drink were higher during the PE-5 than during the PE-30 condition (PE-5: 15·0 (sd 4·1) mmol/l, PE-30: 6·9 (sd 2·4) mmol/l, P<0·05.).
Gastric emptying rate
Longitudinal pulmonary [13CO2] excretion rates are shown in Fig. 3(a). T max-calc for PE-5 showed a significant delay compared with the Con and PE-30 conditions (Con: 53 (sd 7) min, PE-5: 83 (sd 16) min, PE-30: 62 (sd 9) min, P<0·05, Fig. 3(b)). T 1/2 for PE-5 also showed a significant delay compared with the Con and PE-30 conditions (Con: 91 (sd 7) min, PE-5: 113 (sd 21) min, PE-30: 91 (sd 11) min, P<0·05, Fig. 3(c)). For PE-30, T max-calc and T 1/2 did not significantly differ from the Con condition. T max-calc was significantly correlated with blood lactate concentration just before ingestion of the nutrient-rich drink (R 2 0·62, P<0·05) (Fig. 3(d)).
Gastric emptying rate using the 13C breath test. Longitudinal 13C excretion responses (a) after ingestion of nutrient drink. The upper, middle and lower panels indicate no exercise (Con), 5 min post-exercise (PE-5) and 30 min post-exercise (PE-30), respectively. At 0 min, the vertical dotted line denotes the timing of carbohydrate–protein supplementation. The effect of treatment on T max-calc (b) and T 1/2 (c) were tested by one-way repeated ANOVA. When a significant difference was detected, we conducted Tukey’s post hoc test. T max-calc and T 1/2 of 13C excretion rate, which are the gastric emptying indices, were altered by timing of post-exercise nutrient supplementation. The relationship between blood lactate concentration and T max-calc was evaluated by Pearson’s correlation coefficient (d). T max-calc was significantly correlated with blood lactate concentrations just before ingestion of the nutrient-rich drink. The white circle, black triangle and grey square represent Con, PE-5 and PE-30, respectively. Values are means, with standard deviations represented by vertical bars. * Mean value was significantly different for PE-5 v. Con (P<0·05). † Mean value was significantly different for PE-5 v. PE-30 (P<0·05).

Blood glucose and plasma branched-amino acids responses
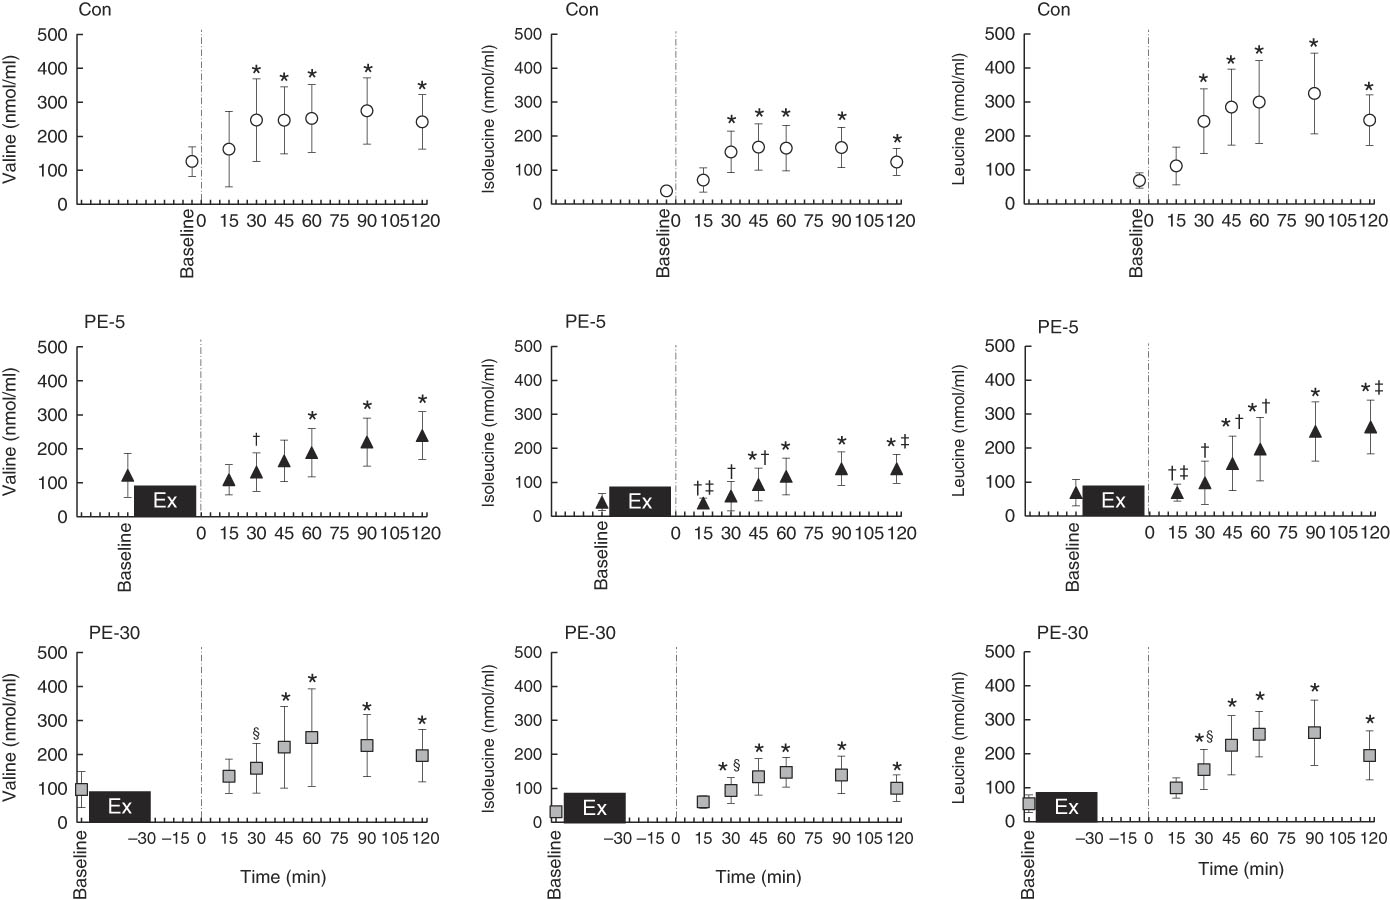
Longitudinal blood glucose and plasma amino acid responses are shown in Figs. 4 and 5, respectively. After ingestion of the nutrient-rich drink, the blood glucose concentration for the PE-5 condition was significantly increased from baseline at 30 min (P<0·05), whereas the blood glucose concentrations for the Con and PE-30 conditions were significantly increased at 15 min (P<0·05). At 60–90 min, the blood glucose concentration was higher for the PE-5 condition than for the Con (P<0·05). During the post-ingestion phase, plasma valine concentrations were significantly increased from baseline at 30–120, 60–120 and 45–120 min during the Con, PE-5 and PE-30 conditions, respectively (P<0·05). Plasma valine concentrations observed during the PE-5 and PE-30 conditions were lower than those observed during the Con condition at 30 min (P<0·05). The plasma isoleucine concentrations were significantly increased from baseline at 30–120, 45–120 and 30–120 min during the Con, PE-5 and PE-30 conditions, respectively (P<0·05). Plasma isoleucine concentrations during the PE-5 condition were lower than those during the Con condition at 15–45 min and the PE-30 condition at 15 min (P<0·05). Plasma isoleucine concentrations during the PE-30 condition were lower than those during the Con condition at 30 min (P<0·05). Plasma isoleucine concentrations during the PE-5 condition were higher than those during the PE-30 conditions at 120 min (P<0·05). The plasma leucine concentrations were significantly increased from baseline at 30–120, 45–120 and 30–120 min during the Con, PE-5 and PE-30 conditions, respectively (P<0·05). Plasma leucine concentrations observed during the PE-5 condition were lower than those observed during the Con condition at 15–60 min and the PE-30 condition at 15 min (P<0·05). Plasma leucine concentrations observed during the PE-30 conditions were lower than those observed during the Con condition at 30 min (P<0·05). Plasma leucine concentrations during the PE-5 condition were higher than those during the PE-30 condition at 120 min (P<0·05). The iAUC of BCAA were significantly lower during the PE-5 condition compared with the Con condition (P<0·05). During the PE-30 condition, the AUC of BCAA were statistically equivalent to those observed during the Con condition. This difference almost reached significance compared with the PE-5 condition (P=0·08) (Con: 45 291 (sd 18 575) nmol/ml, PE-5: 26 352 (sd 19 445) nmol/ml, PE-30: 39 895 (sd 9685) nmol/ml).
Longitudinal blood glucose responses, except for those during exercise. The upper, middle and lower panels indicate no exercise (Con), 5 min post-exercise (PE-5) and 30 min post-exercise (PE-30), respectively. At 0 min, the vertical dotted line denotes the timing of carbohydrate–protein supplementation. Blood glucose responses were tested by two-way repeated ANOVA. When a significant difference was detected, we conducted Dunnett’s and Tukey’s post hoc tests to determine the effects of time (the change from baseline) and treatments, respectively. Values are means, with standard deviations represented by vertical bars. * Mean value was significantly different (v. baseline; P<0·05). † Mean value was significantly different for PE-5 v. Con (P<0·05).

Longitudinal plasma branched-chain amino acid (BCAA) response, except for those observed during exercise. The upper, middle and lower panels indicate no exercise (Con), 5 min post-exercise (PE-5) and 30 min post-exercise (PE-30), respectively. At 0 min, the vertical dotted line denotes the timing of carbohydrate–protein supplementation. Plasma BCAA responses were tested by two-way repeated ANOVA. When a significant difference was detected, we conducted Dunnett’s and Tukey’s post hoc tests to determine the effects of time (the change from baseline) and treatments, respectively. Values are means, with standard deviations represented by vertical bars. * Mean value was significantly different (v. baseline; P<0·05); † Mean value was significantly different for PE-5 v. Con (P<0·05). ‡ Mean value was significantly different for PE-5 v. PE-30 (P<0·05). § Mean value was significantly different for Con v. PE-30 v. Con (P<0·05).
Participants’ gastrointestinal disorder and appetite scores
During baseline/pre-testing, no participants complained of GI symptoms during any of the trials. During the PE-5 and PE-30 conditions, stomach distension, stomach pain and nausea scores exhibited no statistically significant differences after exercise and ingestion of the nutrient-rich drink (Table 1). Nausea scores were higher during the PE-5 condition than the Con condition at 30 min (P<0·05). Although we could not measure from 5–25 min after ingestion, during the PE-5 condition, four participants complained of severe nausea at 5–30 min after ingestion of the nutrient-rich drink.
Participants’ gastrointestinal symptoms and appetite scores§ (Mean values and standard deviations)

AE, after exercise; AI, after ingestion (of nutrient drink); Con, control trial; PE, post-exercise.
* Mean value was significantly different from that of baseline (P<0·05).
† Mean value was significantly different for PE-5 v. Con (P<0·05).
‡ Mean value was significantly different for PE-5 v. PE-30 (P<0·05).
§ Participants’ gastrointestinal symptoms and appetite scores were tested using a two-way repeated ANOVA. When a significant difference was detected, Dunnett’s and Tukey’s post hoc tests were conducted to determine the effects of time (the change from baseline) and treatments, respectively.
Baseline average appetite scores did not differ among the three conditions (Con: 77 (sd 16) mm, PE-5: 78 (sd 15) mm, PE-30: 83 (sd 15) mm). During the PE-5 and PE-30 conditions, average appetite scores immediately PE demonstrated equivalent decreases from baseline (PE-5: 33 (sd 11) mm, PE-30: 29 (sd 13) mm, P<0·05). At 30 min after ingestion of the nutrient-rich drink, average appetite scores were lower during the PE-5 condition than either the Con or PE-30 condition (P<0·05).
Discussion
We compared GE rate and BCAA and blood glucose responses during conditions of non-exercise (i.e. Con) and 5 or 30 min post-resistance exercise (i.e. PE-5 and PE-30, respectively) to elucidate the impact of timing of nutrient ingestion on digestion–absorption rates. During the PE-5 condition, GE rate was delayed compared with the Con and PE-30 conditions, resulting in slower BCAA and blood glucose responses, compared with the Con or PE-30 conditions. During the PE-30 condition, there were no statistically significant differences from the Con condition for GE rate and BCAA and blood glucose responses. The rate of GE was altered by the timing of nutrient consumption after strenuous resistance exercise. This phenomenon might be the key to determining subsequent digestive–absorptive rates.
The major finding in the present study was that GE was strongly suppressed when the nutrient-rich drink was given immediately after strenuous resistance exercise (i.e. PE-5). In contrast, when the nutrient drink was ingested 30 min after strenuous resistance exercise (i.e. PE-30), GE was unaffected. These results agree with the findings of Evans et al.( Reference Evans, Watson and Shirreffs 23 ), our previous human study( Reference Kashima, Harada and Miyamoto 18 ), and the animal-based findings of Silva et al.( Reference Silva, Palheta-Junior and Sousa 35 ). Evans et al.( Reference Evans, Watson and Shirreffs 23 ) reported that GE rates following the ingestion of a carbohydrate beverage (595 ml of 5 % glucose solution) at 30 min after high-intensity interval cycle exercise did not differ from those measured during the Con. We previously reported that when a carbohydrate–protein drink was ingested either 5 or 30 min after high-intensity intermittent cycle exercise, GE was slower during the 5 min after exercise compared with the 30 min PE and non-exercise trials( Reference Kashima, Harada and Miyamoto 18 ). In conscious rats, the residual rates in the stomach (i.e. the reciprocal index of GE rate) after ingestion of a liquid feed were evaluated at 0, 10 or 20 min after high-intensity exercise( Reference Silva, Palheta-Junior and Sousa 35 ). When the feed was given at 0 min after exercise, the subsequent residual rates were the highest among the three trials (0 min: 72·8 (sd 5·9) %, 10 min: 66·8 (sd 8·5) %, 20 min: 38·2 (sd 3·7) %). When the feed was ingested 20 min after exercise, the resultant GE rate was equivalent with that observed during the non-exercise trial (41·4 (sd 5·7) %). Collectively, GE is delayed immediately after strenuous exercise and gradually recovers thereafter, irrespective of the exercise mode (i.e. between high-intensity intermittent cycle exercise in our previous study( Reference Kashima, Harada and Miyamoto 18 ) and following strenuous resistance exercise in the present study). Considering all these findings, we hope to further clarify the effects of exercise on GE, from both basic and mechanistic viewpoints. Until now, this subject was poorly understood.
The GE rate is modulated by several factors, including GI BF, pH and autonomic nervous activity( Reference Horner, Schubert and Desbrow 20 ). We recently reported that decreased CA BF (i.e. hypoperfusion) following high-intensity intermittent exercise acutely suppresses GE( Reference Kashima, Harada and Miyamoto 18 ). The CA BF supplies the stomach, pancreas, spleen and liver and supports digestive activities( Reference Granger, Holm and Kvietys 36 ). However, we did not measure GI BF (i.e. CA BF and SMA BF). It is well-known that reduced BF and/or vasoconstriction in GI structures can be elicited by prolonged leg cycling( Reference Perko, Nielsen and Skak 9 , Reference Qamar and Read 10 , Reference Rehrer, Smets and Reynaert 14 ) and static handgrip tasks (i.e. small muscle group exercises)( Reference Waaler, Toska and Eriksen 37 ). However, there was no evidence of GI circulatory effects during and after whole-body resistance exercises. If GI hypoperfusion occurred during and/or immediately after resistance exercises, the subsequent GE might be suppressed during the post-ingestion phase. In addition, GI reperfusion may also modulate the rate of GE. Experimental ischaemia–reperfusion of the CA acutely suppressed GE after food ingestion in rats( Reference Suzuki, Suzuki and Horiguchi 38 ). This suppression occurred because of disruption of the interstitial cell Cajal network (i.e. pacemaker cells), which controls GI motility. Suppression also occurs secondary to neuronal NO synthase production, which is related to the regulation of gastric motility via gastric mucosal damage following acute ischaemia–reperfusion( Reference Suzuki, Suzuki and Horiguchi 38 ). During the PE-5 condition, the acute suppression of GE may have been induced by GI hypoperfusion and/or reperfusion after strenuous exercise.
Silva et al.( Reference Silva, Palheta-Junior and Sousa 35 ) reported that, in rats, decreased blood pH immediately after strenuous exercise is associated with acute inhibition of GE. Immediately after exercise, blood lactate concentration was strongly correlated with residual rate for 15 min( Reference Silva, Palheta-Junior and Sousa 35 ). Interestingly, administration of sodium bicarbonate 40 min before exercise onset prevented reduction of blood pH levels immediately after exercise, accelerating GE( Reference Silva, Palheta-Junior and Sousa 35 ). Their results were comparable with our results in that blood lactate concentrations, just before ingestion of a nutrient-rich drink, with or without exercise, were significantly correlated with the rate of GE (i.e. T max-calc).
The relative dominance of sympathetic/parasympathetic activity may also affect GE. In previous research, mental stress, pain and/or cold stimulation of the hand activates the sympathetic nervous system( Reference Herd 39 , Reference Victor, Leimbach and Seals 40 ), potentially suppressing GE( Reference Fone, Horowitz and Maddox 41 , Reference Roland, Dobbeleir and Vandevivere 42 ) and impairing gastric accommodation( Reference Geeraerts, Vandenberghe and Van Oudenhove 43 ). The PE-5 condition seemed to correspond to the highest level of sympathetic activation among the three trials. Here, we observed the highest HR values at 30 min after the ingestion of the nutrient-rich drink. Takarada et al.( Reference Takarada, Nakamura and Aruga 44 ) reported that immediately after resistance exercise with vascular occlusion, norepinephrine levels (which reflect sympathetic tone) peaked, returning to resting baseline levels 15 min after exercise. In addition, PE parasympathetic activation may partly regulate GE. Mild-to-moderate intensity exercise itself enhances subsequent gastric motility in healthy humans( Reference Kato, Sakai and Yabe 45 ) and rats( Reference Wang, Kondo and Suzukamo 46 ), and this enhanced response is absent in vagotomised rats( Reference Wang, Kondo and Suzukamo 46 ). In the present study, following ingestion of the nutrient-rich drink, greater HR was observed during the PE-5 condition than during either the PE-30 or Con condition. Thus, parasympathetic activation during the PE-5 condition seemed to be lower than that observed during other trials. This was presumably related to acute GE suppression.
Increased blood glucose and plasma amino acid concentrations were slower to materialise during the PE-5 condition than either the Con or PE-30 condition. This seemed to be influenced by differences in the rate of GE among the three trials. GE rate is a key factor for determining blood glucose excursion( Reference Marathe, Rayner and Jones 47 ) and SMA BF response( Reference Sidery, Macdonald and Blackshaw 48 ). Therefore, GE rate has been widely used as a measure of post-meal digestion and absorption. At 2 h after ingestion of a nutrient-rich drink, iAUC for BCAA were smaller during the PE-5 condition than during either the Con or PE-30 (nearing a significant difference) condition. This suggested impaired GI absorption during the PE-5 condition. van Wijck et al.( Reference van Wijck, Pennings and van Bijnen 17 ) quantitatively evaluated dietary amino acids using a labelled protein and observed lower plasma dietary amino acid levels immediately after resistance exercise compared with a non-exercise trial. However, our results should be carefully interpreted based on the following points.
First, our results reflect the appearance of amino acids into the blood circulation that were derived from both dietary protein and from muscle protein breakdown and uptake( Reference Levenhagen, Gresham and Carlson 2 ). Therefore, the plasma amino acid responses did not precisely reflect the absolute amount of pure dietary protein absorbed from the small intestine. Second, the time following ingestion of the nutrient-rich drink was relatively short. Specifically, during the PE-5 condition, some participants seemed not to attain peak plasma amino acid response levels. The plasma amino acid response should be measured until it returns to baseline levels. Therefore, future studies should evaluate dietary amino acid kinetics in blood circulation and its uptake into skeletal muscle using a protocol similar to this study.
During the PE-5 trial, the timing of nutrient-rich drink after strenuous resistance exercise was faster for 25 min than in PE-30, and then the PE-5 condition was associated with slower GE (e.g. T max-calc) for 21 min compared with PE-30. According to these results, the effects of timing of nutrient-rich drink ingestion on GE, after strenuous resistance exercise, might not attribute substantive meaning to the subsequent digestive and absorptive rates. However, even if it does, to minimise the magnitude of PE GI distress and anorexia in athletes and training enthusiasts, nutrient ingestion at PE-5 (i.e. immediately after exercise) might be not recommended. The present data provide useful information for preventing GI distress and encouraging effective physical fatigue recovery in athletes. In summary, the timing of dietary supplementation after high-intensity resistance exercise impacts GE, blood glucose, plasma BCAA responses and GI symptoms. Our findings may have implications for future research into the timing of dietary supplementation after exercise.
Acknowledgements
The authors thank the participants for their involvement in this study.
This study was supported by the Japan Society for the Promotion of Science KAKENHI (grant no. 40714746 to H. K. and grant no. 17K01616 to Y. F.).
H. K. and Y. F. conceptualised and designed the study, generated, collected, assembled, analysed and interpreted study data and drafted the revised manuscript. K. S., K. T., R. K., S. T. and T. K. assisted with the collection, assembly, analysis and interpretation of data. M. Y. E. and A. M. assisted with the interpretation of data.
The authors declare that there are no conflicts of interest.


