


Introduction
Characterizing atmospheric properties, including their chemical composition, is one of the main goals of studying exoplanets. By detecting various molecules through transmission spectroscopy (e.g., Sing et al., Reference Sing, Pont, Aigrain, Charbonneau, Désert, Gibson, Gilliland, Hayek, Henry, Knutson, Lecavelier des Etangs, Mazeh and Shporer2011; Nikolov et al., Reference Nikolov, Sing, Pont, Burrows, Fortney, Ballester, Evans, Huitson, Wakeford, Wilson, Aigrain, Deming, Gibson, Henry, Knutson, Lecavelier des Etangs, Showman, Vidal-Madjar and Zahnle2014; Pinhas & Madhusudhan, Reference Pinhas and Madhusudhan2017; Madhusudhan, Reference Madhusudhan2019; Feinstein et al., Reference Feinstein, Radica, Welbanks, Murray, Ohno, Coulombe, Espinoza, Bean, Teske, Benneke, Line, Rustamkulov, Saba, Tsiaras, Barstow, Fortney, Gao, Knutson, MacDonald and Zhang2023; Rustamkulov et al., Reference Rustamkulov, Sing, Mukherjee, May, Kirk, Schlawin, Line, Piaulet, Carter, Batalha, Goyal, Lopez-Morales, Lothringer, MacDonald, Stevenson, Wakeford, Espinoza, Bean and Zieba2023), key ratios such as C/H, O/H, N/O and C/O can be estimated. The C/O ratio is essential in understanding planetary interiors and formation scenarios (e.g., Madhusudhan, Reference Madhusudhan2012; McKay C., Reference McKay2014; Barman et al., Reference Barman, Konopacky, Macintosh and Marois2015; Madhusudhan, Reference Madhusudhan2019). Detecting these ratios depends on the observed bandpass and molecular abundances, which are influenced by the planet’s temperature-pressure profile. Another dependence is the atmospheric scale height, which depends on the surface gravity $g$
and equilibrium temperature
$g$
and equilibrium temperature ${T_{eq}}$
. Planets in the habitable zone (HZ), refer to the region around a star where conditions are just right for liquid water to exist on the surface of a planet (e.g., Madhusudhan, Reference Madhusudhan2019; Sandora & Silk, Reference Sandora and Silk2020). For this reason, the HZ is considered key for spectroscopic biosignature searches as temperate surfaces allow for the significant exchange of gases between the potential biosphere and atmosphere. A biosignature is “an object, substance, and/or pattern whose origin specifically requires a biological agent” (Marais & Walter, Reference Marais and Walter1999; Des Marais et al., Reference Des Marais, Nuth, Allamandola, Boss, Farmer, Hoehler, Jakosky, Meadows, Pohorille, Runnegar and Spormann2008). Therefore, in the event of a potential indication of life, it could be exhibited as a spectral signal that might signify the existence of a gas or a surface feature, conceivably emanating from a biological mechanism. Nonetheless, considering an abiotic genesis remains imperative (Hays et al., Reference Hays, Graham, Des Marais, Hausrath, Horgan, McCollom, Parenteau, Potter-McIntyre, Williams and Lynch2017; Schwieterman et al., Reference Schwieterman, Kiang, Parenteau, Harman, DasSarma, Fisher, Arney, Hartnett, Reinhard, Olson, Meadows, Cockell, Walker, Grenfell, Hegde, Rugheimer, Hu and Lyons2018; Chan et al., Reference Chan, Hinman, Potter-McIntyre, Schubert, Gillams, Awramik, Boston, Bower, Des Marais, Farmer, Jia, King, Hazen, Léveillé, Papineau, Rempfert, Sánchez-Román, Spear, Southam, Stern and Cleaves2019). In this context, microorganisms play a crucial role in producing gases in the Earth’s atmosphere, and understanding their emission patterns can provide valuable insights into the limits of detection on other planets (Schwieterman et al., Reference Schwieterman, Kiang, Parenteau, Harman, DasSarma, Fisher, Arney, Hartnett, Reinhard, Olson, Meadows, Cockell, Walker, Grenfell, Hegde, Rugheimer, Hu and Lyons2018). Carbon monoxide (CO) is a molecule that is crucial to both natural phenomena and human-generated pollution. Although currently rare and limited to specific microorganisms, CO plays a role in important metabolic pathways, such as the Wood-Ljungdahl pathway (WLP) (King & Weber, Reference King and Weber2007a). It is believed to have played a significant role in the early stages of life on Earth, particularly during the era of dominant anaerobic metabolism prior to the Great Oxidation Event. However, CO oxidizes quickly in the presence of oxygen, and its origin is often linked to the oxidation of organic compounds and other geological processes (King & Crosby, Reference King and Crosby2002; King & Weber, Reference King and Weber2007a; King, Reference King2015; Diender et al., Reference Diender, Stams and Sousa2015; Gutierrez-Preciado et al., Reference Gutiérrez-Preciado, Sagha, Moreira, Zivanovic, Deschamps and López-Garca2018; Cordero & Bayly, Reference Cordero, Bayly and Man Leung2019). CO holds immense importance in the fields of biology and astronomy, primarily due to its distinctive spectral characteristics that allow it to be readily detected across various environments. Its presence, particularly in combination with other biosignature gases, can indicate potential biological activity, since it can arise from metabolic processes or geological sources that sustain microbial life. This makes CO a valuable molecule in the search for life on other planets (Madhusudhan, Reference Madhusudhan2019; Madhusudhan et al., Reference Madhusudhan, Sarkar, Constantinou, Holmberg, Piette and Moses2023). However, the role of CO as biosignature is controversial and sometimes called an antibiosignature (Wang et al., Reference Wang, Tian, Li and Hu2016; Schwieterman et al., Reference Schwieterman, Reinhard, Olson, Ozaki, Harman, Hong and Lyons2019). It has been proposed that CO can accumulate in the atmosphere without life due to photochemical reactions, suggesting that its detection could indicate an abiotic environment (Wang et al., Reference Wang, Tian, Li and Hu2016; Wogan & Catling, Reference Wogan and Catling2020; Thompson et al., Reference Thompson, Krissansen-Totton, Wogan, Telus and Fortney2022; Barth et al., Reference Barth, Stüeken, Helling, Schwieterman and Telling2024).
${T_{eq}}$
. Planets in the habitable zone (HZ), refer to the region around a star where conditions are just right for liquid water to exist on the surface of a planet (e.g., Madhusudhan, Reference Madhusudhan2019; Sandora & Silk, Reference Sandora and Silk2020). For this reason, the HZ is considered key for spectroscopic biosignature searches as temperate surfaces allow for the significant exchange of gases between the potential biosphere and atmosphere. A biosignature is “an object, substance, and/or pattern whose origin specifically requires a biological agent” (Marais & Walter, Reference Marais and Walter1999; Des Marais et al., Reference Des Marais, Nuth, Allamandola, Boss, Farmer, Hoehler, Jakosky, Meadows, Pohorille, Runnegar and Spormann2008). Therefore, in the event of a potential indication of life, it could be exhibited as a spectral signal that might signify the existence of a gas or a surface feature, conceivably emanating from a biological mechanism. Nonetheless, considering an abiotic genesis remains imperative (Hays et al., Reference Hays, Graham, Des Marais, Hausrath, Horgan, McCollom, Parenteau, Potter-McIntyre, Williams and Lynch2017; Schwieterman et al., Reference Schwieterman, Kiang, Parenteau, Harman, DasSarma, Fisher, Arney, Hartnett, Reinhard, Olson, Meadows, Cockell, Walker, Grenfell, Hegde, Rugheimer, Hu and Lyons2018; Chan et al., Reference Chan, Hinman, Potter-McIntyre, Schubert, Gillams, Awramik, Boston, Bower, Des Marais, Farmer, Jia, King, Hazen, Léveillé, Papineau, Rempfert, Sánchez-Román, Spear, Southam, Stern and Cleaves2019). In this context, microorganisms play a crucial role in producing gases in the Earth’s atmosphere, and understanding their emission patterns can provide valuable insights into the limits of detection on other planets (Schwieterman et al., Reference Schwieterman, Kiang, Parenteau, Harman, DasSarma, Fisher, Arney, Hartnett, Reinhard, Olson, Meadows, Cockell, Walker, Grenfell, Hegde, Rugheimer, Hu and Lyons2018). Carbon monoxide (CO) is a molecule that is crucial to both natural phenomena and human-generated pollution. Although currently rare and limited to specific microorganisms, CO plays a role in important metabolic pathways, such as the Wood-Ljungdahl pathway (WLP) (King & Weber, Reference King and Weber2007a). It is believed to have played a significant role in the early stages of life on Earth, particularly during the era of dominant anaerobic metabolism prior to the Great Oxidation Event. However, CO oxidizes quickly in the presence of oxygen, and its origin is often linked to the oxidation of organic compounds and other geological processes (King & Crosby, Reference King and Crosby2002; King & Weber, Reference King and Weber2007a; King, Reference King2015; Diender et al., Reference Diender, Stams and Sousa2015; Gutierrez-Preciado et al., Reference Gutiérrez-Preciado, Sagha, Moreira, Zivanovic, Deschamps and López-Garca2018; Cordero & Bayly, Reference Cordero, Bayly and Man Leung2019). CO holds immense importance in the fields of biology and astronomy, primarily due to its distinctive spectral characteristics that allow it to be readily detected across various environments. Its presence, particularly in combination with other biosignature gases, can indicate potential biological activity, since it can arise from metabolic processes or geological sources that sustain microbial life. This makes CO a valuable molecule in the search for life on other planets (Madhusudhan, Reference Madhusudhan2019; Madhusudhan et al., Reference Madhusudhan, Sarkar, Constantinou, Holmberg, Piette and Moses2023). However, the role of CO as biosignature is controversial and sometimes called an antibiosignature (Wang et al., Reference Wang, Tian, Li and Hu2016; Schwieterman et al., Reference Schwieterman, Reinhard, Olson, Ozaki, Harman, Hong and Lyons2019). It has been proposed that CO can accumulate in the atmosphere without life due to photochemical reactions, suggesting that its detection could indicate an abiotic environment (Wang et al., Reference Wang, Tian, Li and Hu2016; Wogan & Catling, Reference Wogan and Catling2020; Thompson et al., Reference Thompson, Krissansen-Totton, Wogan, Telus and Fortney2022; Barth et al., Reference Barth, Stüeken, Helling, Schwieterman and Telling2024).
However, various communities of microorganisms, whether anaerobic or aerobic, could have utilized both CO and CO2 in reversible metabolic reactions, even in this reducing or slightly oxidizing environment, facilitating a slow shift towards an increasingly oxidizing atmosphere (Czaja et al., Reference Czaja, Beukes and Osterhout2016; Gutierrez-Preciado et al., Reference Gutiérrez-Preciado, Sagha, Moreira, Zivanovic, Deschamps and López-Garca2018; Krause et al., Reference Krause, Mills, Zhang, Planavsky, Lenton and Poulton2018). Additionally, the classification of CO as an antibiosignature is complex because biospheres where oxygenic photosynthesis prevails can produce significant CO emissions through the burning of biomass. Moreover, in anoxic biospheres, some CO could still form due to the partial conversion of CH4 to CO. Current ecosystem models suggest that the CH4/CO ratios should be elevated on planets suspected of life (Krissansen-Totton et al., Reference Krissansen-Totton, Thompson, Galloway and Fortney2022).
We have limited knowledge about ancestral anaerobic metabolism; however, the WLP is one of the most ancient metabolisms that still plays a role in modern ecosystems (Adam et al., Reference Adam, Borrel and Gribaldo2018; Cordero & Bayly, Reference Cordero, Bayly and Man Leung2019). The WLP corresponds to an adaptable set of enzymes that allow acetate formation by acetogens with the principal energetic intermediary Acetyl-CoA. Carbon monoxide dehydrogenase (CODH) is a key enzyme in carbon monoxide metabolism, present in various bacteria and archaea under both aerobic and anaerobic conditions (King & Weber, Reference King and Weber2007a; Techtmann et al., Reference Techtmann, Colman, Lebedinsky, Sokolova and Robb2012; Diender et al., Reference Diender, Stams and Sousa2015; Adam et al., Reference Adam, Borrel and Gribaldo2018). This enzyme catalyzes the reversible conversion between CO and CO2, enabling its use as an energy source or metabolic intermediate (Jeoung et al., Reference Jeoung, Fesseler, Goetzl and Dobbek2014, Reference Jeoung, Martins and Dobbek2019). Its role varies depending on the environment and the organism: under aerobic conditions, CODH participates in CO oxidation coupled to the electron transport chain, facilitating energy production in carboxydotrophic bacteria; in anaerobic environments, some CODHs are involved in the reduction of CO2 to CO, primarily in acetogens and methanogens (King & Weber, Reference King and Weber2007b). Structurally and evolutionarily, CODH belongs to a family of enzymes with conserved homologs in both bacteria and archaea, suggesting an early origin, possibly in the Last Universal Common Ancestor (LUCA) (Adam et al., Reference Adam, Borrel and Gribaldo2018; Gutierrez-Preciado et al., Reference Gutiérrez-Preciado, Sagha, Moreira, Zivanovic, Deschamps and López-Garca2018; Adam et al., Reference Adam, Borrel and Gribaldo2019; Jiao et al., Reference Jiao, Fu, Hua, Liu, Salam, Liu, Lv, Wu, Xian, Zhu, Zhou, Fang, Oren, Hedlund, Jiang, Knight, Cheng and Li2021). In certain organisms, CODH can form complexes with other enzymes, such as formate dehydrogenase or membrane quinones, optimizing electron transfer according to the cell’s metabolic needs (King & Weber, Reference King and Weber2007a; Diender et al., Reference Diender, Stams and Sousa2015; Adam et al., Reference Adam, Borrel and Gribaldo2018; Lemaire & Wagner, Reference Lemaire and Wagner2021). In the case of anaerobes, the CODH active site contains [Ni-4Fe-5S], whereas aerobes have molybdenum associated at the active center of the enzyme [CuS-Mo-CODH] (Jeoung et al., Reference Jeoung, Fesseler, Goetzl and Dobbek2014; Diender et al., Reference Diender, Stams and Sousa2015). It is possible to find this metabolism in microorganisms from extreme environments such as serpentinite-hosted system (Merino et al., Reference Merino, Kawai, Boyd, Colman, McGlynn, Nealson, Kurokawa and Hongoh2020) or in the Atacama Desert (Kelley et al., Reference Kelley, Nicholson, Beaudoin, Detweiler and Bebout2014; King, Reference King2015; Gutierrez-Preciado et al., Reference Gutiérrez-Preciado, Sagha, Moreira, Zivanovic, Deschamps and López-Garca2018). In recent years, research in Salar de Llamara, an extreme ecosystem of the Atacama Desert, has expanded our understanding of microbial life in harsh environments. These studies provide valuable insights into the plausibility of similar conditions on exoplanets, making CODH an intriguing target for further investigation (Cabrol et al., Reference Cabrol, Grin, Chong, Minkley, Hock, Yu, Bebout, Fleming, Häder, Demergasso, Gibson, Escudero, Dorador, Lim, Woosley, Morris, Tambley, Gaete, Galvez, Smith, Uskin-Peate, Salazar, Dawidowicz and Majerowicz2009; Cubillos et al., Reference Cubillos, Aguilar, Grágeda and Dorador2018; Merino et al., Reference Merino, Aronson, Bojanova, Feyhl-Buska, Wong, Zhang and Giovannelli2019; Seager et al., Reference Seager, Pętkowski, Gao, Bains, Bryan, Ranjan and Greaves2020).
The Atacama Desert, located in northern Chile between latitude 19° S and 30° S, spreading $ \approx 1000$
km, it is considered the oldest desert on Earth, having been arid since the Jurassic period
$ \approx 1000$
km, it is considered the oldest desert on Earth, having been arid since the Jurassic period $ \approx 150$
Myr ago and transitioning to hyperaridity during the Miocene period (135 million years later) (Bull et al., Reference Bull, Asenjo, Goodfellow and Gomez-Silva2016, Reference Bull, Andrews, Dorador and Goodfellow2018). Extreme environmental conditions characterize the desert, including significant temperature fluctuations throughout the day, high levels of UV radiation and high concentrations of heavy metals and mineral salts. Additionally, its organic content, primarily based on carbon, is exceptionally scarce, ranging between 2 to 50
$ \approx 150$
Myr ago and transitioning to hyperaridity during the Miocene period (135 million years later) (Bull et al., Reference Bull, Asenjo, Goodfellow and Gomez-Silva2016, Reference Bull, Andrews, Dorador and Goodfellow2018). Extreme environmental conditions characterize the desert, including significant temperature fluctuations throughout the day, high levels of UV radiation and high concentrations of heavy metals and mineral salts. Additionally, its organic content, primarily based on carbon, is exceptionally scarce, ranging between 2 to 50 $\mu $
g per gram of soil (Gomez-Silva, Reference Gomez-Silva2010; Valdivia-Silva et al., Reference Valdivia-Silva, Navarro-González, Fletcher, Perez-Montaño, Condori-Apaza and Mckay2012). However, it is possible to find a great diversity and abundance of metabolically active microorganisms, showing microbial groups potentially analogs to those that existed on early Earth (Gutierrez-Preciado et al., Reference Gutiérrez-Preciado, Sagha, Moreira, Zivanovic, Deschamps and López-Garca2018; Dorador et al., Reference Dorador, Molina, Hengst, Eissler, Cornejo-D’Ottone, Fernandez and Pérez2020). Furthermore, a high microbial abundance and diversity are present in the ecosystems of the Atacama Desert and the Andean plateau (locally called the Altiplano), which has led to an increasing emphasis on astrobiological research in these extreme ecosystems in recent years (Tapia et al., Reference Tapia, Gonzalez and Townley2018).
$\mu $
g per gram of soil (Gomez-Silva, Reference Gomez-Silva2010; Valdivia-Silva et al., Reference Valdivia-Silva, Navarro-González, Fletcher, Perez-Montaño, Condori-Apaza and Mckay2012). However, it is possible to find a great diversity and abundance of metabolically active microorganisms, showing microbial groups potentially analogs to those that existed on early Earth (Gutierrez-Preciado et al., Reference Gutiérrez-Preciado, Sagha, Moreira, Zivanovic, Deschamps and López-Garca2018; Dorador et al., Reference Dorador, Molina, Hengst, Eissler, Cornejo-D’Ottone, Fernandez and Pérez2020). Furthermore, a high microbial abundance and diversity are present in the ecosystems of the Atacama Desert and the Andean plateau (locally called the Altiplano), which has led to an increasing emphasis on astrobiological research in these extreme ecosystems in recent years (Tapia et al., Reference Tapia, Gonzalez and Townley2018).
This study measures the spectral bands of CO and CO2 produced by Roseovarius sp. isolated from Salar de Llamara in the Atacama desert, and explores different metabolic pathways, to generate theoretical model atmospheres of early Earth analogs to estimate the feasibility to detect these gases in exoplanetary transmission spectra. This study aims to explore whether the spectral signatures of the gases produced by extremophiles in some of Earth’s harshest environments could serve as potential and detectable biosignatures in the atmospheres of exoplanets with similar conditions. The section Methodology describes the methodology, the section Results and Discussion shows the results and discusses. The theoretical models are shown in the section Atmospheric model. The section Conclusion shows the principal conclusions.
Methodology
Sampling site
Salar de Llamara is located in the Tarapacá Region, Northern Chile, between 69°37′01.02″ W; 21°16′06.42″ S, at 750 meters above sea level. It is one of the few salares with superficial water located in the intermediate depression of the Atacama desert, rather than in the Altiplano. Previously, we identified four bacteria phyla in the literature (Ossandon, Reference Ossandón2015), corresponding to Alphaproteobacteria, Gammaproteobacteria, Bacteroidetes and Firmicutes. Within the Alphaproteobacteria phylum, the species Roseovarius sp. was identified and isolated, which contains the CODH enzyme.
Culture
Roseovarius sp. was isolated and cultured using Marine Broth (MB) medium (Difco Marine Broth 2216, BD, France) under two conditions:
-
(i) Aerobic conditions: The Roseovarius sp. were cultivated at room temperature with ambient CO2 (approximately 0.04 %) and O2 levels.
-
(ii) Anaerobic conditions: The Roseovarius sp. were cultured at room temperature with high CO2 concentrations ( $ \approx 80$
%) using an Anaerocult kit CTM), Merck Millipore, following the manufacturer’s protocol. In anaerobic conditions, bacteria were grown in a chamber designed to optimize the gas concentration in the atmosphere. The kit was activated by applying 6 ml of H2O. The cultivation period lasted two to three days.
$ \approx 80$
%) using an Anaerocult kit CTM), Merck Millipore, following the manufacturer’s protocol. In anaerobic conditions, bacteria were grown in a chamber designed to optimize the gas concentration in the atmosphere. The kit was activated by applying 6 ml of H2O. The cultivation period lasted two to three days.

DNA extraction
An inoculum (7 ml) of Roseovarius sp. from aerobic conditions was centrifugated at 7000 rpm and the pellet was transferred to a microcentrifuge tube of 2 ml. DNA extraction was performed using the DNeasy PowerBiofilm DNA Isolation kit (MoBio Lab, Inc)Footnote 1 , following the manufacturer’s protocol. Here, the cells were lysed using mechanical disruption with silica beads, and both proteins and contaminants were removed through selective precipitation and washing steps. The purified DNA was eluted using a silica membrane column. The concentration and quality of DNA was measured with a NanoDrop spectrophotometer (NanoDrop 8000, Thermo Scientific). The isolated gDNA was sequenced to obtain the genome of Roseovarius sp. using Illumina (Microbial Genome Sequencing Center, Pittsburg, USA).
Bioinformatic analysis
The program KbaseFootnote 2 was used to analyze the genome of Roseovarius sp. This software allows for the upload, analysis of genetic information and generation of in silico models by mapping protein-coding genes to reference pathway collections. The analysis followed a structured pipeline:
-
• A new narrative was created, importing the data in FASTA format and running the FASTQ Reads tool.
-
• Sequences were cleaned using the TRIMMOMATIC tool to remove low-quality reads and adapters.
-
• The cleaned sequences were assembled using SPAdes, a tool optimized for prokaryotic and single-cell data assembly (Allen et al., Reference Allen, Drake, Harris and Sullivan2017), and annotated using the Prokka tool for identifying genetic features.
-
• Specific genes were translated and aligned using NCBI BLAST toolsFootnote 3 to determine the identity percentage with other organisms.
In this study, we focus on the prokaryotic research tools provided by KBase to analyze the genome of Roseovarius sp, isolated from Salar de Llamara. Specifically, we used the SPAdes narrative optimized for single-cell data and annotation apps RAST and Prokka, providing similar results. The identification of some the enzymes is shown in the Table 1.
Table of reactions and their corresponding equations found in the genome of Roseovarius sp.

Vibrational spectroscopy
Raman spectroscopy
Roseovarius sp. was grown under aerobic and anaerobic conditions in a liquid MB medium. The culture was centrifuged at 6000 rpm. The pellet was washed two times with ultra-pure water grade HPLC (Merck). The supernatant was discarded. The pellet obtained was resuspended in 100 $\mu $
L of nanoparticles of gold (AuN; HAuCl4 4 %, sodium citrate 1 %) and silver (AgN; silver nitrate 0.2 %, hydroxylamine hydrochloride 10 %). 5
$\mu $
L of nanoparticles of gold (AuN; HAuCl4 4 %, sodium citrate 1 %) and silver (AgN; silver nitrate 0.2 %, hydroxylamine hydrochloride 10 %). 5 $\mu $
L of the final solution was added to an Au plate and measured with a 785 nm laser Raman spectrometer (Invia Reflex, Renishaw) at 10 % power. The Raman spectroscopy data consisted of a total of 16 spectra acquired under anaerobic conditions and 13 spectra under aerobic conditions, using both gold (Au) and silver (Ag) nanoparticles to enhance signal detection. It was possible to obtain the mean spectrum (Master spectrum) for each condition and nanoparticle. The spectra were processed using signal.butterFootnote
4
from the SciPy Python package to smooth the spectrum and remove the autofluorescence of the samples.
$\mu $
L of the final solution was added to an Au plate and measured with a 785 nm laser Raman spectrometer (Invia Reflex, Renishaw) at 10 % power. The Raman spectroscopy data consisted of a total of 16 spectra acquired under anaerobic conditions and 13 spectra under aerobic conditions, using both gold (Au) and silver (Ag) nanoparticles to enhance signal detection. It was possible to obtain the mean spectrum (Master spectrum) for each condition and nanoparticle. The spectra were processed using signal.butterFootnote
4
from the SciPy Python package to smooth the spectrum and remove the autofluorescence of the samples.
Infrared spectroscopy
Roseovarius sp. was grown on agar plates under aerobic conditions, as described in the Culture Section. Approximately 20 $\mu $
g of biomass was combined with KBr (Merck) to form a tablet, which was analyzed using a Nicolet Avatar 330 FTIR spectrometer, following the manufacturer’s protocol. The resulting spectral data was saved in ASCII format for further analysis. Spectral processing was performed using signal.butter to smooth the spectrum and remove the autofluorescence of the samples.
$\mu $
g of biomass was combined with KBr (Merck) to form a tablet, which was analyzed using a Nicolet Avatar 330 FTIR spectrometer, following the manufacturer’s protocol. The resulting spectral data was saved in ASCII format for further analysis. Spectral processing was performed using signal.butter to smooth the spectrum and remove the autofluorescence of the samples.
Results and discussion
Identification of enzymes involved in carbon metabolism
The metabolism of Roseovarius sp. involves the utilization of carbon monoxide (CO) through a carbon monoxide dehydrogenase (CODH, EC 1.2.5.3), which catalyzes the reversible oxidation of CO to CO2. In our genomic analysis, we identified the genes associated with this enzyme, indicating the presence of a Cu, Mo-type CODH. This type of CODH belongs to the molybdenum-flavoprotein family, which utilizes a pterin-molybdenum cofactor at its active site and, in some cases, includes a copper ion coordinated by a conserved cysteine. The CODH of Roseovarius sp. shares structural and functional similarities with that of Oligotropha carboxydovorans, where the enzyme is composed of three subunits encoded by the coxM-coxS-coxL genes (King & Weber, Reference King and Weber2007b; Jeoung et al., Reference Jeoung, Fesseler, Goetzl and Dobbek2014, Reference Jeoung, Martins and Dobbek2019). The L subunit harbors the molybdopterin cofactor, the S subunit contains two [2Fe-2S] clusters for electron transfer, and the M subunit binds a FAD molecule. The function of these CODHs is crucial for CO metabolism in aerobic and anaerobic environments, enabling electron transfer to quinones in the cytoplasmic membrane and coupling CO oxidation with cellular respiration processes. We identified three subunits for carbon monoxide dehydrogenase (CODH, EC 1.2.5.3): small, medium and large, indicating the ability of Roseovarius sp. to oxidize CO in the cytoplasm. Additionally, we detected formate dehydrogenase (FDH, EC 1.2.1.2), suggesting a role in formate metabolism within the carbon cycle. Other key enzymes related to one-carbon metabolism include (Figure 1):
-
• Formyl-THF synthetase (FHS, EC 6.3.4.3), which catalyzes the activation of formate to formyl-tetrahydrofolate (formyl-THF).
-
• Methenyl-THF cyclohydrolase (MTC, EC 3.5.4.9), which converts formyl-THF to methenyl-THF.
-
• Methylene-THF dehydrogenase (MTD, EC 1.5.1.5), which catalyzes the reduction of methenyl-THF to methylene-THF.
-
• Methylene-THF reductase (MTR, EC 1.5.1.20), which converts methylene-THF to methyl-THF.
Carbon monoxide and one-carbon metabolism in Roseovarius sp. The metabolic pathway involves carbon monoxide dehydrogenase (CODH, EC 1.2.5.3), which catalyzes the oxidation of CO to CO ${_2}$
, along with key enzymes involved in one-carbon metabolism, such as formate dehydrogenase (FDH, EC 1.2.1.2) and tetrahydrofolate (THF)-dependent enzymes. Abbreviations: CODH, CO dehydrogenase; FDH, formate dehydrogenase; FHS, formyl-THF synthetase; MTC, methenyl-THF cyclohydrolase; MTD, Methylene-THF dehydrogenase; MET, methyltransferase; MTR, methylene-THF reductase.
${_2}$
, along with key enzymes involved in one-carbon metabolism, such as formate dehydrogenase (FDH, EC 1.2.1.2) and tetrahydrofolate (THF)-dependent enzymes. Abbreviations: CODH, CO dehydrogenase; FDH, formate dehydrogenase; FHS, formyl-THF synthetase; MTC, methenyl-THF cyclohydrolase; MTD, Methylene-THF dehydrogenase; MET, methyltransferase; MTR, methylene-THF reductase.

Additionally, we identified the presence of dimethyl sulfoxide reductase (DMSO reductase), a key enzyme in the reduction of dimethyl sulfoxide (DMSO) to methyl sulfide (Taylor & Kiene, Reference Taylor and Kiene1989). Two variants of this enzyme were found: Dimethyl sulfoxide reductase (menaquinol-8) (EC 1.8.5.3) catalyzes the reaction: Dimethyl sulfoxide reductase (menaquinol-8) (EC 1.8.5.3) catalyzes the reaction:
 $${\rm{DMSO}} + {\rm{menaquinol}} - 8 \mathbin{\lower.3ex\hbox{$\textstyle\rightleftharpoons \over$}} {H_2}O + {\rm{methylsulfide}} + {\rm{menaquinone}} - 8$$
Similarly, dimethyl sulfoxide reductase (demethylmenaquinol-8) (EC 1.8.5.4) catalyzes the reaction:
 $${\rm{DMSO}} + 2 - {\rm{demethylmenaquinol}} - 8 \mathbin{\lower.3ex\hbox{$\textstyle\rightleftharpoons \over$}} {H_2}O + {\rm{methylsulfide}} + 2 - {\rm{demethylmenaquinone}} - 8$$
On the other hand, nitrogen metabolism in Roseovarius sp. includes the degradation of urea and allophanate through urea amidohydrolase, and urea-1-carboxylate amidohydrolase, generating ammonium and CO2 as final products. Regarding carbon metabolism, we detected the activity of carbonate hydrolyase, suggesting a role in regulating intracellular CO2 levels. Carbon metabolism also involves the activity of decarboxylase enzymes such as S-adenosyl-L-methionine carboxy-lyase, malate: NADP+ oxidoreductase and oxalosuccinate carboxy-lyase, which contribute to energy generation and biosynthesis of metabolic intermediates. Furthermore, the detection of sarcosine oxidase and methanol dehydrogenase suggests a flexible metabolic strategy for the utilization of methylated compounds. Regarding sulfur metabolism, hydrogen-sulfide: NADP+ oxidoreductase was identified, which is involved in hydrogen sulfide oxidation and electron transfer in respiratory processes. Additionally, the presence of oxidative stress response enzymes such as hydrogen-peroxide oxidoreductase highlights the ability of Roseovarius sp. to manage reactive oxygen species in its environment. These results suggest that Roseovarius sp. possesses a highly versatile metabolism, allowing it to adapt to various ecological niches by utilizing diverse carbon, nitrogen and sulfur sources through specialized metabolic pathways.
To further characterize these metabolic capabilities, we compiled a list of key enzymatic reactions identified in the genome of Roseovarius sp., which are summarized in Table 1. The presence of enzymes such as 3-oxopropanoate oxidoreductase and succinyl-CoA:glycine C-succinyltransferase suggests active participation in the degradation and assimilation of key metabolic intermediates. Moreover, the detection of salicylate oxidoreductase indicates the potential for processing aromatic compounds, which may contribute to the breakdown of complex organic matter. Notably, several of these metabolic pathways lead to the production of volatile organic compounds (VOCs) such as formaldehyde and methane-derived intermediates. These VOCs play a crucial role as potential biosignatures, as they can accumulate in planetary atmospheres and serve as indicators of biological activity. The ability of Roseovarius sp. to generate and metabolize these compounds highlights its relevance not only in microbial community interactions but also in astrobiological studies aimed at detecting life through atmospheric signatures.
Discovering biosignatures on exoplanets necessitates integrating several strategies to reduce the chance of false positives and achieve trustworthy outcomes. Given that CO alone does not reliably indicate life’s absence, the recommendation is evaluating the concurrent presence of other gases linked to primitive metabolisms, such as methane (CH4), ammonia (NH3), dimethyl sulfide (DMS), formaldehyde (CH2O), hydrogen sulfide (H2S), molecular hydrogen (H2) and ethane (C2H6). Furthermore, photosynthetic pigments like bacteriochlorophyll, which predominantly absorb in the near-infrared spectrum, could reveal anoxygenic photosynthesis, representing additional biosignatures. The vegetation red edge (VRE) and akin spectral characteristics from microbial mats or other phototrophic groups might further suggest biological processes. Additional volatile biosignatures include organosulfur compounds like methanethiol (CH3SH) and dimethyl disulfide (DMDS), which may accumulate to detectable levels under certain atmospheric conditions. This spectrum of biosignatures emphasizes the need for an approach that examines multiple wavelengths and molecules in the quest for extraterrestrial life (Schwieterman & Leung, Reference Schwieterman and Leung2024).
In environments such as petroleum reservoirs, genera including Roseovarius, Desulfotignum and Archaeoglobus often dominate microbial communities associated with sulfate reduction. In these systems, concentrations of ${\rm{SO}}_4^{2 - }$
ranging from 83 to 534 mg L−1,
${\rm{SO}}_4^{2 - }$
ranging from 83 to 534 mg L−1, ${\rm{SO}}_3^{2 - }$
up to 10.6 mg L−1 in some wells,
${\rm{SO}}_3^{2 - }$
up to 10.6 mg L−1 in some wells, ${\rm{CO}}_3^{2 - }$
between 1.1 and 3.1 g L−1, and
${\rm{CO}}_3^{2 - }$
between 1.1 and 3.1 g L−1, and ${{\rm{S}}_2}{\rm{O}}_3^{2 - }$
from 4 to 150 mg L−1 have been measured in production waters. However, no direct concentrations of gases such as SO3, NH3,
${{\rm{S}}_2}{\rm{O}}_3^{2 - }$
from 4 to 150 mg L−1 have been measured in production waters. However, no direct concentrations of gases such as SO3, NH3, ${\rm{CO}}$
, CO2 or
${\rm{CO}}$
, CO2 or ${\rm{DMS}}$
have been reported in relation to microbial metabolism (Li et al., Reference Li, Liu, Zhou, Mbadinga, Yang, Gu and Mu2017; Slobodkina et al., Reference Slobodkina, Ratnikova, Merkel, Kevbrin, Kuchierskaya and Slobodkin2022). Within this context, formaldehyde (CH2O) represents a central metabolic intermediate in methylotrophic bacteria, participating both in carbon assimilation and in detoxification processes through glutathione-, pterin-, or sugar phosphate-dependent pathways. Because the accumulation of CH2O is highly toxic, its intracellular concentration is tightly regulated; nonetheless, no quantitative measurements or estimations of its potential release into the surrounding environment are currently available (Yurimoto et al., Reference Yurimoto, Kato and Sakai2005; Chen et al., Reference Chen, Djoko, Veyrier and McEwan2016; Guo et al., Reference Guo, Xiong, Kang, Zhu, Yang and Qin2021; Klein et al., Reference Klein, Irla, López, Brautaset and Brito2022).
${\rm{DMS}}$
have been reported in relation to microbial metabolism (Li et al., Reference Li, Liu, Zhou, Mbadinga, Yang, Gu and Mu2017; Slobodkina et al., Reference Slobodkina, Ratnikova, Merkel, Kevbrin, Kuchierskaya and Slobodkin2022). Within this context, formaldehyde (CH2O) represents a central metabolic intermediate in methylotrophic bacteria, participating both in carbon assimilation and in detoxification processes through glutathione-, pterin-, or sugar phosphate-dependent pathways. Because the accumulation of CH2O is highly toxic, its intracellular concentration is tightly regulated; nonetheless, no quantitative measurements or estimations of its potential release into the surrounding environment are currently available (Yurimoto et al., Reference Yurimoto, Kato and Sakai2005; Chen et al., Reference Chen, Djoko, Veyrier and McEwan2016; Guo et al., Reference Guo, Xiong, Kang, Zhu, Yang and Qin2021; Klein et al., Reference Klein, Irla, López, Brautaset and Brito2022).
Vibrational spectroscopy
In the Raman spectra, the y-axis labeled counts refers to the raw intensity of the Raman signal, measured as the number of photons detected at each Raman shift (in cm−1). Higher count values indicate stronger Raman scattering in that specific vibrational mode. The Raman spectra obtained from intact cells of Roseovarius sp. displayed a characteristic Gaussian shape due to inherent autofluorescence. This means that, in the presence of light, cells can emit fluorescence, complicating the interpretation of the Raman spectrum. After applying the smoothing algorithm Signal Butter, significant differences between aerobic and anaerobic conditions became evident (Figure 2). These differences suggest potential shifts in metabolic pathways or structural components, which the environmental conditions may influence during growth.
Master spectrum for Roseovarius sp. in aerobic and anaerobic culture conditions, using silver (Ag) and gold (Au) nanoparticles. The y-axis labeled counts refers to the raw intensity of the Raman signal, measured as the number of photons detected at each Raman shift in the x-axis (in $c{m^{ - 1}}$
). Top representative plots showing the autofluorescence. Bottom Representative plots for the spectra after removing the autofluorescence.
$c{m^{ - 1}}$
). Top representative plots showing the autofluorescence. Bottom Representative plots for the spectra after removing the autofluorescence.

Furthermore, the processed smoothing spectra were thoughtfully segmented into more manageable sections, allowing for a more meticulous analysis of the molecular constituents. A comprehensive comparison of the spectra for both aerobic and anaerobic conditions further highlighted intriguing insights. In aerobic conditions, the peaks in the low wavenumber region were noticeably more accentuated, while in both conditions, peaks were more precisely defined at higher wavenumbers. Notably, the spectral range spanning 250–350 cm−1 was distinguished as containing the highly significant ${\nu _{\left( {F{e_2}{S_2}} \right)}}$
center at 336 cm−1, with its characteristic being more pronounced in the aerobic conditions, as illustrated in Figure 3.
${\nu _{\left( {F{e_2}{S_2}} \right)}}$
center at 336 cm−1, with its characteristic being more pronounced in the aerobic conditions, as illustrated in Figure 3.
Raman spectra (R) between 100 and 700 cm ${^{ - 1}}$
. Top Aerobic conditions with Au (green) and Ag (red) nanoparticles. Bottom anaerobic conditions with Au (blue) and Ag (yellow) nanoparticles. The arrowheads indicate the frequencies for the Fe/S cluster. The y-axis labeled counts refers to the raw intensity of the Raman signal, measured as the number of photons detected at each Raman shift in the x-axis (in
${^{ - 1}}$
. Top Aerobic conditions with Au (green) and Ag (red) nanoparticles. Bottom anaerobic conditions with Au (blue) and Ag (yellow) nanoparticles. The arrowheads indicate the frequencies for the Fe/S cluster. The y-axis labeled counts refers to the raw intensity of the Raman signal, measured as the number of photons detected at each Raman shift in the x-axis (in $c{m^{ - 1}}$
).
$c{m^{ - 1}}$
).

Examining ${\nu _{\left( {Mo - {O_{oxo}}} \right)}}$
, which is situated in two distinct positions, between 835 to 898 cm−1 denoting the antisymmetric form and 858 to 938 cm−1 reflecting the symmetric form, we observe its notable presence. Likewise, an observed peak at 1400 cm−1 aligns with the
${\nu _{\left( {Mo - {O_{oxo}}} \right)}}$
, which is situated in two distinct positions, between 835 to 898 cm−1 denoting the antisymmetric form and 858 to 938 cm−1 reflecting the symmetric form, we observe its notable presence. Likewise, an observed peak at 1400 cm−1 aligns with the ${\nu _{\left( {FAD} \right)}}$
group (Figure 4). Moreover, the distinctive
${\nu _{\left( {FAD} \right)}}$
group (Figure 4). Moreover, the distinctive ${\nu _{\left( {CO} \right)}}$
signature has been documented within regions spanning 1990 to 2100 cm−1, while we detected a conspicuous peak near 1996 cm−1 (Figure 5). This comprehensive understanding of the spectra is further corroborated by findings from infrared spectra (IR), where an analogous band appears at 1650 cm−1, specifically corresponding to
v
(co)
, and was obtained through the use of a KBr pellet (Figure 6). Remarkably, the findings from IR for both aerobic and anaerobic culture conditions consistently mirror the same pattern and trends.
${\nu _{\left( {CO} \right)}}$
signature has been documented within regions spanning 1990 to 2100 cm−1, while we detected a conspicuous peak near 1996 cm−1 (Figure 5). This comprehensive understanding of the spectra is further corroborated by findings from infrared spectra (IR), where an analogous band appears at 1650 cm−1, specifically corresponding to
v
(co)
, and was obtained through the use of a KBr pellet (Figure 6). Remarkably, the findings from IR for both aerobic and anaerobic culture conditions consistently mirror the same pattern and trends.
The Raman spectra (R) between 700 and 1600 cm ${^{ - 1}}$
. Top Aerobic conditions with Au (green) and Ag (red) nanoparticles. Bottom anaerobic conditions with Au (blue) and Ag (yellow) nanoparticles. The arrowheads indicate the frequencies for Mo-O asymmetric (purple) and symmetric (black) modes. The gray arrowhead indicates the range of frequencies for FAD group. The y-axis labeled counts refers to the raw intensity of the Raman signal, measured as the number of photons detected at each Raman shift in the x-axis (in
${^{ - 1}}$
. Top Aerobic conditions with Au (green) and Ag (red) nanoparticles. Bottom anaerobic conditions with Au (blue) and Ag (yellow) nanoparticles. The arrowheads indicate the frequencies for Mo-O asymmetric (purple) and symmetric (black) modes. The gray arrowhead indicates the range of frequencies for FAD group. The y-axis labeled counts refers to the raw intensity of the Raman signal, measured as the number of photons detected at each Raman shift in the x-axis (in $c{m^{ - 1}}$
).
$c{m^{ - 1}}$
).

The Raman spectra (R) between 1500 and 2200 cm ${^{ - 1}}$
. Top aerobic conditions with Au (green) and Ag (red) nanoparticles. Bottom anaerobic conditions with Au (blue) and Ag (yellow) nanoparticles. Red arrowheads indicate the frequencies for CO molecules. The y-axis labeled counts refers to the raw intensity of the Raman signal, measured as the number of photons detected at each Raman shift in the x-axis (in
${^{ - 1}}$
. Top aerobic conditions with Au (green) and Ag (red) nanoparticles. Bottom anaerobic conditions with Au (blue) and Ag (yellow) nanoparticles. Red arrowheads indicate the frequencies for CO molecules. The y-axis labeled counts refers to the raw intensity of the Raman signal, measured as the number of photons detected at each Raman shift in the x-axis (in $c{m^{ - 1}}$
).
$c{m^{ - 1}}$
).

The infrared spectra (IR) between 1500 and 2500 cm ${^{ - 1}}$
for aerobic and anaerobic conditions. The black arrowhead indicates the frequencies for CO using KBr pellet at 1650 cm
${^{ - 1}}$
for aerobic and anaerobic conditions. The black arrowhead indicates the frequencies for CO using KBr pellet at 1650 cm ${^{ - 1}}$
. The red arrowhead indicates the frequencies for CO observed in Raman at 1996 cm
${^{ - 1}}$
. The red arrowhead indicates the frequencies for CO observed in Raman at 1996 cm ${^{ - 1}}$
. The y-axis is given in arbitrary units (AU), which reflect the relative absorbance intensity of specific molecular vibrations and the x-axis in function of wavenumber (in
${^{ - 1}}$
. The y-axis is given in arbitrary units (AU), which reflect the relative absorbance intensity of specific molecular vibrations and the x-axis in function of wavenumber (in $c{m^{ - 1}}$
).
$c{m^{ - 1}}$
).

While the Raman spectrum revealed some distinctions (Figure 2), the IR spectrum showed no noticeable variations between the two conditions (Figure 6). In the IR spectra, the y-axis is given in arbitrary units (AU), which reflect the relative absorbance intensity of specific molecular vibrations. In this case, higher values correspond to greater absorption of IR radiation at those wavelengths, which is characteristic of specific functional groups. It is worth noting that differences observed in the Raman spectrum are affected by spectral resolution, as biological samples often exhibit fluorescence resembling a Gaussian shape. This fluorescence can interfere with peak assignment, but such interference can be mitigated through subtraction techniques (Saveliev et al., Reference Saveliev, Galeeva, Semanov, Galeev, Aryslanov, Falaleeva and Davletshin2022). Water and methane are critical components in the atmospheric model as they have significant implications for the habitability and origins of life (Schulze-Makuch et al., Reference Schulze-Makuch, Irwin and Guan2002; Molaverdikhani et al., Reference Molaverdikhani, Henning and Mollière2020). Water, which is considered a universal solvent, facilitates chemical reactions within organisms, occupying up to 70 % of the cell volume and the CO or CO2, on the other hand, serves as a carbon source and is involved in several metabolic pathways (Ragsdale, Reference Ragsdale2004; King & Weber, Reference King and Weber2007a; Ragsdale & Pierce, Reference Ragsdale and Pierce2008; Bengelsdorf et al., Reference Bengelsdorf, Beck, Erz, Hoffmeister, Karl, Riegler, Wirth, Poehlein, Weuster-Botz, Dürre, Sariaslani and Gadd2018; Lemaire &Wagner, Reference Lemaire and Wagner2021). Eliminating residual water is challenging in our case due to the biological nature of the samples, where the fundamental structure, the cell, consists of approximately 70 % water. This intense band obscures other vibrational frequencies, such as C-H (around 3400 and 3200 cm−1), typically present in biological samples but difficult to identify in our specific case. Consequently, the IR analysis sample must contain minimal water (Nakamoto, Reference Nakamoto2008). However, Signal Butter mitigated this interference. Another alternative approach to obtain a better IR spectrum is to work with purified enzyme samples. However, achieving purification while maintaining enzyme activity poses challenges and falls outside this project’s scope. Nevertheless, metalloproteins offer several advantages for Raman spectroscopy, particularly for aqueous samples. One advantage is the ease of working with water as a solvent since it is a weak Raman scatterer, allowing for clearer signal detection. Additionally, metalloproteins exhibit signal enhancement through the resonance Raman effect, further improving the sensitivity and specificity of the Raman measurements (Kirk et al., Reference Kirk, Lepluart and Yang2022). Furthermore, molecules can be detected through vibrational transitions, observable in IR or Raman (R) spectra. The CODH enzyme comprises three subunits. Within the CoxL subunit, the active site is discernible, while the CoxM subunit houses the FAD, and the diminutive CoxS subunit accommodates the [Fe2S2] group (Rovaletti et al., Reference Rovaletti, Bruschi, Moro, Cosentino, Greco and Ryde2019). It has been reported that several frequencies for
v
(co)
fall within the range of 1872 to 1999 cm−1 (Sugimoto et al., Reference Sugimoto, Siren, Tsukube and Tanaka2003; Ragsdale, Reference Ragsdale2004; Harrop & Mascharak, Reference Harrop and Mascharak2005; Clark et al., Reference Clark, Grice, Moore, Rheingold and Kubiak2014; Liu et al., Reference Liu, Yang, Zheng, Zhang and Yang2017; Shi et al., Reference Shi, Yu, Ba, Zhang, Zhou and Yu2017; Gourlay et al., Reference Gourlay, Nielsen, Evans, White and Young2018) with an additional peak at 1670 cm−1 using KBr pellet in IR (Liu et al., Reference Liu, Yang, Zheng, Zhang and Yang2017; Shi et al., Reference Shi, Yu, Ba, Zhang, Zhou and Yu2017). Typically, the observed peak shape for CO binding consists of a doublet, but in our case, numerous interferences rendered it unappreciable. It is essential to mention that the bound CO or CO2 with the active center of the enzyme is unstable, allowing for the identification of the triple bond of CO in one part of the reaction mechanism, which occurs extremely rapidly (Ragsdale & Pierce, Reference Ragsdale and Pierce2008). Additionally, the reaction mechanisms for each step can influence the vibrations of the bound molecules, potentially leading to increased instability, however using the density functional theory (DFT) function could obtain the spectra for all intermediate in the reaction (e.g., Hansen et al., Reference Hansen, Varley, Peterson and Nørskov2013; Ghosh et al., Reference Ghosh, Sinhababu, Santarsiero and Mankad2020; Kim et al., Reference Kim, Lee and Seo2021). The presence of a symmetry element in resonance Raman spectroscopy simplifies the spectral analysis by distinguishing between symmetric (sym) and asymmetric (asym) vibrational modes ( $\delta $
O-Mo-O). Within a four-atom core, there are six vibrational modes, including the symmetric stretching vibrations of Mo-O
$\delta $
O-Mo-O). Within a four-atom core, there are six vibrational modes, including the symmetric stretching vibrations of Mo-O ${\nu _{\left( {MoO} \right)}}$
and S-Mo-S
${\nu _{\left( {MoO} \right)}}$
and S-Mo-S ${\nu _{\left( {MoS} \right)}}$
. This is the reason why vibrations are observed within a specific range of frequencies for sym 858 to 938 cm−1 and asym 835 to 898 cm−1; additionally, the
${\nu _{\left( {MoS} \right)}}$
. This is the reason why vibrations are observed within a specific range of frequencies for sym 858 to 938 cm−1 and asym 835 to 898 cm−1; additionally, the ${\nu _{\left( {FAD} \right)}}$
it is reported at 1300–1400 cm−1 and in the range of 250 cm−1 to 350 cm−1 appears a cluster of Fe/S (Zhang et al., Reference Zhang, Hemann and Hille2010; Kirk et al., Reference Kirk, Lepluart and Yang2022). In our study, we examined the resonance Raman spectra of CODH from Roseovarius sp. revealing distinct vibrational modes associated with the three subunits, Mo active center in CoxL (Figure 4), FAD group in CoxM (Figure 4) and Fe/S clusters in CoxS (Figure 3). In Figure 4 also observes differences between the two conditions and using different nanoparticles. This may be associated with the vibrational state of the cell at the time of measurement. Furthermore, we can detect the existence of a band that may correspond to the
${\nu _{\left( {FAD} \right)}}$
it is reported at 1300–1400 cm−1 and in the range of 250 cm−1 to 350 cm−1 appears a cluster of Fe/S (Zhang et al., Reference Zhang, Hemann and Hille2010; Kirk et al., Reference Kirk, Lepluart and Yang2022). In our study, we examined the resonance Raman spectra of CODH from Roseovarius sp. revealing distinct vibrational modes associated with the three subunits, Mo active center in CoxL (Figure 4), FAD group in CoxM (Figure 4) and Fe/S clusters in CoxS (Figure 3). In Figure 4 also observes differences between the two conditions and using different nanoparticles. This may be associated with the vibrational state of the cell at the time of measurement. Furthermore, we can detect the existence of a band that may correspond to the ${\nu _{\left( {CO} \right)}}$
at 1996 cm−1. This was previously reported by (Ragsdale, Reference Ragsdale2004) for the active center of Ni-CODH. However, upon comparing the mechanisms of both enzymes, Mo-CODH (Jeoung et al., Reference Jeoung, Martins and Dobbek2019) and Ni-CODH (Ragsdale, Reference Ragsdale2004), it becomes apparent that the vibration of the CO molecule corresponds to the triple bond. Hence, it is also plausible to attribute this signal to the Mo-CODH enzyme.
${\nu _{\left( {CO} \right)}}$
at 1996 cm−1. This was previously reported by (Ragsdale, Reference Ragsdale2004) for the active center of Ni-CODH. However, upon comparing the mechanisms of both enzymes, Mo-CODH (Jeoung et al., Reference Jeoung, Martins and Dobbek2019) and Ni-CODH (Ragsdale, Reference Ragsdale2004), it becomes apparent that the vibration of the CO molecule corresponds to the triple bond. Hence, it is also plausible to attribute this signal to the Mo-CODH enzyme.
Overall, the combined evidence from genomic analysis and vibrational spectroscopy (Raman and IR) supports the presence of metabolic pathways in Roseovarius sp. capable of producing and releasing gases of potential astrobiological relevance. The identification of characteristic vibrational modes associated with CO, Fe/S, Mo–O and FAD groups, together with the genomic detection of key enzymes such as CODH, indicates an active carbon monoxide metabolism under both aerobic and anaerobic conditions. This suggests that Roseovarius sp. may participate in redox processes involving CO and CO2, potentially contributing trace gaseous compounds that could serve as spectral biosignatures in analog environments. Therefore, these results provide an integrative line of evidence linking molecular vibrations, enzymatic function and metabolic potential, reinforcing the role of Roseovarius as a relevant model for studying early Earth and extraterrestrial microbial analogs.
Atmospheric model
Selection data for theoretical model atmospheres
To compute theoretical transmission spectra for early Earth analogs, we used the radiative-transfer package petitRADTRANS (Mollière, P. et al., Reference Mollière, Wardenier, van Boekel, Henning, Molaverdikhani and Snellen2019) in its line-by-line modeFootnote
5
. Unless otherwise stated, the baseline atmosphere is hydrogen-dominated with a background mixture of H ${{\rm{\;}}_2}$
/He = 0.85/0.15 by volume. Collision-induced absorption (CIA) from H2–H2 and H2–He pairs and Rayleigh scattering by H2 and He are included consistently. The model assumes an isothermal temperature of 293 K, an Earth-mass and Earth-radius planet (
${{\rm{\;}}_2}$
/He = 0.85/0.15 by volume. Collision-induced absorption (CIA) from H2–H2 and H2–He pairs and Rayleigh scattering by H2 and He are included consistently. The model assumes an isothermal temperature of 293 K, an Earth-mass and Earth-radius planet ( ${M_ \oplus }$
,
${M_ \oplus }$
, ${R_ \oplus }$
) and a logarithmically spaced pressure grid from 10−1 to 102 bar (100 layers). Spectra are reported as absolute transit radii referenced to
${R_ \oplus }$
) and a logarithmically spaced pressure grid from 10−1 to 102 bar (100 layers). Spectra are reported as absolute transit radii referenced to ${P_{{\rm{ref}}}} = 0.01$
bar. The wavelength coverage spans 0.30–16
${P_{{\rm{ref}}}} = 0.01$
bar. The wavelength coverage spans 0.30–16 $\mu $
m, encompassing the optical through mid-infrared range (HST/STIS to JWST/MIRI). Radiative transfer is performed on the native petitRADTRANS grid; for figure clarity, the spectra are smoothed to resolving powers of
$\mu $
m, encompassing the optical through mid-infrared range (HST/STIS to JWST/MIRI). Radiative transfer is performed on the native petitRADTRANS grid; for figure clarity, the spectra are smoothed to resolving powers of $R\sim 120$
–
$R\sim 120$
– $300$
using a logarithmic kernel. For comparison with CO2-dominated hypotheses, we also computed a secondary background with CO2/H2O=0.95/0.04, preserving the same pressure-temperature structure and radiative setup; these runs are used only where explicitly indicated.
$300$
using a logarithmic kernel. For comparison with CO2-dominated hypotheses, we also computed a secondary background with CO2/H2O=0.95/0.04, preserving the same pressure-temperature structure and radiative setup; these runs are used only where explicitly indicated.
We computed two model sets at each abundance level: (i) a cloud-free case (“clear”) and (ii) a cloudy case including an opaque, gray H2O cloud deck with top at ${P_{{\rm{cloud}}}} = 0.01$
bar. This simplified treatment captures the first-order muting of spectral features without introducing additional microphysics. Although petitRADTRANS supports Mie or DHS scattering using measured optical constants (e.g., Molliere et al., Reference Mollière, van Boekel, Dullemond, Henning and Mordasini2015, Reference Mollière, van Boekel, Bouwman, Henning, Lagage and Min2017; Molliere, P. et al., Reference Mollière, Wardenier, van Boekel, Henning, Molaverdikhani and Snellen2019), these options were not employed here. The set of trace gases comprises CO, CO
${P_{{\rm{cloud}}}} = 0.01$
bar. This simplified treatment captures the first-order muting of spectral features without introducing additional microphysics. Although petitRADTRANS supports Mie or DHS scattering using measured optical constants (e.g., Molliere et al., Reference Mollière, van Boekel, Dullemond, Henning and Mordasini2015, Reference Mollière, van Boekel, Bouwman, Henning, Lagage and Min2017; Molliere, P. et al., Reference Mollière, Wardenier, van Boekel, Henning, Molaverdikhani and Snellen2019), these options were not employed here. The set of trace gases comprises CO, CO ${{\rm{\;}}_2}$
, CH
${{\rm{\;}}_2}$
, CH ${{\rm{\;}}_4}$
, NH
${{\rm{\;}}_4}$
, NH ${{\rm{\;}}_3}$
, H
${{\rm{\;}}_3}$
, H ${{\rm{\;}}_2}$
CO and SO
${{\rm{\;}}_2}$
CO and SO ${{\rm{\;}}_3}$
, each assumed to have a vertically uniform mixing ratio. Seven abundance levels were explored, equally spaced in decades from
${{\rm{\;}}_3}$
, each assumed to have a vertically uniform mixing ratio. Seven abundance levels were explored, equally spaced in decades from $1$
ppb to
$1$
ppb to $1000$
ppm (i.e., 10−9–10−3 in volume mixing ratio). All trace species were scaled jointly by the same factor in both the clear and cloudy configurations, yielding the spectra shown in Figures 7 and 8.
$1000$
ppm (i.e., 10−9–10−3 in volume mixing ratio). All trace species were scaled jointly by the same factor in both the clear and cloudy configurations, yielding the spectra shown in Figures 7 and 8.
Transmission spectra for an H ${\;_2}$
–He background atmosphere. Top: clear model. Bottom: cloudy model with an H
${\;_2}$
–He background atmosphere. Top: clear model. Bottom: cloudy model with an H ${\;_2}$
O cloud top at 0.010 bar. Transit radius
${\;_2}$
O cloud top at 0.010 bar. Transit radius ${R_{tr}}$
is plotted in
${R_{tr}}$
is plotted in ${R_ \oplus }$
, with trace-gas volume mixing ratios ranging from 1 ppb to 1000 ppm (dark
${R_ \oplus }$
, with trace-gas volume mixing ratios ranging from 1 ppb to 1000 ppm (dark $ \to $
light). Major molecular features (CO
$ \to $
light). Major molecular features (CO ${_2}$
, CO, CH
${_2}$
, CO, CH ${_4}$
, NH
${_4}$
, NH ${_3}$
, H
${_3}$
, H ${_2}$
CO, SO
${_2}$
CO, SO ${_3}$
, etc.) are indicated with arrows. The “1 H” bar shows the scale height at the model reference state. Red horizontal lines indicate the equivalent radius offsets corresponding to a
${_3}$
, etc.) are indicated with arrows. The “1 H” bar shows the scale height at the model reference state. Red horizontal lines indicate the equivalent radius offsets corresponding to a $50$
ppm transit-depth sensitivity for host stars with
$50$
ppm transit-depth sensitivity for host stars with ${R_{\rm aa}} = 0.60{R_{\rm e}}$
and
${R_{\rm aa}} = 0.60{R_{\rm e}}$
and $0.12{R_{\rm e}}$
.
$0.12{R_{\rm e}}$
.

Transmission spectra for an early-Earth-like atmosphere with a CO ${_2}$
–N
${_2}$
–N ${_2}$
background. Top: clear case. Bottom: cloudy case with an opaque H
${_2}$
background. Top: clear case. Bottom: cloudy case with an opaque H ${_2}$
O cloud top at 0.010 bar. Curves show the wavelength-dependent transit radius
${_2}$
O cloud top at 0.010 bar. Curves show the wavelength-dependent transit radius ${R_{\rm tr}}$
in units of
${R_{\rm tr}}$
in units of ${R_ \oplus }$
for a sequence of trace-gas abundances from 1 ppb to 1000 ppm (dark
${R_ \oplus }$
for a sequence of trace-gas abundances from 1 ppb to 1000 ppm (dark $ \to $
light). Labeled arrows mark prominent bands of selected species (CO
$ \to $
light). Labeled arrows mark prominent bands of selected species (CO ${_2}$
, CO, CH
${_2}$
, CO, CH ${_4}$
, NH
${_4}$
, NH ${_3}$
, H
${_3}$
, H ${_2}$
CO, SO
${_2}$
CO, SO ${_2}$
, SO
${_2}$
, SO ${_3}$
and H
${_3}$
and H ${_2}$
O). The vertical “1 H” bar indicates the atmospheric scale height at the reference conditions used in the model. Red horizontal lines mark the effective
${_2}$
O). The vertical “1 H” bar indicates the atmospheric scale height at the reference conditions used in the model. Red horizontal lines mark the effective $50$
ppm transit-depth sensitivity converted to an equivalent radius offset for host stars with
$50$
ppm transit-depth sensitivity converted to an equivalent radius offset for host stars with ${R_{\rm aa}} = 0.60{R_{\rm e}}$
and
${R_{\rm aa}} = 0.60{R_{\rm e}}$
and $0.12{R_{\rm e}}$
.
$0.12{R_{\rm e}}$
.

This configuration ensures that the relative amplitudes of the 4.3 $\mu $
m CO
$\mu $
m CO ${{\rm{\;}}_2}$
band, the 4.67
${{\rm{\;}}_2}$
band, the 4.67 $\mu $
m CO band, the CH
$\mu $
m CO band, the CH ${{\rm{\;}}_4}$
features near 3.3 and 7.7
${{\rm{\;}}_4}$
features near 3.3 and 7.7 $\mu $
m, the NH
$\mu $
m, the NH ${{\rm{\;}}_3}$
feature around 10.5
${{\rm{\;}}_3}$
feature around 10.5 $\mu $
m and the H
$\mu $
m and the H ${{\rm{\;}}_2}$
CO/SO
${{\rm{\;}}_2}$
CO/SO ${{\rm{\;}}_3}$
features between 3.5–9
${{\rm{\;}}_3}$
features between 3.5–9 $\mu $
m arise solely from their intrinsic opacities under a consistent radiative framework. In the cloudy cases, the reduced amplitudes reflect the shorter atmospheric path above the cloud deck and thus provide a conservative detectability bound.
$\mu $
m arise solely from their intrinsic opacities under a consistent radiative framework. In the cloudy cases, the reduced amplitudes reflect the shorter atmospheric path above the cloud deck and thus provide a conservative detectability bound.
Theoretical model atmospheres
Figures 7 and 8 show the synthetic transmission spectra of an Earth-sized exoplanet under two representative background compositions: H2–He (top) and CO2–N2 (bottom). For each case, we compare clear and cloudy atmospheres, where the cloudy scenario includes an opaque H2O cloud deck at ${P_{{\rm{cloud}}}} = 0.010$
bar. The spectra display absorption features from 0.3 to 16
${P_{{\rm{cloud}}}} = 0.010$
bar. The spectra display absorption features from 0.3 to 16 $\mu $
m for CO, CO2, CH4, NH3, H2CO and SO3, calculated at seven concentration levels from 1 ppb to 1000 ppm (dark
$\mu $
m for CO, CO2, CH4, NH3, H2CO and SO3, calculated at seven concentration levels from 1 ppb to 1000 ppm (dark $ \to $
light lines). The presence of clouds significantly attenuates the spectral amplitudes, yet major features remain detectable even in the most obscured cases. In particular, the SO
$ \to $
light lines). The presence of clouds significantly attenuates the spectral amplitudes, yet major features remain detectable even in the most obscured cases. In particular, the SO ${{\rm{\;}}_3}$
bands near 7.2–9.0
${{\rm{\;}}_3}$
bands near 7.2–9.0 $\mu $
m retain strong contrast, suggesting that sulfur-bearing species may be observable despite high-altitude cloud layers. CH
$\mu $
m retain strong contrast, suggesting that sulfur-bearing species may be observable despite high-altitude cloud layers. CH ${{\rm{\;}}_4}$
shows distinct bands near 3.3 and 7.7
${{\rm{\;}}_4}$
shows distinct bands near 3.3 and 7.7 $\mu $
m, while NH
$\mu $
m, while NH ${{\rm{\;}}_3}$
produces broader absorption near 10.5
${{\rm{\;}}_3}$
produces broader absorption near 10.5 $\mu $
m. Formaldehyde (H2CO) exhibits two prominent bands at 3.6 and 5.8
$\mu $
m. Formaldehyde (H2CO) exhibits two prominent bands at 3.6 and 5.8 $\mu $
m, overlapping with weak SO
$\mu $
m, overlapping with weak SO ${{\rm{\;}}_3}$
features, potentially revealing complex C–S–O chemistry. Both CO and CO
${{\rm{\;}}_3}$
features, potentially revealing complex C–S–O chemistry. Both CO and CO ${{\rm{\;}}_2}$
show deep bands at 4.67 and 4.3
${{\rm{\;}}_2}$
show deep bands at 4.67 and 4.3 $\mu $
m, respectively, consistent with previous early Earth atmospheric models.
$\mu $
m, respectively, consistent with previous early Earth atmospheric models.
Because transmission spectroscopy probes the wavelength-dependent variation in transit depth rather than its absolute value, the observable quantity corresponds to the differential transit depth, defined as (Kreidberg, Reference Kreidberg, Deeg and Belmonte2018):
 $$\Delta \delta = {{R_{{\rm{eff}}}^2 - R_p^2} \over {R_{\rm{*}}^2}},$$
where ${R_{{\rm{eff}}}}$
is the effective planetary radius including the atmospheric contribution,
${R_{{\rm{eff}}}}$
is the effective planetary radius including the atmospheric contribution, ${R_p}$
is the solid-body radius at the reference pressure level and
${R_p}$
is the solid-body radius at the reference pressure level and ${R_{\rm{*}}}$
is the stellar radius. Assuming
${R_{\rm{*}}}$
is the stellar radius. Assuming ${R_{{\rm{eff}}}} \approx {R_p} + nH$
, where
${R_{{\rm{eff}}}} \approx {R_p} + nH$
, where $H$
is the atmospheric scale height and
$H$
is the atmospheric scale height and $n$
is the number of scale heights contributing to absorption, Equation. 1 simplifies to:
$n$
is the number of scale heights contributing to absorption, Equation. 1 simplifies to:
 $$\Delta \delta \approx {{2nH{R_p}} \over {R_{\rm{*}}^2}}.$$
This expression highlights how detectability depends on the stellar size and the planet’s scale height. The red horizontal lines in Figures 7 and 8 illustrate the equivalent radius offsets corresponding to a $50$
ppm sensitivity for host stars of
$50$
ppm sensitivity for host stars of ![]() and
and $0.12{\rm{\;}}{R_{\rm{e}}}$
, approximately representative of early- and late-type M dwarfs. Spectral features that exceed these thresholds would, in principle, be detectable with JWST/MIRI-like precision.
$0.12{\rm{\;}}{R_{\rm{e}}}$
, approximately representative of early- and late-type M dwarfs. Spectral features that exceed these thresholds would, in principle, be detectable with JWST/MIRI-like precision.
Although sulfur trioxide (SO ${_3}$
) is not expected to be a direct gaseous metabolic product of Roseovarius sp. due to its high reactivity and rapid hydrolysis to sulfuric acid in aqueous environments, its detection can be considered as an indirect indicator of sulfur metabolism. In contrast, sulfite (SO
${_3}$
) is not expected to be a direct gaseous metabolic product of Roseovarius sp. due to its high reactivity and rapid hydrolysis to sulfuric acid in aqueous environments, its detection can be considered as an indirect indicator of sulfur metabolism. In contrast, sulfite (SO ${_3^{2 - }}$
) is a known intermediate in sulfur-oxidizing bacteria’s dissimilatory and assimilatory sulfur metabolism pathways, and likely represents a genuine metabolic product in Roseovarius sp. In some cases, when dimethyl sulfide (DMS) – a common volatile sulfur compound produced by Roseovarius – is absent or below detection limits, sulfur-containing atmospheric signals resembling SO3 may arise from oxidation of sulfite or other sulfur intermediates, as well as environmental photochemical transformations. Therefore, SO
${_3^{2 - }}$
) is a known intermediate in sulfur-oxidizing bacteria’s dissimilatory and assimilatory sulfur metabolism pathways, and likely represents a genuine metabolic product in Roseovarius sp. In some cases, when dimethyl sulfide (DMS) – a common volatile sulfur compound produced by Roseovarius – is absent or below detection limits, sulfur-containing atmospheric signals resembling SO3 may arise from oxidation of sulfite or other sulfur intermediates, as well as environmental photochemical transformations. Therefore, SO ${_3}$
-related signals are more likely to reflect downstream chemical processes of microbial sulfur metabolism rather than stable, excreted metabolites. Similarly, formaldehyde (CH2O) is highly soluble in water and chemically reactive, which limits its direct accumulation in the environment. Nevertheless, its presence indicates active one-carbon metabolism, as supported by genes encoding enzymes such as sarcosine oxidase and methanol dehydrogenase in the genome of Roseovarius sp., suggesting the production of formaldehyde as an intermediate during the oxidation of methylated compounds. These volatile compounds and their metabolic intermediates are important biosignatures reflecting the complex metabolic networks of Roseovarius sp. and its ecological role in biogeochemical cycles.
${_3}$
-related signals are more likely to reflect downstream chemical processes of microbial sulfur metabolism rather than stable, excreted metabolites. Similarly, formaldehyde (CH2O) is highly soluble in water and chemically reactive, which limits its direct accumulation in the environment. Nevertheless, its presence indicates active one-carbon metabolism, as supported by genes encoding enzymes such as sarcosine oxidase and methanol dehydrogenase in the genome of Roseovarius sp., suggesting the production of formaldehyde as an intermediate during the oxidation of methylated compounds. These volatile compounds and their metabolic intermediates are important biosignatures reflecting the complex metabolic networks of Roseovarius sp. and its ecological role in biogeochemical cycles.
For practical observability, the spectral amplitudes in Figures 7 and 8 correspond to variations of tens to hundreds of parts per million (ppm) in transit depth. These levels are comparable to the precision achieved in current JWST/MIRI and NIRSpec observations for temperate terrestrial exoplanets orbiting M dwarfs (e.g., Sebastian et al., Reference Sebastian, Gillon, Ducrot, Pozuelos, Garcia, Günther, Delrez, Queloz, Demory, Triaud, Burgasser, de Wit, Burdanov, Dransfield, Jehin, McCormac, Murray, Niraula, Pedersen, Rackham, Sohy, Thompson and Grootel2020; Wit et al., Reference Wit, Doyon, Rackham, Lim, Ducrot, Kreidberg, Benneke, Ribas, Berardo, Niraula, Iyer, Shapiro, Kostogryz, Witzke, Gillon, Agol, Meadows, Burgasser, Owen, Fortney, Selsis, Bello-Arufe, Bolmont, Dong, Drake, Garcia, Greene, Haworth, Hu, Kane, Kervella, Koll, Krissansen-Totton, Lagage, Lichtenberg, Lustig-Yaeger, Lingam, Turbet, Seager, Barkaoui, Bell, Burdanov, Cadieux, Charnay, Cloutier, Cook, Correia, Dang, Daylan, Delrez, Edwards, Fauchez, Flagg, Fraschetti, Haqq-Misra, Huang, Iro, Jayawardhana, Jehin, Jin, Kite, Kitzmann, Kral, Lafrèniere, Libert, Liu, Mohanty, Morris, Murray, Piaulet, Pozuelos, Radica, Ranjan, Rathcke, Roy, Schwieterman, Turner, Triaud and Way2023). For the brightest nearby systems, such as TRAPPIST-1 or LP 890-9, stacking several transits could, in principle, recover multi-band signatures from SO3 and CO2. Future missions like Ariel and Origins will further improve sensitivity in the 5–10 $\mu $
m range, where sulfur- and carbon-bearing species exhibit their strongest features.
$\mu $
m range, where sulfur- and carbon-bearing species exhibit their strongest features.
In an early-Earth context, the coexistence of sulfur- and carbon-bearing gases in detectable quantities may indicate redox coupling between microbial metabolisms and atmospheric photochemistry. For instance, the concurrent presence of SO3, CH4 and NH3 would suggest a partially reducing environment where biological sulfur oxidation and nitrogen fixation could coexist. In our CO2-rich models (Figures 8), the 4.3 $\mu $
m CO2 band becomes saturated at even modest mixing ratios, showing little variation with increasing concentration – an effect typical of optically thick features in dense atmospheres. Consequently, variations among trace gases are most discernible in the mid-IR range (3–10
$\mu $
m CO2 band becomes saturated at even modest mixing ratios, showing little variation with increasing concentration – an effect typical of optically thick features in dense atmospheres. Consequently, variations among trace gases are most discernible in the mid-IR range (3–10 $\mu $
m), where their intrinsic opacities dominate. As previously stated, the expected signal would fall above the plotted range and below the nominal detection limit. The detection of such disequilibrium combinations would therefore represent not only a chemical signature but also a potential biosignature indicative of active metabolic networks.
$\mu $
m), where their intrinsic opacities dominate. As previously stated, the expected signal would fall above the plotted range and below the nominal detection limit. The detection of such disequilibrium combinations would therefore represent not only a chemical signature but also a potential biosignature indicative of active metabolic networks.
Our results indicate that spectral features are present in the transmission spectra, suggesting that these compounds would be detectable in exoplanetary atmospheres under similar conditions. These gases, known to be directly or indirectly produced by Roseovarius sp. (see subsection Identification of enzymes involved in carbon metabolism), may serve as potential biosignatures, particularly in CO2-rich atmospheres resembling early Earth. The detection of SO3 is particularly notable, as it may indicate photochemical interactions between SO2 and atmospheric oxidants or from the oxidation of sulfite, SO ${_3^{2 - }}$
(produced by Roseovarius sp.), processes relevant to both geological and biological activity. Our analysis highlights the importance of different gasses as potential tracers of microbial metabolic activity. The spectral absorption features of these molecules align with expected atmospheric interactions and may be detectable in future observational projects. While not a primary target of this study, water vapor could still influence spectral variations due to its opacity effects. Cloud and haze formation may affect these molecules’ spectral signatures, which could attenuate or obscure the absorption features (Morley et al., Reference Morley, Fortney, Marley, Zahnle, Line, Kempton, Lewis and Cahoy2015; Pinhas & Madhusudhan, Reference Pinhas and Madhusudhan2017).
${_3^{2 - }}$
(produced by Roseovarius sp.), processes relevant to both geological and biological activity. Our analysis highlights the importance of different gasses as potential tracers of microbial metabolic activity. The spectral absorption features of these molecules align with expected atmospheric interactions and may be detectable in future observational projects. While not a primary target of this study, water vapor could still influence spectral variations due to its opacity effects. Cloud and haze formation may affect these molecules’ spectral signatures, which could attenuate or obscure the absorption features (Morley et al., Reference Morley, Fortney, Marley, Zahnle, Line, Kempton, Lewis and Cahoy2015; Pinhas & Madhusudhan, Reference Pinhas and Madhusudhan2017).
Future work should incorporate more realistic temperature profiles, heterogeneous cloud properties and photochemical pathways to refine the detectability estimates. With upcoming facilities such as the James Webb Space Telescope (JWST) and the extremely large telescope (ELT), the multi-wavelength characterization of atmospheres around M-dwarfs will offer a critical opportunity to test these predictions and to assess the biogenic potential of sulfur- and nitrogen-bearing species.
Conclusion
This study underscores the remarkable metabolic versatility of extremophilic microorganisms inhabiting the Atacama Desert, particularly those isolated from the Salar de Llamara, such as Roseovarius sp. Genomic analyses revealed key pathways for carbon fixation, sulfur oxidation and energy conservation under anoxic conditions, demonstrating metabolic plasticity in one of Earth’s driest and most UV-exposed environments. Vibrational spectroscopic measurements (Raman and IR) identified diagnostic molecular signatures consistent with these pathways, linking specific biochemical reactions to observable spectral features.
These findings have direct implications for astrobiology: understanding how Roseovarius sp. metabolizes CO and CO2 in a hypersaline, irradiated setting provides a terrestrial analog for potential microbial processes in CO2-rich atmospheres beyond Earth. The Atacama Desert thus serves as a natural laboratory for decoding the interplay between biology, mineralogy and atmospheric chemistry under extreme desiccation and oxidizing stress.
In a planetary context, our synthetic transmission spectra demonstrate that species such as CO, CO2, SO3, NH3, CH4 and CH2O could produce detectable features in the atmospheres of terrestrial exoplanets, particularly around compact M-dwarf stars ( ${R_{\rm{{a}}}} \approx 0.12 {R_{\rm{e}}}$
). The saturation of the CO
${R_{\rm{{a}}}} \approx 0.12 {R_{\rm{e}}}$
). The saturation of the CO ${{\rm{}}_2}$
4.3
${{\rm{}}_2}$
4.3 $\mu $
m band in dense atmospheres highlights the importance of mid-IR windows (3–10
$\mu $
m band in dense atmospheres highlights the importance of mid-IR windows (3–10 $\mu $
m) where biogenic or photochemical trace gases dominate. The joint detection of these molecules – especially SO3 and CH4 – would indicate coupled redox cycles between biological sulfur oxidation and carbon reduction, reflecting disequilibrium conditions characteristic of active metabolism.
$\mu $
m) where biogenic or photochemical trace gases dominate. The joint detection of these molecules – especially SO3 and CH4 – would indicate coupled redox cycles between biological sulfur oxidation and carbon reduction, reflecting disequilibrium conditions characteristic of active metabolism.
Looking ahead, the synergy between next-generation observatories such as JWST and ESO’s ELT will open new opportunities for cross-validation of potential biosignatures through multi-wavelength spectroscopy. Continued refinement of molecular line lists, cloud models and radiative-transfer frameworks will be critical to interpret faint spectral features at parts per million precision. Together, these efforts bring us closer to identifying the chemical fingerprints of life, guided by lessons from one of the most Mars-like environments on our planet – the Atacama Desert.
Acknowledgements
We would like to thank the anonymous referees for their helpful comments, which improved the quality of this manuscript. The authors thank Dr. Ivan Brito (Chemistry Lab, Universidad de Antofagasta) for IR measurements.
Funding statement
V.M. acknowledges: the ANID-Subdirección de Capital Humano/Doctorado Nacional/2023/Folio 21232275 for financial support, the postgrade school of the Atacama University. J.T.-R. acknowledges financial support from ANID/FONDECYT (an Initiation in Research grant; Project Number 11220287) and the Air Force Office of Scientific Research (Award FA9550-22-1-0292). M.S. acknowledges support from ANID’s FONDECYT regular grant #1251401. B.R.-A. acknowledges funding support from the ANID Basal project FB210003.
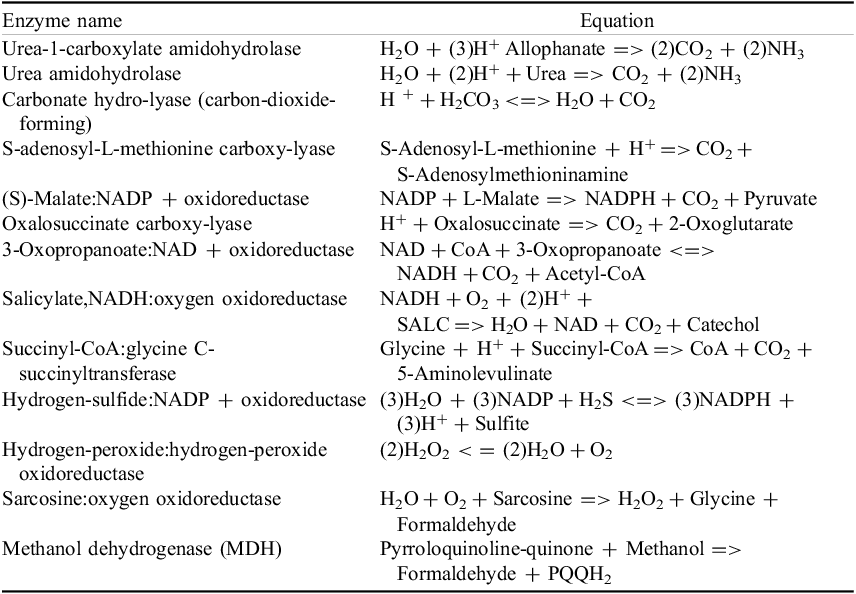


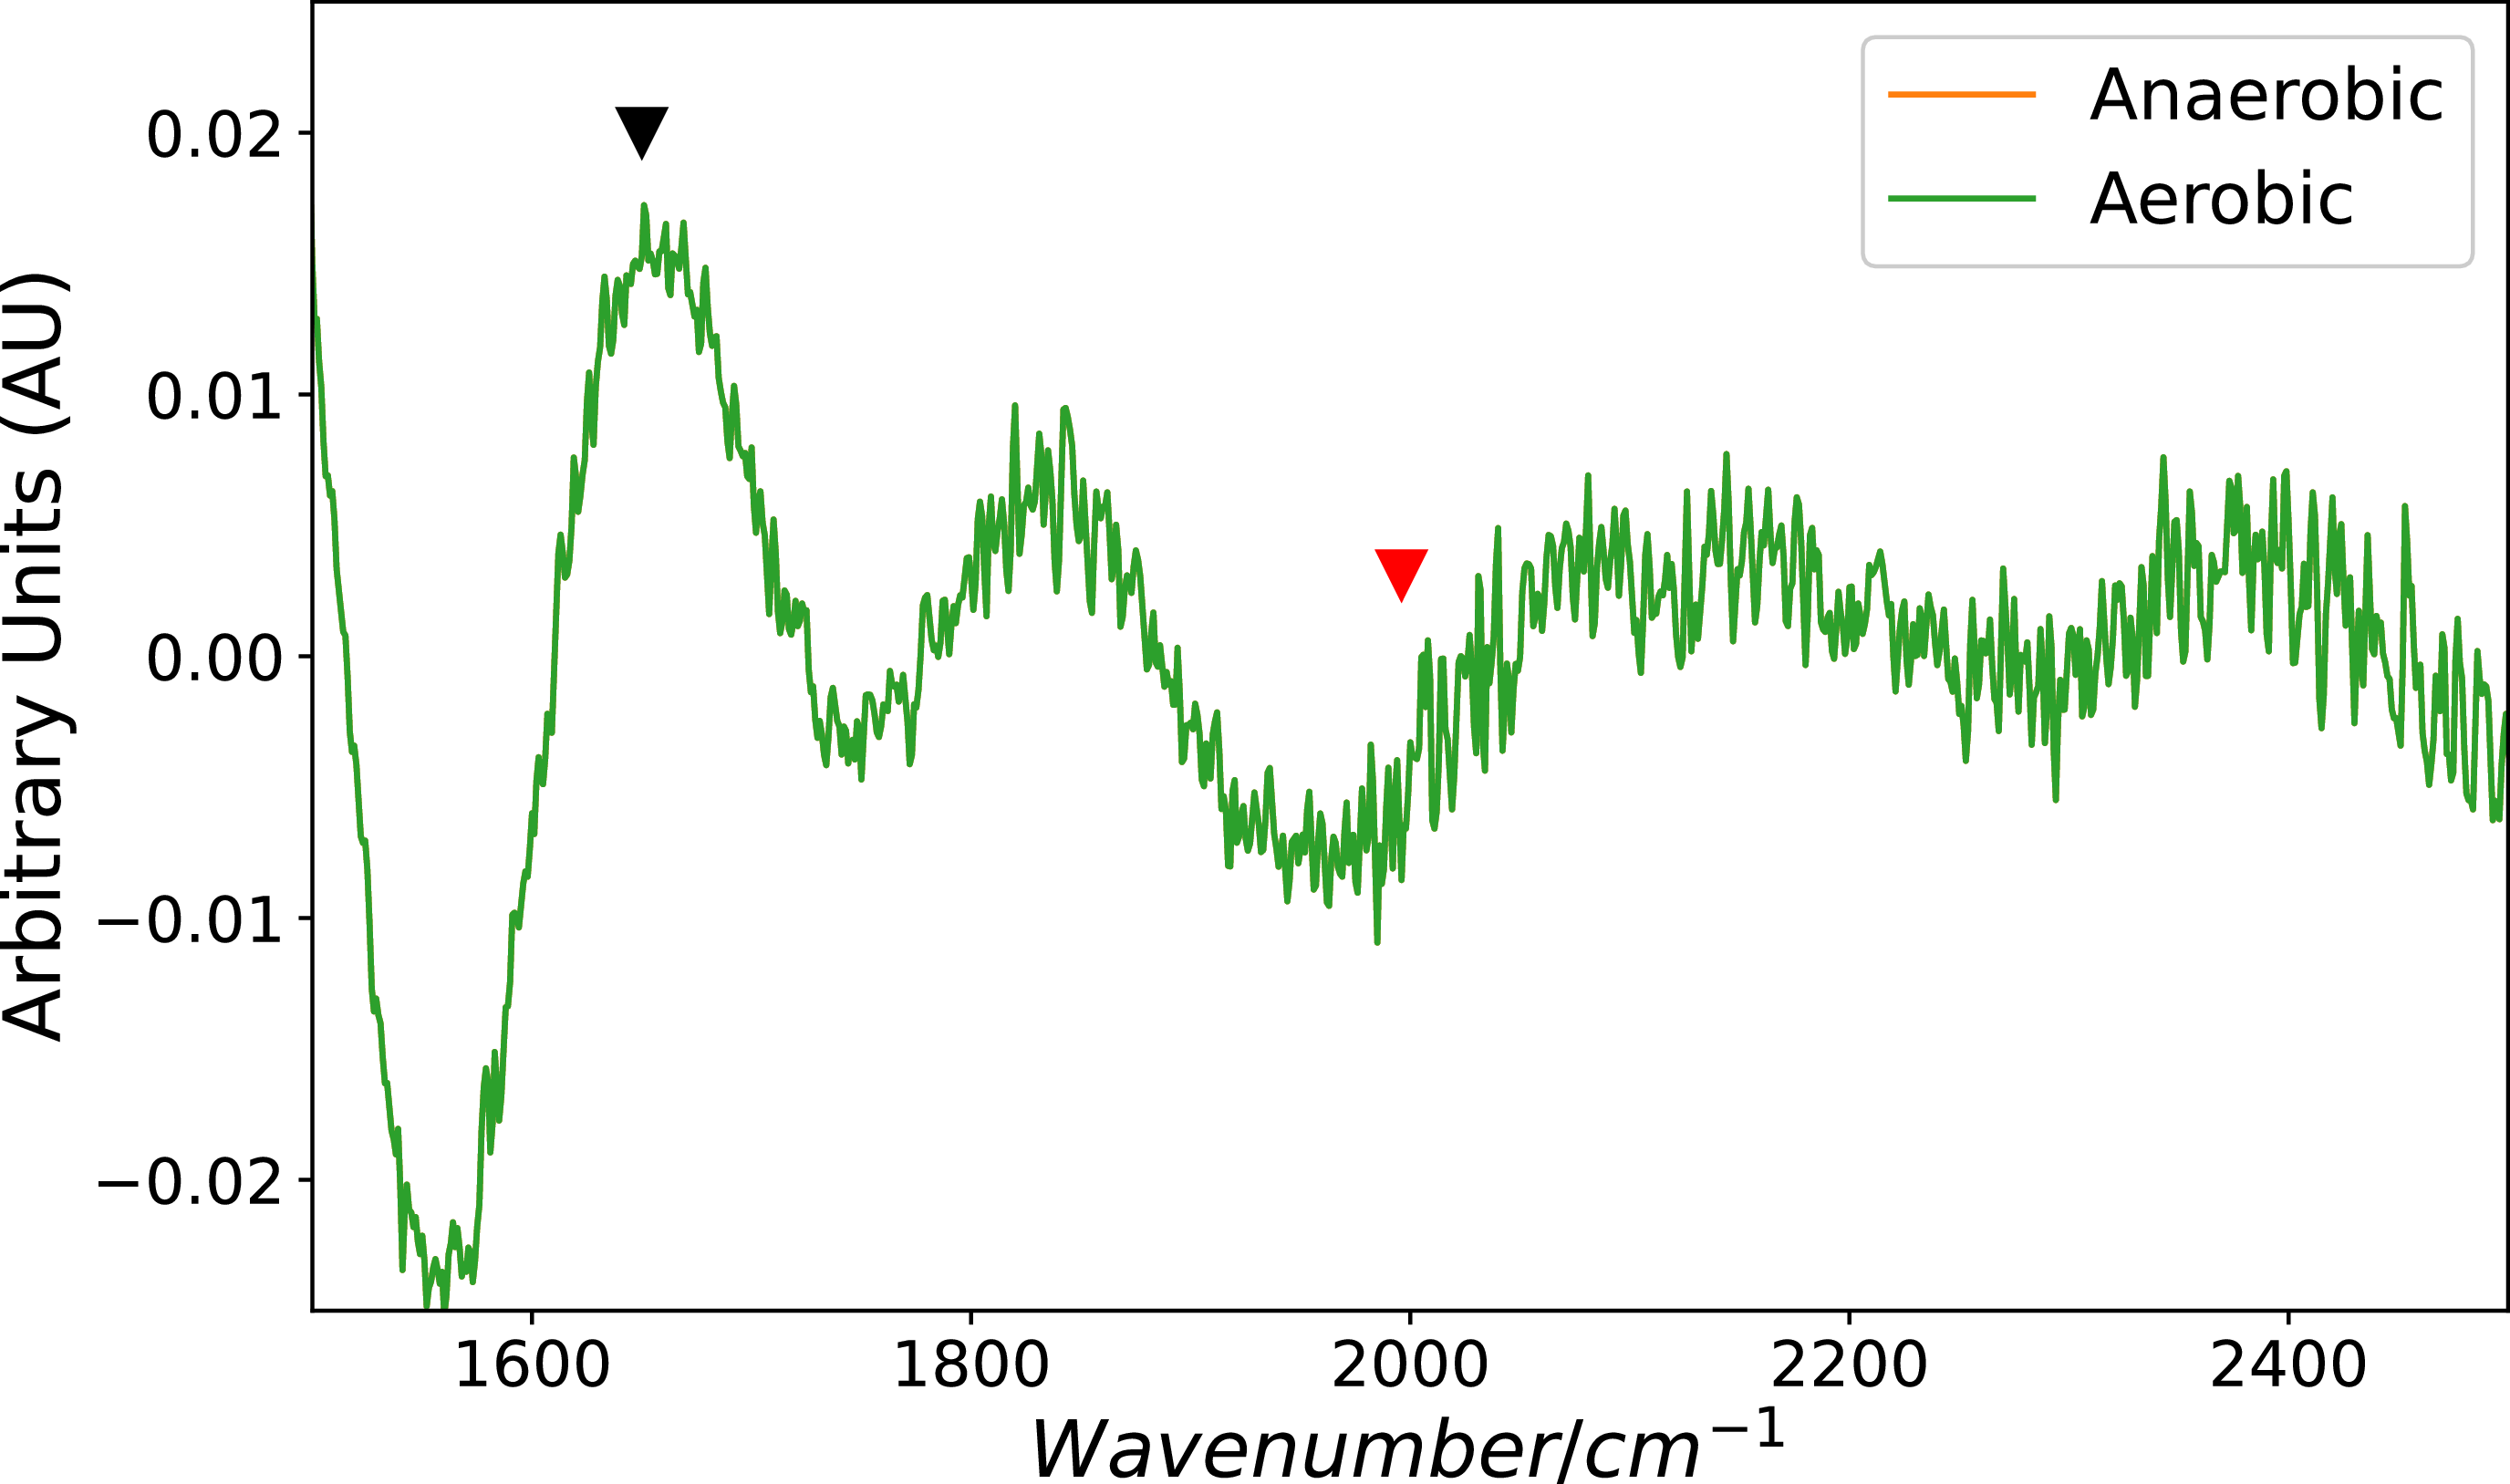


 Open access