

1. Introduction
Prediction of genetic values is relevant in plant and animal breeding, as well as for assessing the probability of disease in medicine. Standard genetic models view phenotypic outcomes (yi; i=1, …, n) as the sum of a genetic signal (gi) and of a residual (∊i), that is: yi=gi+∊i. The statistical learning problem consists of uncovering genetic signal from noisy data, and predictions (ĝi) are constructed using phenotypic records and some type of knowledge about the genetic background of individuals.
Family structure, usually represented as a pedigree, and phenotypic records have been used for the prediction of genetic values in plants and animals over several decades (e.g. Fisher, Reference Fisher1918; Wright, Reference Wright1921; Henderson, Reference Henderson1975). In pedigree-based models (P), a genealogy is used to derive the expected degree of resemblance between relatives, measured as Cov(gi, g i′), and this provides a means for smoothing phenotypic records.
Dense molecular marker panels are now available in humans and in many plant and animal species. Unlike pedigree data, genetic markers allow follow-up of Mendelian segregation; a term that in additive models and in the absence of inbreeding accounts for 50% of the genetic variability. However, incorporating molecular markers into models poses several statistical and computational challenges such as how models can cope with the genetic complexity of multi-factorial traits (e.g. Gianola & de los Campos, Reference Gianola and de los Campos2008), and with the curse of dimensionality that arises when a large number of markers is considered. Parametric and semi-parametric methods address these two issues in different ways.
In parametric regression models for dense molecular markers (e.g. Meuwissen et al., Reference Meuwissen, Hayes and Goddard2001), gi is a parametric regression on marker covariates, xik with k=1, …, p indexing markers. The linear model takes the form: ![]() , where βk is the regression of yi on xik. Often, p>>n and some shrinkage estimation method such as ridge regression (Hoerl & Kennard, Reference Hoerl and Kennard1970a, Reference Hoerl and Kennard1970b) or LASSO (Least Absolute Shrinkage and Selection Operator, Tibshirani, Reference Tibshirani1996), or their Bayesian counterparts, are used to estimate marker effects. Among the latter, those using marker-specific shrinkage such as the Bayesian LASSO of Park & Casella (Reference Park and Casella2008) or methods BayesA or BayesB of Meuwissen et al. (Reference Meuwissen, Hayes and Goddard2001) are the most commonly used. In linear regressions, dominance and epistasis may be accommodated by adding appropriate interactions between marker covariates to the model; however, the number of predictor variables is extremely large and modelling interactions is only feasible to a limited degree.
, where βk is the regression of yi on xik. Often, p>>n and some shrinkage estimation method such as ridge regression (Hoerl & Kennard, Reference Hoerl and Kennard1970a, Reference Hoerl and Kennard1970b) or LASSO (Least Absolute Shrinkage and Selection Operator, Tibshirani, Reference Tibshirani1996), or their Bayesian counterparts, are used to estimate marker effects. Among the latter, those using marker-specific shrinkage such as the Bayesian LASSO of Park & Casella (Reference Park and Casella2008) or methods BayesA or BayesB of Meuwissen et al. (Reference Meuwissen, Hayes and Goddard2001) are the most commonly used. In linear regressions, dominance and epistasis may be accommodated by adding appropriate interactions between marker covariates to the model; however, the number of predictor variables is extremely large and modelling interactions is only feasible to a limited degree.
Reproducing kernel Hilbert spaces (RKHS) regressions have been proposed for semi-parametric regression on marker genotypes, e.g. Gianola et al. (Reference Gianola, Fernando and Stella2006) and Gianola & van Kaam (Reference Gianola and van Kaam2008) . In RKHS, markers are used to build a covariance structure among genetic values; for example, Cov(gi, g i′)∝K(xi, xi′), where xi, xi′ are vectors of marker genotypes and K(., .), the reproducing kernel (RK), is some positive definite (PD) function (de los Campos et al., Reference de los Campos, Gianola and Rosa2009a). This semi-parametric approach has several attractive features: (a) the methodology can be used with almost any type of information set (e.g. covariates, strings, images and graphs). This is particularly important because techniques for characterizing genomes change rapidly; (b) some parametric methods for genomic selection (GS) appear as special cases and (c) computations are performed in an n-dimensional space. This provides RKHS methods with a great computational advantage relative to some parametric methods, especially when p>>n.
This article discusses and evaluates the use of RKHS regressions for genomic-enabled prediction of genetic values of complex traits. Section 2 gives a brief review of RKHS regressions. A special focus is placed on the problem of kernel choice. We discuss cases where a genetic model (e.g. additive infinitesimal) is used to choose the kernel and others where the RK is chosen based on its properties (e.g. predictive ability). Section 3 presents an application to an extensive plant breeding data set where some of the methods discussed in Section 2 are evaluated. Concluding remarks are provided in Section 4.
2. RKHS regression
RKHS methods have been used in many areas of application such as spatial statistics (e.g. ‘Kriging’; Cressie, Reference Cressie1993), scatter-plot smoothing (e.g. smoothing splines; Wahba, Reference Wahba1990) and classification problems (e.g. support vector machines; Vapnik, Reference Vapnik1998), just to mention a few. Estimates in RKHS regressions can be motivated as solutions to a penalized optimization problem in an RKHS or as posterior modes in a certain class of Bayesian models. A brief description of RKHS estimates in the context of penalized estimation is given first in section 2(i), with its Bayesian interpretation introduced later in section 2(ii). A representation of RKHS regressions that uses orthogonal basis functions is given in section 2(iii). This section ends in 2(iv) with a discussion of the problem of kernel choice.
(i) Penalized estimation in RKHS
A standard problem in statistical learning consists of extracting signal from noisy data. The learning task can be described as follows (Vapnik, Reference Vapnik1998): given data {(yi, ti)}i =1n, originating from some functional dependency, infer this dependency. The pattern relating input, ti∊T, and output, yi∊Y, variables can be described with an unknown function, g, whose evaluations are gi=g(ti). For example, ti may be a vector of marker genotypes, ti=xi and g may be a function assigning a genetic value to each genotype. Inferring g requires defining a collection (or space) of functions from which an element, ĝ, will be chosen via a criterion (e.g. a penalized residual sum of squares or a posterior density) for comparing candidate functions. Specifically, in RKHS, estimates are obtained by solving the following optimization problem:
where g∊H denotes that the optimization problem is performed within the space of functions H, a RKHS; l(g, y) is a loss function (e.g. some measure of goodness of fit); λ is a parameter controlling trade-offs between goodness of fit and model complexity; and ||g||H 2 is the square of the norm of g on H, a measure of model complexity. A technical discussion of RKHS of real-valued functions can be found in Wahba (Reference Wahba1990) ; here, we introduce some elements that are needed to understand how ĝ is obtained.
Hilbert spaces are complete linear spaces endowed with a norm that is the square root of the inner product in the space. The Hilbert spaces that are relevant for our discussion are RKHS of real-valued functions, here denoted as H. An important result, known as the Moore–Aronszajn theorem (Aronszajn, Reference Aronszajn1950), states that each RKHS is uniquely associated with a PD function that is a function, K(ti, t i′), satisfying ![]() for all sequences, {αi}, with αi≠0 for some i. This function, K(ti, t i′), also known as the RK, provides basis functions and an inner product (therefore a norm) to H. Therefore, choosing K(ti, t i′) amounts to selecting H; the space of functions where (1) is solved.
for all sequences, {αi}, with αi≠0 for some i. This function, K(ti, t i′), also known as the RK, provides basis functions and an inner product (therefore a norm) to H. Therefore, choosing K(ti, t i′) amounts to selecting H; the space of functions where (1) is solved.
Using that duality, Kimeldorf & Wahba (Reference Kimeldorf and Wahba1971) showed that the finite-dimensional solution of (1) admits a linear representation ![]() , or in matrix notation,
, or in matrix notation, ![]() , where K={K(ti, t i′)} is an n×n matrix whose entries are the evaluations of the RK at pairs of pint in T. Further, in this finite-dimensional setting,
, where K={K(ti, t i′)} is an n×n matrix whose entries are the evaluations of the RK at pairs of pint in T. Further, in this finite-dimensional setting, ![]() . Using this in (1) and setting l(g, y) to be a residual sum of squares, one obtains:
. Using this in (1) and setting l(g, y) to be a residual sum of squares, one obtains: ![]() , where
, where ![]() is the solution of
is the solution of
and y={yi} is a data vector. The first-order conditions of (2) lead to ![]() . Further, since K=K′ and K−1 exists, pre-multiplication by K−1 yields,
. Further, since K=K′ and K−1 exists, pre-multiplication by K−1 yields, ![]() . Therefore, the estimated conditional expectation function is
. Therefore, the estimated conditional expectation function is ![]() , where P(λ, K)=K(K+λI)−1 is a smoother or influence matrix.
, where P(λ, K)=K(K+λI)−1 is a smoother or influence matrix.
The input information, ti∊T, enters into the objective function and on the solution only through K. This allows using RKHS for regression with any class of information sets (vectors, graphs, images, etc.) where a PD function can be evaluated; the choice of kernel becomes the key element of model specification.
(ii) Bayesian interpretation
From a Bayesian perspective, ![]() can be viewed as a posterior mode in the following model:
can be viewed as a posterior mode in the following model: ![]() ; P(ε, α|σ∊2, σg 2)=N(ε|0, Iσ∊2)N(α|0, K−1σg 2). The relationship between RKHS regressions and Gaussian processes was first noted by Kimeldorf & Wahba (Reference Kimeldorf and Wahba1970) and has been revisited by many authors (e.g. Harville, Reference Harville, David and David1983; Speed, Reference Speed1991). Following de los Campos et al. (Reference de los Campos, Gianola and Rosa2009a), one can change variables in the above model, with g=K α, yielding
; P(ε, α|σ∊2, σg 2)=N(ε|0, Iσ∊2)N(α|0, K−1σg 2). The relationship between RKHS regressions and Gaussian processes was first noted by Kimeldorf & Wahba (Reference Kimeldorf and Wahba1970) and has been revisited by many authors (e.g. Harville, Reference Harville, David and David1983; Speed, Reference Speed1991). Following de los Campos et al. (Reference de los Campos, Gianola and Rosa2009a), one can change variables in the above model, with g=K α, yielding
Thus, from a Bayesian perspective, the evaluations of functions can be viewed as Gaussian processes satisfying Cov(gi, gi ′)∝K(ti, t i′). The fully Bayesian RKHS regression assumes unknown variance parameters, and the model becomes
where p(σ∊2, σg 2) is a (proper) prior density assigned to variance parameters.
(iii) Representation using orthogonal random variables
Representing model (4) with orthogonal random variables simplifies computations greatly and provides additional insights into the nature of the RKHS regressions. To this end, we make use of the eigenvalue (EV) decomposition (e.g. Golub & Van Loan, Reference Golub and Van Loan1996) of the kernel matrix K=ΛΨΛ′ , where Λ is a matrix of eigenvectors satisfying Λ′Λ=I; Ψ=Diag{Ψj}, Ψ1⩾Ψ2⩾ …⩾Ψn>0, is a diagonal matrix whose non-zero entries are the EVs of K; and j=1, …, n, indexes eigenvectors (i.e. columns of Λ) and the associated EV. Using these, (4) becomes
To see the equivalence of (4) and (5), note that Λδ is multivariate normal because so is δ. Further, E(Λδ)=ΛE(δ)=0 and Cov(Λδ)=ΛΨΛ′σg 2=Kσg 2. Therefore, equations (4) and (5) are two parameterizations of the same probability model. However, equation (5) is much more computationally convenient, as discussed next.
The joint posterior distribution of (5) does not have a closed form; however, draws can be obtained using a Gibbs sampler. Sampling regression coefficients from the corresponding fully conditional distribution, p(δ|y, σ∊2, σg 2), is usually the most computationally demanding step. From standard results of Bayesian linear models, one can show that ![]() , where ELSE denotes everything else other than δ, C=[Λ′Λ+σ∊2σg −2 Ψ−1]=Diag{1+σ∊2σg −2Ψj −1} and
, where ELSE denotes everything else other than δ, C=[Λ′Λ+σ∊2σg −2 Ψ−1]=Diag{1+σ∊2σg −2Ψj −1} and ![]() . This simplification occurs because Λ′Λ=I and Ψ=Diag{Ψj}. The fully conditional distribution of δ is multivariate normal, and the (co)variance matrix, σ∊2 C−1, is diagonal; therefore
. This simplification occurs because Λ′Λ=I and Ψ=Diag{Ψj}. The fully conditional distribution of δ is multivariate normal, and the (co)variance matrix, σ∊2 C−1, is diagonal; therefore ![]() . Moreover, p(δj|ELSE) is normal, centred at [1+σ∊2σg −2Ψ j −1]−1y .j and with variance σ∊2[1+σ∊2σg −2Ψ j −1]−1. Here, y .j=λ′j y, where λj is the jth eigenvector (i.e. the jth column of Λ). Note that model unknowns are not required for computing y .j, implying that these quantities remain constant across iterations of a sampler. The only quantities that need to be updated are [1+σ∊2σg −2Ψj −1] and σ∊2[1+σ∊2σg −2Ψj −1]. If model (5) is extended to include other effects (e.g. an intercept or some fixed effects), the right-hand side of the mixed model equations associated to p(δ|ELSE) will need to be updated at each iteration of the sampler; however, the matrix of coefficients remains diagonal and this simplifies computations greatly (see Appendix).
. Moreover, p(δj|ELSE) is normal, centred at [1+σ∊2σg −2Ψ j −1]−1y .j and with variance σ∊2[1+σ∊2σg −2Ψ j −1]−1. Here, y .j=λ′j y, where λj is the jth eigenvector (i.e. the jth column of Λ). Note that model unknowns are not required for computing y .j, implying that these quantities remain constant across iterations of a sampler. The only quantities that need to be updated are [1+σ∊2σg −2Ψj −1] and σ∊2[1+σ∊2σg −2Ψj −1]. If model (5) is extended to include other effects (e.g. an intercept or some fixed effects), the right-hand side of the mixed model equations associated to p(δ|ELSE) will need to be updated at each iteration of the sampler; however, the matrix of coefficients remains diagonal and this simplifies computations greatly (see Appendix).
In equation (5), the conditional expectation function is a linear combination of eigenvectors: ![]() . The EV are usually sorted such that Ψ1⩾Ψ2⩾ …⩾Ψn>0. The prior precision variance of regression coefficients is proportional to the EV, that is, Var(δj)∝Ψj. Therefore, the extent of shrinkage increases as j does. For most RKs, the decay of the EV will be such that for the first EV [1+σ∊2σg −2Ψj −1] is close to one, yielding negligible shrinkage of the corresponding regression coefficients. Therefore, linear combinations of the first eigenvectors can then be seen as components of g that are (essentially) not penalized.
. The EV are usually sorted such that Ψ1⩾Ψ2⩾ …⩾Ψn>0. The prior precision variance of regression coefficients is proportional to the EV, that is, Var(δj)∝Ψj. Therefore, the extent of shrinkage increases as j does. For most RKs, the decay of the EV will be such that for the first EV [1+σ∊2σg −2Ψj −1] is close to one, yielding negligible shrinkage of the corresponding regression coefficients. Therefore, linear combinations of the first eigenvectors can then be seen as components of g that are (essentially) not penalized.
(iv) Choosing the RK
The RK is a central element of model specification in RKHS. Kernels can be chosen so as to represent a parametric model, or based on their ability of predicting future observations. Examples of these two approaches are discussed next.
The standard additive infinitesimal model of quantitative genetics (e.g. Fisher, Reference Fisher1918; Henderson, Reference Henderson1975), is an example of a model-driven kernel (e.g. de los Campos et al., Reference de los Campos, Gianola and Rosa2009a). Here, the information set (a pedigree) consists of a directed acyclic graph and K(ti, t i′) gives the expected degree of resemblance between relatives under an additive infinitesimal model. Another example of an RKHS regression with a model-derived kernel is the case where K is chosen to be a marker-based estimate of a kinship matrix (usually denoted as G, cf, Ritland, Reference Ritland1996; Lynch & Ritland, Reference Lynch and Ritland1999; Eding & Meuwissen, Reference Eding and Meuwissen2001; Van Raden, Reference Van Raden2007; Hayes & Goddard, Reference Hayes and Goddard2008). An example of a (co)variance structure derived from a quantitative trait locus (QTL)-model is given in Fernando & Grossman (Reference Fernando and Grossman1989) .
Ridge regression and its Bayesian counterpart (Bayesian ridge regression (BRR)) can also be represented using (4) or (5). A BRR is defined by y=Xβ+ε and p(ε, β, σ∊2, σβ2)=N(ε|0, Iσ∊2)N(β|0, Iσβ2)p(σ∊2, σβ2). To see how a BRR constitutes a special case of (5), one can make use of the singular value decomposition (e.g. Golub & Van Loan, Reference Golub and Van Loan1996) of X=UDV′. Here, U (n×n) and V (p×n) are matrices whose columns are orthogonal, and D=Diag{ξj} is a diagonal matrix whose non-null entries are the singular values of X. Using this in the data equation, we obtain y=UDV′β+ε=Uδ+ε, where δ=DV′β. The distribution of δ is multivariate normal because so is that of β. Further, E(δ)=DV′E(β)=0 and Cov(δ)=DV′VD′σβ2=DD′σβ2; thus, δ~N[0, Diag{ξj 2}σβ2]. Therefore, a BRR can be equivalently represented using (5) with Λ=U and Ψ=Diag{ξj 2}. Note that using Λ=U and Ψ=Diag{ξj 2} in (5) implies K=UDD′U′=UDV′VD′U′=XX′ in (4). Habier Fernando & Dekkers (Reference Habier, Fernando and Dekkers2009) argue that as the number of markers increases, XX′ approaches the numerator relationship matrix, A. From this perspective, XX′ can also be viewed just as another choice for an estimate of a kinship matrix. However, the derivation of the argument follows the standard treatment of quantitative genetic models where genotypes are random and marker effects are fixed, whereas in BRR, the opposite is true (see Gianola et al., Reference Gianola, de los Campos, Hill, Manfredi and Fernando2009 for further discussion).
In the examples given above, the RK was defined in such a manner that it represents a parametric model. An appeal of using parametric models is that estimates can be interpreted in terms of the theory used for deriving K. For example, if K=A then σg 2 is interpretable as an additive genetic variance and σg 2(σg 2+σ∊2)−1 can be interpreted as the heritability of the trait. However, these models may not be optimal from a predictive perspective. Another approach (e.g. Shawe-Taylor & Cristianini, Reference Shawe-Taylor and Cristianini2004) views RKs as smoothers, with the choice of kernel based on their predictive ability or some other criterion. Moreover, the choice of the kernel may become a task of the algorithm.
For example, one can index a Gaussian kernel with a bandwidth parameter, θ, so that K(ti,t i′|θ)=exp{−θd(ti,t i′)}. Here, d(ti,t i′) is some distance function and θ controls how fast the covariance function drops as points get further apart as measured by d(ti, t i′). The bandwidth parameter may be chosen by cross-validation (CV) or with Bayesian methods (e.g. Mallick et al., Reference Mallick, Ghosh and Ghosh2005). However, when θ is treated as uncertain in a Bayesian model with Markov chain Monte Carlo (MCMC) methods, the computational burden increases markedly because the RK must be computed every time that a new sample of θ becomes available. It is computationally easier to evaluate model performance over a grid of values of θ; this is illustrated in section 3.
The (co)variance structure implied by a Gaussian kernel is not derived from any mechanistic consideration; therefore, no specific interpretation can be attached to the bandwidth parameter. However, using results for infinitesimal models under epistasis one could argue that a high degree of epistatic interaction between additive infinitesimal effects may induce a highly local (co)variance pattern in the same way that large values of θ do. This argument is revisited later in this section.
The decay of the EV controls, to a certain extent, the shrinkage of estimates of δ and, with this, the trade-offs between goodness of fit and model complexity. Transformations of EV (indexed with unknown parameters) can also be used to generate a family of kernels. One such example is the diffusion kernel Kα=ΛDiag{exp(αΨj)}Λ′ (e.g. Kondor & Lafferty, Reference Kondor and Lafferty2002). Here, α>0 is used to control the decay of EV. In this case, the bandwidth parameter can be interpreted as a quantity characterizing the diffusion of signal (e.g. heat) along edges of a graph, with smaller values being associated with more diffusion.
A third way of generating families of kernels is to use closure properties of PD functions (Shawe-Taylor & Cristianini, Reference Shawe-Taylor and Cristianini2004). For example, linear combinations of PD functions, ![]() , with σg .2⩾0, are PD as well. From a Bayesian perspective,
, with σg .2⩾0, are PD as well. From a Bayesian perspective, ![]() and
and ![]() are interpretable as variance parameters. To see this, consider extending (4) to two random effects so that: g=g1+g2 and, p(g1, g2|
are interpretable as variance parameters. To see this, consider extending (4) to two random effects so that: g=g1+g2 and, p(g1, g2|![]() ,
, ![]() )=N(g1|0, K1
)=N(g1|0, K1
![]() )N(g2|0, K2
)N(g2|0, K2
![]() ). It follows that g~N(0, K1
). It follows that g~N(0, K1
![]() +K2
+K2
![]() ), or equivalently
), or equivalently ![]() , where
, where ![]() and
and ![]() . Therefore, fitting an RKHS with two random effects is equivalent to using
. Therefore, fitting an RKHS with two random effects is equivalent to using ![]() in (4). Extending this argument to r kernels one obtains:
in (4). Extending this argument to r kernels one obtains: ![]() , where
, where ![]() . For example, one can obtain a sequence of kernels, {Kr}, by evaluating a Gaussian kernel over a grid of values of a bandwidth parameter {θr}. The variance parameters,
. For example, one can obtain a sequence of kernels, {Kr}, by evaluating a Gaussian kernel over a grid of values of a bandwidth parameter {θr}. The variance parameters, ![]() , associated with each kernel in the sequence can be viewed as weights. Inferring these variances amounts to inferring a kernel,
, associated with each kernel in the sequence can be viewed as weights. Inferring these variances amounts to inferring a kernel, ![]() , which can be seen as an approximation to an optimal kernel. We refer to this approach as kernel selection via kernel averaging (KA); an example of this is given in section 3.
, which can be seen as an approximation to an optimal kernel. We refer to this approach as kernel selection via kernel averaging (KA); an example of this is given in section 3.
The Haddamard (or Schur) product of PD functions is also PD, that is, if K 1(ti, t i′) and K 2(ti, t i′) are PD, so is K(ti, t i′)=K 1(ti, t i′)K 2(ti, t i′); in matrix notation, this is usually denoted as K=K1#K2. From a genetic perspective, this formulation can be used to accommodate non-additive infinitesimal effects (e.g. Cockerham, Reference Cockerham1954; Kempthorne, Reference Kempthorne1954). For example, under random mating, linkage equilibrium and in the absence of selection, K=A#A={a(i, i′)2} gives the expected degree of resemblance between relatives under an infinitesimal model for additive×additive interactions. For epistatic interaction between infinitesimal additive effects of qth order, the expected (co)variance structure is, K={a(i, i′)q +1}. Therefore, for q⩾1 and i≠i′, the prior correlation,
![\eqalign{0 \lt{{a\lpar i\comma i \prime \rpar ^{q \minus \setnum{1}} } \over {\sqrt {a\lpar i\comma i\rpar ^{q \minus \setnum{1}} a\lpar i \prime \comma i \prime \rpar ^{q \minus \setnum{1}} } }} \equals \tab \left[ {{{a\lpar i\comma i \prime \rpar } \over {\sqrt {a\lpar i\comma i\rpar a\lpar i \prime \comma i \prime \rpar } }}} \right]^{q \minus \setnum{1}} \cr\lt\tab {{a\lpar i\comma i \prime \rpar } \over {\sqrt {a\lpar i\comma i\rpar a\lpar i \prime \comma i \prime \rpar } }} \lt 1 \comma](https://static.cambridge.org/binary/version/id/urn:cambridge.org:id:binary:20160927085923094-0922:S0016672310000285:S0016672310000285_eqnU34.gif?pub-status=live)
decreases, i.e. the kernel becomes increasingly local, as the degree of epistatic interaction increases, producing an effect similar to that of a bandwidth parameter of a Gaussian kernel.
3. Application to plant breeding data
Some of the methods discussed in the previous section were evaluated using a data set consisting of a collection of historical wheat lines from the Global Wheat Breeding Programme of CIMMYT (International Maize and Wheat Improvement Center). In plant breeding programmes, lines are selected based on their expected performance and collecting phenotypic records is expensive. An important question is whether phenotypes collected on ancestor lines, together with pedigrees and markers, can be used to predict performance of lines for which phenotypic records are not available yet. If so, breeding programmes could perform several rounds of selection based on marker data only; with phenotypes measured every few generations. The reduction in generation interval attainable by selection based on markers may increase the rate of genetic progress and, at the same time, the cost of phenotyping would be reduced (e.g. Bernardo & Yu, Reference Bernardo and Yu2007; Heffner et al., Reference Heffner, Sorrells and Jannink2009). Thus, assessing the ability of a model to predict future outcomes is central in breeding programmes.
The study presented in this section attempted to evaluate: (a) how much could be gained in predictive ability by incorporating marker information into a pedigree-based model, (b) how sensitive these results are with respect to the choice of kernel, (c) whether or not Bayesian KA is effective for selecting kernels and (d) how RKHS performs relative to a parametric regression model, the Bayesian LASSO (BL; Park & Casella, Reference Park and Casella2008).
(i) Materials and methods
The data comprise family, marker and phenotypic information of 599 wheat lines that were evaluated for grain yield (GY) in four environments. Single-trait models were fitted to data from each environment. Marker information consisted of genotypes for 1447 Diversity Array Technology (DArT) markers, generated by Triticarte Pty. Ltd (Canberra, Australia; http://www.triticarte.com.au). Pedigree information was used to compute additive relationships between lines (i.e. twice the kinship coefficient; Wright, Reference Wright1921) using the Browse application of the International Crop Information System, as described in McLaren et al. (Reference McLaren, Bruskiewich, Portugal and Cosico2005) .
A sequence of models was fitted to the entire data set and in a CV setting. Figure 1 gives a summary of the models considered. In all environments, phenotypes were represented using equation yi=μ+gi+∊i, where yi (i=1, …, 599) is the phenotype of the ith line; μ is an effect common to all lines; gi is the genetic value of the ith line; and ∊i is a line-specific residual. Phenotypes were standardized to a unit variance in each of the environments. Residuals were assumed to follow a normal distribution ![]() , where σ∊2 is the residual variance. The conditional distribution of the data was
, where σ∊2 is the residual variance. The conditional distribution of the data was ![]() , where g=(g 1, …, gn)′. Models differed on how gi was modelled.
, where g=(g 1, …, gn)′. Models differed on how gi was modelled.
Alternative models for prediction of genetic values. Phenotypic records (y) were always the sum of a genetic signal (g) and a vector of Gaussian residuals (ε). Models differed on how g was represented, as described in the figure. BL, Bayesian LASSO; RKHS, reproducing kernel Hilbert spaces regression; λ, LASSO regularization parameter; θ, RKHS bandwidth parameter; σ·2, variance parameter; KA, kernel averaging; N(., .), normal density; DE(.), double-exponential density.
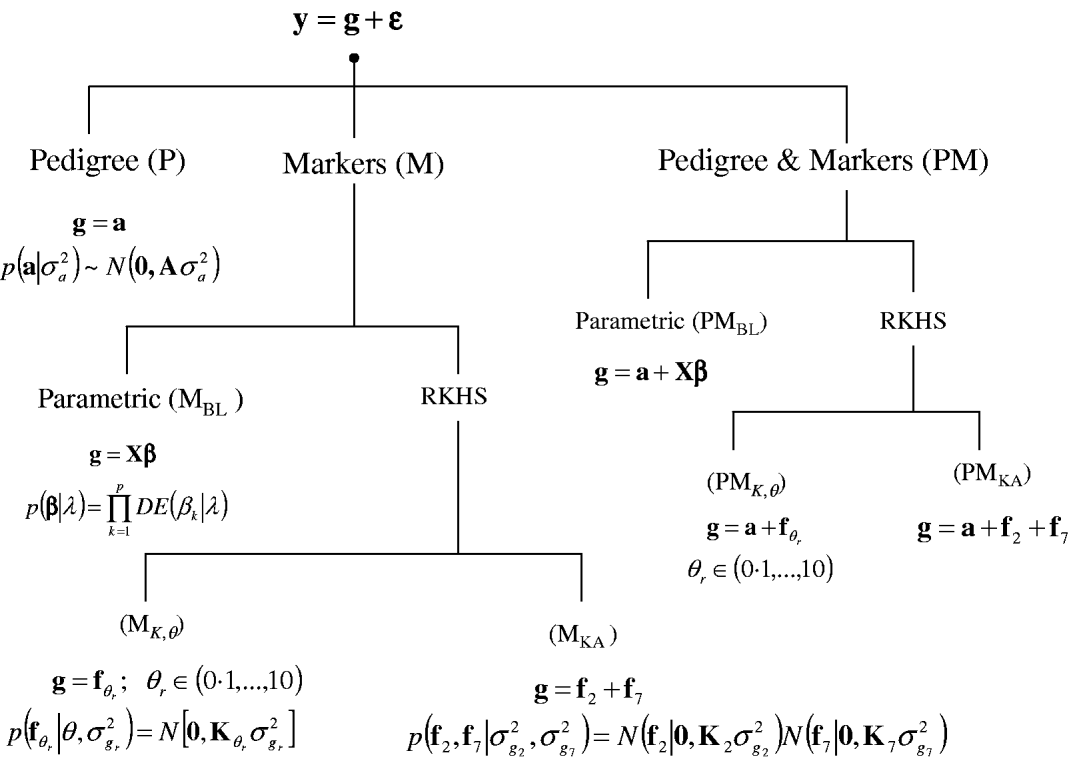
In a standard infinitesimal additive model (P, standing for pedigree-model), genetic values are g=a with p(a|σa 2)=N(0, Aσa 2), where σa 2 is the additive genetic variance and A={a(i,i′)}, as before, is the numerator relationship matrix among lines computed from the pedigree. This is a RKHS with K=A.
For marker-based models (M), two alternatives were considered: BL and RKHS regression. In the BL, genetic values were a linear function of marker covariates, g=Xβ, where X is an incidence matrix with marker genotypes codes and β=(β1, …, βp)′, the vector of regression coefficients, was inferred using the BL of Park & Casella (Reference Park and Casella2008) . Following de los Campos et al. (Reference de los Campos, Naya, Gianola, Crossa, Legarra, Manfredi, Weigel and Cotes2009b), the prior density of the regularization parameter of the BL, here denoted as ![]() , was
, was ![]() , which is flat over a fairly wide range. This model is denoted as MBL.
, which is flat over a fairly wide range. This model is denoted as MBL.
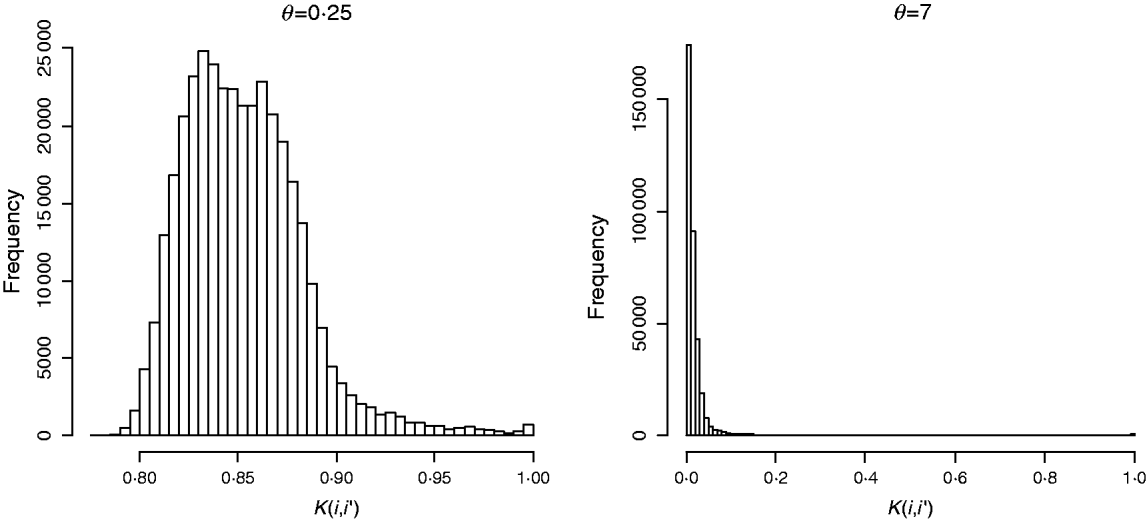
In marker-based RKHS regressions (MK) g=fθ, where fθ=(f θ,1, …, f θ,n)′ was assigned a Gaussian prior with null mean and (co)variance matrix Cov(fθ)∝Kθ={exp(−θk −1dii′)}. Here, θ is a bandwidth parameter, dii ′=||xi−xi′||2 is the square Euclidean distance between marker codes xi=(xi 1, …, xip)′ and xi ′=(xi′ 1, …, xi′p)′, and ![]() . Models were fitted over a grid of values of θ and are denoted as Mk ,θ. The optimal value of the bandwidth parameter is expected to change with many factors such as: (a) distance function; (b) number of markers, allelic frequency and coding of markers, all factors affecting the distribution of observed distances and (c) genetic architecture of the trait, a factor affecting the expected prior correlation of genetic values (see section 2(iv)). We generated a grid of values, θ∊{0·1, 0·25, 0·5, 0·75, 1, 2, 3, 5, 7, 10}, that for this data set allowed exploring a wide variety of kernels. Figure 2 gives a histogram of the evaluations of the kernel for two extreme values of the bandwidth parameter; θ=0·25 gives very high prior correlations, while θ=7 gives a kernel matrix with very low correlations in the off-diagonal.
. Models were fitted over a grid of values of θ and are denoted as Mk ,θ. The optimal value of the bandwidth parameter is expected to change with many factors such as: (a) distance function; (b) number of markers, allelic frequency and coding of markers, all factors affecting the distribution of observed distances and (c) genetic architecture of the trait, a factor affecting the expected prior correlation of genetic values (see section 2(iv)). We generated a grid of values, θ∊{0·1, 0·25, 0·5, 0·75, 1, 2, 3, 5, 7, 10}, that for this data set allowed exploring a wide variety of kernels. Figure 2 gives a histogram of the evaluations of the kernel for two extreme values of the bandwidth parameter; θ=0·25 gives very high prior correlations, while θ=7 gives a kernel matrix with very low correlations in the off-diagonal.
Histogram of the evaluations of Gaussian kernel K(i,i′)=exp{−θk −1dii ′} by value of the bandwidth parameter (θ=0·25 left and θ=7, right). Here, dii ′=||xi−xi′||2 is the squared Euclidean distance between marker codes xi=(xi 1, …, xip)′ and xi′=(xi′ 1, …, xi′p)′ , and ![]() .
.
A model where g was the sum of two components: g=f0·25+f7, with p(f0·25, f7|![]() ,
, ![]() )=N(f0·25|0,K0·25
)=N(f0·25|0,K0·25
![]() )N(f7|0, K7
)N(f7|0, K7
![]() ) was fitted as well. This model is referred to as MKA, standing for marker-based model with ‘kernel-averaging’. Note that K0·25 and K7 provide very different kernels (see Fig. 2). With more extreme values of the bandwidth parameter, marker information is virtually lost. Indeed, choosing θ=0 gives a kernel matrix full of ones and θ→∞ gives Kθ→I, and averaging these two kernels gives a resulting (co)variance structure that does not use marker information at all.
) was fitted as well. This model is referred to as MKA, standing for marker-based model with ‘kernel-averaging’. Note that K0·25 and K7 provide very different kernels (see Fig. 2). With more extreme values of the bandwidth parameter, marker information is virtually lost. Indeed, choosing θ=0 gives a kernel matrix full of ones and θ→∞ gives Kθ→I, and averaging these two kernels gives a resulting (co)variance structure that does not use marker information at all.
Finally, a sequence of models including pedigree and marker data (PM) was obtained by setting g=a+Xβ, denoted as PMBL; g=a+fθ, θ={0·1, 0·25, 0·5, 0·75, 1, 2, 3, 5, 7, 10}, denoted as PMk ,θ; and, g=a+f0·25+f7, denoted as PMKA.
In all models, variance parameters were treated as unknown and assigned identical independent scaled inverse chi-square prior distributions with three degrees of freedom and scale parameters equal to 1, p(σ·2)=χ−2(σ·2|df=3, S=1). Samples from posterior distributions for each of the models were obtained with a Gibbs sampler (see de los Campos et al., Reference de los Campos, Naya, Gianola, Crossa, Legarra, Manfredi, Weigel and Cotes2009b, for the case of MBL and PMBL, and the Appendix for RKHS models). Inferences were based on all 35 000 samples obtained after discarding 2000 samples as burn-in. The distribution of prediction errors was estimated using a 10-fold CV (e.g. Hastie et al., Reference Hastie, Tibshirani and Friedman2009).
(ii) Results
Figure 3 shows the posterior means of the residual variance in Mk ,θ and PMk ,θ versus values of the bandwidth parameter θ obtained when models were fitted to the entire data. Each panel in Fig. 3 corresponds to one environment and the horizontal lines give the posterior means of the residual variance from P and PMKA. Table A1 of the Appendix gives estimates of the posterior means and of the posterior standard deviations of the residual variance from each of the 25 models, by environment. The posterior means of the residual variances indicate that models M and PM fitted the data better than P, and PMKA gave almost always better fit than Mk ,θ and PMk ,θ. In all environments, the posterior mean of the residual variance decreased monotonically with θ; this was expected because Kθ becomes increasingly local as the bandwidth parameter increases. In environments 2, 3 and 4, the slopes of the curves relating the posterior mean of residual variance to θ were gentler for PMk ,θ than for Mk ,θ. This occurs, because in PMk ,θ, the regression function has two components, one of which, the regression on the pedigree, is not a function of the bandwidth parameter. Models MBL and PMBL did not fit the training data as well as most of the RKHS counterparts, with a posterior mean of the residual variance that was close to that of Mk ,0·1 and PMk ,0·5, respectively (see Table A1 of the Appendix).
Estimated posterior mean of the residual variance versus values of the bandwidth parameter, θ, by environment and model. K θ is a marker-based RKHS regression with bandwidth parameter θ; Pedigree & Markers K θ uses pedigree and markers, here, θ is the value of the bandwidth parameter for markers. Pedigree & Markers K 0·25+K 7 uses pedigree and markers with kernel averaging (KA) E1–E4: environments where the lines were evaluated.
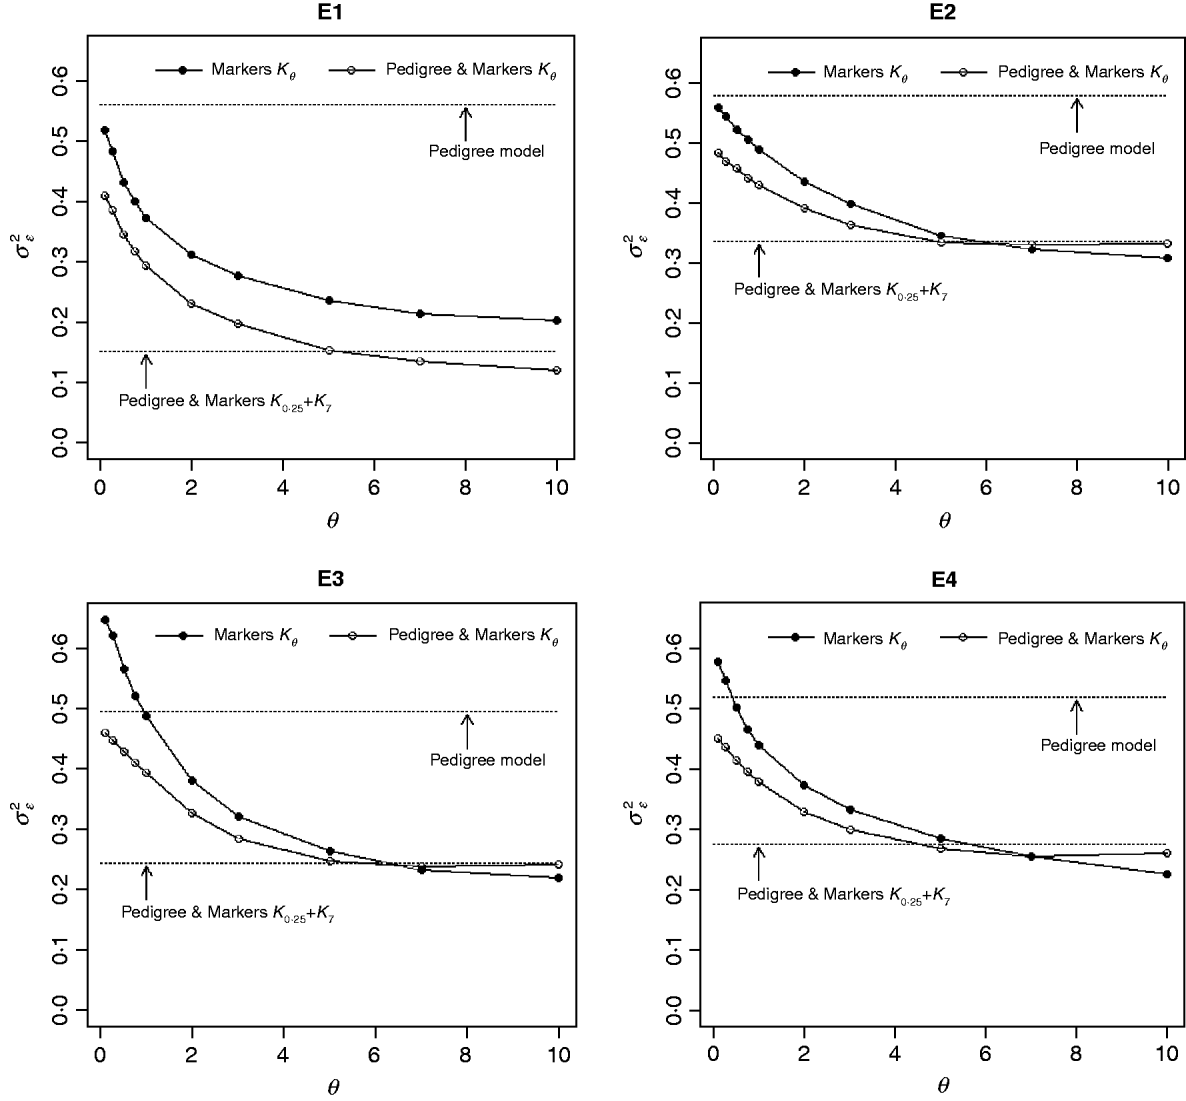
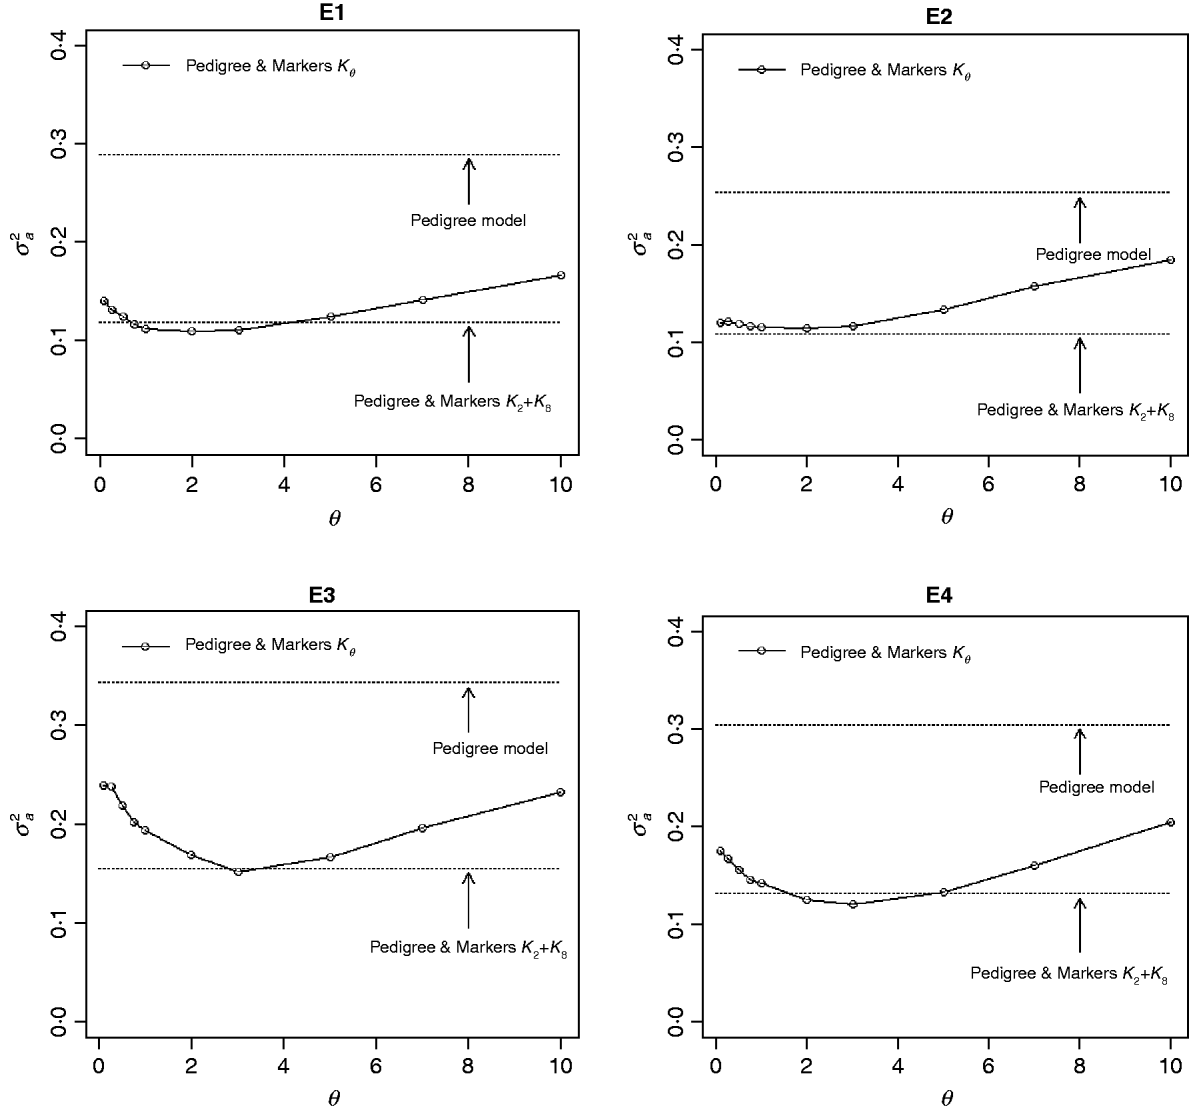
The contribution of a, that is, the regression on the pedigree, to the conditional expectation function, g, can be assessed via the posterior mean of σa 2 (see Fig. A1 in the Appendix). The posterior mean of σa 2 was larger in P models than in their PM counterparts; this was expected, because in P the regression on the pedigree is the only component of the conditional expectation function that contributes to phenotypic variance. Within PMk ,θ, the posterior mean of σa 2 was minimum at intermediate values of the bandwidth parameters. At extreme values of θ, the RK may not represent the types of patterns present in the data and, thus, the estimated conditional expectation function would depend more strongly on the regression on the pedigree (large values of σa 2).
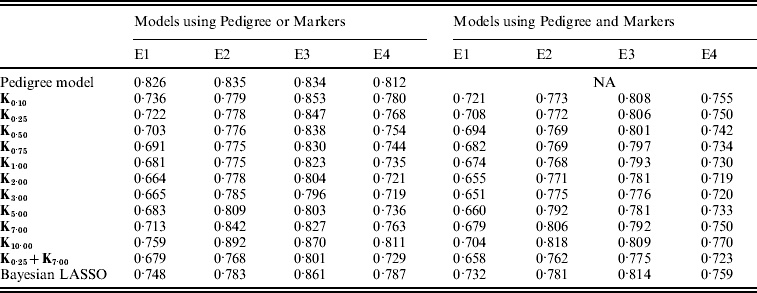
Plots in Fig. 4 give the estimated mean-squared error (MSE) between CV predictions and observations versus values of the bandwidth parameter (x-axis), by environment and model. The predictive MSE of the P and PMKA models are displayed as horizontal dashed lines, and values of those for the BL (both in MBL and PMBL) are shown at the bottom of the panels. Table A2 in the Appendix gives the estimated MSE by model and environment, respectively.
Estimated MSE between CV predictions (yHat) and observations (y) versus values of the bandwidth parameter, θ, by environment and model. K θ is a marker-based RKHS regression with bandwidth parameter θ; Pedigree & Markers K θ uses pedigree and markers, here, θ is the value of the bandwidth parameter for markers. Pedigree & Markers K 0·25+K 7 uses pedigree and markers with KA. E1–E4: environments where the lines were evaluated.

Overall, models including marker information had better predictive ability than pedigree-based models. For example, relative to P, using PMKA yielded decreases in MSE between CV predictions of observations of 20·4, 8·8, 7·0 and 11·0% for E1 through E4, respectively (Table A2 in the Appendix). Thus, it appears that sizable gains in predictive ability can be attained by considering markers and pedigrees jointly, as in PMKA. These results are in agreement with some empirical studies (e.g. Corrada Bravo et al., Reference Corrada Bravo, Lee, Klein, Klein, Iyengar and Wahba2009; de los Campos et al., Reference de los Campos, Naya, Gianola, Crossa, Legarra, Manfredi, Weigel and Cotes2009b) that provided evidence of a gain in predictive ability by jointly considering markers and pedigree information. However, marker density in this study was relatively low; as marker density increases it is expected that the relative importance of considering pedigree information will decrease (e.g. Calus & Veerkamp, Reference Calus and Veerkamp2007).
As shown in Fig. 4, the value of the bandwidth parameter that gave the best predictive ability was in the range (2,4), except for environment E2 in which values of θ near one performed slightly better. The value of the bandwidth parameter that was optimal from the perspective of predictive ability was similar in M and PM models (Fig. 4 and Table A2 in the Appendix). However, the difference between the predictive ability of PMk ,θ and Mk ,θ models was larger for extreme values of θ, indicating that PM models are more robust than M models with respect to the choice of θ. Again, this occurs because PMk ,θ involves some form of KA (between the RK evaluated in the pedigree, A, and the one evaluated in marker genotypes, Kθ).
In all environments, KA had an estimated PMSE that was either close or lower than the one obtained with any specific value of the bandwidth parameter (Fig. 4 and Table A2 in the appendix). This was observed both in models with and without pedigree. These results suggest that KA can be an effective way of choosing the RK. Finally, PMKA had higher predictive ability than PMBL; this suggests a superiority of semi-parametric methods. However, PMBL outperformed PMk ,θ for extreme values of the bandwidth parameter, illustrating, again, the importance of kernel selection. Moreover, the superiority of RKHS methods may not generalize to other traits or populations.
Using data from US Jersey sires (n=1446) genotyped with the BovineSNP50 BeadChip (42 552 Single-nucleotide polymorphisms (SNPs)) de los Campos et al. (Reference de los Campos, Gianola, Rosa, Weigel, Vazquez and Allison2010) compared the predictive ability of several RKHS models for predicted transmitting abilities of milk production, protein content and daughter pregnancy rate. Models evaluated in that study were: (a) BRR, i.e. K=XX′; (b) a Gaussian kernel evaluated over a grid of values of the bandwidth parameter, i.e. Kθ; (c) KA using the two most extreme kernels in the sequence {Kθ}; and (d) a model where K was a marker-based estimate of a kinship matrix, i.e. K=G. Results in that study are in agreement with findings reported here in that using KA gave predictive ability similar to that achieved with best performing kernel in the sequence {Kθ}. The comparison between KA, BRR and using K=G yielded mixed results: for milk yield all models performed similarly; however, for protein content BRR and G outperformed KA and the opposite was observed for daughter fertility, illustrating that the optimal choice of kernel may be trait dependent.
4. Concluding remarks
Incorporating molecular markers into models for prediction of genetic values poses important statistical and computational challenges. Ideally, models for dense molecular markers should be: (a) able to cope with the curse of dimensionality; (b) flexible enough to capture the complexity of quantitative traits and (c) amenable for computations. RKHS regressions can be used to address some of these challenges.
Coping with the curse of dimensionality and with complexity. In RKHS, the curse of dimensionality is controlled by defining a notion of smoothness of the unknown function with respect to pairs of points in input space, Cov[g(ti), g(t i′)]∝K(ti, t i′). The choice of RK becomes a central element of model specification in RKHS regressions.
As a framework, RKHS is flexible enough to accommodate many non-parametric and some parametric methods, including some classical choices such as the infinitesimal model. The frontier between parametric and non-parametric methods becomes fuzzy; models are better thought as decision rules (i.e. maps from data to estimates) and best evaluated based on performance. Predictive ability appears as a natural choice for evaluating model performance from a breeding perspective.
From a non-parametric perspective, kernels are chosen based on their properties (e.g. predictive ability). To a certain extent, this choice can be made a task of the algorithm. KA offers a computationally convenient method for kernel selection, and results on this study, as well as those of de los Campos et al. (Reference de los Campos, Gianola, Rosa, Weigel, Vazquez and Allison2010), suggests that KA is an effective strategy for kernel selection.
Computational considerations. RK Hilbert spaces methods offer enormous computational advantages relative to most of the parametric methods for regression on molecular markers. This occurs for two reasons: (a) the model can be represented in terms of n unknowns and (b) factorizations such as EV or Singular value decompositions can be used to arrive at highly efficient algorithms. Unfortunately, these benefits cannot be exploited in linear models, y=Xβ+ε, with marker-specific prior precision variances of effects such as BayesA or Bayesian LASSO. This provides RKHS with a great computational advantage relative to those methods, especially when p>>n.
Contribution of marker genotypes to prediction of genetic values. Unlike pedigrees, molecular markers allow tracing Mendelian segregation; potentially, this should allow better predictions of genetic values. Results from this study confirm this expectation. Overall, PM models outperformed P models. Further, most RKHS regression yielded better predictions than those attained with the Bayesian LASSO. However, this did not occur for every RK, indicating that the choice of the kernel is one of the main challenges when applying kernel-based methods. As stated, our results as well as those of de los Campos et al. (Reference de los Campos, Gianola, Rosa, Weigel, Vazquez and Allison2010) suggest that KA provides an effective way of choosing a kernel.
Future challenges. In the kernels used in this study all SNPs contributed equally to the RK. As the number of available markers increases, a high number is expected to be located in regions of the genome that are not associated with genetic variability of a quantitative trait. Ideally, the RK should weight each marker based on some measure of its contribution to genetic variance. In linear models such as the Bayesian LASSO, or methods Bayes A or Bayes B, the prior variances of marker effects, which are marker specific, act as weights assigned to each of the markers (e.g. de los Campos et al., Reference de los Campos, Naya, Gianola, Crossa, Legarra, Manfredi, Weigel and Cotes2009b).
In RKHS models, one could think of kernels where the contribution of each marker to the kernel is weighted according to some measure of its contribution to genetic variance. For example, one could derive weighted estimates of kinship in which each marker obtains a differential contribution. Alternatively, with a Gaussian kernel, one could think of attaching a bandwidth parameter to each marker. For example, one could use ![]() , where θk and d(xik, xi ′k) are a bandwidth parameter and a distance function associated with the kth marker.
, where θk and d(xik, xi ′k) are a bandwidth parameter and a distance function associated with the kth marker.
An approach similar to that above-described was evaluated by Long et al. (Reference Long, Gianola, Rosa, Weigel, Kranis and González-Recio2010) who used radial-basis functions evaluated on principal components (as opposed to individual markers) derived from marker genotypes. Results of that study indicate that the use of input-specific bandwidth parameters may improve predictive ability relative to a model based on a single bandwidth parameter. However, inferring these weights (or bandwidth parameters) poses several statistical challenges when p>>n. This occurs because the kernel must be re-computed every time the bandwidth parameters are updated. A natural alternative is to use two-step procedures, with a first step in which an approximation to the weights (or bandwidth parameters) is employed (e.g. with some form of single-marker regression) and a second step where genetic values are inferred. Irrespective of whether single or two-step approaches are used, the development and evaluation of algorithms for computing weighted kernels seem to constitute a central area of research for the application of RKHS to genomic models.
APPENDIX
1. Gibbs sampler
The Appendix describes a Gibbs sampler for a Bayesian RKHS regression. The parameterization is as in equation (5), extended to two random effects and with the inclusion of an intercept. Extension of the model to more than two random effects is straightforward. The derivation of the fully conditional distributions presented here uses standard results for Bayesian linear models (e.g. Gelman et al., Reference Gelman, Carlin, Stern and Rubin2004; Sorensen & Gianola, Reference Sorensen and Gianola2002).
Let K1=Λ1 Ψ1 Λ′1 and K2=Λ2 Ψ2 Λ′2 be the EV decompositions of the two kernel matrices. Extending (5) to two random effects and by including an intercept, the data equation and likelihood function become y=1μ+Λ1 δ1+Λ2 δ2+ε and p(y|μ,δ1,δ2,σ∊2)=N(y|1μ+Λ1 δ1+Λ2 δ2, Iσ∊2), respectively. The joint prior is (upon assuming a flat prior for μ)
Above, χ−2(.|df., S.) is a scaled inverse chi-square density with degree of freedom df. and scale-parameter S ., with the parameterization presented in Gelman et al. (Reference Gelman, Carlin, Stern and Rubin2004) .
The joint posterior density is proportional to the product of the likelihood and the prior; thus

The Gibbs sampler draws samples of the unknowns from their fully conditional distributions, with the conjugate priors chosen, all fully conditionals are known, as described next.
Intercept. Parameter μ enters only in the likelihood; therefore,
where yμ=y−Λ1 δ1−Λ2 δ2, and ELSE denotes all other unknowns except for μ. The fully conditional distribution is then normal with mean ![]() and variance n −1σ∊2.
and variance n −1σ∊2.
Regression coefficients. The fully conditional distribution of δ1 is

where ![]() . This is known to be a multivariate normal distribution with mean (covariance matrix) equal to the solution (inverse of the matrix of coefficients) of the following system of equations:
. This is known to be a multivariate normal distribution with mean (covariance matrix) equal to the solution (inverse of the matrix of coefficients) of the following system of equations: ![]() . Using Λ′1 Λ1=I, the system becomes
. Using Λ′1 Λ1=I, the system becomes ![]() . Since Ψ is diagonal, so is the matrix of coefficients of the above system, implying that the elements of δ1 are conditionally independent. Moreover, p(δ1j|ELSE) is normal, centred at
. Since Ψ is diagonal, so is the matrix of coefficients of the above system, implying that the elements of δ1 are conditionally independent. Moreover, p(δ1j|ELSE) is normal, centred at ![]() and with variance
and with variance ![]() , where
, where ![]() . Here, λ1j is the jth column (eigenvector) of Λ1.
. Here, λ1j is the jth column (eigenvector) of Λ1.
By symmetry, the fully conditional distribution of δ2 is also multivariate normal and the associated system of equations is ![]() , where
, where ![]() .
.
Variance parameters. The fully conditional distribution of the residual variance is
where ε=y−1μ−Λ1 δ1−Λ2 δ2. The above is a scaled inverse chi-square distribution with df=n+df∊ and scale parameter ![]() .
.
The fully conditional distribution of ![]() is
is ![]() , which is a scaled inverse chi-square distribution with
, which is a scaled inverse chi-square distribution with ![]() and scale parameter
and scale parameter ![]() . Here, Ψ1j is the jth EV of K1. Similarly, the fully conditional distribution of
. Here, Ψ1j is the jth EV of K1. Similarly, the fully conditional distribution of ![]() is scaled inverse chi-square with
is scaled inverse chi-square with ![]() and scale parameter
and scale parameter ![]() .
.
2. Tables and Figures
Posterior mean (SD) of residual variance by model and environment
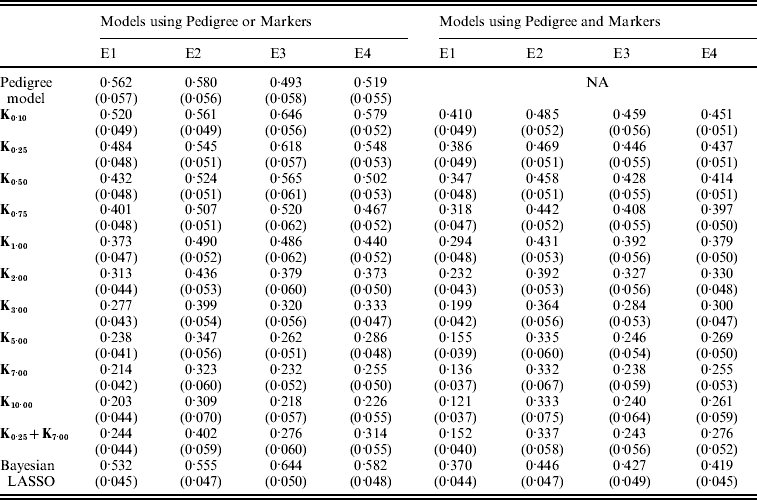
E1–E4 are the four environments where wheat lines were evaluated; Kθ are (Bayesian) RKHS models using a Gaussian kernel evaluated at marker-genotypes with bandwidth parameter θ; K0·25+K7 is a model that includes two Gaussian kernels differing only in the value of θ.
MSE between realized phenotypes and CV predictions, by model and environment
E1–E4 are the four environments where wheat lines were evaluated; Kθ are (Bayesian) RKHS models using a Gaussian kernel evaluated at marker genotypes with bandwidth parameter θ; K0·25+K7·00 is a model that includes two Gaussian kernels differing only in the value of θ.
Posterior mean of the variance of the regression on the pedigree, σa 2, versus values of the bandwidth parameter, θ, by environment and model. Pedigree & Markers K θ uses pedigree and markers, here, θ is the value of the bandwidth parameter for markers. Pedigree & Markers K 0·25+K 7 uses pedigree and markers with KA. E1–E4: environments where the lines were evaluated.
The authors thank Vivi Arief from the School of Land Crop and Food Sciences of the University of Queensland, Australia, for assembling the historical wheat phenotypic and molecular marker data and for computing the additive relationships between the wheat lines. We acknowledge valuable comments from Grace Wahba, David B. Allsion, Martin Schlather, Emilio Porcu and two anonymous reviewers. Financial support by the Wisconsin Agriculture Experiment Station; grant DMS-NSF DMS-044371 is acknowledged.


