

It is becoming increasingly evident that many human chronic diseases are linked to the health of the gastrointestinal tract. Gut health is characterised by many factors including a functioning intact gut barrier, a balanced gut microbiota composition, and absence of diseases such as inflammatory bowel disease (IBD) and colon cancer( Reference Bischoff 1 ). Maintaining a healthy gut involves a symbiotic relationship between the gut microbiota and the host immune system, thereby preserving the integrity of the intestinal barrier and minimising inappropriate inflammatory responses( Reference Bischoff 1 , Reference Cerf-Bensussan and Gaboriau-Routhiau 2 ). Dysfunction or imbalances in gut health lead to chronic human diseases, such as IBD, obesity, colon cancer, diabetes and neurological disorders( Reference Zhu, Michelle Luo and Jobin 3 – Reference Kelly and Mulder 6 ). Therefore, finding methods to maintain gut health in healthy individuals and re-establishing gut health in diseased individuals are of current interest.
Common beans (Phaseolus vulgaris) are a type of pulse crop with a long history of human health benefits, including gut health( Reference Dilis and Trichopoulou 7 – Reference Mathers 9 ). Specifically, beneficial changes in the gut microbiota profile and activity( Reference Finley, Burrell and Reeves 10 – Reference Hernandez-Salazar, Osorio-Diaz and Loarca-Pina 12 ), as well as reduced risk of colon cancer in humans and experimental models( Reference Vergara-Castaneda, Guevara-Gonzalez and Ramos-Gomez 13 – Reference Bobe, Sansbury and Albert 18 ), have been reported to be associated with bean consumption. Beans contain an array of bioactive components, namely fermentable non-digestible components and phenolic compounds, which may play a role in the gut health-promoting potential of beans( Reference Campos-Vega, Reynoso-Camacho and Pedraza-Aboytes 19 – Reference Lin, Harnly and Pastor-Corrales 21 ). Major bean components, non-starch polysaccharides, resistant starches and oligosaccharides, are fermented by the microbiota in the large intestine generating SCFA: acetate; propionate; butyrate( Reference Henningsson, Nyman and Bjorck 11 , Reference Hernandez-Salazar, Osorio-Diaz and Loarca-Pina 12 ). Butyrate exerts direct effects on colon health as it is an important energy source for colonocytes enabling proper growth and function of the epithelium( Reference Leonel and Alvarez-Leite 22 – Reference Roediger 24 ), supports healthy commensal bacterial growth( Reference Langlands, Hopkins and Coleman 25 ), increases mucus secretion via the stimulation of Muc2 (mucin 2) expression( Reference Kim and Milner 26 ), and exerts anti-inflammatory effects, in part, through the modulation of inflammation-related cell signalling pathways and enhancement of gut barrier integrity( Reference Hamer, Jonkers and Venema 23 , Reference Roediger 24 , Reference Butzner, Parmar and Bell 27 – Reference Tedelind, Westberg and Kjerrulf 32 ). Phenolic compounds present in common beans are also known to induce an array of biological effects, including reduction of colon cancer growth( Reference Bobe, Barrett and Mentor-Marcel 17 , Reference Cardona, Andres-Lacueva and Tulipani 33 – Reference Banerjee, Kim and Talcott 36 ) and oxidative stress( Reference Sung and Park 37 , Reference Yao, Wang and Liu 38 ), attenuation of immune responses( Reference Yao, Wang and Liu 38 – Reference Dong, Liu and Yu 42 ), enhancement of gut barrier integrity( Reference Ulluwishewa, Anderson and McNabb 43 , Reference Suzuki and Hara 44 ), and modulation of the microbiota community structure and activity( Reference Cardona, Andres-Lacueva and Tulipani 33 , Reference Tuohy, Conterno and Gasperotti 45 – Reference Etxeberria, Fernandez-Quintela and Milagro 47 ). Therefore, with the diverse gut modulatory effects of bioactives, gastrointestinal diseases, in addition to colon cancer, may also be beneficially modulated by common beans.
Inflammation plays a major role in the development of a number of colon-associated diseases, including IBD and colon cancer( Reference Rubin, Shaker and Levin 48 , Reference Lakatos and Lakatos 49 ). Colitis is a form of IBD associated with microbiota dysbiosis( Reference Sha, Xu and Wang 50 – Reference de Wouters, Dore and Lepage 54 ), elevated oxidative stress( Reference Lih-Brody, Powell and Collier 55 – Reference Kruidenier, Kuiper and Lamers 58 ), compromised gut barrier integrity and function (permeability, tight-junction protein expression, Toll-like receptor signalling, anti-microbial peptide production and goblet cell function)( Reference Xavier and Podolsky 59 – Reference McGuckin, Eri and Simms 63 ), and defects in the intestinal immune and inflammatory responses (NF-κB signalling, cytokine expression and immune cell infiltration)( Reference Xavier and Podolsky 59 , Reference Atreya, Atreya and Neurath 64 ). Current therapeutic interventions, including anti-inflammatory agents, immunosuppressants and antibiotics, aim to reduce inflammation during disease relapse and promote disease remission( Reference Lennard-Jones, Longmore and Newell 65 – Reference Gionchetti, Rizzello and Lammers 67 ). However, patients often suffer from side effects, fail to respond and also become resistant to these therapies( Reference Dignass, Lindsay and Sturm 68 , Reference Manz, Vavricka and Wanner 69 ). Therefore, alternative or complementary therapies, including dietary components, are being studied for their effectiveness in reducing colitis symptoms and disease progression( Reference Gonzalez, Ballester and Lopez-Posadas 70 – Reference Tighe, Cummings and Afzal 73 ).
Therefore, the primary objective of the present study was to examine the gut health-promoting potential of cooked common beans (i.e. consumption of the whole food rather than individual bioactives) in experimental colitis in mice. Although the effects of beans on colitis have not been studied previously, increased consumption of either fermentable non-digestible components or SCFA has been reported to reduce inflammation in both IBD patients and animal colitis models( Reference Scheppach, Sommer and Kirchner 29 , Reference Vernia, Annese and Bresci 74 – Reference Moreau, Martin and Toquet 80 ). Furthermore, consumption of pure phenolic compounds or phenolic-rich food extracts has been shown to attenuate disease biomarkers through reduction of colonic oxidative stress, reducing immune cell infiltration, modulating NF-κB activation and reducing the secretion of pro-inflammatory cytokines( Reference Kim, Kim and Um 40 – Reference Dong, Liu and Yu 42 , Reference Andujar, Recio and Giner 81 – Reference Baliga, Joseph and Venkataranganna 83 ). In addition, two bean varieties with striking differences in their seed coat colour (navy and black beans) were utilised in the present study. Flavonoids, including flavonols, anthocyanins and tannins are largely responsible for the different pigmentations observed in beans( Reference Beninger and Hosfield 84 ), and generally darker beans have more diverse flavonoid profiles at higher concentrations compared with the light-coloured beans( Reference Lin, Harnly and Pastor-Corrales 21 , Reference Espinosa-Alonso, Lygin and Widholm 85 , Reference Ranilla, Genovese and Lajolo 86 ). Therefore, by comparing the effects of these varieties, a secondary objective was to determine whether bean phenolic profiles affect the colitis phenotype.
Materials and methods
Preparation of bean flours and diets and experimental design
Navy beans (ACUG 10-B2) and black beans (ACUG 10-6) were provided by Dr Ali Navabi, University of Guelph, Bean Breeding Program. Whole beans were soaked overnight in 250 ml of distilled water at room temperature and cooked in a slow cooker (Hamilton Beach) on high with 0·3 % (w/v) baking powder (Kraft Canada, Inc.) for 7 h. Cooked beans and the remaining cooking water were homogenised, and the resulting bean paste was freeze-dried by the Guelph Food Technology Centre (Guelph) to produce bean flour. Proximate analyses and analyses of the crude fibre content of bean flours were carried out by Maxxam Analytics (Table S1, available online). In the present study, three isoenergetic experimental diets were used: basal diet (BD); BD supplemented with 20 % navy bean (NB) flour; BD supplemented with 20 % black bean (BB) flour, which were prepared by Harlan Laboratories in accordance with the AIN-93G diet formulation with 5 % maize oil being substituted for 5 % soyabean oil, and cellulose content increased from 5 to 7 %, to ensure that the total dietary fibre content was equal across the diets (Table 1). The soluble fibre contents of the BD, NB diet and BB diet were analysed by Maxxam Analytics and determined to be 0·4, 0·8 and 1·5 g/100 g dry weight, respectively.
Diet composition*
BD, basal diet; NB, navy bean; BB, black bean; TBHQ, tertiary butylhydroquinone.
* All diets are isoenergetic and contain 20 % protein, 7 % fat and 7 % fibre.
All experimental procedures were approved by the institutional animal care committee (University of Guelph; Animal Use Protocol# 10R067) in accordance with the guidelines of the Canadian Council of Animal Care. Male C57BL/6 mice aged 5 weeks were purchased from Charles River, housed three to four mice per cage under controlled conditions (temperature: 23 ± 2°C; humidity: 30 ± 5 %; light: 12 h light–12 h dark cycle) and acclimatised for 1 week with free access to the BD and water. Mice were assigned to one of the three dietary groups (BD n 26, NB n 13 and BB n 13) such that the group mean body weights (BW) were similar (P>0·05) and were fed these diets for 2 weeks during which food intake and BW were recorded. After 2 weeks, fresh faecal samples were snap-frozen and stored at − 80°C for later analysis of phenolic content and antioxidant activity. Experimental colitis was induced by administering 2 % (w/v) dextran sodium sulphate (DSS; molecular weight 36 000–50 000; MP Biomedicals) in the drinking-water for 7 d. Half of the mice in the BD group (n 13) were given DSS-free drinking-water and served as controls. All mice were allowed free access to food and water ad libitum throughout the study period.
During DSS exposure, food intake and water consumption were monitored. Additionally, mice were monitored daily for disease activity index (DAI), assessed by measuring BW, stool consistency and blood content in the stool. BW loss was calculated as the percentage difference compared with BW at the start of DSS exposure. Stool consistency and stool blood content were measured in fresh faecal samples using the scoring system summarised in Table S2 (available online). Beckman Coulter Hemoccult Sensa test (Fisher Scientific) was used to detect occult blood. Scores for BW loss percentage, stool consistency and stool blood were each on a scale from 0 to 3, with 0 representing the normal/healthy condition and 3 representing the worst disease outcome.
All mice were killed on day 7 of DSS exposure by cervical dislocation, blood was collected by cardiac puncture and serum was stored at − 80°C. Colons were excised (from the caeco-colonic junction to the rectum), measured for length, weighed and flushed before removing 0·5 cm sections of the proximal and distal colon, which were snap-frozen in liquid N2 and stored at − 80°C. The remaining colon was Swiss-rolled and fixed in 10 % buffered formalin solution for later histological analysis. Spleen, caecum and caecal contents were also weighed and stored at − 80°C.
Colon histopathology and immunohistochemistry
Paraffin-embedded colon Swiss rolls were sectioned (5 μm) and stained with haematoxylin and eosin or Alcian blue/Nuclear Fast Red for histological scoring of colitis severity. From the proximal to the distal colon, a crypt erosion score (1–6) and a goblet cell/mucin depletion score (1–6) were assigned using haematoxylin and eosin- or Alcian blue/Nuclear Fast Red-stained sections, respectively (see Table S3 (available online) for a description of the scoring system). Each score was then multiplied by the percentage of colon area affected, such that the most damaged colon would have a maximum score of 600. The final histological score was obtained by averaging the above crypt erosion and goblet cell depletion scores. All colon sections were viewed (200–400 × magnification) and scored blindly using a BX51 microscope (Olympus Canada, Inc.) equipped with an Olympus DP72 Digital Camera system, and the scoring system was developed in consultation with a veterinary pathologist (G. A. W.). This scoring method was also validated by correlating the scores with colonic myeloperoxidase (MPO) levels and colon weight:length ratio, which are well-known biomarkers of colonic inflammation( Reference Masoodi, Tijjani and Wani 87 , Reference Charpentier, Marion-Letellier and Savoye 88 ).
To determine the level of apoptosis within the colon epithelium of DSS-exposed mice (n 7–8 per dietary group), immunohistochemistry was performed using the active caspase-3 antibody (cleaved caspase-3 (ASP175) (#9661); Cell Signaling Technology). Briefly, formalin-fixed, paraffin-embedded sections of colon Swiss rolls were deparaffinised in xylene and rehydrated in graded ethanol, and antigens were retrieved in 10 mm-citrate buffer (pH 6·0) in a microwave for 15 min. The sections were incubated in a solution of 3 % H2O2 for 10 min to inhibit endogenous peroxidase activity. The sections were then blocked with 5 % normal goat serum in Tris-buffered saline with Tween-20 for 1 h at room temperature. Primary antibody (1:300) was prepared in SignalStain Antibody Diluent (#8112) (Cell Signaling Technology) and added to the sections overnight at 4°C in a humidified chamber. Washed sections were then treated with the SignalStain Boost IHC Detection Reagent (HRP, Rabbit) #8114 (Cell Signaling Technology) for 30 min in a humidified chamber, followed by treatment with a liquid diaminobenzidine+substrate chromogen system (Dako Canada) for 3·5 min. The sections were counterstained with haematoxylin, dehydrated and coverslipped using Permount (Fisher Scientific). Negative control sections were treated the same as described above, except primary antibody was replaced with antibody diluent.
For the quantification of apoptosis, the sections were viewed blindly (400 × magnification) using a BX51 microscope (Olympus Canada, Inc.) equipped with an Olympus DP72 Digital Camera system. The numbers of positive cells (brown staining) were counted throughout the entire colon, which was further divided into the proximal and mid–distal colon sections. Furthermore, apoptosis within areas showing intact crypt architecture was quantified separately from apoptosis within areas identified as ulcers (no crypt architecture remaining). The length of the entire colon, as well as that of the proximal and mid–distal colon, was measured, and apoptosis is expressed as the number of positive cells/mm colon.
Colonic myeloperoxidase and glutathione peroxidase assays
Distal colon tissue samples were homogenised in a lysis buffer (200 μl/10 mg colon) containing 28 μg aprotinin/ml, 1 μg leupeptin/ml and 1 mm-phenylmethanesulfonyl fluoride in a Tris buffer with 10 % glycerin and 5 mm-EDTA, and the protein concentration of each sample was determined using a colorimetric Bio-Rad protein assay (Bio-Rad). Colonic MPO levels were measured by ELISA (Hycult Biotech) following the manufacturer's instructions, and the final values were corrected for protein concentration. Glutathione peroxidase (GPx) activity in colon lysates was measured using the Chemical GPx Kit (Cayman Chemical) as per the manufacturer's instructions, and enzyme activity is expressed as GPx units/mg protein.
Serum cytokine analysis
Serum concentrations of IL-10, IL-1β, IL-6, IL-17A TNF-α and interferon-γ (IFN-γ) were simultaneously assayed using the Bio-PlexPro Assay (Bio-Rad). All samples were run in duplicate using the Bio-Plex 200 System (Bio-Rad) according to the manufacturer's instructions.
Colonic mRNA expression analysis
Proximal colon RNA was isolated by TRIzol/chloroform extraction and purified using the RNeasy kit (Qiagen). Samples were DNase treated using the RNase-Free DNase kit (Qiagen), and RNA quality was assessed using Experion RNA Analysis Kits (Bio-Rad). Total RNA (1 μg) was converted to complementary DNA using the RT2 First Strand Kit (Qiagen), and quantitative real-time PCR was carried out on the ViiA7 Real-Time PCR System (Life Technologies) using the Mouse Inflammatory Response and Autoimmunity PCR Arrays (PAMM-077Z, Qiagen). Data were analysed using the ΔΔC T method to determine the expression level of each transcript normalised to that of the housekeeping genes provided on the arrays. All data were normalised to the relative expression level of each gene of interest in healthy mice that consumed the BD.
Caecal SCFA analyses
The concentrations of caecal SCFA (acetate, propionate and butyrate) were determined by GC as described by Sugawara & Miyazawa( Reference Sugawara and Miyazawa 89 ) with slight modifications. Caecal contents were first freeze-dried, and after homogenisation( Reference Sugawara and Miyazawa 89 ), the resultant supernatant was filtered through a 0·2 μm polyvinylidene difluoride filter (Chromatographic Specialties Inc.), and 1 μl of the filtrate was used for injection into the GC system (Hewlett Packard 5890 Series II) using J & W GC columns (CP WAX 52 CB 30 × 0·53 (1·0); Agilent Technologies). Injector and detector temperatures were maintained at 240 and 280°C, respectively. The oven temperature, after an initial period of 1 min at 75°C, was increased to 180°C at a rate of 6°C/min, then increased by 10°C/min and held at 230°C for 6 min. The final oven temperature was increased by 2°C/min and kept at 240°C for 5 min. The peaks were identified by comparing their retention times with acetate, propionate and butyrate GC standards (Sigma-Aldrich). Data collection was managed using the HPCHEM software developed by Agilent Technologies.
Phenolic compound extraction
Total phenolics were extracted from the NB and BB flours and all the three experimental diets (1 g) using the microwave-assisted extraction method( Reference Sutivisedsak, Cheng and Willett 90 ). The supernatant from the NB and BB flour phenolic extracts (2 ml) was hydrolysed with 1 ml of 6 m-HCl at 85°C for 2 h for later anthocyanin profile determination (Fig. S1, available online). Faecal phenolic compounds were extracted as described by Espín et al. ( Reference Espín, González-Barrio and Cerdá 91 ).
Total phenolic content and total flavonoid content assays
The Folin–Ciocalteu method was used to determine the total phenolic content in both diet and faecal extracts as described by Li et al. ( Reference Li, Deng and Liu 92 ), and it is expressed as mg gallic acid equivalents per sample (g). Total flavonoid content in diet and faecal extracts was determined using a colorimetric method as described by Zhishen et al. ( Reference Zhishen, Mengcheng and Jianming 93 ) with slight modifications. Briefly, 100 μl of catechin (0–100 mg/l) or sample extracts were added to a 2 ml microcentrifuge tube containing 400 μl of double-distilled water and 30 μl of 0·75 m-NaNO2. After 5 min, 30 μl of 0·75 m-AlCl3 were added, followed by the addition of 200 μl of 1 m-NaOH 1 min later. The mixtures were diluted with 240 μl of double-distilled water and vortexed, and absorbance was read at 510 nm using a microplate reader (PowerWave XS2; BioTek). Total flavonoid content is expressed as mg catechin equivalents per sample (g).
Antioxidant activity assay
Antioxidant activity was measured using the ferric reducing antioxidant power (FRAP) and oxygen radical absorbance capacity (ORAC) assays as described elsewhere( Reference Li, Deng and Liu 92 ).
Statistical analyses
All data were analysed by one-way ANOVA (main effect: diet) with the exception of food intake, BW and BW change percentage, which were analysed by two-way ANOVA (main effects: diet and time). The Student–Newman–Keuls, least-squares means or Dunn non-parametric tests were used for all post hoc analyses. Differences were considered significant with P< 0·05, and all values are expressed as means with their standard errors. Pearson's correlation analyses were carried out to examine the relationship between histological scores and colonic MPO activity or colon weight:length ratio. Statistical analyses were carried out using GraphPad Prism 5.0 (GraphPad Software, Inc.), Sigma Plot 12.0 (Systat Software, Inc.) and SAS system (SAS Institute) for Windows (version 9.0).
Results
Phenolic content, antioxidant activity and anthocyanin profile
Phenolic content in both the experimental diets and mouse faecal samples collected before DSS exposure was determined. The BB diet and BB group faecal samples had the highest phenolic content (total phenolic content and total flavonoid content) and antioxidant activity (FRAP and ORAC), followed by the NB diet and NB group faecal samples and then the BD and BD group faecal samples, which had the lowest values in all measurements (Table 2). Although ORAC was undetectable in the BD, faecal samples collected from the BD group exhibited a detectable ORAC, possibly due to the presence of other faecal or microbiota-derived phenolic compounds. The anthocyanin profile of both the NB and BB flours revealed five anthocyanin compounds (delphinidin, cyaniding, petunidin, pelargonidin and malvinidin; Fig. S1, available online), which were identified only in the BB flour.
Phenolic compound content (total phenolic content (TPC) and total flavonoid equivalents (TFC)) and antioxidant activity (ferric reducing antioxidant power (FRAP) and oxygen radical absorbance capacity (ORAC)) in the diet and mouse faecal extracts (Mean values with their standard errors)*
BD, basal diet; NB, navy bean; BB, black bean; GAE, gallic acid equivalents; CE, catechin equivalents; AAE, acetic acid equivalents; TE, Trolox equivalents.
a,b,cMean values within a row with unlike superscript letters were significantly different (P< 0·05).
* For the diet analysis, n 3 per dietary group; for the faecal analysis, n 6–8 per dietary group.
Dextran sodium sulphate-induced colitis disease activity index
Before DSS exposure, there was no difference in food intake or BW between the dietary groups (P>0·05; Table S3, available online). During DSS exposure, mice continuously reduced their intake of food and water compared with the BD-fed healthy control mice; however, there were no significant differences between the DSS-exposed groups (Fig. 1). Throughout the DSS exposure period, mice were monitored daily for phenotypic changes (BW loss, stool consistency and stool blood content), which collectively comprise the DAI score (Fig. 1). After 1 d of DSS exposure, all the dietary groups exhibited an increased DAI score compared with the healthy age-matched control mice (DAI = 0), but there were no differences between the DSS-treated dietary groups. Only on day 3 of DSS exposure, the BB+DSS group exhibited an improved DAI score compared with the NB+DSS group; however, it still did not differ from the BD+DSS group (P< 0·05). At all the other time points throughout the DSS exposure period, there was no difference in DAI scores between the DSS-treated dietary groups.
Time course (7 d) of changes in (A) food intake, (B) water intake and (C) the disease activity index (DAI) score in healthy mice fed the BD (○) and colitic mice fed the BD+DSS (●), NB+DSS (Δ) and BB+DSS (▲) diets. Values are means (n 13 per dietary group), with their standard errors represented by vertical bars. a,b,cMean values with unlike superscript letters were significantly different at each time point (day of DSS exposure) (P< 0·05; Kruskal–Wallis test followed by Dunn's multiple comparison test). BD, basal diet; NB, navy bean; BB, black bean; DSS, dextran sodium sulphate.
Caecal SCFA concentrations
There was a reduction in caecal weight (tissue+caecal contents) in the BD+DSS group compared with that in both the BD-fed group and the NB diet-fed and BB diet-fed DSS-treated groups (Table 3). Analysis of caecal contents revealed that DSS exposure (BD+DSS) reduced the total SCFA concentrations relative to the BD-alone dietary treatment, and this was attenuated by both the NB and BB diets, which had increased total SCFA concentrations (Table 3). Analysis of the specific SCFA species revealed that both bean diets significantly increased caecal acetate, propionate and butyrate concentrations relative to both the BD+DSS and BD-alone dietary treatments (P< 0·05; Table 3).
Effect of the bean diets on caecal weight and SCFA concentrations in colitic mice (Mean values with their standard errors; n 13 per dietary group)
BD, basal diet; DSS, dextran sodium sulphate; NB, navy bean; BB, black bean; DW, dry weight.
a,b,cMean values within a row with unlike superscript letters were significantly different (P< 0·05).
Colon histology and biomarkers of immune cell infiltration and oxidative stress
Phenotypic changes in colon size (i.e. increased colon weight:length ratios) were apparent in all the DSS-treated mice compared with the healthy control mice (Fig. 2), which were further increased in mice that consumed the bean-containing diets compared with those in the BD+DSS group (P< 0·05). Colon tissue sections of the DSS-treated mice displayed an increase in crypt distortion and, as expected, had multiple erosive lesions (indicative of increased colonic damage) compared with those of the healthy control mice (representative images for all groups are shown in Fig. 2). Furthermore, the distribution of histological damage induced by DSS was similar in the proximal colon, mid-colon and distal colon (Fig. S2, available online). Both the NB+DSS and BB+DSS groups exhibited an increase in the total colon histological score compared with the BD+DSS group, indicating an aggravation of DSS-induced colonic damage (Fig. 2). Although the histological damage score was highest for the proximal colon and mid-colon sections of the bean diet-fed mice, a significant difference was observed only in the scores for the mid-colon section, wherein the NB diet-fed mice had significantly higher histological damage scores compared with the DSS control mice (Fig. S2, available online).
Colitis severity as indicated by colon size, histological damage, myeloperoxidase (MPO) level and antioxidant (glutathione peroxidase, GPx) activity in healthy mice fed the basal diet (BD) and dextran sodium sulphate (DSS)-induced colitic mice fed the BD, navy bean (NB) diet and black bean (BB) diet. Colon size (n 12–13 per dietary group) expressed as colon weight (mg)/colon length (mm). Histological scores reflect both the degree of damage and the percentage of area damaged in the entire length of the colon (n 7 per dietary group). MPO levels and GPx activity (n 10–12 per dietary group). Values are means with their standard errors. a,b,cMean values within a column with unlike superscript letters were significantly different for each analysis (P< 0·05). Representative colon images of tissue sections of the (A) BD, (B) BD+DSS, (C) NB+DSS and (D) BB+DSS groups stained with Alcian blue/Nuclear Fast Red (200 × ; scale bar 100 μm).
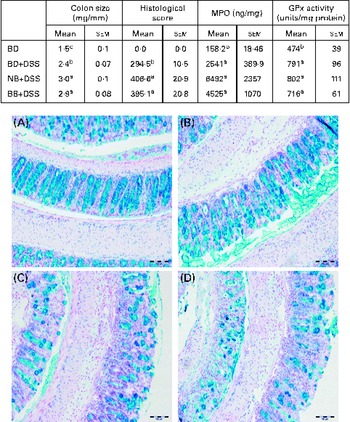
Distal colon GPx activity was increased in all the DSS-exposed groups compared with that in the healthy control mice, but it did not differ between the dietary groups, indicating that DSS-induced oxidative stress in the distal colon was not modulated by the bean diets (Fig. 2). Similarly, the distal colon MPO level (indicative of neutrophil infiltration) was increased in all the DSS-treated mice compared with that in the healthy control mice; however, it did not differ between the dietary groups (Fig. 2). Additionally, a significant positive correlation existed between histological scores and colon weight:length ratio (r 0·5313; P= 0·0192) and colonic MPO levels (r 0·6242; P= 0·0033), confirming that these biomarkers are reflective of increased colonic inflammation and damage.
Colonic mRNA expression
All gene expression data were normalised to the expression levels in the healthy control mice (BD alone). As expected, DSS exposure led to the differential expression of 55 % of the genes assessed within the Mouse Inflammatory Response and Autoimmunity PCR Array pathway compared with the gene expression in the healthy control mice (BD v. BD+DSS; Table S4, available online). The magnitude of the change in gene expression between the dietary groups exposed to DSS is summarised in Table 4. Compared with the BD+DSS dietary treatment, both bean diets reduced the colonic mRNA expression of the inflammatory cytokines IL-6, IFN-γ and IL-22 (P< 0·05) and up-regulated the expression of the anti-inflammatory cytokine IL-10 (P= 0·01). Additionally, both bean diets differentially affected the mucosal expression of genes involved in neutrophil chemotaxis by decreasing the expression of chemokine (C–X–C motif) ligand 1 (Cxcl1) and Cxcl5 (P= 0·008 and P= 0·037, respectively) and increasing the expression of IL-8 (P= 0·04). The mucosal mRNA expression of Toll-like receptor 4 (Tlr4) was modestly increased (P= 0·003) and the mRNA expression of Fas ligand (FasL) was also up-regulated by both bean diets (P= 0·001). Only the BB diet reduced the colonic mRNA expression of IL-17A compared with the BD+DSS dietary treatment (P= 0·042). Conversely, only the NB diet increased the mRNA expression of chemokine (C–C motif) ligand (Ccl12) and CCAAT/enhancer binding protein (C/EBP), β (Cebpb) (P= 0·033 and P= 0·041, respectively) and decreased the expression of IL-9 (P= 0·047) compared with the BD+DSS dietary treatment.
Dextran sodium sulphate (DSS)-induced fold changes in proximal colon mRNA expression* (Mean values with their standard errors)
BD, basal diet, NB, navy bean; BB, black bean; Ccl, chemokine (C–C motif) ligand; Cxcl, chemokine (C–X–C motif) ligand; Cebpb, CCAAT/enhancer binding protein (C/EBP), β; FasL, Fas ligand; IFN-γ, interferon-γ; Tlr, Toll-like receptor.
a,bMean values within a row with unlike superscript letters were significantly different (P< 0·05).
* Values reported are fold changes in the colonic mRNA expression of the DSS-treated mice (n 6–7 per dietary group) normalised to the expression level of the BD-fed healthy control mice (n 4). The effect of diet on DSS-induced changes in mRNA expression for each gene detected on the Mouse Inflammatory Response and Autoimmunity PCR Arrays (PAMM-077Z; Qiagen) was analysed by one-way ANOVA, and only the results obtained for genes that were differentially expressed between the dietary groups in response to DSS are reported.
Colonic cleaved caspase-3 expression
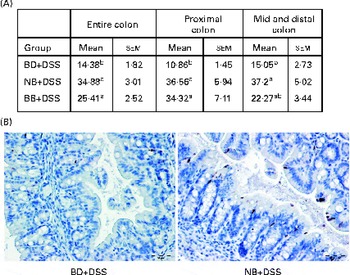
The level of apoptosis in the colonic epithelium of the DSS-exposed mice was determined by cleaved caspase-3 immunostaining of sections from colon Swiss rolls. As shown in Fig. 3, colon tissue sections of the NB diet-fed and BB diet-fed DSS-exposed mice exhibited an increase in the number of apoptotic cells within crypts throughout the entire length of the colon, compared with those of the BD-fed DSS-exposed mice (P< 0·05). When the colon was divided into either the proximal or the mid–distal half, it was evident that apoptosis was increased in crypts from both locations of the colon in the NB diet-fed mice, compared with that in the BD-fed DSS-exposed group (P< 0·05). While this pattern was similar for the BB diet-fed mice, apoptosis was significantly higher only in the proximal colon of the BB diet-fed mice, compared with that in the BD-fed DSS-exposed mice (Fig. 3). Cleaved caspase-3 immunostaining was also assessed within ulcerated areas in the colon tissue sections; however, there was no significant difference in the mean number of apoptotic cells/mm ulcer between the BD-fed (16·09 (sem 3·54)), NB diet-fed (30·66 (sem 4·76)) and BB diet-fed (24·07 (sem 3·65)) DSS-exposed groups (P>0·05).
Cleaved caspase-3-positive apoptotic cells in the colonic epithelium of the dextran sodium sulphate (DSS)-exposed mice. Cleaved caspase-3 expression was analysed by immunohistochemistry in the colon sections of the DSS-treated mice fed the basal diet (BD), navy bean (NB) diet or black bean (BB) diet. (A) Total number of positive cells/mm colon within crypt-containing areas along the entire colon, proximal colon, and mid and distal colon. Values are means with their standard errors. a,bMean values within a column with unlike superscript letters were significantly different (P< 0·05; Kruskal–Wallis followed by Dunn's multiple comparison test). (B) Representative images of the proximal colon of the DSS-exposed BD-fed, NB diet-fed and BB diet-fed mice, wherein brown-stained cells demonstrate cleaved caspase-3 immunostaining (500 × ; scale bar 50 μm).
Systemic response to dextran sodium sulphate exposure
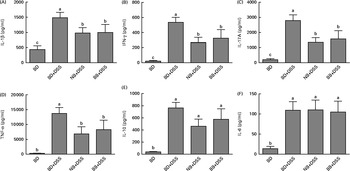
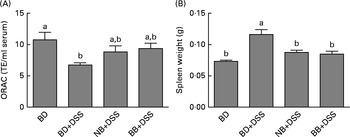
DSS exposure increased the serum concentrations of all cytokines assessed compared with those of the healthy control mice (Fig. 4; P< 0·05). In the DSS-treated mice, the serum concentrations of the inflammatory cytokines IL-1β, IFN-γ, TNFα and IL-17A were reduced by both the NB and BB diets (Fig. 4(A)–(D); P< 0·05), whereas the circulating concentrations of IL-6 and IL-10 did not differ between the dietary groups (P>0·05; Fig. 4(E) and (F)). Additionally, serum ORAC in the BD+DSS group was significantly lower than that in the healthy control mice, indicating a decrease in antioxidant capacity following DSS exposure, which was attenuated by both bean diets (Fig. 5). Similarly, splenic tissue weights were increased in response to DSS exposure (BD+DSS v. BD alone), which was attenuated in both the NB+DSS and BB+DSS groups (Fig. 5).
Serum cytokine concentrations of (A) IL-1β, (B) interferon-γ (IFN-γ), (C) IL-17A (D) TNF-α, (E) IL-10 and (F) IL-6 in healthy mice fed the basal diet (BD) and dextran sodium sulphate (DSS)-induced colitic mice fed the BD, navy bean (NB) diet and black bean (BB) diet. Values are means, with their standard errors represented by vertical bars. a,b,cMean values with unlike superscript letters were significantly different (P< 0·05).
Systemic effects of the bean diets on spleen weight and serum antioxidant status in healthy mice fed the basal diet (BD) and dextran sodium sulphate (DSS)-induced colitic mice fed the BD, navy bean (NB) diet and black bean (BB) diet. (A) Serum antioxidant capacity measured by oxygen radical absorbance capacity (ORAC, n 5–6 per dietary group). (B) Spleen weight (n 11–13 per dietary group). Values are means, with their standard errors represented by vertical bars. a,bMean values with unlike superscript letters were significantly different (P< 0·05). TE, Trolox equivalents.
Discussion
The present study assessed the effect of diets supplemented with 20 % cooked common bean flours (navy and black bean varieties) on the DSS-induced acute colitis phenotype. It was hypothesised that bean diets would beneficially modulate colonic inflammation in response to DSS due to the fermentable fibre components (i.e. resistant starch, oligosaccharides and non-starch polysaccharides)( Reference Campos-Vega, Reynoso-Camacho and Pedraza-Aboytes 19 , Reference Cruz-Bravo, Guevara-Gonzalez and Ramos-Gomez 20 ) and phenolic compound content of beans( Reference Lin, Harnly and Pastor-Corrales 21 ), which are known to reduce colonic inflammation and improve colon health( Reference Yao, Wang and Liu 38 – Reference Park, Ji and Sung 41 , Reference Rodriguez-Cabezas, Galvez and Lorente 75 , Reference Rodriguez-Cabezas, Camuesco and Arribas 79 , Reference Moreau, Martin and Toquet 80 ). Common beans have been investigated previously for their role as modulators of gut health, primarily in reducing colon cancer risk( Reference Mathers 9 , Reference Vergara-Castaneda, Guevara-Gonzalez and Ramos-Gomez 13 , Reference Hayde, Ramon and Lorenzo 14 , Reference Bobe, Barrett and Mentor-Marcel 17 , Reference Cruz-Bravo, Guevara-Gonzalez and Ramos-Gomez 20 , Reference Campos-Vega, García-Gasca and Guevara-Gonzalez 94 ); however, the present study is the first to demonstrate their role in the modulation of colitis and colitis-associated systemic inflammation.
In the present study, critical mediators of colonic and systemic inflammation and colonic mucosal damage were clearly modulated by the bean diets in mice exposed to DSS. Evidence of a reduced local (colonic) inflammatory response to DSS in the bean diet-fed groups was supported by the reduced mRNA expression of the pro-inflammatory cytokines IL-6 and IFN-γ and the up-regulated mRNA expression of the anti-inflammatory cytokine IL-10 (Table 4). The bean-associated anti-inflammatory phenotype was extended systemically, as circulating concentrations of the inflammatory cytokines IL-1β, IFN-γ, TNF-α and IL-17A were reduced (Fig. 4), serum antioxidant capacity was preserved and spleen hypertrophy was attenuated (Fig. 5) in the NB and BB dietary groups. This effect could be interpreted to reflect a reduced magnitude in the inflammatory response generated following exposure to DSS, as circulating cytokine concentrations represent a spillover into the extravascular compartment wherein inflammatory responses are generated( Reference Bienvenu, Monneret and Gutowski 95 ). On the other hand, the bean diets enhanced DSS-induced colon histological damage (Fig. 2) and increased the mRNA expression of FasL (apoptosis mediator) (Table 4) and the number of apoptotic cells in the colon (Fig. 3), indicating the aggravation of DSS-induced colitis. Overall, the present results demonstrate that bean diets beneficially modulate some biomarkers of colonic and systemic inflammation while simultaneously enhancing DSS-induced colonic damage and apoptosis.
The beneficial effects observed following the consumption of bean diets may have been driven by the SCFA, in particular, butyrate – a microbial fermentation end product of non-digestible bean components( Reference Henningsson, Nyman and Bjorck 11 , Reference Hernandez-Salazar, Osorio-Diaz and Loarca-Pina 12 ). Mechanistically, butyrate is an important energy source for the maintenance and growth of colonocytes, enhancing the integrity of the gut barrier and exerting direct effects within the colon epithelium through the modulation of inflammation-related signalling pathways, in part, through the inhibition of histone deacetylase activity( Reference Leonel and Alvarez-Leite 22 – Reference Roediger 24 ). In the present study, the caecal concentrations of SCFA (acetate, propionate and butyrate) were increased by the bean diets (Table 3). Furthermore, proximal colon samples of the bean diet-fed mice exhibited reduced mRNA expression of IFN-γ, IL-6, and Cxcl5, as well as increased expression of IL-10 ( Reference Sanz, Santacruz and GauffinTable 4), pro- and anti-inflammatory mediators previously been shown to be modulated by butyrate( Reference Saemann, Bohmig and Osterreicher 96 – Reference Blais, Seidman and Asselin 98 ). Interestingly, although the bean diets reduced the proximal colon mRNA expression of the chemokines Cxcl1 and Cxcl5, which are involved in the recruitment of immune cells to the inflamed colon( Reference Romagnani, Lasagni and Annunziato 99 ), distal colon MPO levels (biomarker of neutrophil infiltration) did not differ significantly between the DSS-exposed groups (Fig. 2). Generally, SCFA are more concentrated in the proximal colon and gradually deplete as the faeces moves through the colon( Reference Topping and Clifton 100 ). Therefore, if the bean-induced changes in chemokine mRNA expression in the proximal colon were mediated by butyrate, this effect may not have persisted in the distal regions of the colon, where butyrate concentrations are low.
Beans are also a rich source of phenolic compounds( Reference Lin, Harnly and Pastor-Corrales 21 , Reference Espinosa-Alonso, Lygin and Widholm 85 , Reference Ranilla, Genovese and Lajolo 86 ), and it was hypothesised that higher phenolic content and antioxidant activity may result in lower oxidative stress and, therefore, an attenuation of colitis symptoms. Both IBD and DSS-induced animal models of colitis are associated with increased colonic and systemic biomarkers of oxidative stress( Reference Lih-Brody, Powell and Collier 55 – Reference Kruidenier, Kuiper and Lamers 58 , Reference Krzystek-Korpacka, Neubauer and Berdowska 101 , Reference Zhu and Li 102 ). Oxidative stress results from the increased production of reactive oxygen species and reactive nitrogen species, produced mainly by activated inflammatory cells, which aggravate colonic damage and perpetuate the inflammatory cycle( Reference Zhu and Li 102 , Reference Rezaie, Parker and Abdollahi 103 ). Therefore, antioxidants are currently being investigated for their role in the reduction of oxidative stress in colitis( Reference Sung and Park 37 , Reference Singh, Singh and Busbee 104 – Reference Millar, Rampton and Chander 106 ). Both bean diets contained higher phenolic compound content (increased total phenolic content and total flavonoid content) and antioxidant potential (increased FRAP and ORAC) compared with the BD (Table 2). In both instances, the BB diet had the highest phenolic compound load and antioxidant activity, which could be attributed to the addition of anthocyanins that were present only in the BB diet (Fig. S1, available online). Moreover, faecal phenolic compound content and antioxidant activity were elevated in mice that consumed both the bean-containing diets compared with those in mice that consumed the BD (Table 2), with the highest levels being detected in samples obtained from mice that consumed the BB diet, thereby demonstrating that these compounds were reaching the distal colon and could exert direct effects during colitis.
Mechanistically, however, the role of bean phenolics as antioxidants in the colon tissue was not supported in the present study. DSS is known to increase oxidative stress in the colon tissue, thereby increasing tissue antioxidant enzyme activity (i.e. GPx)( Reference Tham, Whitin and Cohen 107 , Reference Te Velde, Pronk and de Kort 108 ). The present study supports previous findings, demonstrating that DSS exposure increases colonic GPx activity and MPO levels (enzyme involved in free-radical generation)( Reference Zhu and Li 102 ) in the colon tissue (Fig. 2). Similarly, serum ORAC, a measure of systemic antioxidant capacity, was reduced in DSS-exposed mice fed the BD (Fig. 5), indicating the depletion of endogenous antioxidants potentially due to elevated oxidative stress( Reference Krzystek-Korpacka, Neubauer and Berdowska 101 , Reference Trivedi and Jena 109 ). However, colonic GPx activity in the bean diet-fed groups did not differ from that in the DSS control mice, indicating that the bean phenolics were not acting as antioxidants in the colon tissue. On the other hand, the bean diet-fed DSS-exposed mice had serum ORAC that did not differ from that of the healthy control mice, indicating improved or sustained systemic antioxidant capacity (Fig. 5). Whether this indicates an increase in circulating antioxidants due to phenolic-rich bean consumption or a general reduction in systemic inflammation, and thus oxidative stress, in the bean diet-fed mice is currently unknown. However, the reduction of serum cytokine concentrations (Fig. 4) and attenuation of spleen hypertrophy (Fig. 5) induced by the bean diets indicate an overall reduction of systemic inflammation.
Phenolic compounds are also known to induce a myriad of cellular effects, beyond that of their antioxidant potential. One mechanism through which bean phenolic compounds exert an anti-inflammatory effect is the modulation of NF-κB signalling and subsequent expression of inflammatory mediators such as IL-6, TNF-α and IL-1β( Reference Yao, Wang and Liu 38 – Reference Park, Ji and Sung 41 , Reference Kwon, Murakami and Tanaka 110 – Reference Deguchi, Andoh and Inatomi 117 ). Interestingly, despite the BB diet having a higher phenolic content, both the NB and BB diets exhibited similar effects on inflammatory cytokine expression by reducing the colonic mRNA levels of IL-6 (Table 4) and the circulating concentrations of both TNF-α and IL-1β (Fig. 4). However, compared with the BD+DSS dietary treatment, only the BB diet reduced the colonic mRNA expression of IL-17A, indicating an additional anti-inflammatory benefit that could be attributed to the presence of anthocyanins, which have been shown to reduce colitis severity( Reference Akiyama, Nesumi and Maeda-Yamamoto 118 , Reference Piberger, Oehme and Hofmann 119 ). Collectively, our data demonstrate that bean phenolic compounds may account, at least in part, for the observed reduction of pro-inflammatory cytokine concentrations, which contributes to the decrease in the severity of the colitis phenotype.
On the other hand, the bean diets also induced a significant increase in the colonic architectural damage caused by DSS (Fig. 2). While the mechanisms by which beans mediated this response are not yet clear, both bean diets up-regulated the proximal colon mRNA expression of FasL compared with that in the DSS control group (Table 4). FasL targets cells to undergo apoptosis via the trimerisation of the Fas receptor and subsequent recruitment of caspase 8, which in turn activates caspase-3, leading to apoptosis( Reference Kidd 120 ). We also demonstrated an increase in the number of apoptotic (cleaved caspase-3) cells within the colon crypts of the bean diet-fed mice compared with that in the DSS control group (Fig. 3). An increase in apoptosis can result in reduced gut barrier integrity, impaired wound healing and delayed epithelial restitution, which would lead to increased or prolonged damage caused by DSS( Reference Goretsky, Dirisina and Sinh 121 – Reference Ho, Dvorak and Moor 124 ). Thus, increased apoptosis may have played a role in the bean diet-mediated increase in colonic damage observed in the present study.
Currently, there is no evidence to suggest that cooked bean-supplemented diets would induce toxic or adverse effects in the colon. Although raw beans are known to contain a number of anti-nutritional components (i.e. lectins and protease inhibitors) that may adversely affect gut health, the method used for preparing the cooked bean flours (i.e. soaking and heating) in the present study might have reduced their content in the animal diets( Reference Gebrelibanos, Tesfaye and Raghavendra 8 , Reference Deshpande, Sathe and Salunkhe 125 , Reference Kumar, Verma and Das 126 ). Furthermore, many animal studies of longer duration and higher doses of cooked beans have been conducted with no reports of adverse health effects, reduced dietary intake or growth rate( Reference Bobe, Barrett and Mentor-Marcel 17 , Reference Zhu, Jiang and Thompson 127 – Reference Hughes, Ganthavorn and Wilson-Sanders 129 ). The present results also confirm that the bean diets were well tolerated by the mice, as the growth rate and diet intake did not differ between the dietary groups (Table S3, available online). This may suggest that this phenomenon was related to the disease model and/or the colitis induction system employed in the present study, in particular, the use of DSS to induce colitis.
Increased colonic damage may be caused by increased DSS exposure; however, we did not observe differences in water intake during DSS exposure (Fig. 1), indicating that the intake of DSS did not differ between the dietary groups. On the other hand, there may have been differences in the delivery of DSS to the colon. In fact, earlier studies have reported that the consumption of bean-supplemented diets increases gastrointestinal transit time in rodents( Reference Key, McClean and Mathers 130 ). Therefore, the increased gastrointestinal transit time might have prolonged the exposure of the luminal contents to the intestinal tract, including DSS, thereby inducing greater mucosal damage in the bean diet-fed mice. Although the diets used in the present study contained equal macronutrient and total dietary fibre levels (Table 1), the bean diets contained an array of non-digestible fermentable components, which may have increased intestinal lumen viscosity, water-holding capacity of the digesta and intestinal transit time( Reference Kumar, Sinha and Makkar 131 ). This potential caveat in the study of complex food matrixes in the DSS-induced colitis model requires further investigation, which we are currently exploring. Future studies assessing the dose and timing of bean consumption relative to colitis onset may be useful for determining the balance between the beneficial and adverse effects elicited by the bean diets in relation to the severity of the colitis phenotype. For example, the anti-inflammatory effects of beans may reduce the severity of colon inflammation upon initiation, but continued consumption during colitis relapse may ultimately aggravate disease symptoms.
In summary, dietary incorporation of whole cooked beans improved the DSS-induced colitis phenotype by reducing inflammatory mediator expression both locally within the inflamed colon and systemically, an effect attributable to the bean bioactive components, namely fermentation-derived SCFA and/or phenolic compounds. The amount of evidence supporting an anti-inflammatory role of diet-derived bioactives and extracts is increasing( Reference Hou and Sellin 132 , Reference Nanau and Neuman 133 ); however, there is a lack of information regarding the impact of consuming whole foods. In the present study, whole beans were cooked in the same manner as commonly prepared domestically, thereby providing an additional advantage when translating the outcomes to the clinical setting. However, in the present study, to incorporate cooked beans into the experimental diets, a freeze-drying step was utilised. Freeze-drying is known to alter the physical characteristics of starch, leading to a potential increase in retrograded (i.e. resistant) starch content in the experimental bean diets and production of SCFA( Reference Henningsson, Nyman and Bjorck 11 , Reference Abia, Buchanan and Saura-Calixto 134 ), thereby producing a potential limitation in translating the present results to those expected from consuming domestically processed beans. Furthermore, the bean supplementation level used in the present study (20 %) may be achievable for human consumption( Reference Jenkins, Kendall and Augustin 135 ); however, future dose–response studies are required to determine the potential health benefits of lower bean supplementation levels. In clinical practice, a combination of intervention strategies designed to reduce the inflammatory response, control IBD symptoms and prolong remission is commonly employed( Reference Carter, Lobo and Travis 66 ). Dietary intervention represents an additional component that may be effective in combination with pharmaceuticals at reducing disease severity, and in this context, increased consumption of beans may prove beneficial. On the other hand, the bean-supplemented diets led to an increase in DSS-induced mucosal damage, an effect which we hypothesise to be caused by an interaction between the bean diets and the DSS. Therefore, a potential limitation may exist in the use of this colitis model when examining the role of complex food matrices in colonic inflammation; however, this hypothesis requires further study.
Supplementary material
To view supplementary material for this article, please visit http://dx.doi.org/10.1017/S0007114513004352
Acknowledgements
The present study was funded by the Ontario Ministry of Agriculture and Food, Ontario Research Fund (RE-04-043) and Agriculture and Agri-Food Canada.
The authors' contributions are as follows: K. A. P., R. T. and K. P. P. selected the bean varieties; C. Z. and K. A. P. designed the study; C. Z., J. T. L., L. Z., W. W. and K. A. P. conducted the animal trial; C. Z., R. T. and R. L. conducted the chemical analyses; C. Z., J. M. M., W. W. and K. A. P. carried out all the other analyses; G. A. W. and L. R. provided consultation and expertise for the histological and cytokine analyses; C. Z., J. M. M. and K. A. P. conducted the statistical analyses, interpreted the data and wrote the manuscript. All authors read and approved the final manuscript.
The authors declare no conflicts of interest.


