

Anthropometric data describe the human body morphology in its size and form and contribute to the assessment of health status and quality of life of a particular population( Reference Rühli, Henneberg and Woitek 1 ). The morphology of the human body is steadily undergoing considerable changes over time( Reference Floud, Fogel and Harris 2 ). In Europe, people have become taller, more overweight and even obese since the 19th century, particularly within the last three decades( Reference Finucane, Stevens and Cowan 3 , Reference Ng, Fleming and Robinson 4 ). Whereas changes in height, weight and BMI have gained the most attention by scientific studies, publications on temporal changes in body shape and proportions are scarce due to restricted data availability( Reference Preedy 5 ).
Individual height depends upon genetic variation( Reference Wood, Esko and Yang 6 ), epigenetic influences( Reference Bogin 7 ), nutritional status and the economic situation during important periods of individual growth( Reference Bogin 8 ). There is a body of literature linking trends in the average height of a population (or subgroups thereof) with economics and living standard levels( Reference Komlos 9 – Reference van Zanden, Baten and Mira d’Ercole 11 ). Since the 1980s, the positive trend in average height has slowed down in Central and Northern Europe to a stable mean height of 178–181 cm( Reference Larnkaer, Attrup Schrøder and Schmidt 12 – Reference Garcia and Quintana-Domeque 14 ).
In turn, being overweight or obese has reached the level of a global pandemic within the last three decades( Reference James, Leach and Kalamara 15 ). Excess body weight is a major health concern today because it is linked to substantial morbidity and mortality consequences( Reference Davin, Vollenweider and Waeber 16 , Reference Engeland, Bjorge and Sogaard 17 ). There is also evidence that human body proportions, especially the length of the legs relative to total stature, are an important indicator for morbidity and mortality in adulthood. Leg length, trunk length and their proportions (e.g. leg length/stature) and the sitting height ratio are associated with epidemiological risk for being overweight, CHD and developing diabetes( Reference Bogin and Varela-Silva 18 ).
Overall, investigating the anthropometric status of young adult men is generally valuable regarding public health measures because being overweight in adolescence increases the chance of being overweight as an adult and because men have a greater morbidity and mortality risk later in life( Reference Engeland, Bjorge and Sogaard 17 , Reference Engeland, Bjorge and Selmer 19 ). Anthropometric data from conscription generally yield a year-by-year picture of the health status of young men at a proscribed age( Reference Staub, Woitek and Rühli 20 ). These measured height and weight data of military conscripts, as a result of their constant, consistent standards, are a very good basis for the continuous anthropometric monitoring of height, weight and BMI( Reference Rühli, Henneberg and Woitek 1 ).
Changes during the second half of the 20th century in the height and weight of conscripts from the former Federal Republic of Germany (FRG) and Democratic Republic of Germany (GDR) as well as from reunified Germany have been studied previously by anthropologists( Reference Jaeger, Zellner and Kromeyer-Hauschild 21 , Reference Greil 22 ), auxologists( Reference Hermanussen, Burmeister and Burkhardt 23 , Reference Hermanussen, Burmeister and Jäschke 24 ), economists( Reference Hiermeyer 25 , Reference Kriwy, Komlos and Bauer 26 ) and military surgeons( Reference Empter 27 – Reference Jäschke and Mirschinka 30 ). In particular, differences between East and West German conscripts( Reference Hermanussen 31 – Reference Jäschke 33 ) and the obesity epidemic( Reference Hermanussen, Danker-Hopfe and Weber 34 , Reference Toschke, Ludde and Eisele 35 ) have been addressed. Selected review articles( Reference Gohlke and Woelfle 36 ) have also included conscription height data to illustrate long-term changes in growth in Germany.
The current study, however, analysed the most recent available anthropometric data from the conscription years 2008–2010, the last years before mandatory conscription was changed to a voluntary system in 2011. We aimed to analyse height, weight, BMI and body proportion trends since 1956. Furthermore, the existing literature on regional differences and socio-economic differences in height and BMI (including West and East Germany) was extended. Additionally, changes in body proportions (chest circumference and trunk length) of the conscripts were analysed.
Methods
Data sources
The data analysed in the present study were derived from different sources and can be divided into a pre-reunification era and a post-reunification era. The first reunified Germany conscription year was 1992. The anonymized individual data for 1984–1999 and 2008–2010 (the data for 2000–2007 are no longer available) were provided by the Institut für Wehrmedizinalstatistik und Berichtswesen der Bundeswehr (Andernach, Germany). For the former FRG, prior to 1984, we digitalized all available frequency tables and other aggregated data from official statistical publications and scientific studies since 1956( Reference Jaeger, Zellner and Kromeyer-Hauschild 21 , Reference Empter 27 , Reference Harbeck 37 – 40 ). For the GDR, we had to rely on published aggregated data between 1973 and 1989( Reference Jaeger, Zellner and Kromeyer-Hauschild 21 , Reference Hermanussen, Burmeister and Jäschke 24 , Reference Jäschke 28 – Reference Jäschke and Mirschinka 30 , Reference Jäschke 33 , Reference Jäschke 41 , Reference Blechschmidt 42 ).
Conscription in West, East and reunified Germany
During the second half of the 20th century, conscription was mandatory in the former FRG, the former GDR, as well as afterwards in reunified Germany until 2010. By conscription law, all young men were obligated to be conscripted for military service. Prior to the draft, the conscription process included a medical examination that was mandatory for all young men independent of their later service status (standard service, exemption or substitute service)( Reference Toschke, Ludde and Eisele 35 ). In the case of the former FRG, since 1956 and afterwards in reunified Germany, the supposably 19-year-old males with German citizenship were called for conscription by the local district recruiting offices (Kreiswehrersatzamt) based on their inscribed place of residence( Reference Jaeger, Zellner and Kromeyer-Hauschild 21 , Reference Hiermeyer 25 ). In the case of the former GDR until 1989, conscripts were 18 years old at the time of their medical examination( Reference Jäschke 28 ). In the former FRG and GDR and afterwards in reunified Germany, the height and weight of each conscript were measured (and recorded in integer numbers) while wearing underpants by two physicians based on specific measurement regulations and identical standards, which did not change over time( Reference Harbeck 37 , Reference Toschke, Ludde and Eisele 35 , Reference Blechschmidt 42 ).
Data preparation
The original individual data sets for 1984–1999 and 2008–2010 provided by the Institut für Wehrmedizinalstatistik und Berichtswesen der Bundeswehr comprised fully anonymized data of 4 404 723 conscripts. We excluded unreasonable values for 114 030 (2·6 %) conscripts with a stature below 130 cm( Reference Faeh, Marques-Vidal and Chiolero 43 ) and 114618 (2·6 %) conscripts who weighed below 30 kg (most probably typing errors). The annual height and weight distribution tables (on the national level and for regional, occupational and educational subgroups) were transcribed from the published statistics of 1957–1983 and transformed back to individual but separated height and weight data sets from a total of 9 681 238 conscripts. The summarizing lowest categories at the end of the distribution tables changed slightly over time (from <40 kg for weight and <130 cm for height before 1970 to <50 kg and <151 cm thereafter) and have been standardized to <50 kg and <151 cm for comparability reasons. Ultimaltely, the composed data set analysed in the present study included anthropometric information on 13 857 313 German conscripts between 1956 and 2010.
The variables and their temporal coverage are displayed in Fig. 1. Unfortunately, socio-economic information (occupation and education) is no longer available for the most recent data from 2008–2010. For the time period of 1973–1984, distribution tables were available for three occupational groups (i.e. students, construction workers and agricultural workers). From the individual data of 1984–1996, the original data comprised nine occupational groups according to the official International Standard Classification of Occupations (ISCO-88) codes as defined by the International Labour Organization (including students as a single category)( 44 ). We chose students, construction workers and agricultural workers for the analysis of 1973–1996 and unskilled workers for 1984–1996. In terms of educational background (available for 1984–1996), the original data comprised nine different types of completed school levels. We grouped Volksschule mit/ohne Abschluss (primary school with/without certificate after eight school years) as low educational level, Realschule (secondary school, ten school years) as medium educational level and all types of Höhere Schulen (higher schools, more than ten school years) as high educational level.
Availability of anthropometric data and other variables from German conscripts, 1956–2010. The individual data between 2000 and 2007 are no longer available
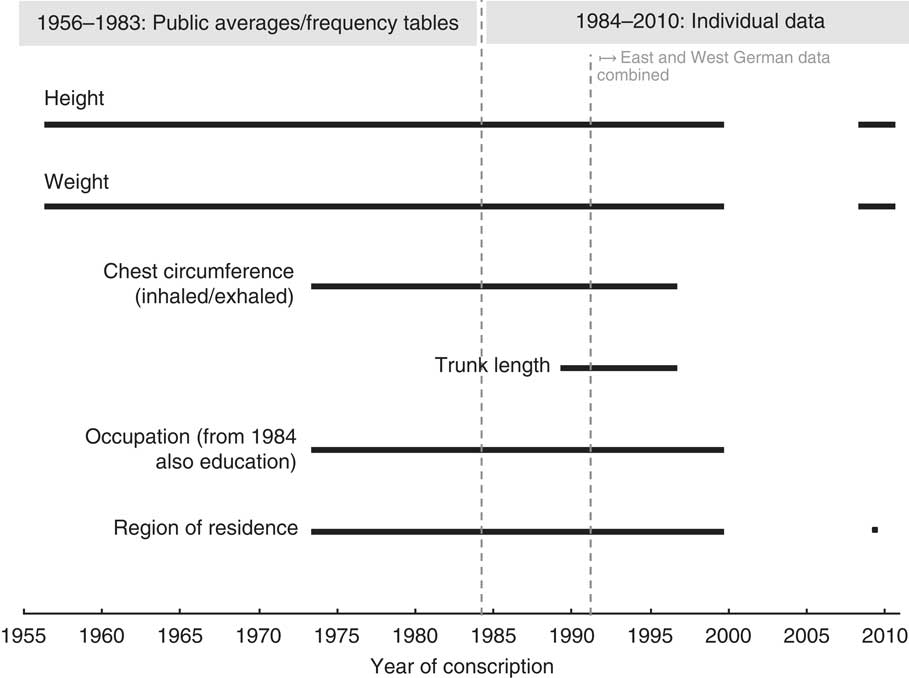
In terms of the regional background, the inscribed place of residence was available in the form of published frequency tables on the level of the six Wehrbezirke for the years before 1984. From the individual data for 1984–1999 and 2009, the inscribed place of residence was available even on the level of Kreiswehrersatzämter. For comparability reasons, we reorganized and standardized the Kreiswehrersatzämter to the state of the Wehrbezirke in 1995( 40 ). Furthermore, we rearranged the Kreiswehrersatzämter in the north-east to the state prior to German reunification to equalize the areas of the GDR and Wehrbezirk 7. Differences in height between northern and southern military districs were followed only for West German (Wehrbezirke 1–6) areas based on comparable data. For the comparison of height and BMI between West and East German areas, we focus on the data since 1992 because a measurement error present before 1989 was detected.
For the individual data, we calculated BMI (=[weight (kg)]/[height (m)]2) from height and weight. BMI was also grouped into the official classification defined by the WHO( 45 ). From height and weight frequency tables of 1956–1983, we calculated the average BMI from average height and average weight. Comparison with the individually calculated BMI after 1984 showed that we might have overestimated individual BMI by only 0·02–0·04 kg/m2 (see online supplementary material, Supplemental Table 1). From chest circumference when inhaling and exhaling (available for 1984–1996), we calculated the change and mean chest circumference. To assess body proportions, we used trunk length (available for 1989–1996) and calculated the Skelic index (=100×[(height–trunk length)/trunk length])( Reference Knussmann 46 ).
Representativeness
To estimate the representativeness of the analysed anthropometric data, we compared the number of conscripts by year of birth and by year of conscription with reference census and cohort data for live-born and living men provided by the Statistisches Bundesamt (Wiesbaden, Germany; Table 1). The results indicated that the representativeness decreased from >80 % in the 1960s and 1970s conscription years to >70 % in the 1980s for the former FRG and >40 % in the 1990s for reunified Germany. The reasons for the declining proportion of conscripted young men over time are unclear( Reference Jaeger, Zellner and Kromeyer-Hauschild 21 ); the increasing number of young men signing up for alternative civilian service may play a key role in this context. In the case of the former GDR until 1989, the representativeness of the published data cannot precisely be evaluated, even though, in theory, full conscription was proclaimed( Reference Jäschke 33 , Reference Blechschmidt 42 ).
Estimated data representativeness by year of birth (YoB) and year of conscription (YoC)Footnote * (reference data source: Statistisches Bundesamt, Wiesbaden, Germany)
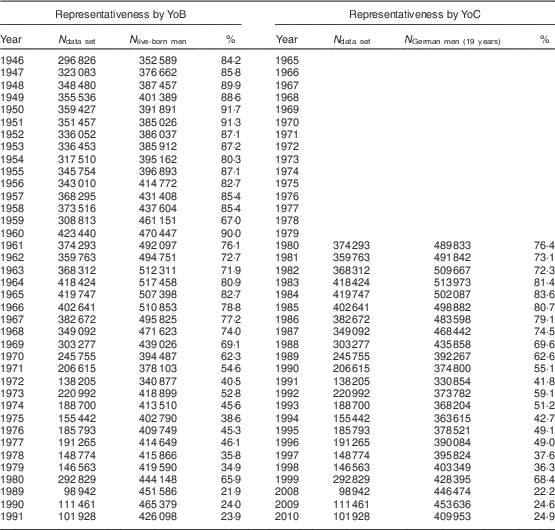
* Until 1972/1991, population numbers are for the area of the former Federal Republic of Germany (FRG); after 1973/1992, combined data for reunified Germany.
The most recent data (2008–2010) are estimated to be representative of 21·9–24·9 % of the live-born and living German young men. To estimate how strongly the sample composition is biased, the relative regional composition by Wehrbezirk in 2009 was assessed and compared with the years before 1995 (see online supplementary material, Supplemental Table 2, marked columns). The relative frequency of each of the seven Wehrbezirke did not change markedly between the early 1990s and 2009. A potential socio-economic bias cannot be evaluated because information on occupation or educational background is available only until 1999.
Statistical methods
We used descriptive methods (means with 95 % confidence intervals, medians and standard deviations) to display diachronic changes in the anthropometric measurements. Because of the large size of the data sample, only minimal methods (two-sample t tests with equal variance) were applied to test for significance of the observed differences between the means. To test for a potential regional convergence in height and BMI over time, we applied the concepts of σ and β convergence: σ convergence indicates if height variability (the CV) across regions decreases over time; whereas β convergence indicates if a negative relationship exists between the growth rate of height/BMI over time and the initial level( Reference Lanari and Bussini 47 , Reference Barro and Sala-i-Martin 48 ). The detailed descriptive results corresponding to the graphs can be viewed in the online supplementary material, Supplemental Tables 1–4. Our analysis and graphs were performed using the statistical software packages IBM SPSS Statistics version 19.0 and Stata version 13.
Results
Height, weight and BMI in 2010
In 2010, the most recent and last available year due to the end of mandatory conscription, young German men (birth year 1991, N 101 928) were, on average, 180·0 cm (95 % CI 179·94, 180·02 cm) tall and the sd was 6·85 cm (see online supplementary material, Supplemental Table 1). Skewness was 0·09 and the height measurements ranged from a minimum of 141 cm to a maximum of 212 cm. The mean weight was 77·0 kg (N 101 911; 95 % CI 76·85, 77·05 kg; sd=15·50 kg) and the weight distribution was skewed to the right (skewness =1·47). The mean BMI was 23·7 kg/m2 (N 101 907; 95 % CI 23·69, 23·75 kg/m2; median=22·8 kg/m2; sd=4·41 kg/m2). As with weight, BMI was right-skewed (skewness=1·58). In 2010, the prevalence of overweight (BMI=25·0–29·9 kg/m2) among the young conscripted men was 19·9 % and 8·5 % of the conscripts were obese (BMI≥30·0 kg/m2). Overall, a total of 28·4 % of the young conscripted men in Germany were overweight or obese in 2010 (Supplemental Table 1).
Temporal changes in height, weight and BMI, 1956–2010
In 1956, young West German men (birth year 1937) were on average 173·5 cm (N 182934; 95 % CI 173·47, 173·53 cm) tall (see online supplementary material, Supplemental Table 1). Compared with 1956, average height increased significantly by a total of 6·48 cm (95 % CI 6·43, 6·53 cm; P<0·001) over the full range of 54 years analysed. The trend of annual mean height increased steadily until the beginning of the 1990s (birth years 1970s) and then stabilized until 2010 (birth years 1990s; Fig. 2). Accordingly, the increase in average height per decade decreased from 1·6 cm in 1959–1969, 2·3 cm in 1969–1979 and 1·2 cm in 1979–1989 to 0·0 cm in 1989–1999 and 0·4 cm in 1999–2009.
Average height (top), weight (middle) and BMI (bottom) of 19-year-old German conscripts, 1956–2010 (1956–1983: published frequency tables, 1984–2010: individual data, 1992 (dotted line) to 2010: East and West German data combined, grey area: 95 % CI; see also online supplementary material, Supplemental Table 1)

Average weight increased by a total of 9·9 kg (95 % CI 9·79, 9·98 kg; P<0·001) between 1956 and 2010. In contrast to height, the trend in average weight did not stabilize since the 1990s (see online supplementary material, Supplemental Fig. 1). Between 1959 and 1979, as well as again between 1989 and 1999, average weight increased by 0·4, 1·0 and 0·6 kg per decade. In turn, there were two stronger increases in average weight by 3·0 and 2·9 kg per decade between 1979 and 1989, as well as between 1999 and 2009.
Due to the substantial increase in height, the average BMI decreased by 0·3 kg/m2 per decade between 1959 and 1979. Between 1979 and 1989 and again between 1999 and 2009, the trend of average BMI showed two strong and stepwise increases of 0·6 and 0·8 kg/m2 per decade, driven by an increase in weight. More precisely, the first weight-driven step in average BMI is located between the mid-1980s and the beginning of the 1990s (Fig. 2).
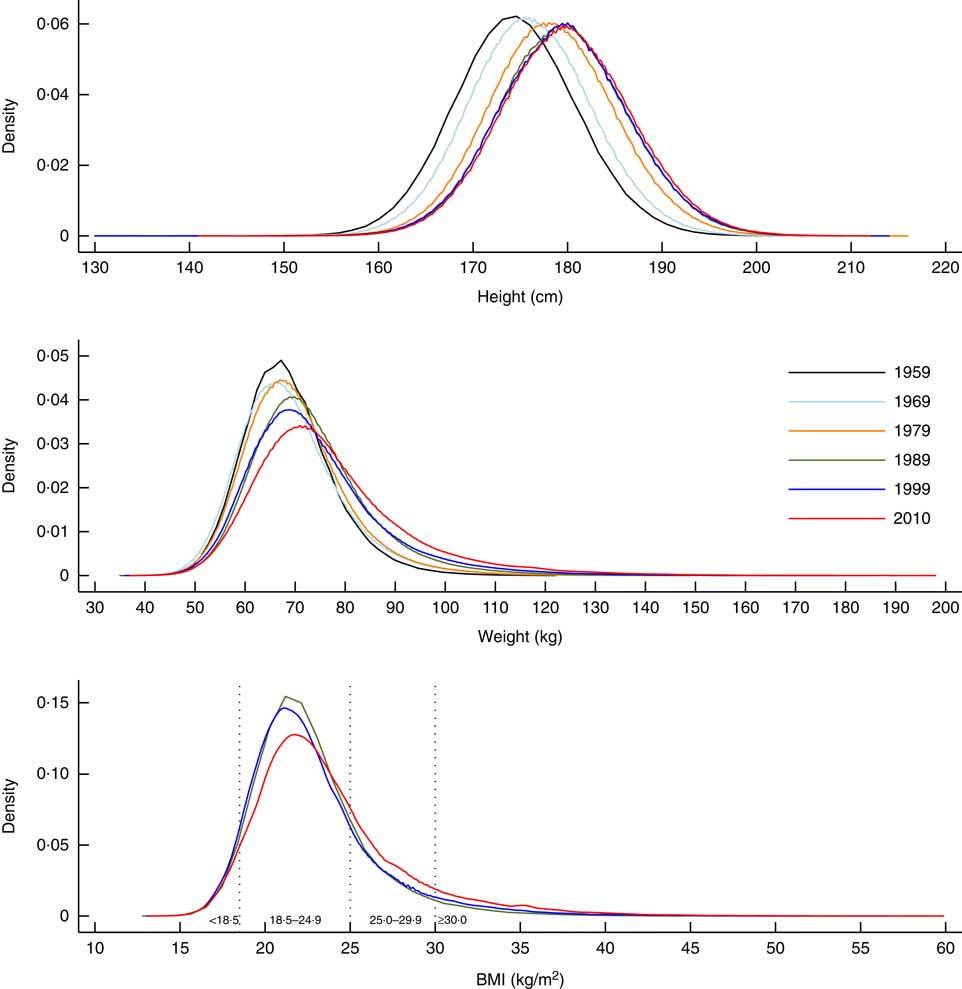
Not only did average height, weight and BMI change over the period of the observed 54 years, the shape and position of the distributions changed as well (Fig. 3). The height distribution was nearly symmetrical in all six displayed years between 1959 and 2009 (skewness between 0·01 and 0·09; see supplementary material, Supplemental Table 1), but shifted continuously towards the right on the x-axis until the 1990s (reflecting the increasing average with a constant sd between 6·47 and 6·95 cm). The right-skewness of the weight distribution in turn steadily increased over time and almost doubled between 1959 (0·76) and 2009 (1·47), as did the sd, which increased from 8·37 to 15·50 kg. In accordance with weight, the BMI distribution became markedly more skewed to the right between 1989 and 2009. The prevalence of overweight and obesity reflected the change in the form of the distribution, the share of overweight conscripts increasing from 11·6 % in 1984 to 19·9 % in 2010 (factor 1·71). The prevalence of obese conscripts even multiplied by a factor of 3·99, i.e. from 2·1 to 8·5 %, between 1984 and 2010.
(colour online) Changes of the height (top), weight (middle) and BMI (bottom) distributions of 19-year-old German conscripts, 1959, 1969, 1979, 1989, 1999 and 2010 (1959–1979: published frequency tables, 1989–2010: individual data, from 1992: East and West German data combined)
Regional variation in height, weight and BMI, 1957–2009
From 1957 (the first conscription year with regional height data) until 2009 (the last conscription year with regional information), there was a significant and consistent north–south gradient in average height among West German conscripts (top row in Fig. 4 and online supplementary material, Supplemental Table 2). Although average height increased in all Wehrbezirke, conscripts from the three northern Wehrbezirke 1–3 (the Bundesländer/states Schleswig-Holstein, Niedersachsen and Nordrhein-Westfalen) were consistently taller than the conscripts from the three southern Wehrbezirke 4–6 (the Bundesländer/states Hessen, Rheinland-Pfalz, Saarland, Baden-Württemberg and Bayern). Still in 2009 (birth year 1990), average height ranged by 2·1 cm (95 % CI 1·89, 2·31 cm; P<0·001) from 181·1 cm (95 % CI 180·89, 181·25 cm) for conscripts living in the most northern Wehrbezirk 1 (Schleswig-Holstein) to 179·0 cm (95 % CI 178·87, 179·08 cm) in the most southern Wehrbezirk 5 (Baden-Württemberg). Supplemental Fig. 2 shows the annual CV in height between regions since 1957 (GDR and FRG separated until 1989). The results do not indicate σ convergence but rather divergence over time as a sign that the north–south gradient in height among the FRG regions might have increased between the 1980s and the 1990s (birth years 1960s and 1970s). Supplemental Fig. 3 (left plot) shows that there is only modest signs for β convergence in height between the FRG regions in 1974–1989 (blue points): only Wehrbezirke 1 and 6 show a clear negative relationship between average annual growth rate (in per cent) and their initial level in height. In 1993–2009 (red points in the left plot) all former FRG Wehrbezirke show a reduced average annual growth rate in height (reflecting the general slow down in average height).
Regional differences in the average height (top), weight (middle) and BMI (bottom) of 19-year-old German conscripts, 1957 (the first year with information on the inscribed place of residence), 1973 (the first year with data on 18-year-old GDR conscripts), 1989 (the last year with data on 18-year-old GDR conscripts), 1992 (the first year with combined data) and 2009 (the last year with regional data). (Dashed lines: German average, grey area: 95 % CI; see also online supplementary material, Supplemental Table 2)

Conscripts from eastern Germany (1973–1989: 18-year-old conscripts from GDR, 1992–2009: 19-year-old conscripts from Wehrbezirk 7 including Mecklenburg-Vorpommern, Brandenburg, Berlin, Sachsen-Anhalt, Sachsen and Thürigen) were smaller than conscripts from all other Wehrbezirke until the 1990s, but then caught up starting from 1992 to an average height of 179·8 cm (95 % CI 179·75, 179·93 cm) in 2009, the period during which data allow a comparison without measurement error. The online supplementary material, Supplemental Fig. 3 (left plot) shows the β convergence of Wehrbezirk 7 (green point) between 1993 and 2009 (red points): the conscripts from the former GDR regions show the highest average annual growth rate with the lowest initial height level.
In contrast to height, regional differences in average weight since 1973 (the first year with regional weight data) were less pronounced. Only in the period from the 1990s were conscripts from the two Wehrbezirke 5 and 6 slightly lighter than conscripts from the other Wehrbezirke. Again, conscripts from eastern Germany were markedly lighter than conscripts from all other Wehrbezirke still in 1992, but then caught up and were almost average in weight in 2009 (the period during which the data allow a comparison without measurement error).
These regional differences in height and weight are reflected in average BMI differences (bottom row in Fig. 4). While there was a slight increase in average BMI from the north to the south until the 1990s, there was no clear difference remaining in 2009. Once more, conscripts from eastern Germany were the thinnest until the 1990s and then caught up with the average particularly between 1992 and 2009 (based on data without measurement error). The online supplementary material, Supplemental Fig. 3 (right plot) shows the β convergence in BMI of Wehrbezirk 7 (green point) between 1993 and 2009: the conscripts from the former GDR regions show a very high average annual growth rate with a very low initial BMI level. In general, BMI shows β convergence (negative relationship between growth rate over time and the initial level) among regions both between 1975 and 1989 (blue points) and 1993 and 2009 (red points), with generally higher average annual growth rates in the later time period.
Differences in height and BMI by occupational and educational background, 1973/1984–1999
Over the 27 years between 1973 and 1996, there were significant and persistent differences in height and BMI between conscripts of different occupational and educational levels (Fig. 5 and online supplementary material, Supplemental Table 3). In the case of occupational background, we distinguished between students, agricultural workers, construction workers and unskilled workers. All occupational groups showed the increase levelling off for average height since the 1990s. In 1973, students were 178·5 cm tall (95 % CI 178·47, 178·57 cm), construction workers were 176·8 cm (95 % CI 175·95, 176·15 cm) and agricultural workers were 176·1 cm (95 % CI 176·61, 176·94 cm). In 1999, the most recent year for which occupation data were available, students (180·4 cm, 95 % CI 180·35, 180·43 cm) were still the tallest young men, unskilled workers (178·2 cm, 95 % CI 177·96, 178·34 cm) were the shortest, on average 2·2 cm (95 % CI 2·04, 2·44 cm; P<0·001) shorter than the students. For BMI, unskilled workers and construction workers had the highest mean BMI values, whereas students were the thinnest. All observed occupational groups showed the first stepwise increase in average BMI during the late 1980s and the temporary stabilization during the 1990s.
(colour online) Differences in average height (top row) and BMI (bottom row) of 19-year-old German conscripts by occupational background 1973–1999 (left column) and educational background 1984–1999 (right column). (1973–1983: Published frequency tables, 1984–1999: individual data, 1992 (dotted line) to 1999: East and West German data combined, grey area: 95 % CI; see also online supplementary material, Supplemental Table 3)
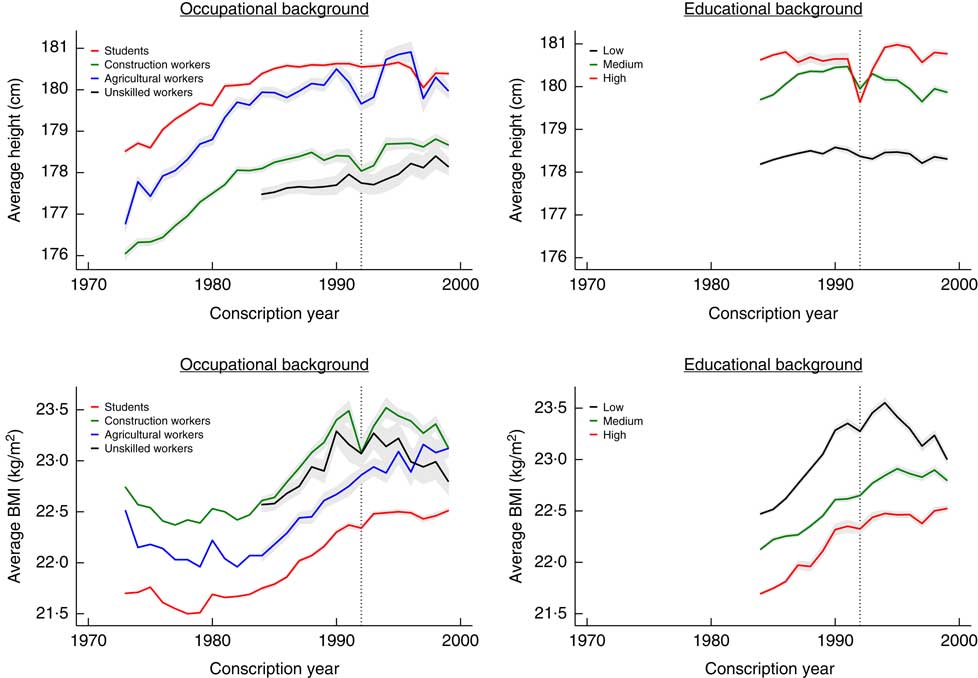
When taking the educational background of the conscripts (available only between 1984 and 1999) into account, a very similar pattern emerged. Conscripts with a higher educational background (Höhere Schulen) were, on average, 2·3 cm taller and also thinner than the conscripts from lower educational backgrounds (Volksschule).
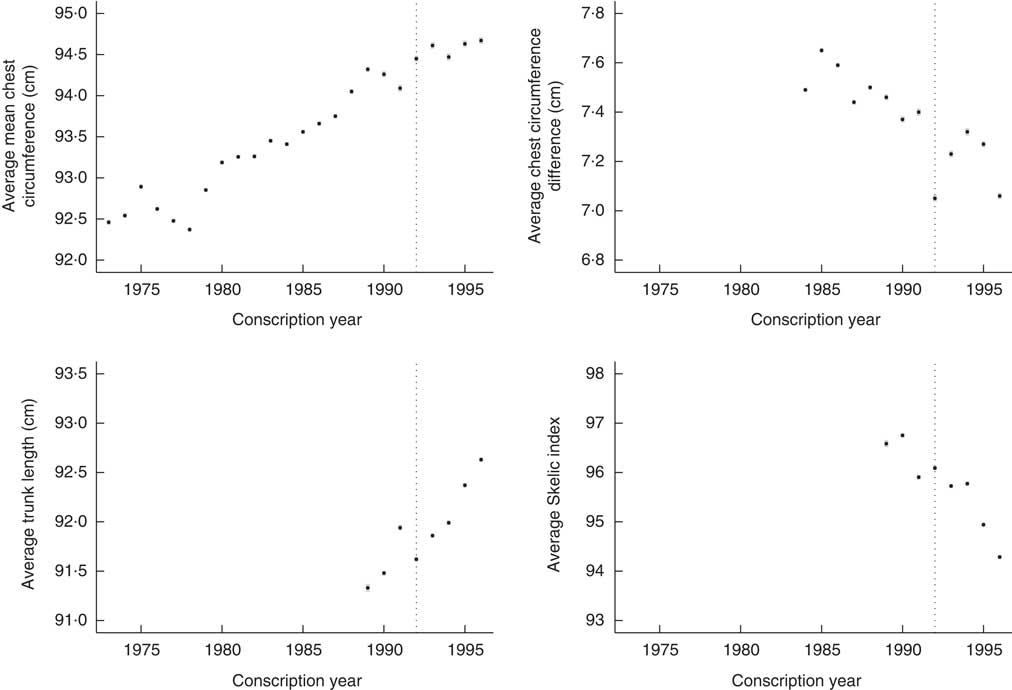
Temporal trends in chest circumference, trunk length and Skelic index, 1973/1989–1996
Between 1973 and 1996, the German conscripts also underwent significant changes in anthropometric measurements other than height, weight or BMI. From 1973 to 1996, the mean chest circumference steadily increased by 2·2 cm (95 % CI 2·17, 2·25 cm; P<0·001) from 92·5 to 94·7 cm (Fig. 6 and online supplementary material, Supplemental Table 4). Between 1984 and 1996, the mean difference between chest circumference when inhaling and exhaling decreased from 7·5 to 7·0 cm. Average trunk length increased by 1·3 cm (95 % CI 1·26, 1·34 cm; P<0·001) from 91·3 cm in 1989 to 92·6 cm in 1996. Consequently, the Skelic index decreased by 2·3 (95 % CI 2·23, 2·37; P<0·001) from 96·6 in 1989 to 94·3 in 1996, indicating that leg length was decreasing relative to trunk length during that time.
Average body proportions of 19-year-old German conscripts, 1973/1989–1996: mean chest circumference (=(inhaled+exhaled)/2; top left), chest circumference difference (=inhaled–exhaled; top right), trunk length (original data; bottom left) and Skelic index (=100×[(height–trunk length)/trunk length]; bottom right). (1973–1983: published frequency tables, 1984–1996: individual data, from 1992 (dotted line): East and West German data combined, grey area: 95 % CI; see also online supplementary material, Supplemental Table 4)
Discussion
The present study analysed the most recent and last anthropometric data available from mandatory conscription in Germany from 2008–2010 and included them in the historical context of the second half of the 20th century to assess temporal changes. In general, German conscripts changed their growth pattern from growing in length to growing mainly in breadth. Over the full range of 54 years analysed, the 19-year-old conscripts became, on average, 6·5 cm taller between 1956 (173·5 cm, birth year 1937) and 2010 (180·0 cm, birth year 1991). This increase in average height was not linear but slowed down markedly and plateaued since the 1990s conscription years (1970s birth years). In contrast to height, the increase in average weight did not slow down during the last two decades but increased in two strong steps at the end of the 1980s and again after 1999. The weight and BMI distributions became increasingly right-skewed, the proportion of overweight and obese young men increased from 11·6 and 2·1 % in 1984 to 19·9 and 8·5 % in 2010, respectively. In terms of regional differences, the north–south gradient in height among West German conscripts persisted over the full period of observation. Conscripts from East Germany caught up in height and BMI with the German average between the early 1990s and 2009 (when the data allow a comparison without measurment error). There were significant and persistent differences in average height and BMI between different socio-economic groups between the 1970s and the 1990s. Between the 1980s and early 1990s, during the first upward step of the obesity epidemic, the conscripts also changed in their body proportions. Their average chest circumference increased and the average difference between chest circumference when inhaling and exhaling decreased, as did leg length relative to trunk length.
The phenomenon of the secular increase in height since the 19th century is well documented for Western countries( Reference Floud, Fogel and Harris 2 , Reference Bogin 8 ). However, the driving factors remain to be fully explained( Reference Bogin 7 ). Among other clustering co-factors (epigenetics and assortative mating), massively improving living conditions (nutrition, disease environment and physical workloads) may be responsible for the secular height trend( Reference McEvoy and Visscher 49 ). In recent decades, the height increase rates have slowed down markedly in the USA and northern and central regions of Europe( Reference Larnkaer, Attrup Schrøder and Schmidt 12 , Reference Komlos and Baur 50 ). At this stage, it is not clear whether this trend is short term or whether, due to the stable environment of Central and Northern European countries, the genetic end point of the population has been reached, at a mean level of ca. 180 cm( Reference Larnkaer, Attrup Schrøder and Schmidt 12 ). How far the substantial immigration to Germany particularly since the 1960s( Reference Münz and Ulrich 51 ) and the consequently changing ethnic composition of the population influence the observed anthropometric changes has to remain unclear at this point, since data from conscription only in rare cases( Reference Lanari and Bussini 47 ) allow to control for birth place or migrational background of the young men. Also, the time lag between immigration of the parents and the second- and third-generation sons obtaining citizenship and entering conscription might complicate investigation of this important question.
Previous studies have focused on regional height differences within reunified Germany or between the former FRG and the former GDR. The north–south gradient in height has been shown for the 2000/2001 conscription cohort (no longer available for research)( Reference Hiermeyer 25 ) and for the German Socio-Economic Panel data from 2002( Reference Heineck 52 ). On the national level, economic factors such as lower population density and lower income inequality in the northern areas of Germany might contribute to this phenomenon( Reference Hiermeyer 25 ). In general, the north–south gradient within Germany matches the general north–south gradient in height observed all over Europe from Scandinavia to southern Italy, partially explained by economic differences, nutrition and genetics( Reference McEvoy and Visscher 49 , Reference Turchin, Chiang and Palmer 53 , Reference Mathieson, Lazaridis and Rohland 54 ). Moreover, even Bergmann’s rule (large-bodied animals tend to live further north than their small-bodied relatives) could be part of the explanatory complex for the north–south gradient in height( Reference Cowgill, Eleazer and Auerbach 55 ).
The large difference in height between conscripts from the former FRG and the former GDR until the 1990s has been highly debated and might partially be explained by data-inherent factors (young men in the GDR were only 18 years old when measured during conscription compared with the 19-year-old conscripts in the FRG) and differences in the living conditions( Reference Jäschke and Mirschinka 30 – Reference Jäschke 33 , Reference Komlos and Kriwy 56 ). The current study, however, showed that conscripts from East Germany caught up in height and BMI with the German average between the 1990s and 2009, when measurement errors can be ruled out as the explanatory factor. In addition to improving living conditions (e.g. unemployment rate and mother’s education level) and increasingly equalized health conditions in the East( Reference Prütz, Rommel and Kroll 57 , Reference Baten and Böhm 58 ), internal migration from East to West Germany (and backwards) might play a key explanatory role here( Reference Heiland 59 – Reference Bucher and Heins 62 ). The disappearing health and obesity differences between East and West Germany also fit results from monitoring programmes of 3–17-year-old children and adolescents, which found no differences in 2003–2006( Reference Lampert 63 ). There is also growing evidence that physical connectedness and psycho-biological effects that seem to control growth and development within communities might contribute to such changes in height and weight( Reference Hermanussen, Alt and Staub 64 ).
The levels of overweight (19·9 %) and obesity (8·5 %) found for the German conscripts in 2010 were higher than the (measured) prevalence for German boys aged 5–17 years in 2010 (20 % were found to be overweight or obese), but still lower than the prevalence of (measured) obesity found in adult German men aged 15 years or older in 2012 (15·7 %)( 65 ). The two-step increase in weight and BMI at the end of the 1980s and again since 2000 matches the pattern that was found for conscripts in Switzerland( Reference Panczak, Zwahlen and Woitek 66 ) and might reflect changes in lifestyle (e.g. the introduction of fast-food restaurants in the 1980s or decreasing physical activity levels during the last two decades) as well as the economic situation. The average BMI of the German conscripts in 2010 (23·7 kg/m2) was very similar to that of conscripts in other European countries where analyses based on compulsory conscription data are available for 2010 (Norway: 23·4 kg/m2, Switzerland: 23·4 kg/m2, Austria: 23·4 kg/m2)( Reference Poglitsch, Kefurt and Mittlböck 67 – Reference Staub and Rühli 69 ). The level of obesity (BMI≥30 kg/m2) was also similar to that in the listed countries (8·1–8·5 %).
The significant and persistent differences in average height and BMI between different socio-economic groups between the 1970s and the 1990s reported in the present study, i.e. conscripts with lower occupational and educational backgrounds were shorter and more obese, fit the results from earlier studies well( Reference Jaeger, Zellner and Kromeyer-Hauschild 21 , Reference Hiermeyer 25 , Reference Toschke, Ludde and Eisele 35 ). Research on obesity and other branches of public health in Germany might benefit from identifying groups of men with an elevated morbidity and mortality risk already at a young age. The results on changing body proportions during the first upward step of the obesity epidemic at the end of the 1980s (average chest circumference increased, average difference between chest circumference when inhaling and exhaling decreased, as did leg length relative to trunk length) furthermore indicate that monitoring not only BMI but also other body measurements that are connected to health outcomes may be advisable( Reference Bogin and Varela-Silva 18 ). These results give a first indication that – at the time of the first rise of the obesity epidemic – the chest of the young men became larger by circumference (indicating more fat or muscle mass) and the chest expansion possibly became smaller (as a possible sign for decreasing lung function). Furthermore, the trunk got longer relative to leg length, indicating a shift in body type from rather macroscel (Skelic index=95·0–99·9) to rather submacroscel (Skelic index=90·0–94·9)( Reference Knussmann 46 ). However, further studies are needed to analyse the underlying biological pathways.
The present analysis had several important limitations because the data are incomplete and inconsistent in different ways. Individual data before 1984 do not exist, which prohibited BMI calculations based on individual height and weight. Consequently, for the years 1956–1983, we had to calculate the average BMI from average height and average weight. However, the comparison of the identically calculated aggregated average BMI for 1984–1999 with the individually calcluated average BMI for the same time period shows that we overestimated individually calculated average BMI by only 0·02–0·04 kg/m2. Furthermore, the individual data for 2000–2007 are no longer reliable and usable for research due to information technology data transformation issues within the Institut für Wehrmedizinalstatistik und Berichtswesen der Bundeswehr in 2007. The socio-economic analysis included only the years until 1999 because the most recent data (2008–2010) no longer contain information on occupational or educational backgrounds. Additionally, the provided data did not include precise dates of birth and measurements, which made controlling for individual ages impossible. Moreover, the data included young men with German citizenship only and did not allow controlling for the migration background of the conscripts. This would be particularly important to estimate the influence of second-generation naturalized young men on the observed anthropometric changes. Furthermore, our analysis failed to individually control for internal migration within Germany since the 1990s, which might play a key role( Reference Lanari and Bussini 47 , Reference Herfert 61 , Reference Bucher and Heins 62 ) in explaining the catching-up in height and BMI of conscripts living in East Germany. A precise comparison of height and weight between the FGR and GDR before 1989 may be impeded by differences in the conscription systems (age at measurement). In addition, the influence of 1992 as the first year displaying height and weight of 19-year-old men in reunified Germany (most of the graphs show a small blip in 1992) cannot be precisely specified. Furthermore, the phenomenon of delayed physical growth may also have been a factor when analysing long-term changes in height. The share of young men whose final height had not yet been achieved by the age of 19 years and who continued to grow after this age might have been larger in the 1950s than today. However, this might be less of an issue when using data from the 1950s than from the 19th century( Reference Hermanussen, Burmeister and Burkhardt 23 , Reference Staub, Floris and Woitek 70 ). The most important limitation, however, is the decreasing representativeness of the (West) German conscription data since the 1980s. We estimated the most recent data (2008–2010) to be representative of only 20–25 % of the corresponding birth cohorts. While a possible socio-economic bias cannot be evaluated, the consistent regional composition of the 2008–2010 sample compared with the 1990s at least allowed exclusion of a possible regional sample composition bias.
The present study shows the benefit of not solely focusing on BMI alone but also analysing height and weight in a broader historical context. It is only since growth in height started to plateau two or three decades ago that the human body seems to have invested the surplus energy into breadth growth. The main strength of the study is its reliance on large and objectively measured anthropometric data. Such findings on anthropometric changes in Germany during the last 54 years could contribute to the understanding of the obesity epidemic and thus help to design further studies and target interventions. Investigating the anthropometric status of young adult men is generally valuable regarding public health measures because, for example, being overweight in adolescence increases the chance of being overweight as an adult and because men have a greater morbidity and mortality risk later in life( Reference Engeland, Bjorge and Selmer 19 ). A recent study on German adults showed that obesity prevention needs to be targeted to specific subgroups in the population, particularly to younger adults, who are the most vulnerable for gaining weight( Reference Haftenberger, Mensink and Herzog 71 ). Future studies should thus not only focus on early life circumstances( Reference Barker 72 ) but also continue to monitor the anthropometric status of young people in Germany based on different data sources and, and in particular, focus on regional and socio-economic differences.
Acknowledgements
Acknowledgements: The authors wish to thank the Institut für Wehrmedizinalstatistik und Berichtswesen der Bundeswehr in Andernach, Germany (Reiner Eisele, Rainer Lüdde, Matthias Bassler) for providing the individual data and its support, as well as Günther Jäschke, Christiane Scheffler, Claus-Peter Thaler, Michael Hermanussen, Nikola Koepke and Sylvia Kirchengast for helpful comments on the manuscript. Financial support: This research was supported by the Mäxi Foundation (Zurich, Switzerland). The Mäxi Foundation had no role in the design, analysis or writing of this article. Conflict of interest: None. Authorship: All authors formulated the research questions and designed the study. A.L. and K.S. carried out the study. A.L., K.S. and U.W. analysed the data. All authors wrote the article. Ethics of human subject participation: This study was conducted according to the guidelines laid down in the Declaration of Helsinki. The original individual data set for 1984–1999 and 2008–2010 was made fully anonymous by the Institut für Wehrmedizinalstatistik und Berichtswesen der Bundeswehr (Andernach, Germany) prior to delivery to the study authors. In the case of analyses based on anonymized and non-clinical governmental data, additional ethical approval is not needed according to the Swiss Federal Act on Research involving Human Beings (HRA 810.30; 1 January 2014).
Supplementary Material
To view supplementary material for this article, please visit http://dx.doi.org/10.1017/S1368980016002408


