


INTRODUCTION
Understanding the recent geological evolution of highly populated regions is of paramount importance, especially when they are subject to seismic hazards, as is the central portion of the Po Plain. This important task is rather difficult to achieve in areas such as the Po Plain, where restricted evidence of recent surface faulting is available in spite of a complex geomorphological evolution due to repeated erosional and aggradational stages related to Quaternary climatic variations. The lack of tectonic structures reaching the surface has been generally attributed to the occurrence of blind thrusting (Pieri and Groppi, Reference Pieri and Groppi1981; Burrato et al., Reference Burrato, Ciucci and Valensise2003; Fantoni et al., Reference Fantoni, Bersezio and Forcella2004; Maesano et al., Reference Maesano, D'Ambrogi, Burrato and Toscani2015; Vannoli et al., Reference Vannoli, Burrato and Valensise2015) as a regional expression of tectonic activity. 2D and 3D models of the buried structures indicate that shortening is still active and mainly related to north-verging thrusts propagating along the Northern Apennine-buried thrust fronts (Turrini et al., Reference Turrini, Lacombe and Roure2014, Reference Turrini, Angeloni, Lacombe, Ponton and Roure2015; ISPRA, 2015), as well as suggested by active seismicity and in situ stress measurements (Montone et al., Reference Montone, Mariucci, Pondrelli and Amato2004).
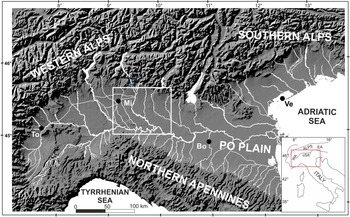
The evolution of the Lombardy Po Plain (Fig. 1) is strongly affected by deposition of a thick Quaternary marine to alluvial infill related to its strong subsidence, as well as to detrital production during glacial phases (Muttoni et al., Reference Muttoni, Carcano, Garzanti, Ghielmi, Piccin, Pini, Rogledi and Sciunnach2003; Garzanti et al., Reference Garzanti, Vezzoli and Andò2011). High rates of sedimentation largely overcome uplift rates due to tectonic activity in depth, which are mainly related to the propagation of the Apennine thrust fronts (Maesano and D'Ambrogi, Reference Maesano and D'Ambrogi2016). Fluvioglacial units deposited during the last glacial maximum (LGM) dominate the surface geology (Fontana et al., Reference Fontana, Mozzi and Marchetti2014; Ravazzi et al., Reference Ravazzi, Badino, Perego, Bertuletti, De Amicis, Deaddis, Garozzo, Novellino and Pini2020), although deeply entrenched and terraced by the post-glacial rivers (Fig. 2).
Location of the studied area in Northern Italy. Shaded DTM from 1:500,000 scale contours and hydrography from Touring. WA = Western Alps, EA = Eastern Alps, cSA = central Southern Alps, To = Turin, Mi = Milan, Bo = Bologna, Ve = Venice.

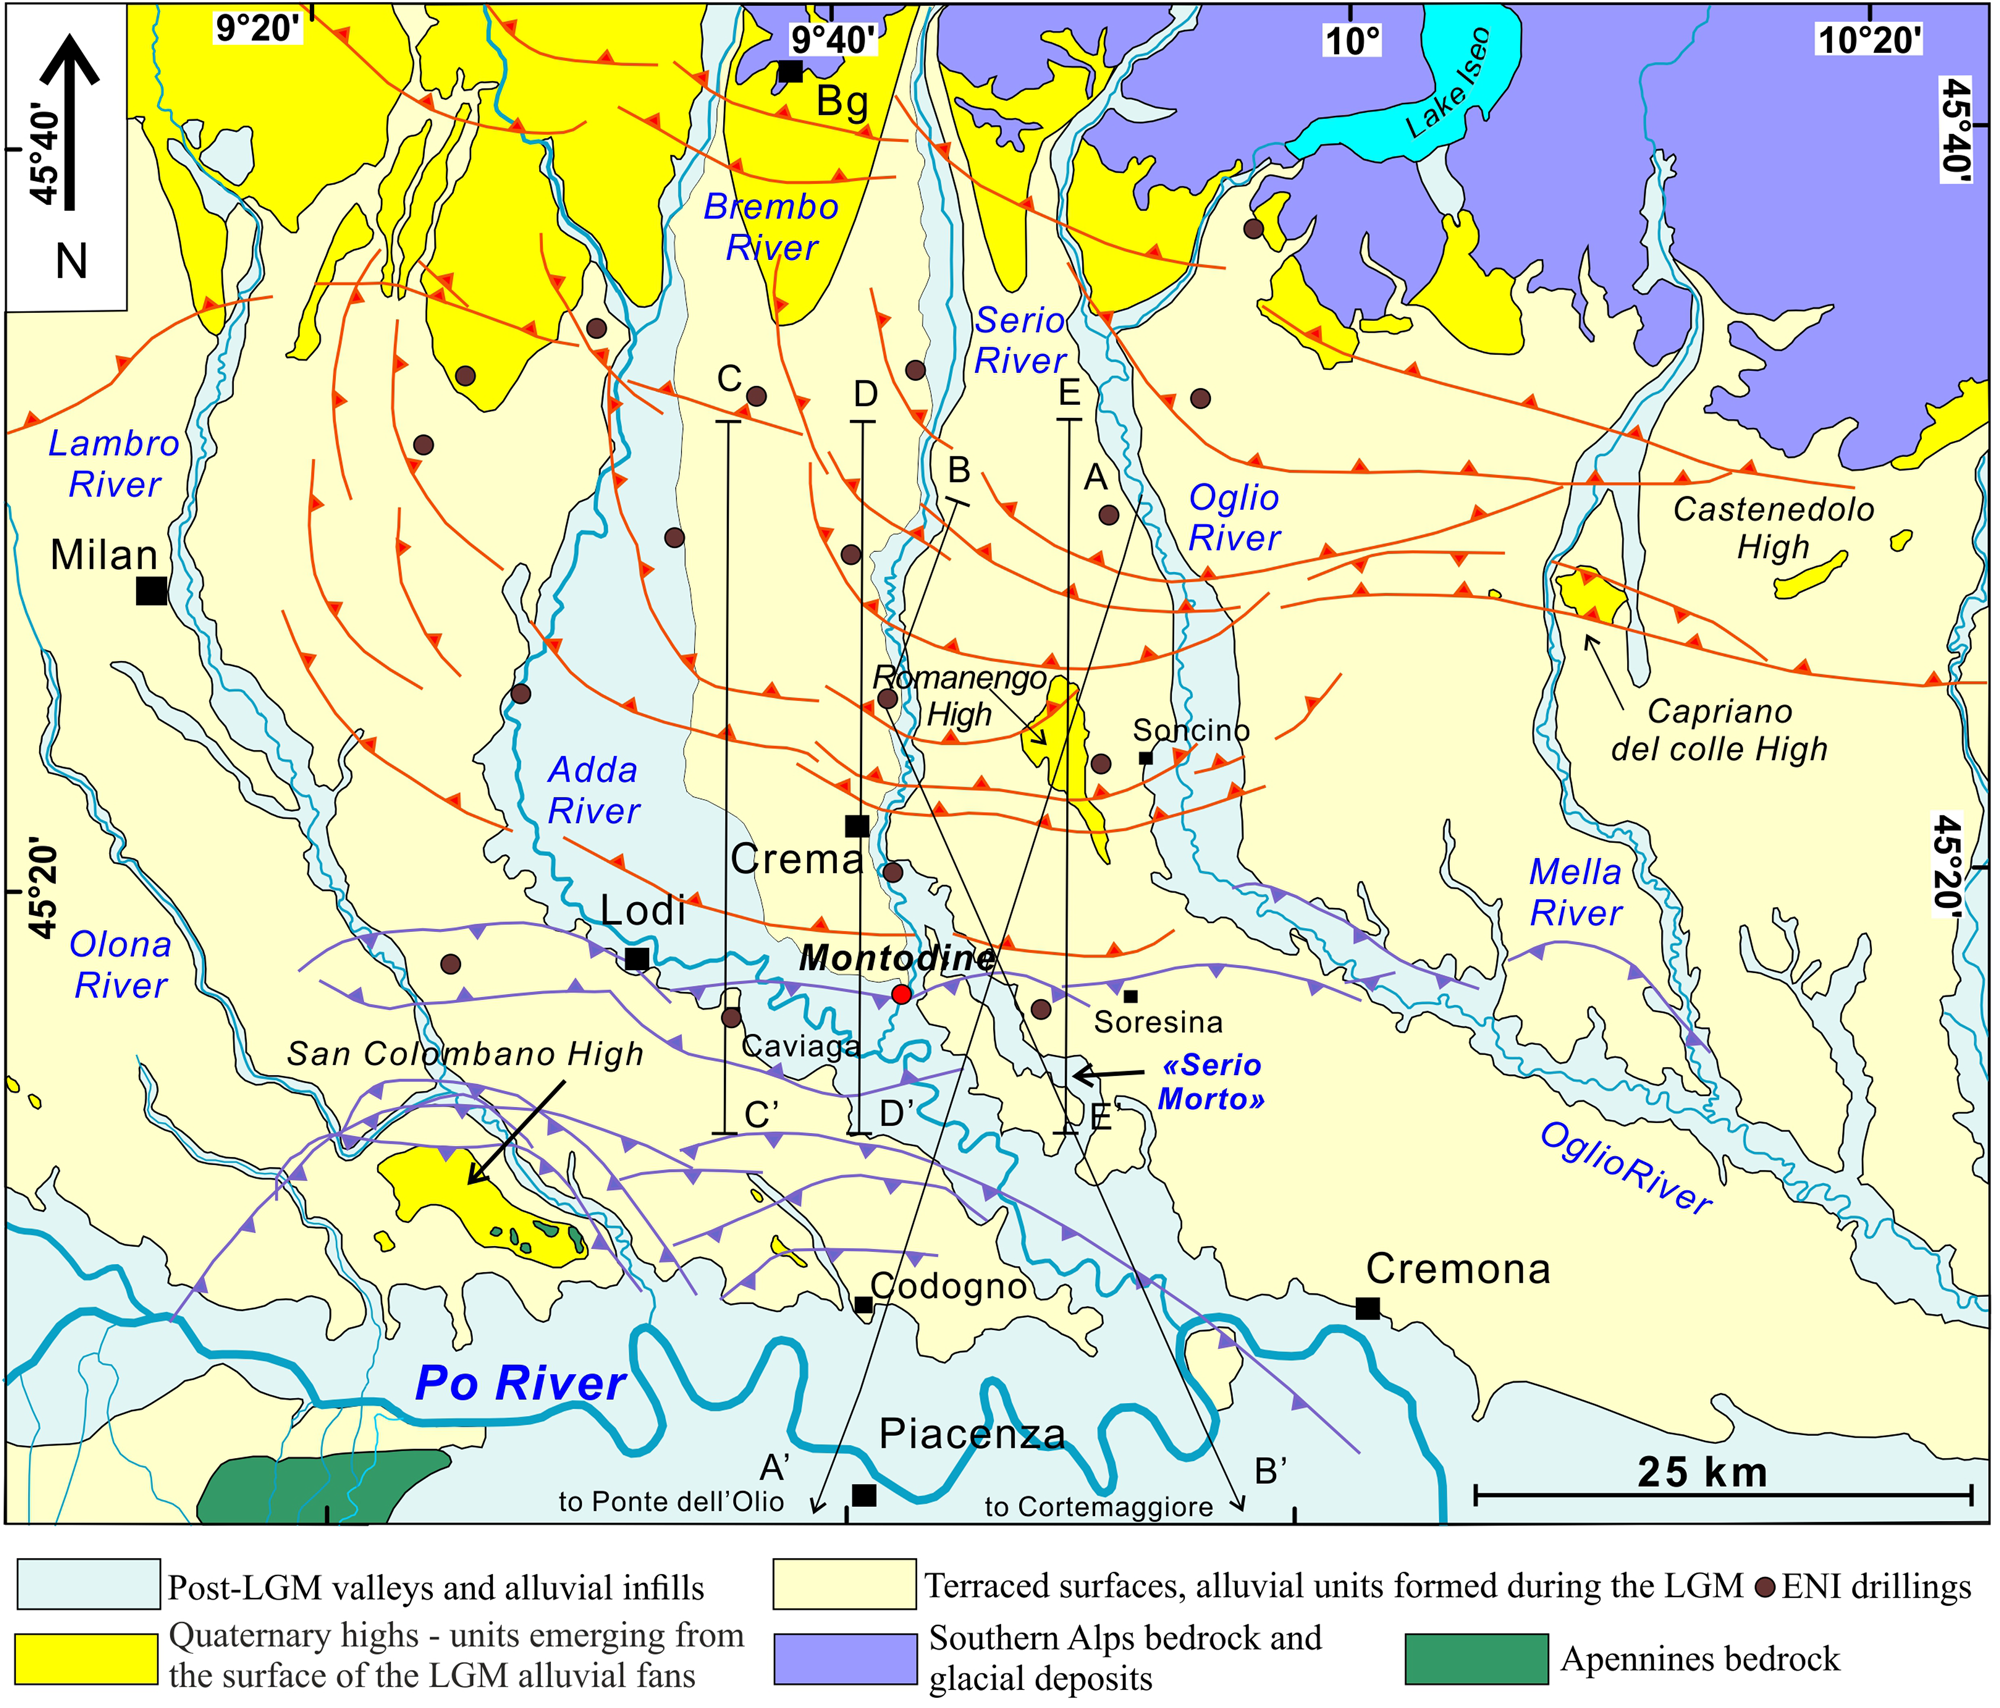
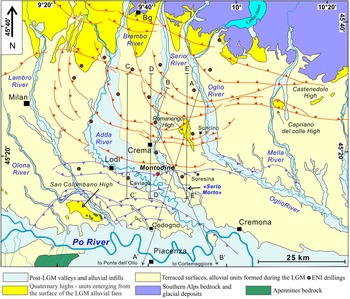
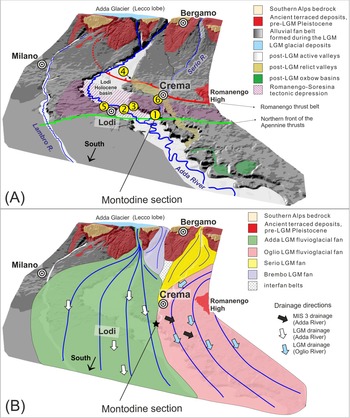
Geological and geomorphological setting of the central Po Plain, according to Castiglioni (Reference Castiglioni1997) and updates (Bersezio et al., Reference Bersezio, Bini and Gelati2004; Mele et al., Reference Mele, Bersezio and Giudici2018; Zuffetti and Bersezio, Reference Zuffetti and Bersezio2020). The surface projections of buried thrusts of the Northern Apennines and the Southern Alps from Fantoni et al. (Reference Fantoni, Bersezio and Forcella2004) are in blue and red, respectively. Traces of cross sections A-E are also shown. Sections A-A’ and B-B’ are shown in Figure 3; sections C-C’, D-D’, and E-E’ are shown in Figure 6A.
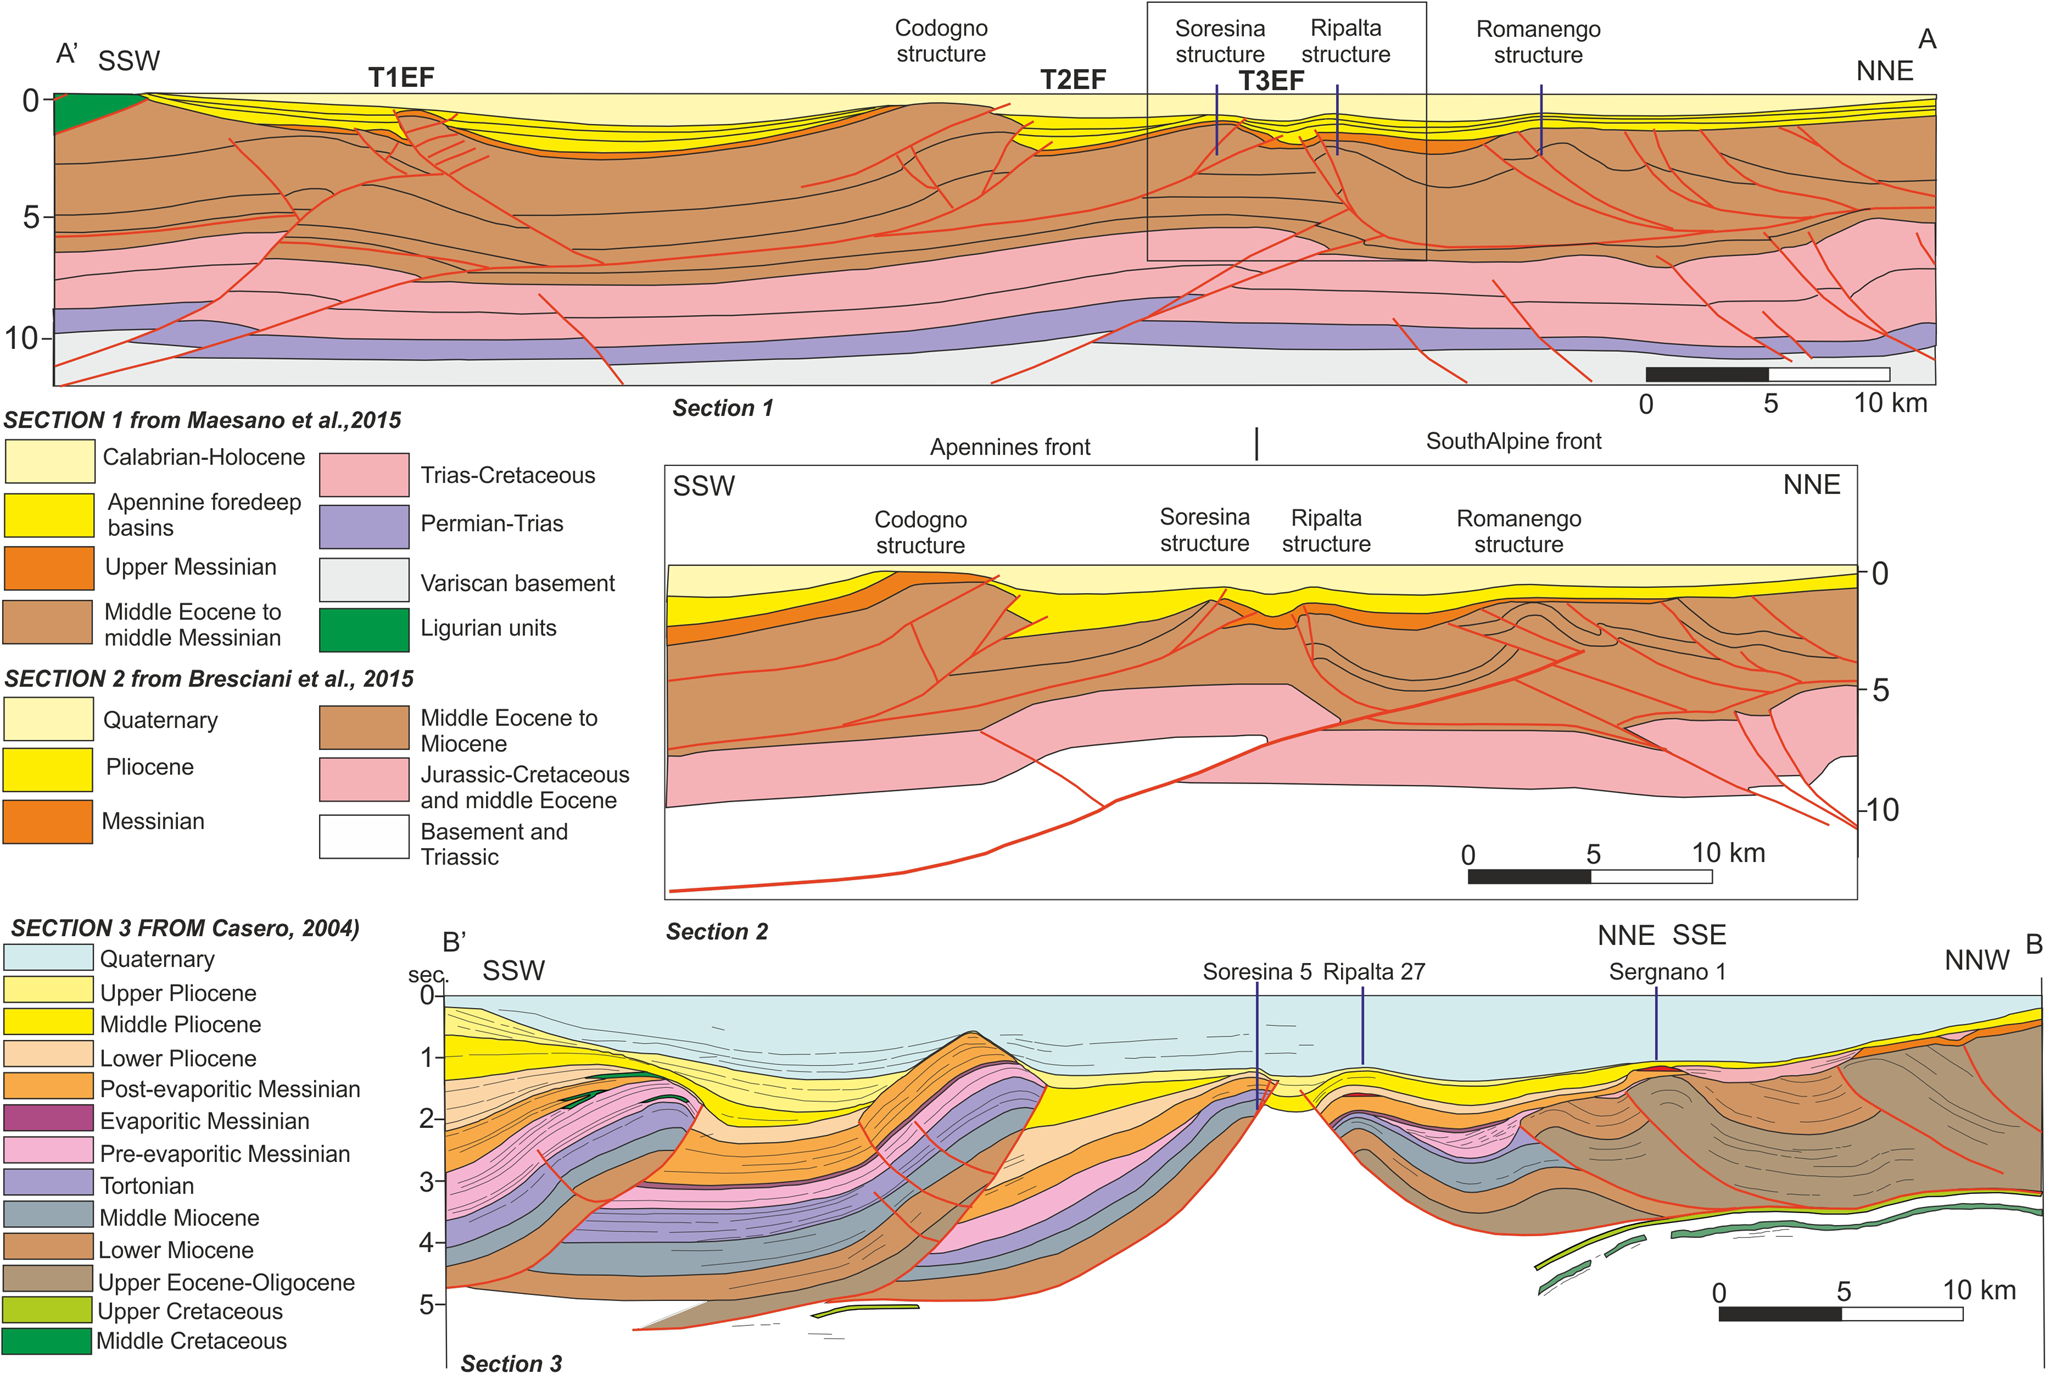
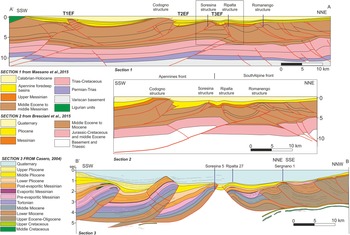
Geological sections across the Montodine area; traces in Figure 2. Section 1 (cross section A-A’) redrawn from Maesano et al. (Reference Maesano, D'Ambrogi, Burrato and Toscani2015). The rectangle shows a detail of the cross sections based on Fantoni et al. (Reference Fantoni, Bersezio and Forcella2004) displayed in Figure 6B. Section 2 is part of section 1, reinterpreted by Bresciani and Perotti (2015); in this section, a deep Apennine thrust propagates below the Romanengo structures. Section 3 (cross section B-B’) is redrawn from Casero (Reference Casero, Crescenti, D'Offizi, Merlino and Sacchi2004).
Evidence of Quaternary deformation in the sedimentary successions deposited along the southernmost portion of the central Southern Alps and along the Northern Apennines front is documented in seismic sections and drillings, especially along the southern portion of the Po Plain (Fig. 3), due to propagation of the Northern Apennines thrusts (Fantoni et al., Reference Fantoni, Bersezio and Forcella2004; Bresciani and Perotti, Reference Bresciani and Perotti2014). Calculated displacements across the main thrusts of the Po Plain attest to tectonic activity during the entire Quaternary, with a marked decrease from the eastern sectors to its western part (Maesano et al., Reference Maesano, D'Ambrogi, Burrato and Toscani2015). The same scenario is suggested by displacements obtained from GPS measurements and SAR interferometry (Devoti et al., Reference Devoti, Esposito, Pietrantonio, Pisani and Riguzzi2011, Farolfi et al., Reference Farolfi, Bianchini and Casagli2018; Anderlini et al., Reference Anderlini, Serpelloni, Tolomei, De Martini, Pezzo, Gualandi and Spada2020), and from the distribution and intensity of seismic activity (Michetti et al., Reference Michetti, Giardina, Livio, Mueller, Serva, Sileo and Fioraso2012). All these data show a larger amount of shortening and a higher cumulate moment tensor passing from the east to the west of the plain.
Among the limited exposed tectonic evidence of recent deformation, active structures (Fig. 2) have been identified by Desio (Reference Desio1965) at San Colombano, Romanengo, and Capriano del Colle (Livio et al., Reference Livio, Berlusconi, Zerboni, Trombino, Sileo, Michetti, Rodnight and Spötl2014; Bresciani and Perotti, Reference Bresciani and Perotti2014; Zuffetti et al., Reference Zuffetti, Bersezio, Contini and Petrizzo2018; Zuffetti and Bersezio, Reference Zuffetti and Bersezio2020). Exposures of possibly active tectonic structures deforming Upper Pleistocene to Holocene sediments (Livio et al., Reference Livio, Berlusconi, Michetti, Sileo, Zerboni, Trombino and Cremaschi2009, Reference Livio, Berlusconi, Zerboni, Trombino, Sileo, Michetti, Rodnight and Spötl2014) occur in the Brescia area at Castenedolo and Capriano del Colle (Fig. 2).
Concerning the seismicity, an important seismic event (Burrato et al., Reference Burrato, Ciucci and Valensise2003; Albini and Rovida, Reference Albini and Rovida2010) occurred a little more than two centuries ago (12 May, 1802) close to Soncino (Fig. 2) with an estimated moment magnitude (Mw) 5.7 (recently revised by Rovida et al., Reference Rovida, Locati, Camassi, Lolli, Gasperini and Antonucci2021, at Mw 5.6). Other significant earthquakes with a maximum Mw 5.3 are known in the nearby area of Caviaga in 1786 and 1951 (Caciagli et al., Reference Caciagli, Camassi, Danesi, Pondrelli and Salimbeni2015) along the Apennine front (Fig. 2).
In this paper, we present detailed analyses of a small outcrop, which was exposed between 2008 and 2010 along the Serio River bank south of Montodine (Figs. 2, 5), located between the area struck by the 1802 earthquake of Soncino and the two events that occurred at Caviaga. The outcrop consists of Holocene sandy clays with peat beds showing a well-defined thrust fault with 1 m of net displacement, sealed by medieval-age gravels.
In spite of the small dimensions of the exposure, this outcrop is of overriding importance for the assessment of the seismic potential of the area because it represents unique evidence of significant surface deformations affecting Holocene sediments. Large outcrops are, in fact, very rare in the Po Plain, and this lack of exposures may cause an underestimation of late Quaternary deformation. After presenting the stratigraphy, structural setting, and seismicity of the Central Po Plain, we analyze the chronostratigraphy and the deformation structures observed in the outcrop. Additionally, we provide new information about the subsurface geology of the area, discussing the possible origin of the deformations in light of the regional structural setting and the local postglacial evolution.
Geological setting and seismicity of the area
Subsurface structure of the central portion of the Po Plain in the study area
The Montodine area is located above the buried thrust fronts of the central Southern Alps and the Northern Apennines (Emilian arc). Available information on these structures is based on the few published Agip-Eni deep-seismic sections (Pieri and Groppi, Reference Pieri and Groppi1981; Casero, Reference Casero, Crescenti, D'Offizi, Merlino and Sacchi2004; Fantoni et al., Reference Fantoni, Bersezio and Forcella2004). According to Fantoni et al. (Reference Fantoni, Bersezio and Forcella2004), the frontal portion of the Southern Alps, the Milan-Belt of Schönborn (Reference Schönborn1992), consists of a S-verging imbricate thrust fan resting on a décollement developed along the Cretaceous to middle Eocene units. The fan includes part of the Mesozoic to Cenozoic units up to the upper Oligocene to lower Miocene clastic successions forming the infilling of the foredeep of the Southern Alps. The frontal portion of the buried thrust belt includes terms up to the Serravalian and Tortonian deposits, showing marked growth structures due to synsedimentary thrust activity (Fig. 3). Lower Messinian deposits unconformably cover the thrust fan in its northern portion, whereas the fan was deformed later in its southern part, as suggested by the syntectonic lower Messinian sediments lapping-out above the buried Ripalta anticline, located just north of Montodine. Uppermost Messinian to Pliocene deposits seal these growing structures (Fantoni et al., Reference Fantoni, Bersezio and Forcella2004), and were later deformed by deep wedging of Apennine thrust faults. The buried Ripalta anticline (Fig. 3, section A-A’), hosting an important gas field in the past (AGIP Mineraria, 1959a), is a S-verging fault-propagation-fold, which deforms the entire Miocene to Pliocene succession.
The front of the Apennines results in a N-verging thrust system culminating in the Soresina fold, a faulted anticline directly facing the Ripalta anticline with a syncline interposed in between (Fantoni et al., Reference Fantoni, Bersezio and Forcella2004). Severe shortening of the Cenozoic successions is evident in the Apennines all along the Emilian thrust front and to the north of it (Fantoni et al., Reference Fantoni, Bersezio and Forcella2004), where deformation is obviously recorded up to the Early to Middle Pleistocene.
The northernmost thrust fault of the Apennines propagates as a deep, blind ramp abutting at depth against the S-verging thrust of the Ripalta anticline (Fantoni et al., Reference Fantoni, Bersezio and Forcella2004). According to Fantoni et al. (Reference Fantoni, Bersezio and Forcella2004), the Ripalta anticline is interpreted as a shallow structure related to the propagation of the deep Apennine thrusts, forming a complex triangle zone. Folding of the Ripalta anticline occurred during the Pliocene because no obvious Quaternary deformations are recorded in seismic sections (Fig. 3). Casero (Reference Casero, Crescenti, D'Offizi, Merlino and Sacchi2004) and Toscani et al. (Reference Toscani, Bonini, Ahmad, Di Bucci, Di Giulio, Seno and Galuppo2014) give similar interpretations, displaying Quaternary folding along the Apennine front (Fig. 3, section B-B’). According to these authors, the advance of the frontal Apennine thrust is inhibited by the Southern Alps frontal structures, causing out-of-sequence younger internal thrust activation displacing the Quaternary deposits.
Bresciani and Perotti (Reference Bresciani and Perotti2014) proposed a different interpretation of the deep structure of this area. These authors argued that the deep Apennine frontal thrust crosscuts the buried thrust of Ripalta, displacing it and two other, older S-verging thrusts located to the north, causing the recent folding and uplift of Pliocene to Quaternary succession forming the Romanengo anticline (Fig. 3, section 2, detail of cross section A-A’). In this model, the Ripalta anticline should be older and testify to a reactivation of the frontal part of the Southern Alps, at least up to the beginning of the Quaternary. In spite of the two contrasting interpretations, evidence of recent and possibly active motions in this sector of the Po Plain is unequivocal.
Uplift and slip rates of the main active tectonic structures
Quantitative estimates of the rates of subsidence/uplift in the Po Plain were obtained from a 3D model for the Quaternary time interval (Maesano et al., Reference Maesano, D'Ambrogi, Burrato and Toscani2015). Calculated sedimentation rates in the central part of the Po Plain resulted in ten orders of magnitude larger than the uplift ones, demonstrating a general subsiding context of the entire region. According to this model, an average decrease of the uplift rates also occurred during the last 0.45 Ma, varying from 2.83 ± 0.19 to 2.14 ± 0.21 mm/yr during the Calabrian to a minimum value of 0.39 ± 0.05 mm/yr in the last 0.45 Ma.
Slip rates calculated for the ramp T2EF (Maesano et al., Reference Maesano, D'Ambrogi, Burrato and Toscani2015), which corresponds to the main fault-related anticline of cross section A-A’ in Figure 3, is up to 0.51 ± 0.03 mm/yr since 1.81 Ma, with a total slip of 916 m. The ramp fault related to the Soresina anticline (T3EF), which was restored through a similar procedure, gave a long-term slip rate of 0.19 ± 0.03 mm/yr since Calabrian times on a total slip of 340 m.
This reconstruction indicates that the slip rate (0.70 mm/yr) obtained for the Emilian Thrust front (Maesano et al., Reference Maesano, D'Ambrogi, Burrato and Toscani2015) for the past 1.81 Ma is smaller than the ones of the Ferrara (~0.95 mm/yr) and of the Romagna thrust fronts (~1.40 mm/yr), showing a marked westward decrease. GPS data also suggest a similar scenario across the Northern Apennines, with a marked decrease of shortening across thrust fronts from the 2.4 mm/yr of the Ferrara thrusts to ~0.5 mm/yr of the western Emilia thrust fronts (Devoti et al., Reference Devoti, Esposito, Pietrantonio, Pisani and Riguzzi2011; Michetti et al., Reference Michetti, Giardina, Livio, Mueller, Serva, Sileo and Fioraso2012). Comparable information also comes from historical seismicity, recording a marked difference in terms of single events and in their intensity, with a marked increase moving eastward from the Emilian Arc (Burrato et al., Reference Burrato, Ciucci and Valensise2003; Rovida et al., Reference Rovida, Camassi, Gasperini and Stucchi2011; Vannoli et al., Reference Vannoli, Burrato and Valensise2015).
Historical and present-day seismicity of the area
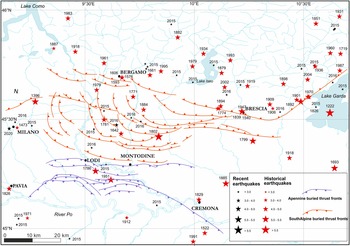
The historical seismicity of this area of the Po Plain (Fig. 4) is generally considered much weaker with respect to its eastern portion, with the main events clustering along the foothills of the Southern Alps. Low-magnitude events (2.5 < ML < 3.5) occur both at the Alps foothills and in the plain (Pondrelli et al., Reference Pondrelli, Morelli and Ekström2004), with a few exceptions within the outcropping portion of the central Southern Alps. The most significant seismic event occurred close to the study area about two centuries ago, on 12 May 1802. According to detailed reconstructions based on historical documents (Albini and Rovida, Reference Albini and Rovida2010), its intensity has been evaluated up to Mw 5.7, more recently revaluated at Mw 5.6 (Rovida et al., Reference Rovida, Locati, Camassi, Lolli, Gasperini and Antonucci2021), corresponding to the strongest event known west of Lake Garda and the Lessini Mountains. Following the historical record, the main shock was clearly felt all across Lombardy and surrounding areas, leaving serious damage, especially around Soncino and Orzinuovi in the Brescia Province along the lower portion of the Oglio River valley. Three other earthquakes with a similar or higher magnitude occurred in the past at Salò (30 October 1901: 5.67 Mw) and in the Brescia (25 December 1222: Mw 6.05) and Verona areas (03 January 1117: Mw: 6.49), far from Soncino (Rovida et al., Reference Rovida, Locati, Camassi, Lolli, Gasperini and Antonucci2021).
Location of historical and instrumental seismicity events in the Lombardian Po Plain. Epicenters are from CPTI15 v3.0, Parametric Catalogue of Italian Earthquakes (Rovida et al., Reference Rovida, Locati, Camassi, Lolli and Gasperini2020, Reference Rovida, Locati, Camassi, Lolli, Gasperini and Antonucci2021). The traces of buried thrust fronts are from Fantoni et al. (Reference Fantoni, Bersezio and Forcella2004).

Available macroseismic data reconstructed by Albini and Rovida (Reference Albini and Rovida2010) allowed relocation of the Soncino earthquake epicenter using the boxer code (Gasperini et al., Reference Gasperini, Bernardini, Valensise and Boschi1999) just 3 km to the north of the village (45.424°N, 9.839°E) with Mw 6.02 ± 0.13. The same authors recalculated the epicenter also using the BW code (Bakun and Wentworth, Reference Bakun and Wentworth1997), obtaining Mw 5.68 and a similar location (45.420°N, 9.868°E), close to previous estimates of CPTI04, which are consistent with the activity of the thrust related to growth of the Romanengo anticline (Galli, Reference Galli2005; Albini and Rovida, Reference Albini and Rovida2010). The magnitude of the event has been revaluated more recently to Mw 5.6 (Rovida et al., Reference Rovida, Locati, Camassi, Lolli, Gasperini and Antonucci2021).
Historical earthquakes occurred in the nearby areas on the Apennine side as well, close to Cavaglia, a few kilometers to the south of Montodine. Cavaglia was struck by an important earthquake in 1786, with an estimated Mw 5.33 (Caciagli et al., Reference Caciagli, Camassi, Danesi, Pondrelli and Salimbeni2015), or Mw 5.22 according to Rovida et al. (Reference Rovida, Locati, Camassi, Lolli, Gasperini and Antonucci2021). In 1951, two closely spaced earthquakes occurred on 15 and 16 May 1951, with Mw 5.25 (Mw 5.17 in Rovida et al., Reference Rovida, Locati, Camassi, Lolli, Gasperini and Antonucci2021) and Mw 4.5 (Caciagli et al., Reference Caciagli, Camassi, Danesi, Pondrelli and Salimbeni2015), respectively. It is worth noting that the two shocks have been interpreted for many years as events induced by human activities related to extraction in the Cavaglia gas field (Caloi et al., Reference Caloi, De Panfilis, Di Filippo, Marcelli and Spadea1956; AGIP Mineraria, 1959b). Based on a comprehensive revision of available data, Caciagli et al. (Reference Caciagli, Camassi, Danesi, Pondrelli and Salimbeni2015) reinterpreted the seismic sequence indicating mid- to deep-crustal hypocentral depths (32–35 ± 5 km for the 15 May 1951 main shock and 14–20 ± 4 km for the 16 May aftershock), unequivocally related to a deep natural seismicity. Based on the wide area affected by the 1786 earthquake, they also suggested a deep origin for this older event.
Late Pleistocene to Holocene drainage evolution of the Adda, Serio, and Oglio River systems
The oldest fluvial deposits outcropping in the area are exposed on the Romanengo High, a small relief east of Crema (Supplementary Fig. 2), due to an anticlinal setting resulting from the activity of blind thrusts at depth (Bresciani and Perotti, Reference Bresciani and Perotti2014). The late Pleistocene drainage of the Adda River prior to the LGM was oriented NW-SE, between the Romanengo High and the Apennine front (Ravazzi et al., Reference Ravazzi, Deaddis, De Amicis, Marchetti, Vezzoli and Zanchi2012). Most probably during MIS 3, the river followed the Romanengo-Soresina depression (Fig. 5A).
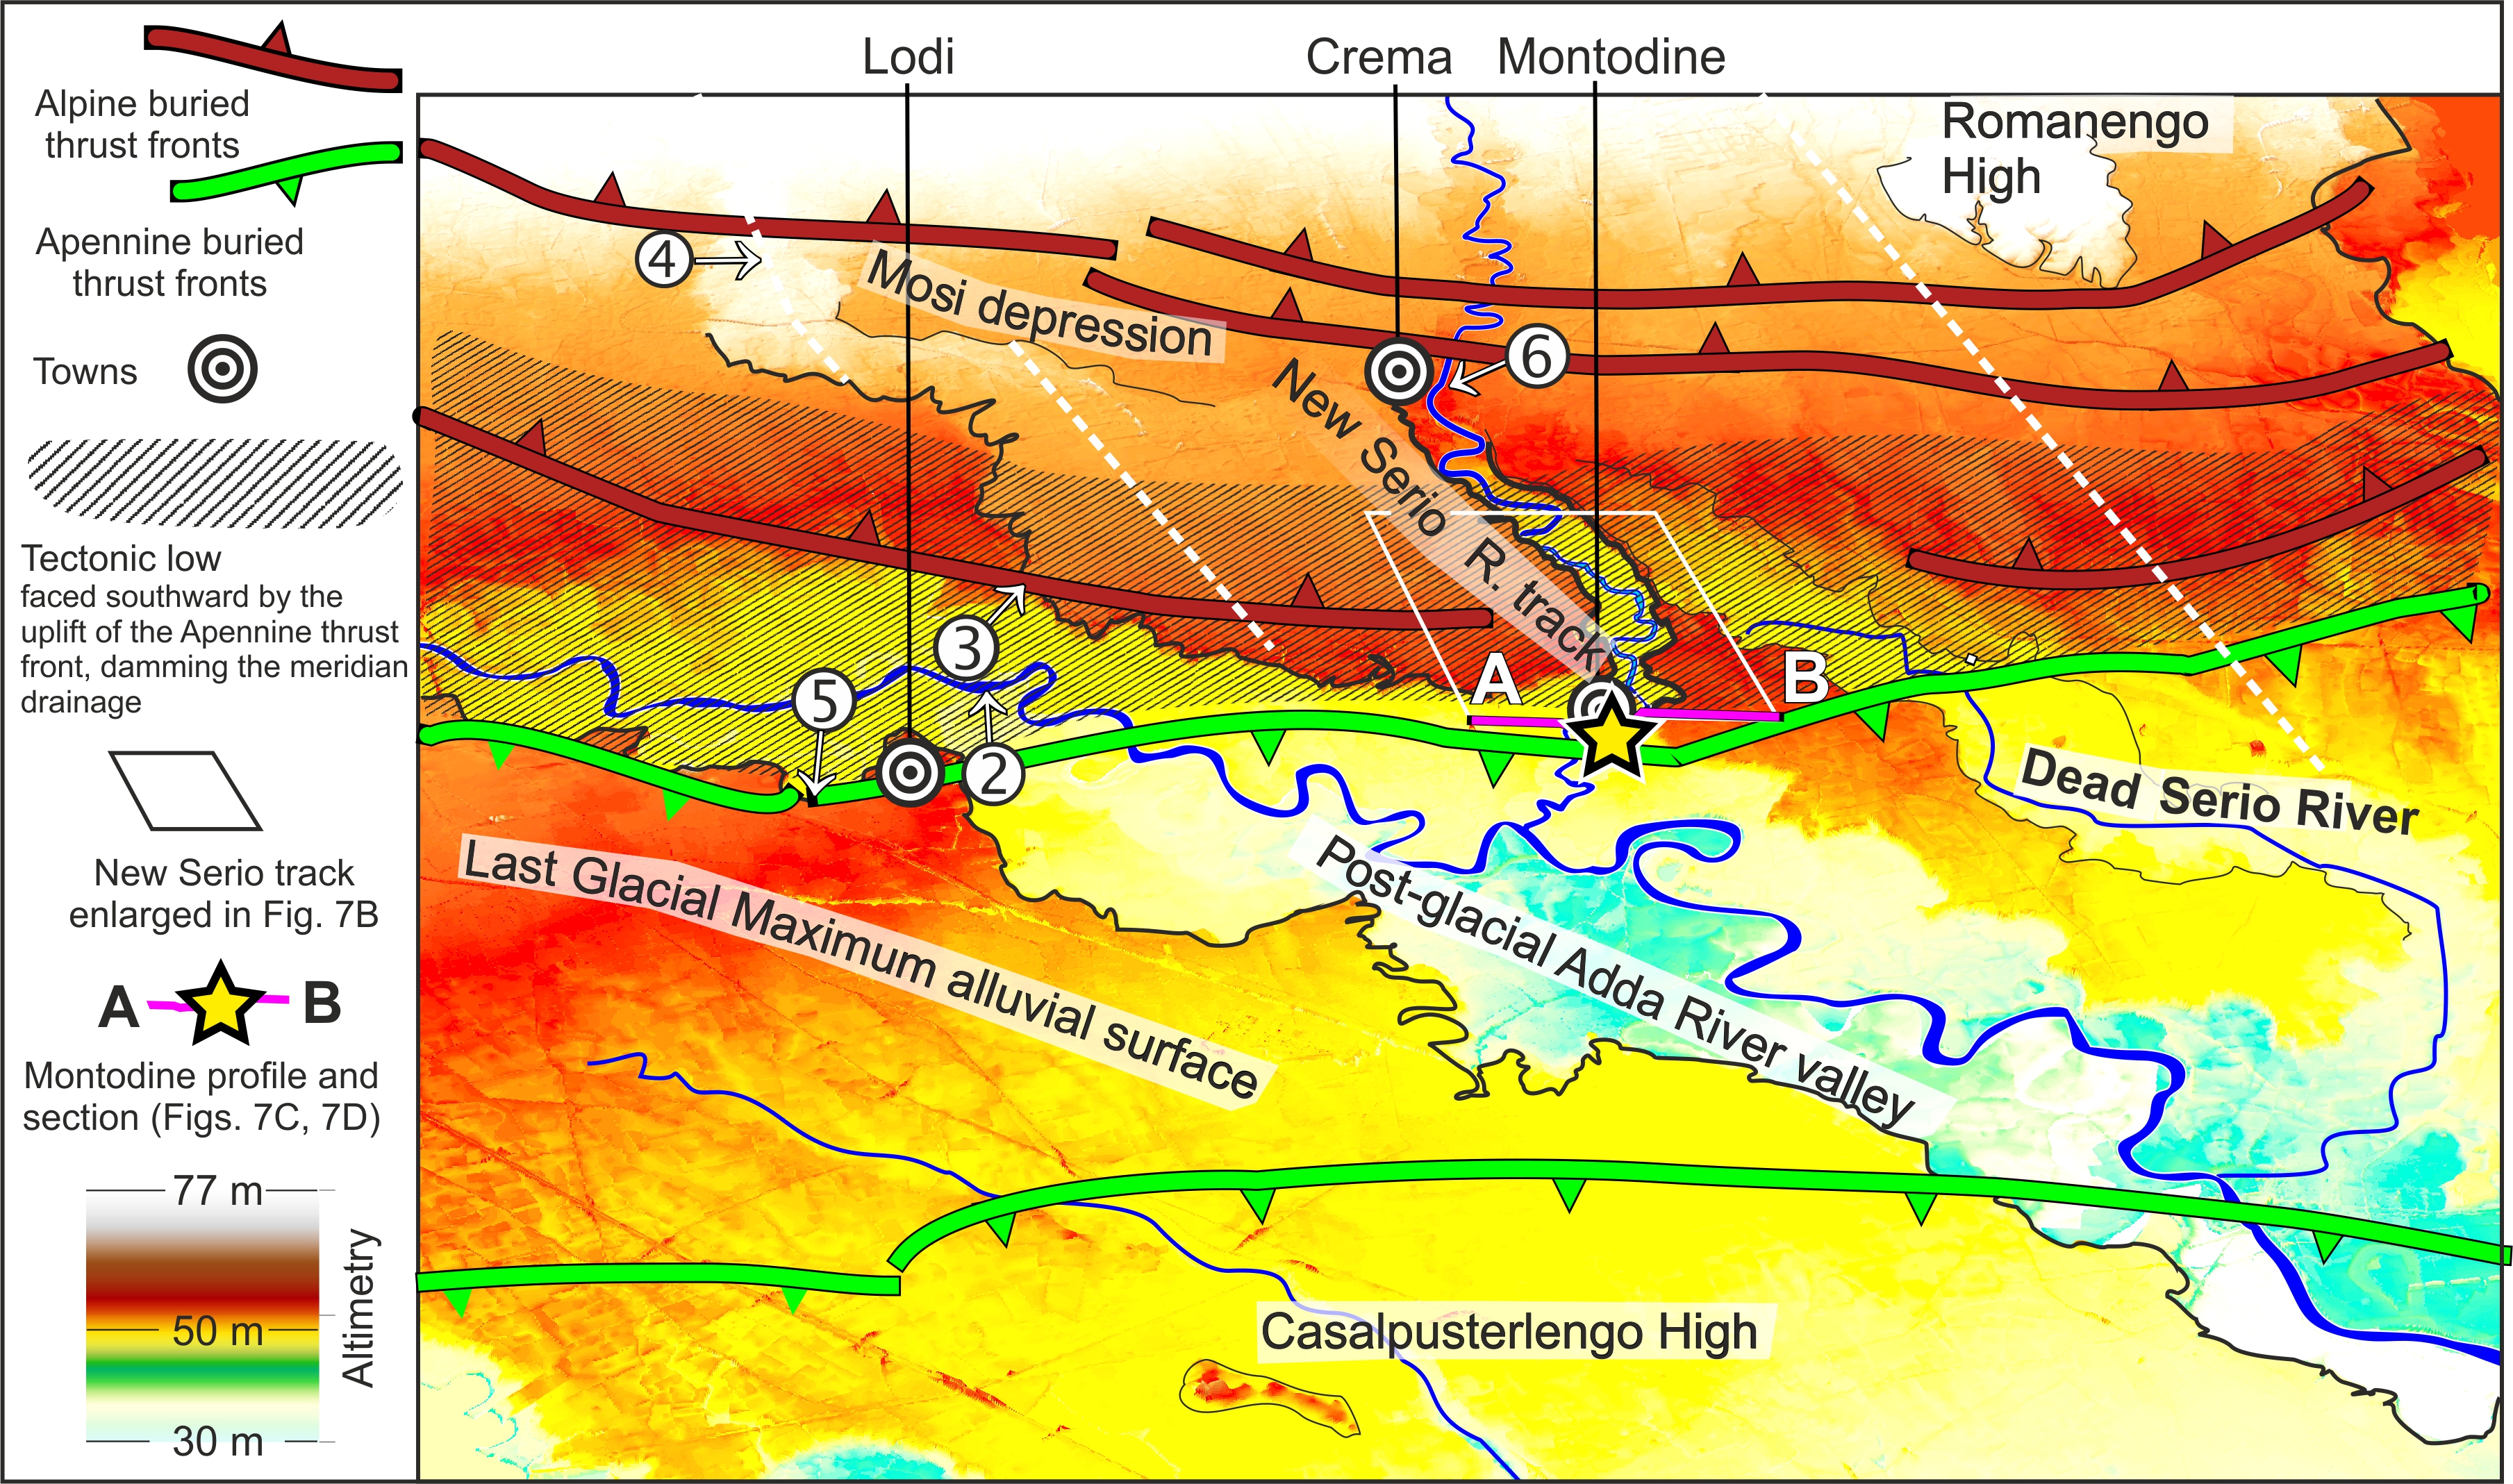
(A) Digital Terrain Model showing the postglacial valleys of the Adda River, of its tributary Serio River, and of the Lambro River (modified from Ravazzi et al., Reference Ravazzi, Deaddis, De Amicis, Marchetti, Vezzoli and Zanchi2012). The surface projection of the main Alpine (red) and Apennine (green) structures underlying the Romanengo-Soresina tectonic depression (diagonal striped area) are superimposed on the present drainage. Numbers 1–6 indicate sites providing chronostratigraphic evidence of events that occurred in the last 40 ka; 1 = Montodine section and faulted belt; 2 = deformed pre-LGM peat belt supporting a fossil forest, close to Lodi; 3 = Casaletto Ceredano reference section for HS3-LGM alluvial aggradation chronostratigraphy (Ravazzi et al., Reference Ravazzi, Badino, Perego, Bertuletti, De Amicis, Deaddis, Garozzo, Novellino and Pini2020); 4 = deformed topography of the surface fan gradient at Pandino; 5 = Pulignano meander, an example of lateral erosion by the Adda River on the right scarp during the most recent (Medieval) evolution of the post-glacial valley; 6 = diversion point, where the Serio River was captured by head-wall erosion, forming the New Serio track; this Middle Age diversion led to abandonment of an earlier track (Dead Serio River track in Fig. 2 and Supplemental Material Appendix A, Supplementary Fig. 1). (B) Digital Terrain Model of the relief of the central Po Plain in the Last Glacial Maximum showing active fluvioglacial fans. The reconstructed drainage is shown by black arrows (MIS 3 drainage), or white and blue arrows (LGM drainage).
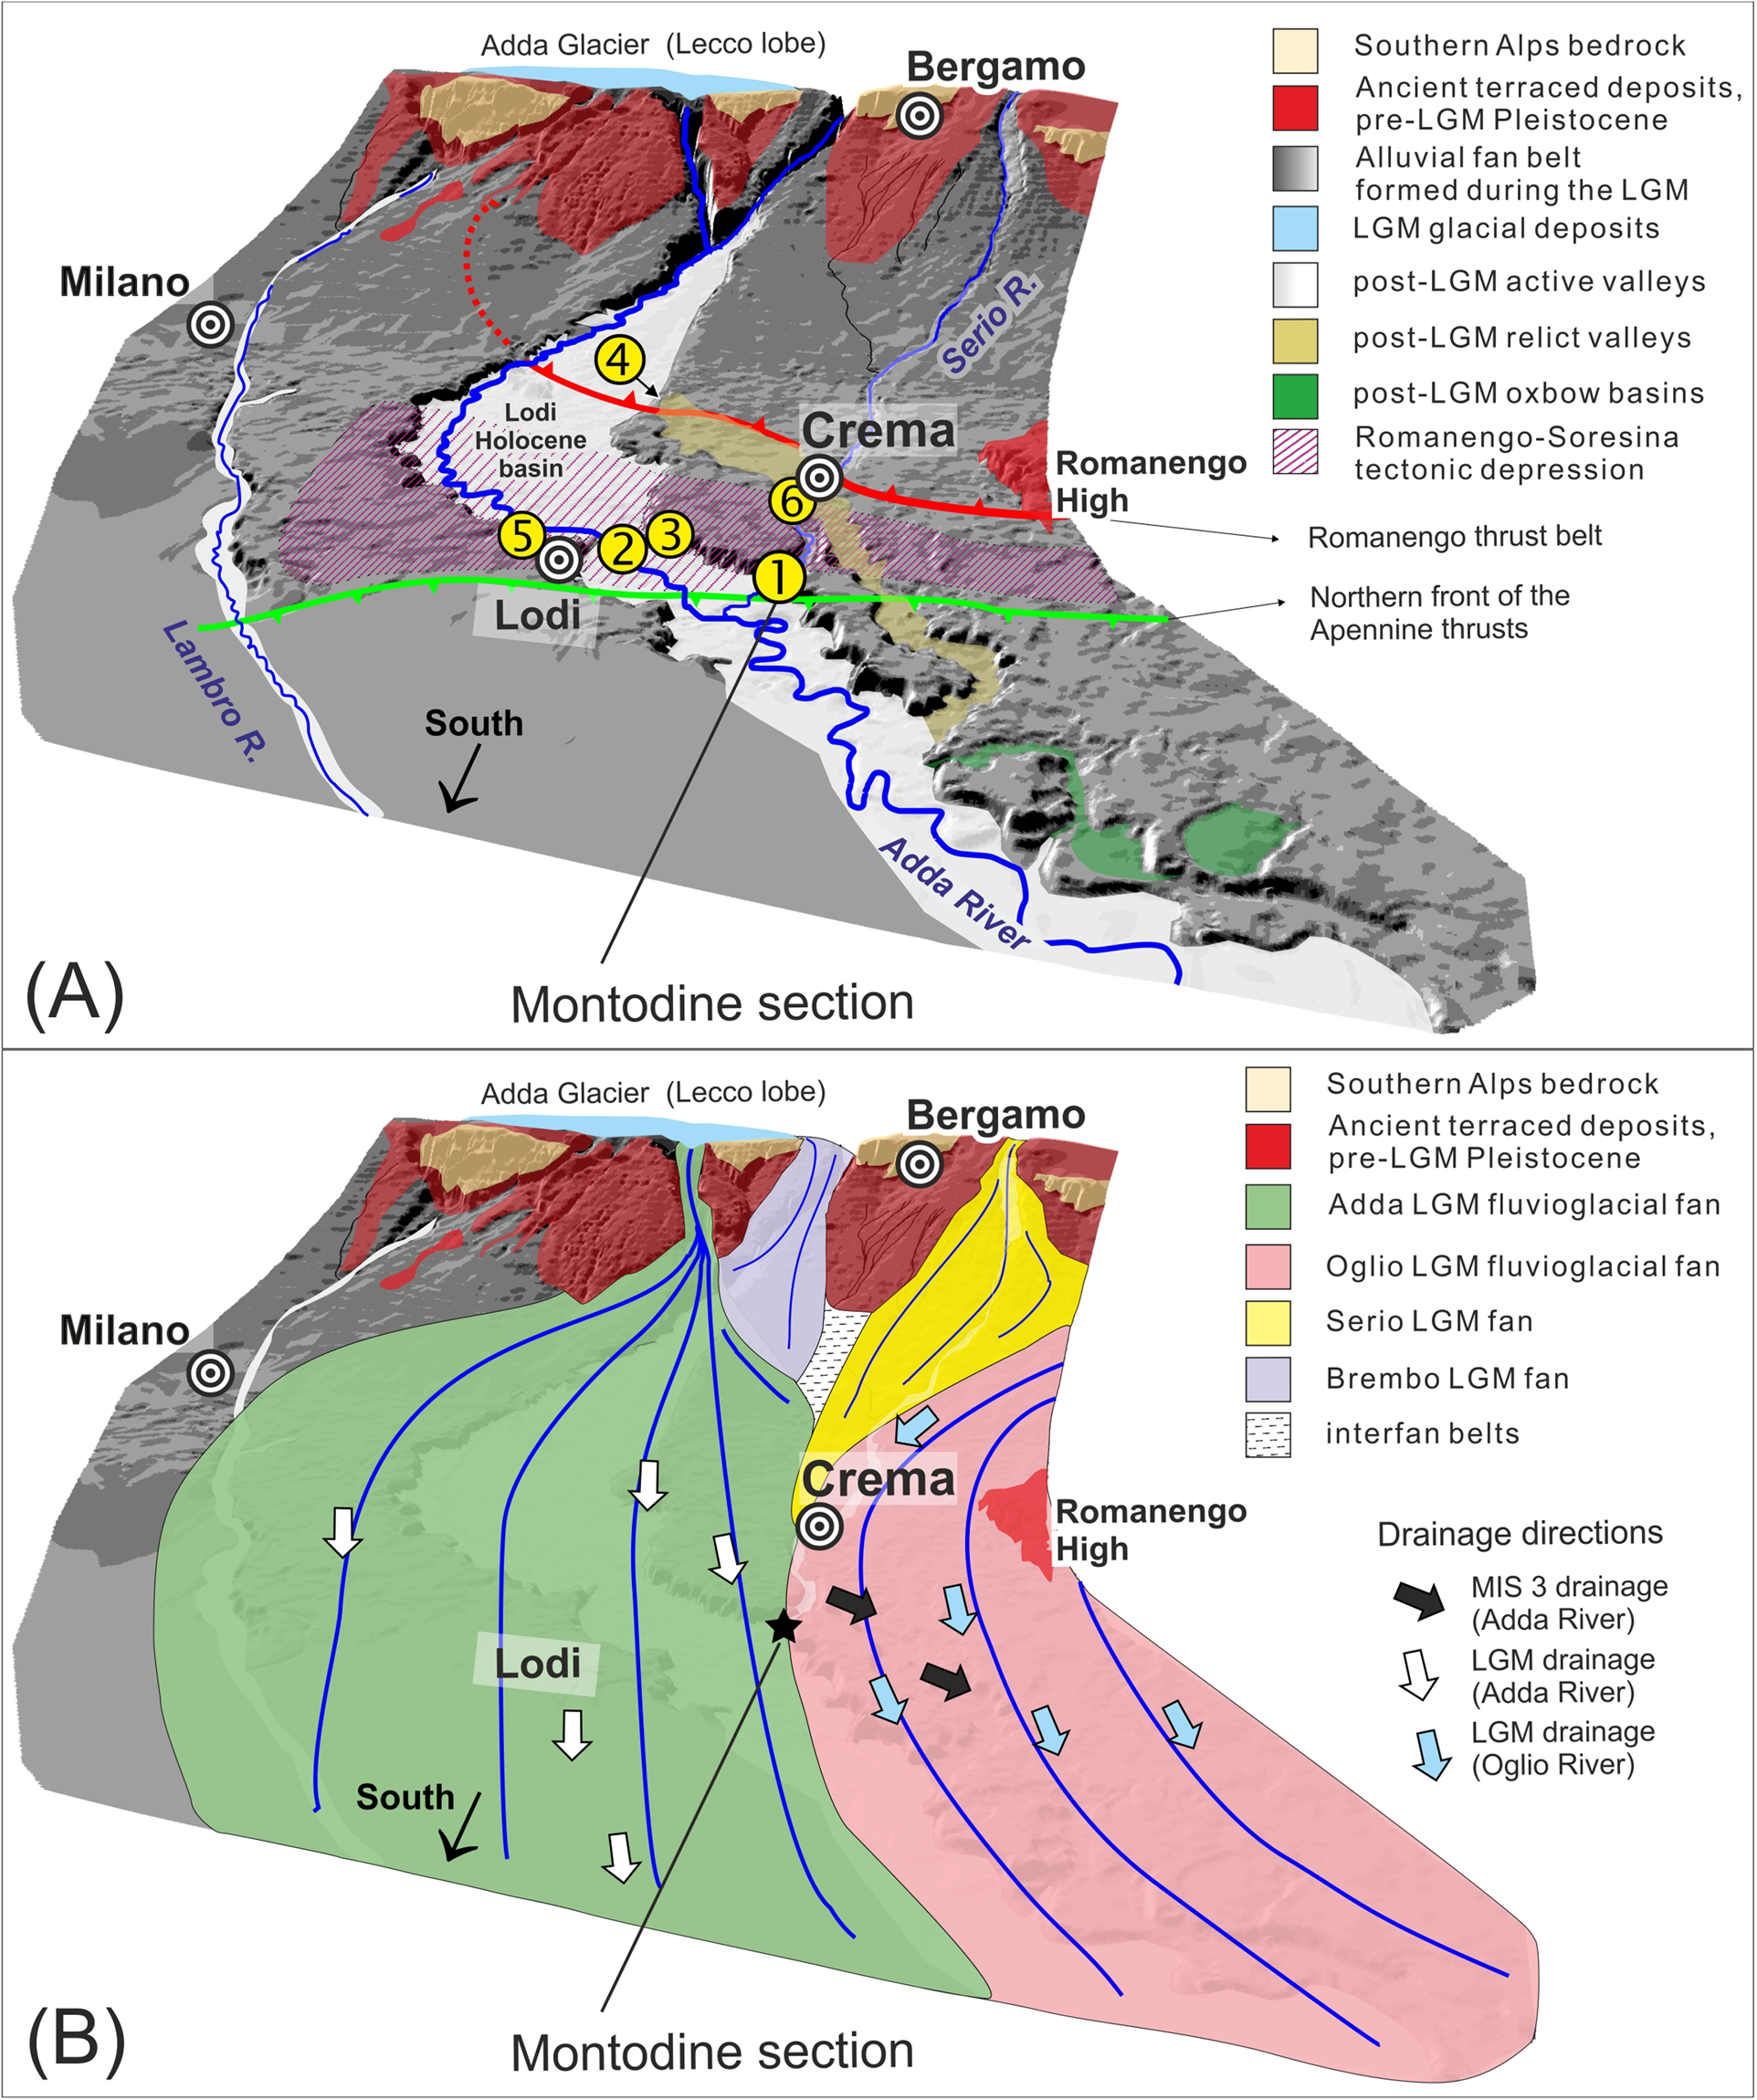
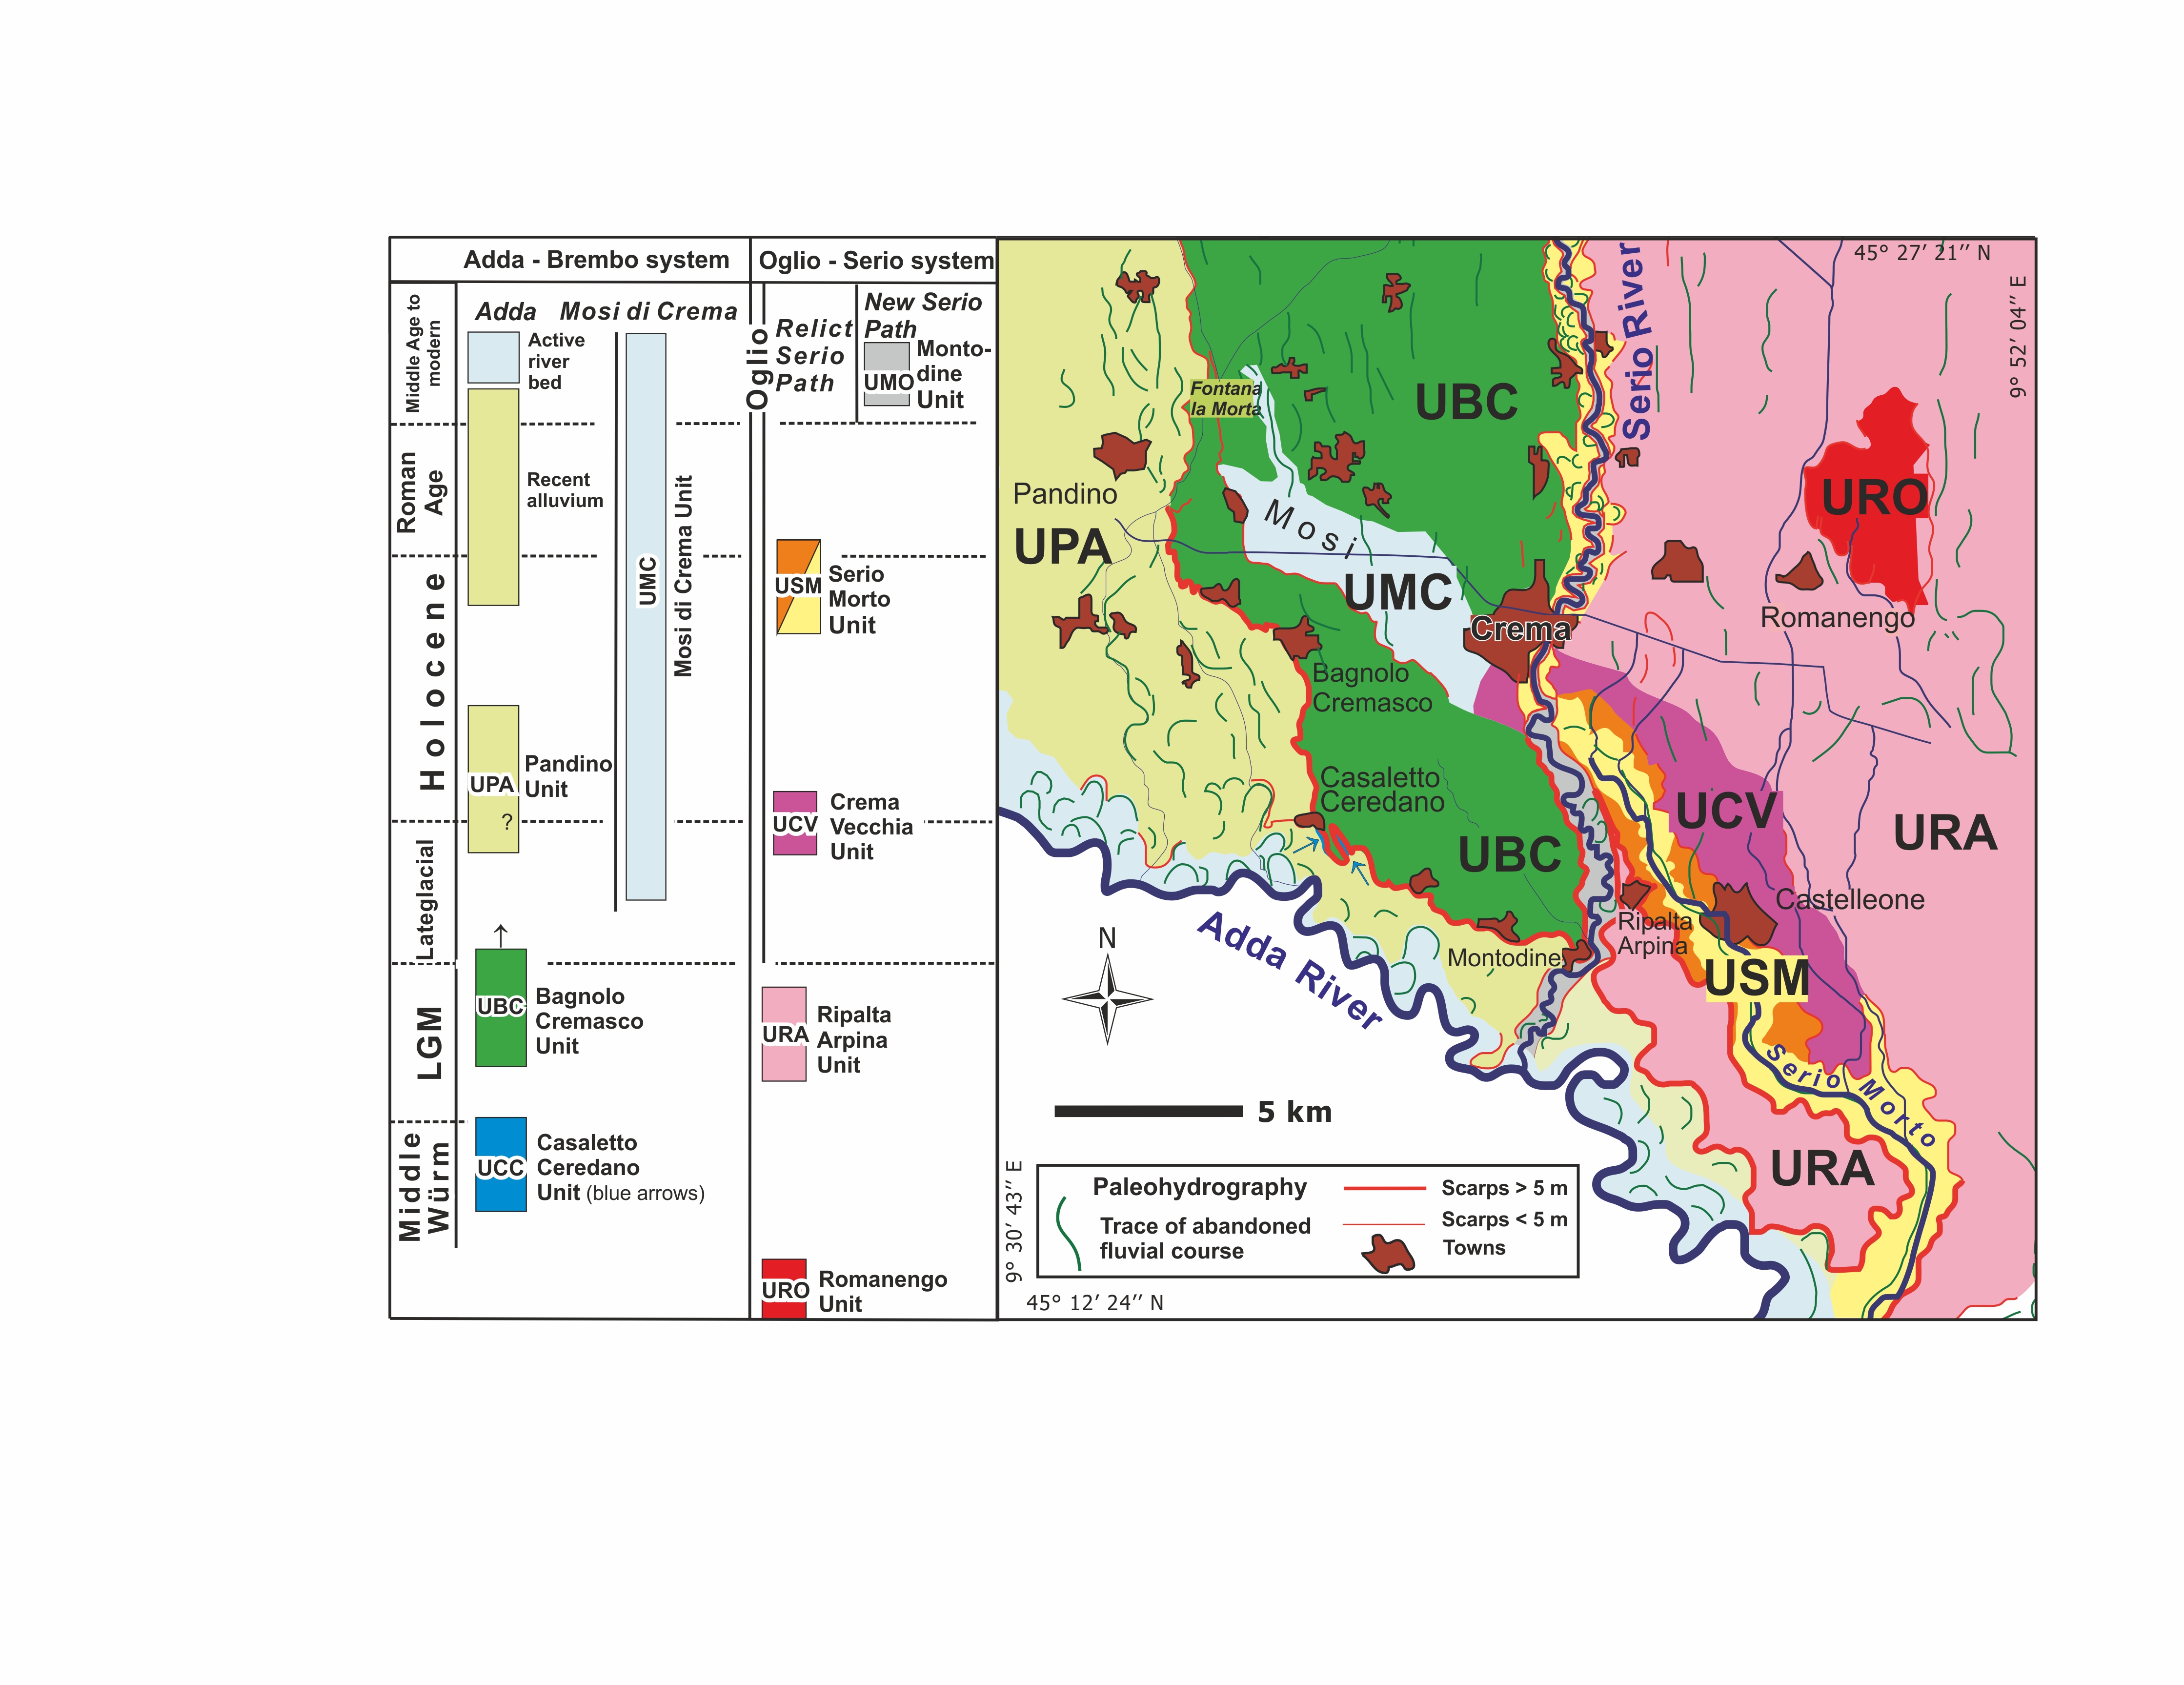
Starting with Heinrich Event 3, and during most of the LGM (i.e., between 30.5 and ca. 17.5 cal ka BP), the area was covered by two large, coalescent fans (Fig. 5B), formed by the outwash of the Adda and Oglio glaciers (Ravazzi et al., Reference Ravazzi, Badino, Perego, Bertuletti, De Amicis, Deaddis, Garozzo, Novellino and Pini2020). The smaller fan of the Serio River was restricted to the north of Crema (Fig. 5B). The sediment composition allows characterizing the contributions of individual river channels (Garzanti et al., Reference Garzanti, Vezzoli and Andò2011; Ravazzi et al., Reference Ravazzi, Deaddis, De Amicis, Marchetti, Vezzoli and Zanchi2012). LGM Adda River deposits are characterized by quartz, feldspars, and metamorphic lithic grains derived from the Austroalpine of the Alps and from the Southern Alps. The Serio River supplies clasts from the Permian–Mesozoic cover of the Southern Alps, which are rich in carbonate fragments, felsic volcanic grains, chert, and calcareous sandstone grains. Finally, sediments deposited by the Oglio River include quartz, carbonate grains, volcanic rock fragments, and feldspars associated with minor hornblende, garnet, and epidote from the cover of the Southern Alps and the Adamello batholith. Drainage of the Adda and Oglio rivers was meridional during the LGM phase, after abandoning the pre-LGM channel (Ravazzi et al., Reference Ravazzi, Deaddis, De Amicis, Marchetti, Vezzoli and Zanchi2012). The LGM aggradation of these fans is represented by deposition of the Bagnolo Cremasco Unit (UBC) in the Adda system and the Ripalta Arpina Unit (URA) in the Oglio domain (Supplementary Fig. 2). Both these fans cover the older Casaletto Ceredano Unit (UCC), interpreted as a sequence of channeled deposits of the Adda River (Supplementary Fig. 2).
A late glacial (17.5–11.7 cal ka BP) phase of entrenching formed the present-day fluvial valleys of the Adda (see postglacial valley in Supplementary Fig. 1), Serio, and Oglio rivers, forming the terraced deposits of the Pandino Unit (UPA) along the upper Adda River and the Crema Vecchia Unit (UCV) in the Oglio-Serio domain (Supplementary Fig. 2). The palustrine infilling of the Mosi di Crema Unit (UMC) began after this stage of early entrenching, ca. 15 cal ka BP or before. These infills document an overall fluvial network reorganization that occurred in the late glacial, marked by a left displacement of the channel course of the main Alpine rivers. The resulting eastward-oriented hydrographic pattern (Fig. 2) was maintained after the late glacial and Holocene excavation of the modern valleys (i.e., the Dead Serio and the lower trunk of the Adda River; Fig. 2, Supplementary Fig. 1). A later (Holocene) age for channel displacement, proposed for the Oglio River system (Burrato et al., Reference Burrato, Ciucci and Valensise2003) is not supported in the Adda River system by the available chronology of the drainage evolution (Ravazzi et al., Reference Ravazzi, Deaddis, De Amicis, Marchetti, Vezzoli and Zanchi2012). Still, active buried anticlines and Holocene seismic activity may have played a role both in the Late Glacial reorganization of both fluvial courses and in their Holocene evolution (Supplemental Material, Appendix A). This issue is a matter of contemporary debate and requires additional stratigraphic work to date the evolution of the lowermost reaches of the main rivers feeding the lower Lombardy plain.
Methods
The focus of our work is the analysis of the faulted outcrop exposed south of Montodine along the northern bank of the Serio River. In order to get as much information as possible from the natural outcrop, we logged a trench during summer 2009, according to the suggestion given in McCalpin (Reference McCalpin2009). Due to the position of the outcrop and to the logistic restrictions caused by fluctuations in the river level, we enlarged the natural exposure, logging a vertical wall ~1.5 m high and 20 m long. The waterlogged portion of the section was investigated through percussion coring, down to 2.5 m depth. Stratigraphic information was digitally redrawn based on a composite merged picture.
We performed radiocarbon dating on terrestrial plant material selected from the section of Montodine (n.1 in Fig. 5A) and from other localities along the Adda River valley (i.e., the fossil forest site of Lodi [n.2 in Fig. 5A and Supplementary Fig. 1; modified from Ravazzi et al., Reference Ravazzi, Deaddis, De Amicis, Marchetti, Vezzoli and Zanchi2012] and the Pulignano meander north of Lodi [n.5 in Fig. 5A and Supplementary Fig. 1]). We used short-lived terrestrial plant parts (fruits and seeds) or the external rings of stem wood, unaffected by decay. Botanical details on dated plant parts are given in Table 1. AMS radiocarbon ages were measured at the University of Uppsala (Lab code Ua) and University of Salento (Lab code LTL). Calibration was performed using CALIB version 8.0.4 with the IntCal20 atmospheric calibration curve (Reimer et al., Reference Reimer, Austin, Bard, Bayliss, Blackwell, Ramsey and Butzin2020).
Radiocarbon chronology.

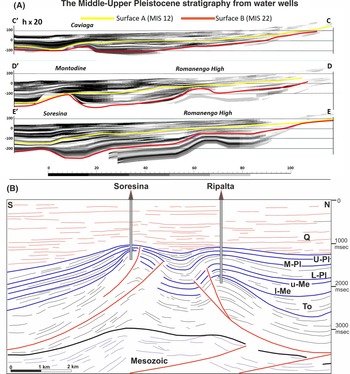
In order to integrate the surface geology with the data obtained from deep seismic sections, where the Quaternary units are poorly represented, we obtained new information on facies variations and distribution of the buried Quaternary successions through the construction of a 3D model of the area, following the procedure established by Cavallin et al. (Reference Cavallin, Bonomi, Fumagalli and Marchetti2020). Using a large number of water drill holes, we reconstructed the subsurface stratigraphy based on the identification of individual layers, chronostratigraphically calibrated based on isochron surfaces marking the evolution of the Po Plain Quaternary sequences (Regione Lombardia and ENI Divisione AGIP, 2002; Muttoni et al., Reference Muttoni, Carcano, Garzanti, Ghielmi, Piccin, Pini, Rogledi and Sciunnach2003; Scardia et al., Reference Scardia, De Franco, Muttoni, Rogledi, Caielli, Carcano, Sciunnach and Piccin2012). The deepest surface marker corresponds to the so-called “red surface,” marking the inception of major glaciations in the Alps (Muttoni et al., Reference Muttoni, Ravazzi, Breda, Pini, Laj, Kissel, Mazaud and Garzanti2007), and correlated with Marine Isotopic Stage (MIS) 22, 900–870 ka (age stack from Ferretti et al., Reference Ferretti, Crowhurst, Hall and Ccho2010; de Boer et al., Reference de Boer, Lourens and van de Wal2015). Moving up section, other significant levels include the yellow marker (ca. 450 ka within the MIS 12), recognized by Scardia et al. (Reference Scardia, De Franco, Muttoni, Rogledi, Caielli, Carcano, Sciunnach and Piccin2012), the isochron surface ca. 150 ka (within MIS 6), and the isochron surface ca. 120 ka (within MIS 5e).
Results
Reconstructions of the regional subsurface Quaternary succession
Starting from the 3D model of the middle-upper Quaternary successions of the Lombardian Po Plain (Cavallin et al., Reference Cavallin, Bonomi, Fumagalli and Marchetti2020), we obtained three original cross sections (Fig. 2) in the area of the present work (Fig. 6a). Sections D-D’ and E-E’ (Fig. 2) show a gentle anticline marking the Romanengo High, evident up to the yellow surface (ca. 450 ka). Middle Pleistocene gentle folding is also evident in the southern portion of the three sections, on top of the growing anticlines, related to propagation of the external Apennines thrusts between Caviaga and Soresina, passing south of Montodine (Fig. 2), just below the studied outcrop. Here unconformities and gentle folding are evident up to the successions correlated with MIS 12. Neither section C nor D (Fig. 6a) shows evidence of recent activity for the Ripalta anticline, which lies at depth between the Romanengo fold and the Apennine front, apart from a gentle downwarping of the Middle Pleistocene layers. Evidence of older deformations can be recognized in Figure 6b, drawn on a seismic section reported in Fantoni et al. (Reference Fantoni, Bersezio and Forcella2004); gentle folding is evident within the intermediate portion of the undifferentiated Quaternary succession, especially above the Soresina anticline.
Cross-sections of the Pliocene to Quaternary successions of the the study area. (A) Cross sections obtained by a 3D modeling (Cavallin et al., Reference Cavallin, Bonomi, Fumagalli and Marchetti2020) of the study area based on the borehole information and positions of the “red” and “yellow” surfaces from Regione Lombardia and ENI Divisione AGIP (2002). Additional isochron surfaces described in the text. Gray tones represent the percentage of sands in the recent deposits. Vertical scale exaggeration is × 20. (B) Detail of the Soresina and Ripalta structures, redrawn from Fantoni et al. (Reference Fantoni, Bersezio and Forcella2004), along cross section A-A’ in Figure 3; horizontal and vertical scales are approximate and consistent with section E-E’ in Fantoni et al. (Reference Fantoni, Bersezio and Forcella2004, fig. 6). See text for additional comments.

In summary, information obtained by these sections evinces active fault-related folding at least for the whole Middle Pleistocene time interval, especially for the Romanengo and the Caviaga-Soresina structures, persisting up to recent times, especially along the Apennine structures, with deformation strongly decreasing toward the top of the Pleistocene successions in both areas.
Stratigraphy and chronology of the Montodine succession
Montodine is located along the final portion of Serio River; here, the river is entrenched within the external lobes of large fluvioglacial fans mostly formed during the LGM. However, the area has been part of the Adda River valley since its incision in the late Glacial and until the Late Medieval diversion of the Serio River (Figs. 5A, 7; Supplemental material Appendix A, Supplementary Fig. 2).
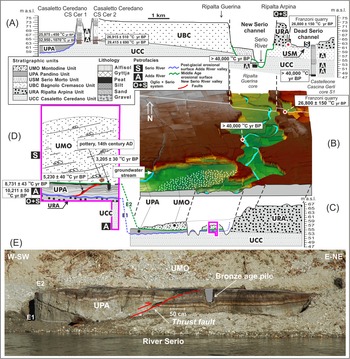
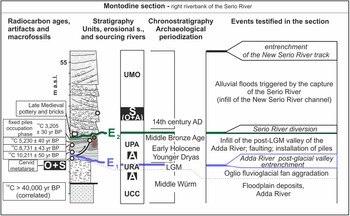
Detailed geology, geomorphology, sediment petrography, and chronostratigraphy of the New Serio River track entrenched into the LGM fluvioglacial surface (modified from Ravazzi et al., Reference Ravazzi, Deaddis, De Amicis, Marchetti, Vezzoli and Zanchi2012; see also Fig. 5A). (A) Stratigraphic section across the entrenched New Serio River track; (B) DTM block of the New Serio River track, vertical exaggeration 1:10; (C) Montodine profile cut at the southern limit of the DTM block, vertical exaggeration 1:20; (D) detail of the Montodine stratigraphic section exposed on the right bank of the Serio River. UCC = unit of Casaletto Ceredano; URA = unit of Ripalta Arpina; UPA = unit of Pandino; UMO = unit of Montodine; E1 = erosional surface E1; E2 = erosional surface E2. Details of the fault affecting the UPA are shown later on Figures 7B, 8A, 8B and 8D. For the identification of regional stratigraphic units and details on 14C chronology, see Figures 8D, 9, Supplementary Figure 2, and Table 1. (E) The Montodine section in November 2008, a few days after its exposure due to erosion of the embankment. UPA = unit of Pandino; UMO = unit of Montodine; E1 = erosional surface 1; E2 = erosional surface 2. The fault displacing the brown layers is evident.

The section exposed during 2008–2009 along the Serio River downstream of Montodine (Fig. 5A) includes a complex succession of stratigraphic units, separated by unconformities (Fig. 8). Hereafter, we examine the stratigraphic and chronostratigraphic setting.
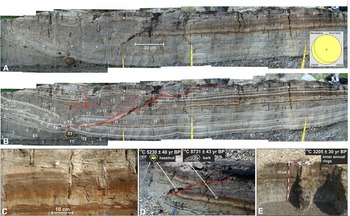
(A) Frontal view of the Montodine section after excavation and cleaning in July 2009, with mesoscopic measurements of the fault attitude (dip direction/dip) as cyclographic projections, Schmidt projection, lower hemisphere. (B) Same photo as in Figure 8A with layers numbered from 1 to 25 (layer 1 URA; layers 2–25 UPA). See text for additional details on the units. Note the irregular layer 18, showing load casts, which are possibly related to liquefaction.T1, T2, T3, T4, and T5 = reworked wood fragments at the base of the section. See text for additional details. (C) Detail of layer 18 showing load casts and other liquefaction structures, possibly due to seismic shaking. (D) Lateral view of the fault displacing the brownish layers rich in organic matter, with 14C radiocarbon ages from a hazelnut found along the fault plane and from one of the gyttja layer. (E) Bronze Age pole found in its original vertical position within the section during the excavation.

UCC (Unit of Casaletto Ceredano)
Below the water level of the Serio River, we penetrated a 2.5 m thick succession of laminated silty clay with compressed peat, formed in a floodplain palustrine environment. These deposits can be correlated to the Unit of Casaletto Ceredano (UCC), underlying the Unit of Ripalta Arpina (URA), ~3 km eastward, in the Dead Serio domain, dated to middle Würm between 30 to > 40 cal ka BP (Ravazzi, Reference Ravazzi, Deaddis, De Amicis, Marchetti, Vezzoli and Zanchi2012; Supplementary Fig. 2, not visible in Fig. 8).
URA (Unit of Ripalta Arpina)
The clayey succession is covered by a few-decimeters-thick planar beds of clast-supported sandy gravels sourced by the Oglio River, rich in mica, quartz, and carbonate pebbles (layer 1 in Fig. 8B). This setting is consistent, for its altimetry and petrography, with the base of the LGM Oglio fan in the nearby Franzoni quarry (Ravazzi et al., Reference Ravazzi, Deaddis, De Amicis, Marchetti, Vezzoli and Zanchi2012) (Fig. 7). Therefore, these gravels are ascribed to the lowermost URA deposits, dated to the late MIS 3 at ca. 30 cal ka BP (Ravazzi et al., Reference Ravazzi, Deaddis, De Amicis, Marchetti, Vezzoli and Zanchi2012).
E1 unconformity
The subsequent thin-grained units downlap the URA upper contact. This unconformity is marked as E1 (Figs. 7, 8A, 8B).
UPA (Unit of Pandino)
UPA is well exposed at the base of the Montodine section. It consists of an alluvial-to-palustrine succession starting with a wedge-shaped body of well-sorted laminated sands (layers 2–4 in Fig. 8A, 8B), followed by a laminated planar succession of detrital sandy silts (layers 5–13) to strongly pedoturbated sandy silts with mollusks (Unio sp.) and biochemical carbonates marking palustrine endogenic sedimentation (layer 14). The detrital component gradually decreases upward in favor of viscous organic mud (i.e., palustrine gyttja; layers 16–23), and is eventually much reduced in the topmost sequence of slightly compressed foliated peats (topmost layers from 24 upward, Fig. 8D). Layers 11 and 12 can be clearly traced only in the westernmost part of the exposed section. Layers 2–5 downlap the underlying surface (E1) to gravelly layer 1 and prograde from W and E, respectively. Layers 2–5 occupy the border of a meander formed along the Adda River at the time when it was actively eroding and shaping the left scarp of its postglacial valley (Fig. 7). It can be thus envisaged that a double downlap geometry represents the inner downlap point bar accretion (layers 2–4) and the downlap thinner-grained deposition by the delta of the local groundwater-fed river, prograding from the NE (right) side (layers 8–10) and flowing in the Adda meander very close to the studied site. The gradual increase in organic material (from layer 17 upward) suggests progressive isolation of an oxbow basin, becoming a swamp with organic deposition. According to the 14C age (Fig. 8D), isolation of the oxbow lake occurred ca. 9700 cal yr BP (8731 ± 43 14C yr BP) after a late glacial to Early Holocene phase of alluvial activity. The underlying late glacial phase is consistently dated ca. 11,900 cal yr BP (10,211 ± 50 14C yr BP), Younger Dryas, by logs, which are oriented NE-SW on the riverbed, parallel to the stream current (Figs. 9, 10B trunks T1–T4). Organic accumulation persisted for several millennia in the Holocene oxbow basin, as shown by the age of organic mud entering the fault plane (5230 ± 40 14C yr BP; i.e. ca. 5900 cal yr BP; Fig. 8D), and by pile artefacts fixed vertically into the peat succession, which was still accumulating in the Middle Bronze Age, ca. 3400 cal yr BP (3,205 ± 30 14C yr BP; Fig. 8E; Table 1).
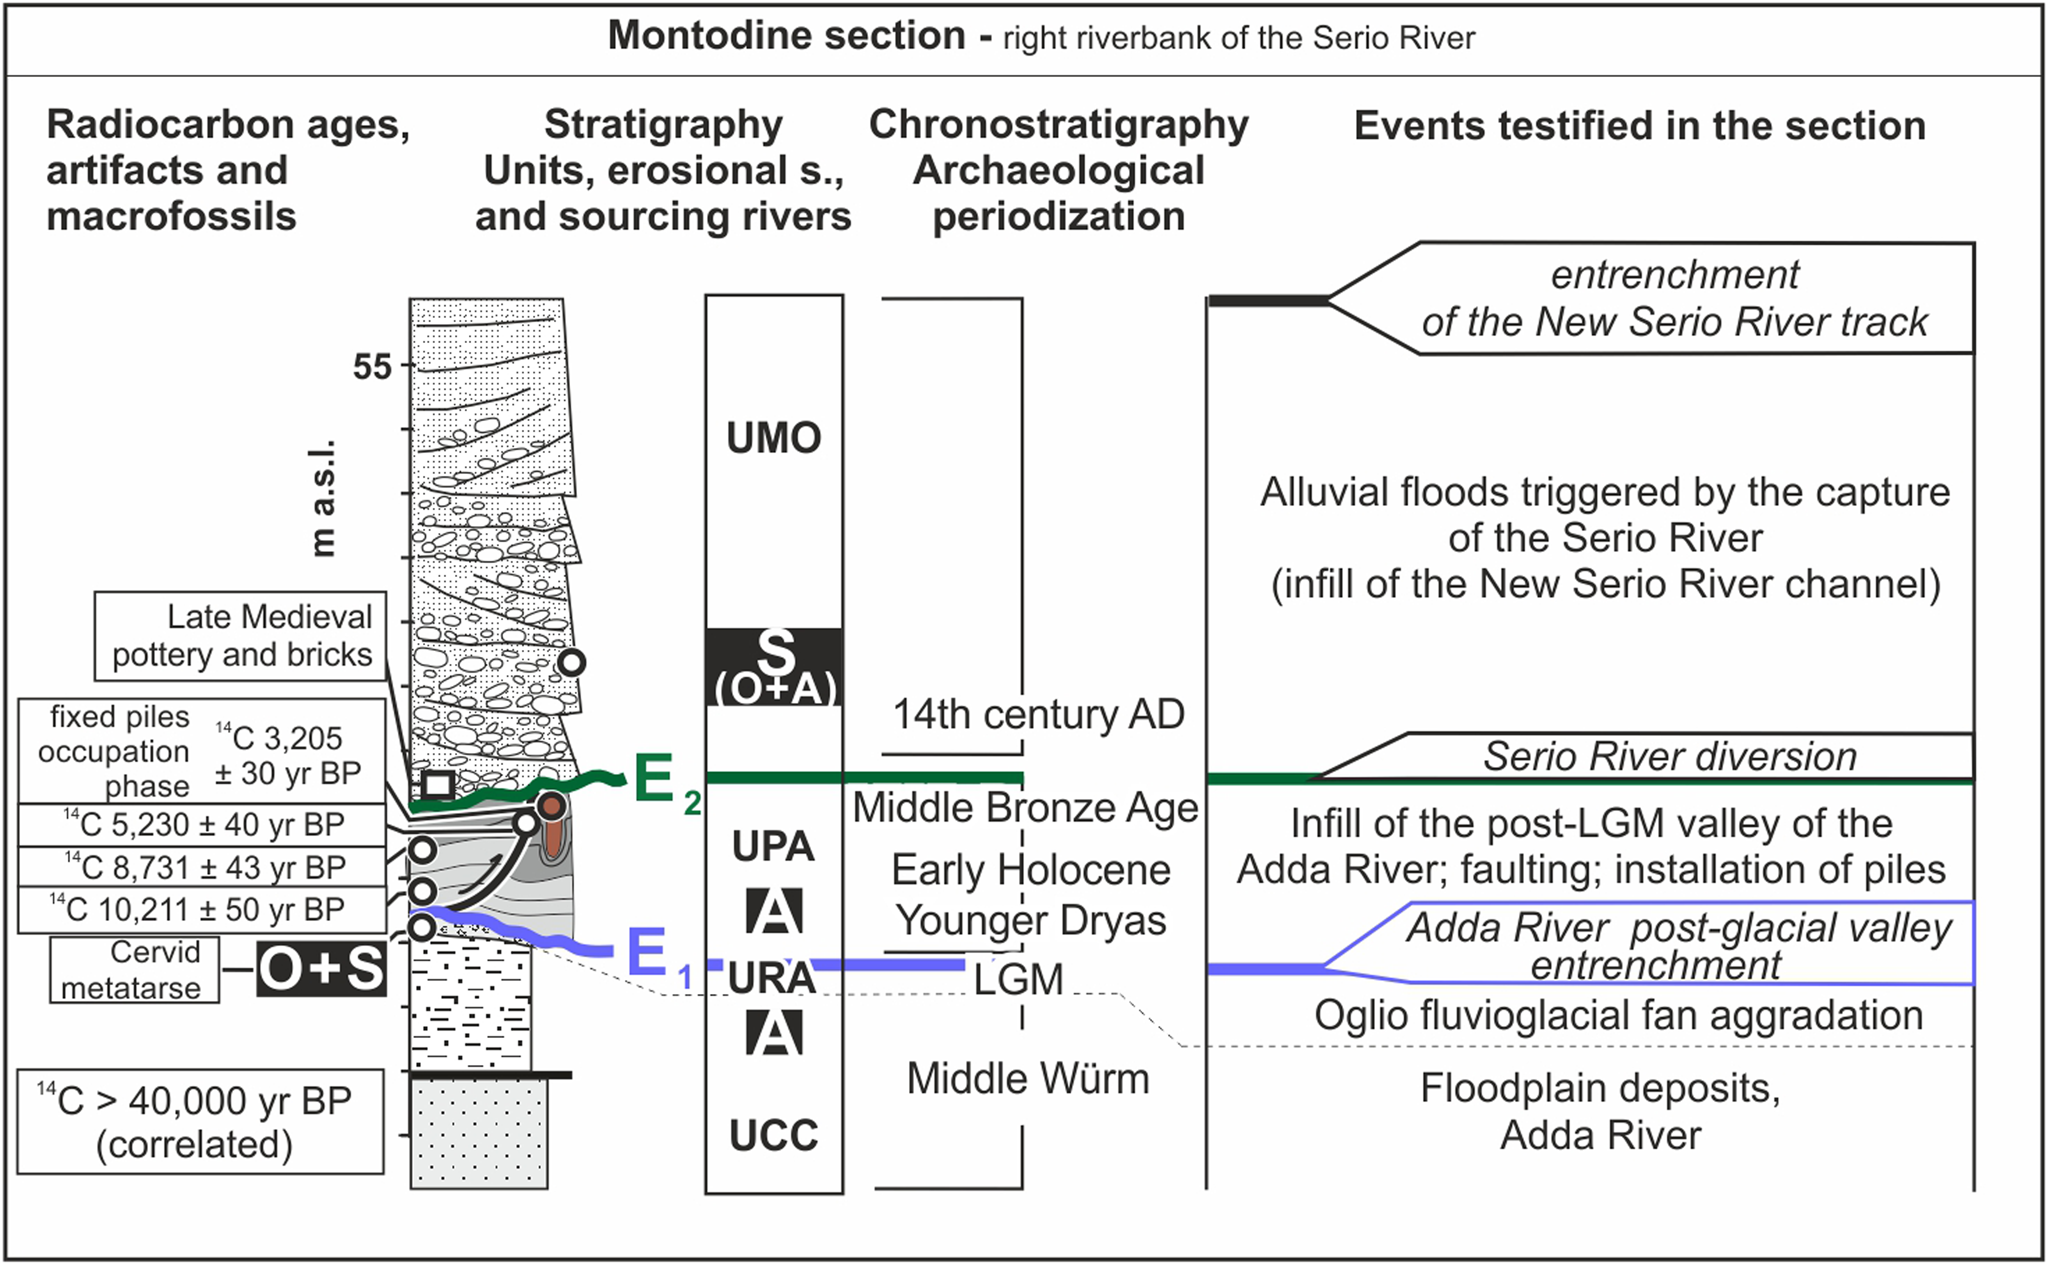
The Montodine stratigraphic section. Summary stratigraphic log showing depositional and erosional events, stratigraphic units and sediment sourcing obtained from sand petrography; acronyms as in previous figures. Modified from Ravazzi et al. (Reference Ravazzi, Deaddis, De Amicis, Marchetti, Vezzoli and Zanchi2012).
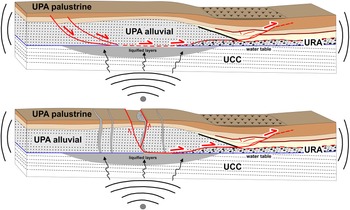
Conceptual, not to scale, sketches of the Montodine outcrop reporting the two main hypotheses on the origin of the analyzed structures. Both hypotheses are related to lateral spreading as surface evidence of seismically induced liquefaction. (A) The thrust fault is the result of sliding/slumping forming in the frontal part of the slide. (B) The thrust fault relates to lateral spreading caused by intensive venting of liquefied sand, inducing lateral compression. Strongly modified, but inspired by Pizzi and Scisciani (Reference Pizzi and Scisciani2012). Acronyms as in previous figures. See discussion in the text.

UMO (Unit of Montodine)
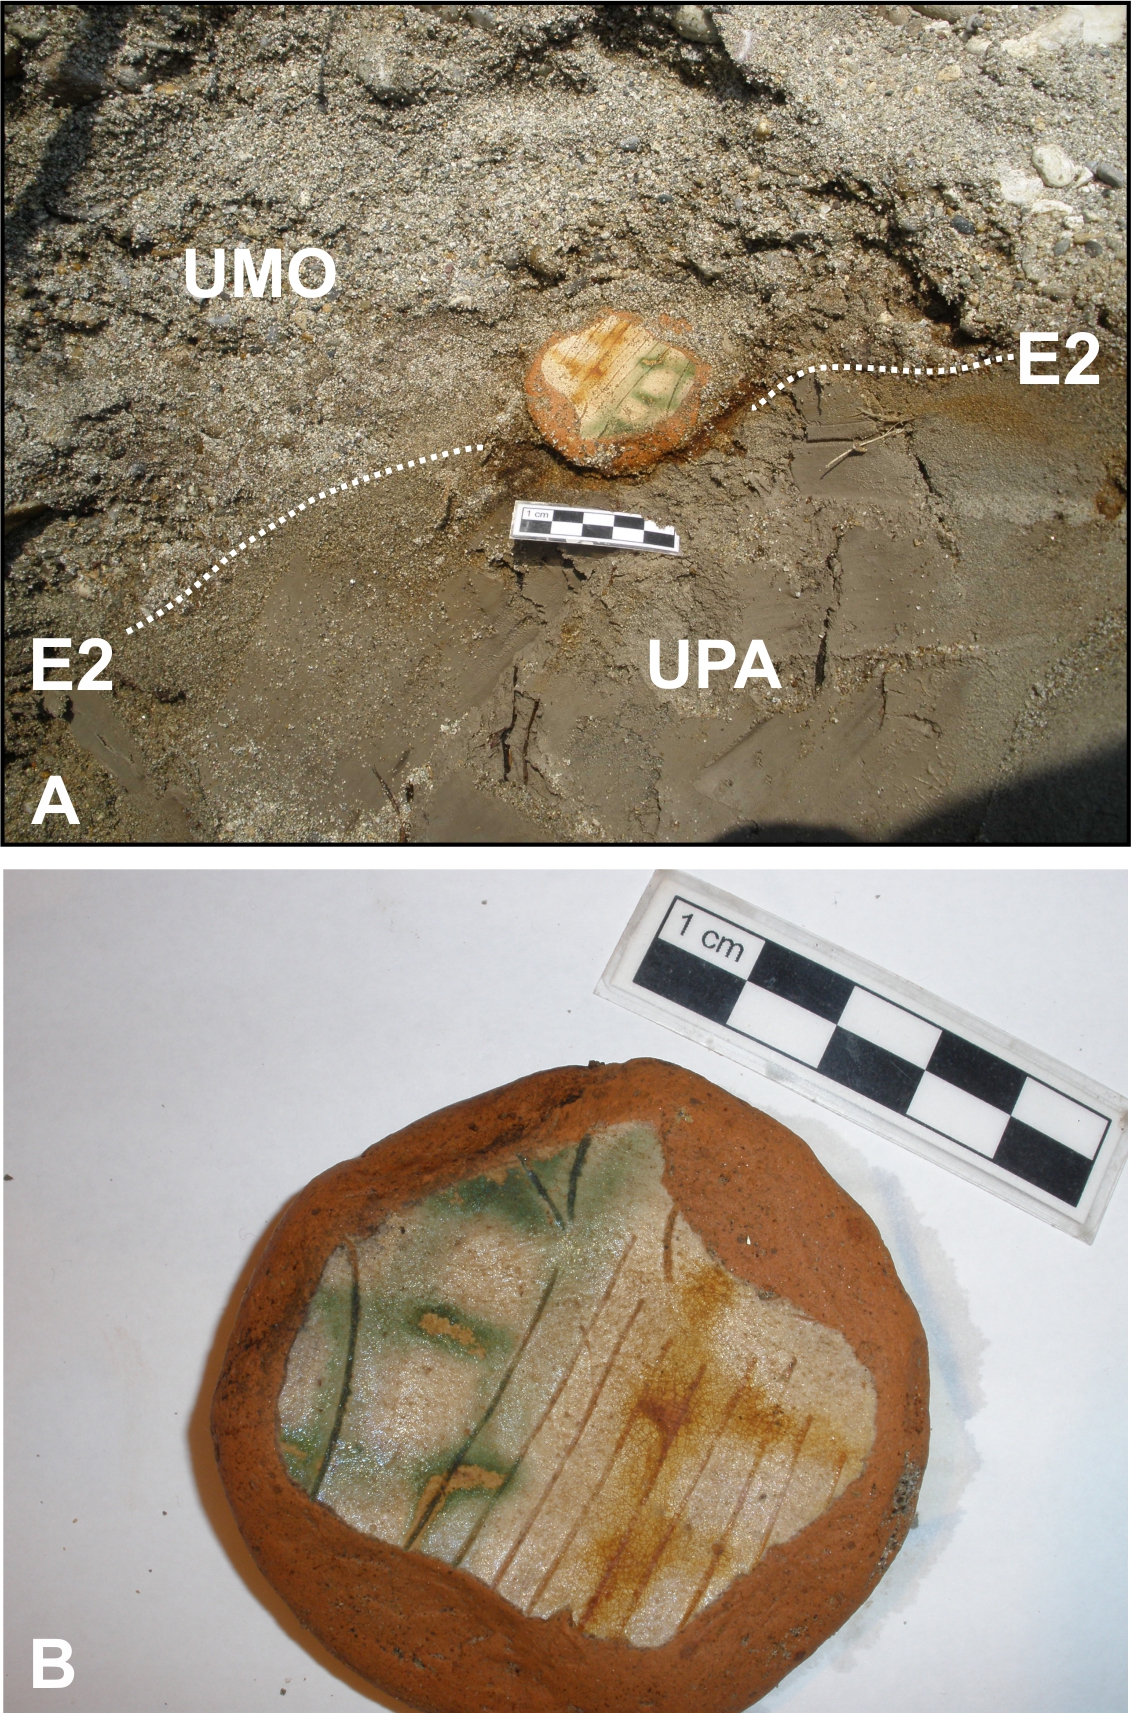
UMO includes a 6 m thick body of coarse gravels to sandy gravels, fining upward, and crudely clinostratified to form a fan body (Figs. 7B, 9). This fan is clearly sourced by the Serio River, showing a complex petrographical signature due to admixing both Adda and Oglio fans after sediment reworking (compare with Fig. 5B), and consisting of pebbles of dominantly limestone, siltstones, and sandstone from the Permian Pietra Simona, red volcanic rocks from the Permian volcanic units (Auccia Vulcanite), and fresh serpentinites. The base of the unit is cross-dated to the fourteenth century AD by the historical record and archaeological evidence. Indeed, late Medieval pottery, identified as graffita padana and dated to the fourteenth century AD, was recovered at the base of the UMO (Supplementary Fig. 3A, 3B). Furthermore, several brick fragments were found in the same stratigraphic position at the very base of the UMO. Their concentration at the base of the lowermost coarse unit of the UMO is best explained by a sudden flood entrenching the riverbanks, reworking the coarse detritus sourced by the Oglio fan, dismantling buildings close to the valley floor.
Given that the Montodine section exists at the mouth of the New Serio valley opening into the Adda River valley (Supplementary Fig. 2), our chronostratigraphic evidence dates the first outbreak of the Serio River through the new path towards the Adda River, in agreement with independent historical documents (Supplemental Material Appendix A).
Description of deformation structures at Montodine
The studied outcrop shows deformation structures of remarkable interest for reconstruction of the geological evolution of the area, even if uncertainties persist about their interpretation. The main structure consists of a low-angle reverse fault, dipping SW, which propagates across the entire outcrop. The exposed trace of the fault plane has a length of ~4 m (displacements across the fault are variable depending on the analyzed section). The fault is a low-angle ramp ending in a flat developed across the less-competent peat layers at the top of the succession (Figs. 7B, 8A, 8B, 8D). The average dip along the ramp is ~25°. A duplex structure occurs in the central part of the ramp, forming a small horst containing layers 11 and 12.
The maximum total displacement is close to 1 m in the lower part of the outcrop, and decreases to ~50 cm in the upper part, where the clayey layers, as suggested by a marked thickening of the layers 11–19, plastically accommodated deformation in the hanging wall.
Synthetic secondary faults formed in the hanging wall, displacing layers 18 and 19 by a few centimeters along a small, high-angle back-thrust. Layer 18 has irregular upper and lower contacts, showing load casts and incipient dishes, which can be related to liquefaction structures due to seismic shaking (Fig. 8C). Small drag folds forming an open footwall syncline occur close to the main fault. Black coatings and plant detritus occur along all the described fault planes, with larger inclusions near the duplex tips (Fig. 8D).
The structures present on the left of trunk T3 are complex and are typical of unconsolidated sediments. Here, the presence of unconsolidated materials soaked in water may have favored hydroplastic deformation that accommodated finite strain without the formation of discrete fractures. Bending of the entire left portion of the outcrop seems to be due to forced folding in connection with the growth of the main thrust fault, which crosscuts the entire described succession. Similar structures resulting from recent surface faulting have been described west of the town of Brescia (Michetti et al., Reference Michetti, Giardina, Livio, Mueller, Serva, Sileo and Fioraso2012) and were related to recent earthquakes affecting eastern Lombardy.
Organic mud and plant macroremains (hazelnuts and wood) are embedded along the fault, the nut giving a radiocarbon age of 5.9 cal ka BP (5230 ± 40 14C yr BP, Fig. 8D, Table 1). The dated materials are unrelated to the exposed peat sequence, which was already compressed at the time of the event. This is shown by the occurrence of a peat wedge faulted on top of the fault plane (Fig. 8D), and by the much older basal age of the gyttja seams of 9.7 cal ka BP (8730 ± 43 14C yr BP, Fig. 8D). The dated hazelnut may come from plant debris incorporated in mud percolating along the fault at the time of the event. It may be argued that the dated debris remained suspended at the sediment/water-column interface for a significant period before the faulting event sucked them down in a flush of liquefied gyttja. The fault structure is no longer recognizable below layer 8, probably due to accommodation of the deformation through granular flow within loose coarse sediment of layer 1. In conclusion, the nut is given as a maximum age for the faulting event.
Discussion
Which origin for the surface thrust fault of Montodine?
The outcrop of Montodine shows a low-angle reverse fault, which affects a succession of terrigenous deposits testifying to the presence of an ancient marshy area developed on canal deposits (Fig. 8). Based on the geological and geomorphological elements combined with radiocarbon dating, it appears that the fault moved after ca. 5.9 cal ka BP, as suggested by the age of the organic matter, which percolated along the fault plane.
In order to explain the origin of this enigmatic structure, we shall consider the following hypotheses:
Anthropic origin
According to this hypothesis, the fault would be related to the disturbance created by emplacement of the Bronze-age piles placed at the base of pile-dwelling structures. These vertical piles (Figs. 7E, 8E) date back to ca. 3.4 cal ka BP (3205 ± 30 14C yr BP). They were positioned after deposition of the organic matter incorporated in the fault dating after 5.9 cal ka BP. The vertical piles have no effects on the layers because their disturbance is extremely limited and extends laterally <10 cm (Fig. 8E). This makes it unlikely that human pile emplacement could be responsible for the fault origin.
Tectonic origin
The geometrical features of the analyzed structures are consistent with a thrust fault of tectonic origin, related to a compressional setting. The fault is a ramp, dying out at the top of the succession, crosscutting the intermediate portion of the outcrop with a significant displacement (50 cm/m). Gentle folding of the hanging wall is possibly consistent with propagation of a shallow thrust. The geometry of the analyzed fault is similar to the attitude of the Apennine thrusts (i.e., it dips to the S-SW and shows an ENE-WSW strike). Nevertheless, in this outcrop the plane disappears in the underlying layers, which consist of loose gravels and sands. Fading of the plane in the lower part of the outcrop contrasts with the possible surface propagation of a deep-rooted thrust, although the occurrence of granular flow in loose gravels masking the fault surface cannot be completely excluded. Moreover, there is no evidence of shallow thrust propagation in all the considered cross sections (Figs. 3, 6). Finally, layer 8 at the base of the UPA seems to be continuous because the thrust fault tips close to wood fragment T3 (Fig. 8A, 8B).
Considering the possibility of a tectonic origin of the fault, the evaluation of the magnitude of a single earthquake causing the observed displacement is very uncertain in our case, given that single-earthquake magnitude is usually scaled using the length of the fault rupture (Wells and Coppersmith, Reference Wells and Coppersmith1994; Leonard, Reference Leonard2014; Caprio et al., Reference Caprio, Tarigan, Worden, Wiemer and Wald2015), which is totally unknown for the considered event. We also have to take into account that strain may be partitioned along different planes close to the surface, as well as all the problems related to its propagation in loose sediments (Livio et al., Reference Livio, Berlusconi, Zerboni, Trombino, Sileo, Michetti, Rodnight and Spötl2014).
Surface effects due to liquefaction-induced lateral spreading
According to this hypothesis, deformation structures that characterize the outcrop may be the expression of secondary surface effects related to seismic shaking. Extensive liquefaction of saturated loose sand sublayers can induce lateral spreading of the unsaturated upper layers, which slide and/or move laterally above the underlying liquefied deposits (Obermeier, Reference Obermeier1996; Youd, Reference Youd2018). Lateral spreading is favored by the occurrence of liquefiable loose terrains, gentle almost flat surface slope (down to 0.3%), and shallow water table, all of which can lead to several meters of lateral displacements. Lateral spreading is a well-known phenomenon and it has been commonly observed during strong earthquakes which caused extensive liquefaction in different tectonic settings (e.g., Olson et al., Reference Olson, Green, Lasley, Cox, Rathje, Bachhuber and French2011; Rodríguez-Pascua et al., Reference Rodríguez-Pascua, Silva, Perucha, Giner-Robles, Heras, Bastida and Carrasco2016; Araujo and Ledezma, Reference Araujo and Ledezma2020). Structures related to lateral spreading are an additional source of structures, which can sum to most diffuse types of seismites related to liquefaction known in the literature (see Montenat et al., Reference Montenat, Barrier, Ott d'Estevou and Hibsch2007, for a comprehensive review).
Widespread liquefaction phenomena occurred during the 2012 seismic sequence of Ferrara (Di Manna et al., Reference Di Manna, Guerrieri, Piccardi, Vittori, Castaldini, Berlusconi and Bonadeo2012) in a comparable stratigraphic and sedimentological context, which can be considered as a natural laboratory to investigate surface structures related to liquefaction. This seismic sequence was characterized by two main events that occurred during May 2012 (20 May 2012 Mw 6.1 and 29 May 2012 Mw 5.9), with a hypocentral depth of 6.3 km and 10.2 km, respectively. The main shocks have been related to the reactivation of two S-dipping blind thrust planes with an E-W strike belonging to the buried thrust front of the Emilian Arc.
Liquefaction at Ferrara was particularly intensive along paleochannels due to favorable conditions related to grain size of the sediments (silt/fine-grained sand) combined with elevation of the groundwater level (Di Manna et al., Reference Di Manna, Guerrieri, Piccardi, Vittori, Castaldini, Berlusconi and Bonadeo2012). Artificial trenching across the Reno River close to the town of Ferrara (Caputo et al., Reference Caputo, Poli, Minarelli, Rapti, Sboras, Stefani and Zanferrari2016) also revealed widespread liquefaction phenomena related to the 1570 AD seismic event that also affected the same area, attesting that this was a common indicator of past seismic shaking in the lowermost reaches of the Po Plain. Similar results of liquefaction triggering have been reported from other floodplain areas (e.g., the lower countryside of Mantova; Norini et al., Reference Norini, Aghib, Di Capua, Facciorusso, Castaldini, Marchetti and Cavallin2021).
In particular, based on the dimensions of the observed structures and all previous considerations, we suggest two main hypotheses relative to the origin of the Montodine fault. (1) The thrust faults may represent the effects of superficial sliding of the palustrine sediments infilling an abandoned meander. Small thrust faults and gentle folds, strongly resembling slump structures, formed along the frontal part of the sliding mass in response to local compression induced by the weight of the sliding materials. Because the area was characterized by a very weak topographic gradient (slope <1°), seismic shaking produced by a near source is required for triggering widespread liquefaction taking to lateral spreading and subsequent gravitational instability (Fig.10A).
Folds and faults with similar liquefaction structures have been observed in different tectonic contexts and can be considered as a particular case of the seismoslumps (described by Montenat et al., Reference Montenat, Barrier, Ott d'Estevou and Hibsch2007), in which brittle structures were formed. Similar structures also have been observed in recent fine-grained lacustrine sediments in Kashmir, where they have been interpreted as an effect of seismic shaking (Ali and Ali, Reference Ali and Ali2018) and in the Catania plain, in close connection with large sand dikes (Pirrotta et al., Reference Pirrotta, Barbano, Guarnieri and Gerardi2007; Guarnieri et al., Reference Guarnieri, Pirrotta, Barbano, De Martini, Pantosti, Gerardi and Smedile2008). (2) Following more strictly the ground effects caused by the seismic sequence of the 2012 Ferrara earthquakes, Pizzi and Scisciani (Reference Pizzi and Scisciani2012) observed the concomitance of extensional and contractional structures due to widespread liquefaction. In order to explain the occurrence of compressional structures enhanced by surface bulging, which accompanied the most common tensional fissures and vent alignments, these authors suggested the occurrence of lateral spreading induced by extensive vertical venting of liquefied sand up to the surface, affecting paleo-levee deposits. Abundant sand blows, forming graben-like structures along the vent, induced a lateral compression forming reverse faults along the most superficial layers consisting of levees deposits unable to liquefy above the water table.
It is possible that a similar mechanism was also active during liquefaction recorded in our case study, in which the fine-grained silty sands forming the wedge exposed on the left side of the outcrop (Fig. 10B) were subjected to lateral spreading. We also consider that the same process may have contributed to the formation of contractional structures recorded in the Catania Plain (Pirrotta et al., Reference Pirrotta, Barbano, Guarnieri and Gerardi2007; Guarnieri et al., Reference Guarnieri, Pirrotta, Barbano, De Martini, Pantosti, Gerardi and Smedile2008).
Seismic-induced liquefaction as a possible origin for the Montodine Holocene thrust fault
Among the suggested hypotheses, we favor the third one—deformation structures represent a secondary effect of seismic shaking, triggering the sliding of a large mass of sediments or, alternatively, causing compression due to lateral spreading induced by surface venting of liquefied sand. Due to the dimensions of the trenched outcrop and to the deposition with an erosional base of the Serio Unit on top of the deformed layers, we were unable to obtain a complete set of observations. In fact, in the case of a sliding mass, we should record an asymmetric pattern with normal faults in the rear and reverse faults and folds in the front of the structure. Following the other hypothesis, we should expect to observe a symmetric pattern with conjugate normal faults along the vertical vent and symmetric reverse faults along the external portions (Fig. 10).
Even though blind thrusts are well documented at depth, the possibility that an exposed fault may be the surface expression of a deep thrust is unlikely. Seismic sections and 3D reconstructions of the Quaternary successions show no evidence of surface thrust propagation near Montodine (Fig. 6a).
The origin of the studied structures is consistent with the local tectonic framework because the Montodine site is located above the area of interaction between the Alps and the Apennines. Recent tectonic activity in this area is indicated by the buried fold-and-thrust structures of Ripalta and Soresina, which were active until at least the Pliocene and the Pleistocene, respectively (Fantoni et al., Reference Fantoni, Bersezio and Forcella2004). In addition, evidence of significant continuous deformation in the area during the Pleistocene comes from the Romanengo structure (Bresciani et al., Reference Bresciani and Perotti2014), located ~20 km to the N-NE of Montodine (Fig. 3). Here, continuous uplift between the Pliocene and Holocene results from the activity of a buried thrust, alternatively interpreted as a South-alpine, out-of-sequence, south-verging thrust (Fantoni et al., Reference Fantoni, Bersezio and Forcella2004; Toscani et al., Reference Toscani, Bonini, Ahmad, Di Bucci, Di Giulio, Seno and Galuppo2014; Maesano et al., Reference Maesano, D'Ambrogi, Burrato and Toscani2015), or as a north-verging Apennine structure crosscutting the inactive Southern Alps frontal thrusts (Bresciani and Perotti, Reference Bresciani and Perotti2014). These authors also described the occurrence of liquefaction-induced seismites in the middle Pleistocene successions exposed at Romanengo, which also confirm the occurrence of important seismic shaking in this area during the past. Considering the reconstructed location of the epicenter of the 1802 earthquake (Albini and Rovida, Reference Albini and Rovida2010), they also suggested a possible causative relation with the tectonic activity of the Romanengo High, giving an estimated Mw 5.7. Additional evidence of seismic activity comes from the Caviaga area, showing the occurrence of two Mw > 5 earthquakes in the last two centuries.
Considering the 2012 seismic sequence of Ferrara as a natural laboratory for directly testing parameters related to liquefaction, it was observed that liquefaction occurred only during the two main events (Di Manna et al., Reference Di Manna, Guerrieri, Piccardi, Vittori, Castaldini, Berlusconi and Bonadeo2012). A maximum distance of 27 km from the epicenters was recorded for significant liquefaction, but no liquefaction occurred during the other events with a lower magnitude. In addition to indications obtained from the literature (e.g., Grandori et al., Reference Grandori, Perotti, Tagliani and Cakmak1987; Galli, Reference Galli2000), these data pose a real minimum value for the intensity and epicentral distance of the possible seismic event related to the Middle Holocene fault of Montodine. Following these indications, active faults underlying the Romanengo High can be the primary candidates for the seismic source, together with the Emilian frontal thrust structures of the Caviaga area (Caciagli et al., Reference Caciagli, Camassi, Danesi, Pondrelli and Salimbeni2015). Indeed, belts of strongly compressed, deformed peat layers of Pleistocene age were recently exposed after recent entrenchment along the Adda River bed south of Lodi (Fig. 7A, Supplementary Fig. 1n.2), suggesting tectonic uplift and deformation active in the last 50 cal ka BP (CNR, 2017).
CONCLUSIONS
The study of an enigmatic and previously unknown Holocene faulted section exposed at Montodine in the Po Plain was carried out through a combined stratigraphic, structural, and geomorphologic approach. The section rests over fine-grained silty sands (UCC) deposited during the MIS 3 in the sedimentary domain of the Adda River. The deformed unit is rooted in sandy gravels (URA) and affects the overlying alluvial to palustrine record, spanning most of the Holocene (UPA). The planar fine-grained layers forming the UPA unit are displaced by a thrust fault with a net displacement between 0.50 and 1 m. The radiocarbon ages of organic matter emplaced along the fault at 5.9 cal ka BP and of piles fixed after the fault formation at 3.4 cal ka BP during the Bronze Age constrain the fault movement in the Middle Holocene. Flood deposits related to the late Medieval diversion of the Serio River, whose triggering factors remain speculative, unconformably covered the deformed succession.
Based on analyses of the subsurface structures of the area obtained from available seismic sections and 3D reconstruction of Quaternary deposits at depth, we were unable to identify shallow thrust faults active below the studied site during the Quaternary. For this reason, excluding any possible anthropic effect, we suggest that the observed thrust fault may represent a secondary surface effect of seismic shaking, related to gravitational instabilities that possibly were connected with lateral spreading phenomena following extensive liquefaction.
We suggest two main hypotheses: (1) thrust faults formed because of compression in the frontal part of a sliding/slumping mass; and (2) horizontal compression induced by intensive venting of liquefied sediments along a vertical vent caused the formation of thrust faults laterally in response to lateral spreading of the unliquified sediments above the water table.
Due to the restricted dimensions of the studied outcrop, we were unable to discriminate between the two possible solutions. Additional information would be required to better define the different deformation pattern and processes resulting in the two cases.
From a direct comparison with the well-studied effects of the 2012 Ferrara sequence, we know that a minimum Mw 5.9 can be responsible for widespread liquefaction and that it occurred up to 27 km from the epicenters. Considering the recent seismicity of this portion of the Po Plain, the only significant earthquakes occurred in the nearby area of Soncino at the beginning of the nineteenth century (1802). This event, related to possible activity of the deep blind thrust flooring the Romanengo high (Albini and Rovida, Reference Albini and Rovida2010; Bresciani and Perotti, Reference Bresciani and Perotti2014), may be related to the same potential source of seismic shaking for this prehistoric event. However, available data from the area of Cavaglia directly to the south of Montodine (Caciagli et al., Reference Caciagli, Camassi, Danesi, Pondrelli and Salimbeni2015) also record two significant Mw 5.2 and 5.3 events in the recent past that were related, with relatively deep seismic structures, and may be considered as an alternative seismic source. Based on this evidence, we suggest that the area of Montodine was struck in the Middle Holocene by an earthquake with a magnitude at least comparable with the ones of the two main shocks that hit the Ferrara area in 2012, thus exceeding the maximum intensity estimated in the area for the Cavaglia and Soncino events.
This study demonstrated the suitability of multidisciplinary stratigraphic and structural analyses of Quaternary outcrops in understanding the recent evolution of the Po Plain, giving important constraints on the paleoseismicity of the area and stressing the importance of the role played by liquefaction also in the recent past. An interdisciplinary approach, such as the one followed in this work, based on the integration of multiscale and multisource data, warrants extensive application to geological mapping of these areas, and especially in the microzoning and seismic hazard assessment of these highly inhabited regions.
Supplementary Material
The supplementary material for this article can be found at https://doi.org/10.1017/qua.2021.68
Acknowledgments
This paper is a contribution to the CNR-IGAG research line DTA.AD001.112—Quaternary Paleoenvironments and Palaeoclimate. Eliana Poli and an anonymous reviewer are warmly thanked for constructive and stimulating suggestions. We are deeply indebted to the Senior Editor Prof. Lancaster and the Associate Editor Prof. Seong for their kind help during the entire review process.
Financial Support
This work benefited from financial support from Banca Popolare di Crema for radiocarbon dating and by ATE Grants from the University of Milano Bicocca by one of the authors (AZ) and it is an outcome of Progetto Dipartimenti di Eccellenza, funded by MIUR 2018-2022.


 Open access