


Over the years, the topic of sustainability has skyrocketed in importance and urgency and occupies a key place in international policy discussions. According to Google Ngram (American English), mentions of the word ‘sustainability’ rose 25 times, from 0.0004% of all words in 1980 to 0.001% in 2019. Survey data over the past few decades have documented an increasing concern for the environment around the world and an increasing willingness by individuals to make sacrifices for sustainability (e.g., Leiserowitz et al., Reference Leiserowitz, Kates and Parris2006).
Since many people consider it a human responsibility to promote sustainability, support for sustainability has become a new moral value. It competes with many other values and preferences for the attention of individuals and institutions. As interest in sustainability has increased, so has its scope, moving, for some, from a preservation of the earth’s environment to a very broad maximization of wellbeing and equality.
In this article, we adopt a focus on environmental sustainability. Morelli (Reference Morelli2011), after discussing many prior definitions of environmental sustainability, defines ‘environmental sustainability’ as ‘a condition of balance, resilience, and interconnectedness that allows human society to satisfy its needs while neither exceeding the capacity of its supporting ecosystems to continue to regenerate the services necessary to meet those needs nor by our actions diminishing biological diversity’ (p. 6). Politically viable sustainability programs need to be designed, funded, and promoted to be consistent with public attitudes if the public is to bear the cost, risks, and inconveniences of the fix (Heberlein, Reference Heberlein2012). Technology, by reducing the inputs required to produce outputs valued by consumers, has a role to play in improving sustainability, but relevant technologies require public acceptance and adoption, as discussed in the context of food by Lusk et al. (Reference Lusk, Roosen and Bieberstein2014).
There is a considerable literature now from the social science perspective on sustainability, including a full length solo authored book by Heberlein (Reference Heberlein2012), Handbook of Sustainability and Social Science Research (Leal-Filho et al., Reference Leal-Filho, Marans and Callewaert2018), and many scales to measure sustainability knowledge, attitudes, and behaviors (reviewed by Cruz and Manata, Reference Cruz and Manata2020). A major focus of research has been on the promotion of sustainable behaviors; how values, attitudes, and beliefs can motivate behavior change (e.g., Aride and Pamies-Pallise, Reference Aride and Pamies-Pallise2019); and how the behavior focus can also be integrated with the study of sustainability-related cognitions (e.g., reviews by Leiserowitz et al. Reference Leiserowitz, Kates and Parris2006; Ruby et al., Reference Ruby, Walker and Watkins2020; Zwickle and Jones, Reference Zwickle, Jones, Filho, Marans and Callewaert2018).
Our focus here is different from the thrust of most cognitive-behavioral research on sustainability. We are not directly concerned with behavior, but rather with attitudes and beliefs that group together and influence sustainability attitudes and beliefs. Some of these associations may be non-optimal, in that they may interfere with the progress of society toward a more sustainable future, insofar as they limit the adoption of technologies that can improve sustainability. In this research, we measure some of these attitude/belief groups and indicate their psychological and empirical link to sustainability. We provide evidence, based on a prominent belief in a causal link between natural and sustainable, for the general idea that there is a tendency to believe in a causal link between concepts or policies that have matching valence. Given the polarized nature of modern discourse around sustainability, we also consider how natural, technology, and sustainable beliefs and attitudes vary between Democrats and Republicans.
Political ideologies are salient in both sustainability discourse and concerns about food and food systems (Lusk, Reference Lusk2012). Norman Borlaug (Reference Borlaug2007), the ‘father’ of the technology-based green revolution, notes that there are shortcomings of a broad belief that natural is good and a preference for natural solutions. For example, organic farming is commonly believed to be better for the environment due to its use of fewer or no ‘chemicals’. Recent research, however, has suggested that given organic farming’s significantly lower crop yields, considerably more land is required to grow the same amount of food than with intensive agriculture (Balmford et al., Reference Balmford, Amano, Bartlett, Chadwick, Collins, Edwards and Eisner2018). In order to feed the world’s population, a fully organic farming system would require claiming vast tracts of additional land for agriculture, much of which would be taken from forests and harm the environment (Balmford et al., Reference Balmford, Amano, Bartlett, Chadwick, Collins, Edwards and Eisner2018). One study showed that organically farmed produce in Sweden significantly increased negative climate impact, with organic peas having a 50% bigger negative impact than conventionally farmed peas and organic Swedish winter wheat having a 70% bigger negative impact than conventionally farmed counterparts (Searchinger et al., Reference Searchinger, Wirsenius, Beringer and Dumas2018). A recent book by Hannah Ritchie (Reference Ritchie2024) makes a very strong case for the major role of technology in promoting sustainability over recent decades and for a high likelihood that this major influence will continue.
That being said, while organic farming may be worse for the environment on a large scale due to increased land usage, its lack of synthetic pesticides and synthetic toxin accumulation in the soil may be better for local environments around farms, complicating the discussion about best sustainability practices (Searchinger et al., Reference Searchinger, Wirsenius, Beringer and Dumas2018). Two meta-analyses of organic farming and sustainability links came to opposite conclusions, illustrating how exemplar selection and sustainability criteria may influence conclusions about complex systems (Komatsu and Rappleye, Reference Komatsu and Rappleye2024).
By rejecting genetically modified food (referred to here as GMO) crops, organic systems lose the GMO advantages of reducing the necessity for tilling the soil and reducing the level of herbicides and insecticides. Models by Balmford et al. (Reference Balmford, Amano, Bartlett, Chadwick, Collins, Edwards and Eisner2018) suggest that even accounting for the negative environmental impacts of high-yield farming, the net sustainability of these practices, across different types of farming, may be positive (Ritchie, Reference Ritchie2024).
There is good reason to believe that prospects for sustainability can be enhanced in a major way by advances in technology. But pro-technology and pro-natural seem to be in opposition, at least to some degree, and this opposition may decrease the prospects for public support for some important technological pro-sustainability activities. One reasonable argument for a natural–sustainable link is that the natural earth environment was believed to be sustainable (absent extreme events such as continental drift, meteor impacts, and volcanic eruptions), and the problem arose when technology facilitated population growth and polluted the environment. However, it could well be that just as technology compromised sustainability, it could now advance to neutralize its initial effect, with solar panels as an apt example.
In writing up the present paper, we discovered a somewhat parallel line of research, which established a clear link between perceived health and perceived sustainability. Three studies in 2016 establish a perhaps implicit health–sustainable link by showing that people’s ratings of a set of foods for environmental friendliness and healthiness are substantially positively correlated (Egeler, Reference Egeler2016; Lazzarini et al., Reference Lazzarini, Zimmermann, Visschers and Siegrist2016; Verain et al., Reference Verain, Sijtsema and Antonides2016). In the latter study, Swiss adults rated a set of 30 high-protein products on perceived environmental friendliness and on healthfulness. The subjective ratings were highly positively correlated, but objective measures of the environmental friendliness and healthiness of the same set of products were not significantly correlated. Interestingly, an organic label improved ratings on both dimensions. Using a more real-world cafeteria situation, where German adults rated the environmental friendliness and healthiness of whole meal options, Sproesser et al. (Reference Sproesser, Arens-Azevedo and Renner2023) reported the same pattern of results as Lazzarini et al. (Reference Lazzarini, Zimmermann, Visschers and Siegrist2016), with a substantial correlation between perceived levels of health and sustainability, but not between actual estimated levels. Based on this, Sproesser et al. (Reference Sproesser, Arens-Azevedo and Renner2023) suggested the existence of a ‘healthy=sustainable’ heuristic. Relatedly, Jo and Lusk (Reference Jo and Lusk2018) found evidence of a ‘healthy=tasty’ heuristic.
In our study, we proposed to explore the perceived relations among natural, technology, and sustainability in an American sample, refine this by analysis across the political spectrum, and add some data from Britain. We expected to confirm a pro-natural–pro-sustainability link. We believe this linkage, if established by our results, may be related to the ‘affect heuristic’ (e.g., Finucane et al., Reference Finucane, Alhakami, Slovic and Johnson2000), such that 2 positive features (natural and sustainable) have a tendency to be perceived as positively correlated and to be causally related. This issue will be treated in more detail in Section 3. Most critically, given our belief that the power of natural manipulations to improve sustainability is less than the power of technology, we will examine and evaluate justifications for natural–sustainable and technology–sustainable linkages provided by our respondents across a number of policies.
1. Study 1
1.1. Method
This study was informed by an unpublished pilot study by the authors with 200 American participants.
In the full study reported here, in 2020, we recruited participants from Prolific, who completed the survey online via Qualtrics. The sample size was set at 300 American adults, aged 25–75 years. Participants were balanced for political party affiliation (half Republican, half Democrat) and were specified to be distributed evenly across age. This study was approved by the University of Pennsylvania Institutional Review Board.
Demographics. At the end of the questionnaire, participants reported their age, gender, highest level of education, religion, religiosity (5-point scale from 0 not at all to 4 extremely), and social class (1 lower, 2 lower middle, 3 middle, 4 upper middle, 5 upper).
Political affiliation and beliefs. Because political positions are a major variable in this study, we collected 3 different measures.
Participants indicated their current political party registration (Democrat, Republican, Independent, other, not sure, none). They also indicated their ‘political stance on social issues’ and their ‘political stance on economic issues’ on a 7-point scale (−3 very conservative, −2 conservative, −1 somewhat conservative, 0 neither conservative nor liberal, 1 somewhat liberal, 2 liberal, 3 very liberal). These 2 items correlated at r = .86, so we averaged them and reversed the scores to form the new variable Conservative Political Orientation.
To measure the endorsement of traditional Republican values, participants were asked ‘To what extent do you support or oppose each of the following for the United States?’ using a 7-point scale (ranging from −3 strongly oppose to 0 neither support nor oppose to 3 strongly support). The 4 policies were: decreased access to abortion, increased military spending, increased gun control (reverse-scored), and decreased regulations on private industry. We created a mean score of these 4 items (hereafter referred to as Republican Values), which had acceptable internal consistency (α = .78). The mean for this score was −0.54, fairly close to the neutral score of 0. These 2 measures of political ideology were significantly and strongly correlated (r = .76, p < .001).
Support for initiatives and perceptions of their effect on sustainability. Participants read the following definition of environmental sustainability: ‘For the purposes of this study, we will refer to sustainability as it relates specifically to the realm of environmental sustainability; namely, the practice of responsibly interacting with the environment to avoid depletion of natural resources and to preserve the natural world, thus allowing for long-term environmental quality. In other words, meeting the needs of the present without compromising the ability of future generations to meet their needs.’ Respondents then checked a box to indicate: ‘I have read and understand the above.’
There are 2 sets of core items for the survey. The first set were 18 items, all framed by the following question: ‘To what extent do you support or oppose each of the following for the United States?’, using a 7-point scale (scored from −3 strongly oppose to 0 neither support nor oppose to 3 strongly support).
Of these 18 items, 4 were to determine support for traditional Republican Values (described above) and 14 were specifically related to sustainability, although the word was never mentioned. Eight of these items used in the present analysis are listed in Table 2 (the other 6 items are listed in the footnotes to Table 2). Following the set of 18 items rated for opposition/support, we included a second set of 14 items (assessing the 18 original items except the 4 traditional Republican items) that had the exact same descriptions, but the rating scale was different. We included an introduction to ensure our question would be clear to participants: ‘All of the following ask for judgments about the effect of different actions on environmental sustainability in the United States. Rank the following items on a scale of 1–7 or 0 if you don’t know enough to make the judgment (this could be either because you don’t know much about the relation of this item to sustainability or because you think the question is too vague). You may believe some items are both good and bad for sustainability. Please then choose the overall effect. We are NOT asking about whether you are in favor of this, but solely its impact on environmental sustainability.’
The question asked for each item was: ‘Do you think (insert corresponding item from first part) is good or bad for environmental sustainability?’
The rating scale was: 1 very bad, 2 bad, 3 slightly bad, 4 neither good nor bad, 5 slightly good, 6 good, 7 very good, and 0 don’t know. The 0 score was recoded as a missing value, and the 1–7 scale items were recoded as −3 to +3. In open-ended items, after respondents registered their responses to each of 4 of the 14 items, we asked them ‘In a few sentences, please explain why you think (“organic farming, genetically modified foods, that replacing fossil fuels with safe nuclear power, using computer technologies to increase crop yield”) is/are good or bad for environmental sustainability.’ Before examining these open-ended responses, we decided to only analyze organic and GMOs.
Support for environmental sustainability. We measured support for environmental sustainability with a single item.
‘In my personal value system, environmental sustainability would rank as:
-
1. The most important value; 2. One of the most important values; 3. An important value; 4. A somewhat important value; 5. A slightly important value; 6. Not an important value at all.’
We reverse-scored this variable (pro-sustainability) and converted it to 6 equally spaced values between 0 and 1. The mean (and median and mode) of this variable was 0.60 (SD = 0.23): ‘An important value.’
1.2. Results
We did not eliminate any respondents in the presentation of results. Only 5 subjects completed the questionnaire in less than 4 min, and no subjects gave the same numerical response to the first 20 scaled questions. We adopt a critical significance level of p < .01, 2-tailed (Table 1).
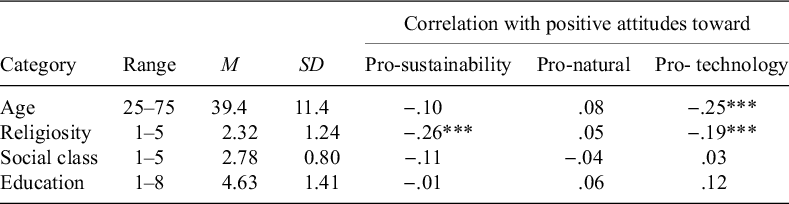
Study 1: Demographic factors in relation to positive attitudes toward sustainability, natural, and technology

Note: For an n of 300, a correlation of .15 or higher is p < .01, 2-tailed; a correlation of .19 or higher is p < .001, 2-tailed.
Demographics. The final sample included 154 females, 144 males, and 2 people with other identities. At the time of data collection, 136 participants identified as Democrats, 146 as Republicans, and 18 did not identify as associated with either party. Further demographics are presented in Table 1. The correlations of variables of interest with the demographics in the table are discussed in later sections of the results.
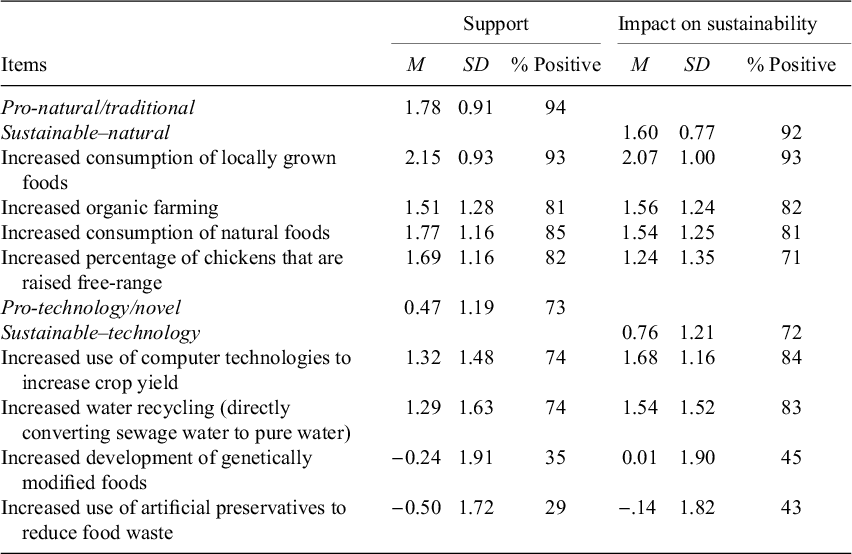
Support for policies. A factor analysis of support for the 14 policies (with a promax rotation) yielded 3 factors with Eigenvalues greater than 1. The first 2 factors corresponded to natural/traditional and technology/novel, respectively. We decided to focus completely on these items. The exact text for the 8 items (4 natural, 4 technology) that we finally used is listed in the left column of Table 2, along with relevant statistics for each item. Of these items, the strongest support was for ‘increased consumption of locally grown food’ and ‘increased consumption of natural foods’. There was net opposition (average below zero) to 2 of the 8 policies: ‘increased development of genetically modified foods’ and ‘increased use of artificial preservatives to reduce food waste’.
Level of support for 8 policies and perceptions of their impact on sustainability

Note: Support items: ‘To what extent do you support or oppose each of the following for the United States?’ on a 7-point scale from −3 strongly oppose to 3 strongly support. Impact on sustainability items: ‘Do you think it is good or bad for environmental sustainability?’ on a 7-point scale from −3 very bad to 3 very good.
Policy impact on sustainability. We examined the same 8 policy items as noted in the above section.
Items with the strongest sustainability-effect beliefs, in terms of percent positive (in decreasing order), were an increase in locally grown foods, use of computer technologies to increase crop yield, water recycling, organic farming, and consumption of natural foods. Sustainability scores were lowest for increased artificial preservatives and development of GMOs (Table 2).
The first factor of the 14 policy items was clearly related to pro-natural/traditional policies and had 5 items loading over .50. The first 4 had clear relevance to natural (the first 4 items in Table 2), but the fifth item (increased number of small family farms [about 100 acres]) had a more distant link, and we decided to exclude it from the factor.
Two of the items, increased free-range chickens and increased locally grown foods, are not directly about natural, although both represent the way things used to be (one feature of natural). Correlations of free-range chicken and local with the 2 items, natural and organic, ranged between .40 and.60, with a mean of .54, similar to the correlation between natural and organic (.55). The mean of the 4 natural/traditional items constituted the pro-natural score. This had a mean score of 1.78 on a −3 to 3 scale, indicating a substantial pro-natural attitude in the sample. This finding is strongly reinforced by the fact that 94% of the pro-natural scores were positive, and even for the least favored item, organic food, 81% of scores were positive.
The second factor included 7 items loading >.5 and clearly corresponded to pro-technology/novel. Three of these items, ‘increased replacement of fossil fuels with safe nuclear power’, ‘decreased meat consumption’, and ‘decreased family size, in terms of number of children had by families, on a worldwide basis’, were not clear examples of using technology to make food systems more sustainable and were excluded from the factor. The remaining 4 items, ‘use of computer technologies to increase crop yields’, ‘water recycling’, ‘development of genetically modified foods’, and ‘use of artificial preservatives to reduce food waste’, were averaged to form the pro-technology score. The mean score was 0.47 on a −3 to 3 scale, indicating a modest pro-technology attitude in the sample. This finding is reinforced by the fact that 73% of the pro-technology scores were positive.
Pro-natural and pro-technology attitudes were negatively correlated (r = −.13, p = .02, notable but not meeting our criterion for significance). Pro-natural correlated positively (r = .35, p < .001) with pr-sustainability, as expected. Pro-technology also correlated positively with pro-sustainability (r = .30, p < .001), which we did not anticipate.
The five excluded policies were: ‘decreased consumption of meat, increased number of large family farms (about 1,000 acres), increased number of large corporate farms (about 1,000 acres), increased number of small family farms (about 100 acres), increased replacement of fossil fuels with safe nuclear power’.
For the 4 natural/traditional items, the mean correlation between the support and impact on sustainability scores is .57 (range .49 to .63). For the 4 technology/novel items, the mean correlation between the support and impact on sustainability scores is .67 (range .55 to .75). The combined pro-natural attitudes score correlates .72 with the combined score for natural policy impact (sustainable natural). The corresponding 2 combined scores for technology (pro-technology and sustainable–technology) also correlate at .72. It makes sense that overall, support for a policy goes positively with beliefs about specific positive effects of that policy, but this need not be true.
We argued in the Introduction section that natural actions may on average have a negative effect on sustainability. However, 82% of participants believe the combined 4 natural/traditional policies have a mean positive effect on sustainability. This disparity justifies examining each of the 4 natural policies separately.
Ninety-three percent of respondents were in favor of increasing local food consumption, and 93% also thought it improves sustainability (the highest value, Table 2). The pro-local score correlated .58 with the score for positive effects of local on sustainability. Local foods are sometimes more sustainable because of the reduced transportation costs. However, local origin and short supply chains are only one of several factors influencing sustainability, and transport costs account for less than 10% of total costs (Stein and Santini, Reference Stein and Santini2021). One can easily imagine situations in which highly efficient production of a food at some distance is more sustainable, including transportation, than inefficient local production. That is, local food can be unsustainable if production occurs in areas where more land, labor, or fertilizer is required to achieve the same level of output as another location. Nonetheless, for local foods, respondents provided a reasonable, consistent set of responses.
The case for free-range chickens was quite the opposite. Eighty-two percent of respondents supported increasing this, and 71% thought it increases sustainability. It is hard to imagine how providing chickens free-range would increase sustainability: much more land is involved, and it is much harder to manage. It is easy to understand how concerns for chicken welfare would promote supporting the practice, but this would be in spite of its negative effects on sustainability. Many ‘good’ things have some negative effects, but people may prefer not to face this inconvenient fact (Section 3).
Support for the 2 ‘core’ natural policies, increasing the consumption of natural foods and increasing organic farming, was high, as were beliefs that they promote sustainability. There was strong support for organic farming (81% positive), with 82% believing it promotes sustainability. We have written reasons for the 221 respondents who believe increasing organic farming promotes sustainability (1 to 3 scores) and 21 people who thought organic farming is detrimental to sustainability (scores of −1 to −3). The remaining participants either indicated no effect of organic farming (27) or said they did not know enough to answer (31). These 58 people are not included in the subsequent analysis. It is notable that a different set of 58 respondents scored +3 (maximum) on rating organic farming as good for sustainability.
Analyses of word frequencies in the 221 pro-sustainability and 21 anti-sustainability respondent explanations gave rise to the following significant differences (by Χ 2, p < .01, 2-tailed) from a set of potentially relevant words. The 2 words significantly more common in the 221 positive responses were ‘chemicals’ (81/221; 0/21 for the contra-sustainability respondents) and pesticides (69/221; 1/21). This suggests that the organic–sustainability link is supported primarily by the perceived negative effects on sustainability that organic avoids. There were 2 words with significantly higher relative incidence in the much smaller number of 21 contra-sustainability respondents. ‘Yield’ occurs in 8/221 pro-sustainability and 6/21 contra-sustainability and ‘efficient’ or ‘efficiency’ occurs in 9/221 versus 7/21. These results suggest attention to the higher costs of organic farming.
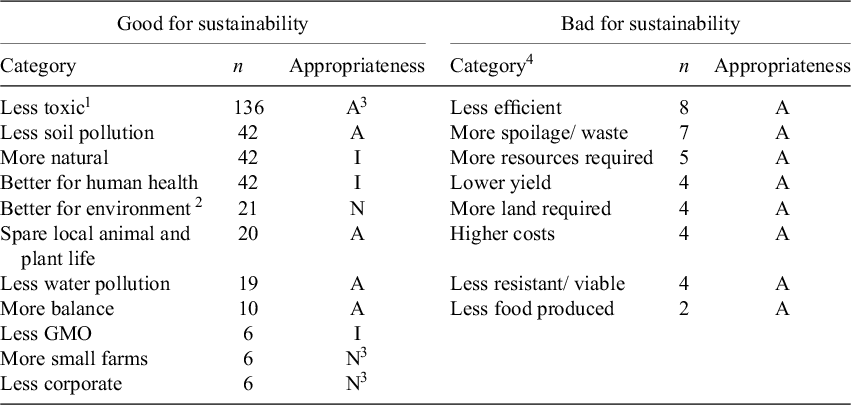
We developed a 14-category coding scheme (listed in the left column of Table 3) for the 221 pro-sustainability explanations of organic farming after reading through them. Category coding was carried out independently by 2 authors. When there was a disagreement as to the number in each category of 3 or more, disparate codings were reexamined and brought into agreement. Each respondent’s explanation could be awarded as many categories as were appropriate. The categories that received at least 4 mentions are listed in descending order by frequency in Table 3. Because we limited Table 3 to categories with at least 4 instances, 2 categories (‘less air pollution’ and ‘less transport expenses for fossil fuels’) do not appear in the table, along with the meaningless category.
Categories of explanations for why organic farming is good (n = 221) or bad (n = 21) for sustainability

Note: A = appropriate; N = neutral; I = irrelevant or incorrect. All categories with at least 4 instances are in the table for the 221 pro-organic/pro-sustainability respondents. All categories with greater than 1 instance are listed for the 21 organic/non-sustainable respondents. 1Less toxic means less pesticides, herbicides, fertilizer, or ‘chemicals’. 2Just a statement such as ‘good for the environment’. 3The categorization here is arguable—some informed people might assign these as A, some as N, and others as I. 4Negative organic explanations expressed from the perspective of organic farming, so ‘less efficient’ means organic less efficient.
We rated each category of explanation as to whether we considered it an appropriate answer (A), a neutral answer that is basically meaningless (e.g., ‘improves the environment’ just restates the question; N), or an either incorrect or irrelevant answer (I). A certain amount of judgment is involved in assigning reasons as appropriate, neutral, or incorrect/irrelevant. Given that our ‘bias’ is against the idea that natural is necessarily better for sustainability, on potentially controversial judgments, we intentionally were favorable to the pro-organic side. The most common reason offered for organic sustainability was ‘less toxic’ (less pesticides, herbicides, fertilizer, or chemicals), which we judged ‘appropriate’. This is arguable, since there are more natural than artificial pesticides, many organic substances are toxic, and many ‘additives’ are net positive. We considered ‘better for human health’ either an irrelevant or incorrect answer. As the human population puts pressure on the environment, improved health would increase the population and might be bad for sustainability. We considered ‘more natural’ an irrelevant answer.
By far, the most common explanation for pro-sustainable effects of organic farming was ‘less toxic substances’ (pesticides, herbicides, fertilizers, or ‘chemicals’), 136 cases, rated as appropriate. The next 3 most common categories, all at 42 cases, were ‘less soil pollution’ (appropriate), ‘more natural’ (irrelevant), and ‘better for human health’ (irrelevant). Of a total of 350 explanations (offered at least 4 times, not including meaningless) for pro-sustainability, 227 (65%) qualified as appropriate by our criteria. That means over one-third of the responses were neutral, irrelevant, or incorrect.
We used a different set of 9 categories (plus meaningless) to code the explanations of the 21 respondents who believed organic farming was bad for sustainability. The 8 categories with more than 1 case are included in Table 3, in the order of decreasing frequency. The 8 listed categories can all be considered as examples of lower efficiency of organic, and we rated all as appropriate explanations. For organic pro-sustainability, there were 227/350 (65%) appropriate responses, whereas for organic anti-sustainability, there were 38/38 (100%) appropriate responses (Χ 2 = 19.55, p < .001).
We examined the open-ended responses explaining why GMOs increase or decrease sustainability.
There was a close to even split between those who favored increased use of GMOs (35%) and those who opposed it (42%) and between those who thought GMOs are good for sustainability (38%) and those who thought they were bad for sustainability (31%).
We calculated word frequencies for relevant words in the corpus of pro-sustainability and contra-sustainability explanations separately. The significant differences (Χ 2 , p < .01) between pro- and contra-sustainability frequencies are as follows. The most common words for contra-sustainability (94 respondents) with frequencies for the same words for 113 pro-sustainability respondents were: bad (28 for contra-sustainable, 3 for pro-sustainable), natural (21, 6), and chemicals (15, 2). Pro-sustainability respondents showed significantly higher mentions of yield (33, 0 for GMO decreases sustainability), crops (33, 9), grow/n/th (25, 5), help (22, 0), better (15, 2), resistant (13, 0), reduce (12, 0), and resources (10, 0). The most common anti-GMO word was bad (28), and the most common pro-GMO word was yield (33). This suggests a more moral base for opposition and a more consequentialist base for support.
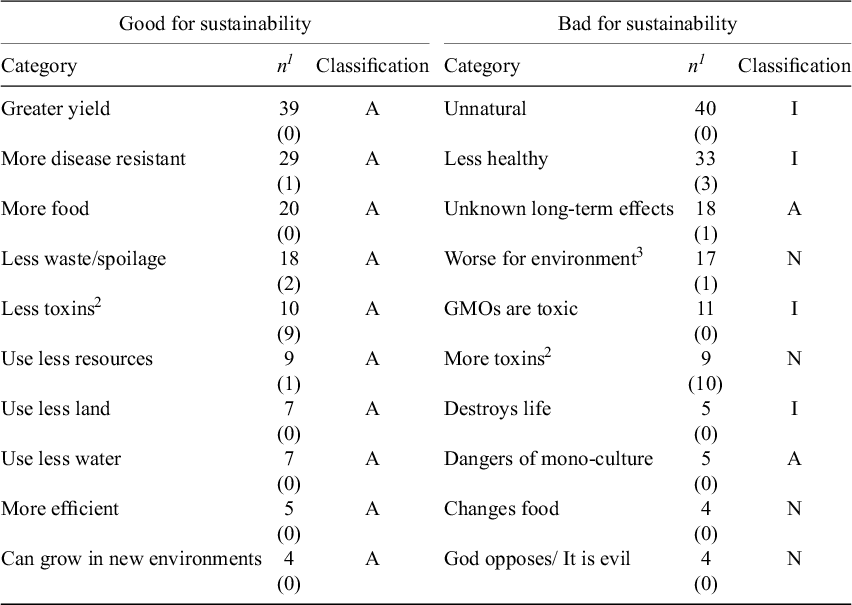
We developed a coding scheme for GMO responses after examining explanations of all participants who answered the question and gave a response other than zero: no net effect of GMO on sustainability, n = 47; or don’t know enough to answer, n = 46. Categories are displayed in descending frequency in Table 4.
Categories of explanations for why GMOs are good (n = 114) or bad (n = 94) for sustainability

Note: A= appropriate; N = neutral; I = irrelevant or incorrect. 1Frequency of response for opposite group in parentheses. 2Less/more toxins (pesticides, herbicides, fertilizer, or ‘chemicals’). 3Just a statement such as ‘good for the environment’.
Categories with the most cases for each group (and significant group differences) are listed here, with a more complete list in Table 4: for pro-sustainability: ‘greater yield’ (39,0 for anti-sustainability respondents; appropriate), ‘more disease resistant’ (29,1; appropriate), ‘more food’ (20,0; appropriate), and ‘less waste/spoilage’ (18,2; appropriate); for contra-sustainability: ‘unnatural’ (40,0; irrelevant), ‘less healthy’ (33,3; irrelevant), ‘unknown long-term effects’ (18,1; appropriate), and ‘worse for the environment’ (17,1; neutral).
Ironically, while 10 pro-GMO respondents cite reduced toxins (pesticides, etc.) as a sustainability advantage for GMOs, 9 anti-GMO respondents cited more toxins as a sustainability problem for GMOs. We believe the pro-GMO respondents are correct here. Furthermore, 11 anti-GMO respondents referred to GMOs themselves as toxins (which they are not).
Both the word count and coded category results suggest that those who thought GMOs are bad for sustainability were more focused on moral (e.g., unnatural) concerns, and those who thought GMOs were good for sustainability were more focused on documented effects. There were 14 GMO anti-sustainability respondents who offered ‘unnatural’ as their only explanation, 8 who offered ‘less healthy’ as their only explanation, and 4 who offered both as their only explanations. This constitutes over 25% of the GMO-sustain opponents.
While 100% of the 148 GMO pro-sustainability explanations (cited 4 or more times) were classified as appropriate, only 23 of the146 GMO anti-sustainability explanations (16%) were classified as appropriate. Both the organic and GMO sustainability reason analyses strongly support the idea that pro-organic and contra-GMO reasons are often irrelevant or incorrect, whereas contra-organic and pro-GMO reasons are much more correctly linked to facts.
Political effects. We examined correlations between our 2 political measures, Conservative Ideology and Republican Values, with pro-sustainability, pro-natural, and pro-technology. We also compared mean scores of Republican (n = 146) and Democrat (n = 136) participants.
Pro-natural attitudes were not highly correlated with either Conservative Ideology (r = −.13, p = .02) or Republican Values (r = −.10, p = .08). Mean scores of Republican (M = 1.66, SD = 1.03) and Democrat (M = 1.90, SD = 0.73) participants did not significantly differ, t(180) = 2.33, p = .02, d = 0.28.
Pro-technology attitudes were negatively correlated with both Conservative Ideology (r = −.29, p < .001) and Republican Values (r = −.31, p < .001). Mean scores of Republican (M = 0.08, SD = 1.18) participants were lower than those of Democrats (M = 0.89, SD = 1.07), t(280) = 6.00, p < .001, d = 0.72.
Pro-sustainability attitudes were negatively correlated with both Conservative Ideology (r = −.38, p < .001) and Republican Values (r = −.49, p < .001). Mean scores of Republican (M = 0.52, SD = 0.24) participants were lower than those of Democrats (M = 0.68, SD = 0.18) t(280) = 6.14, p < .001, d = 0.73.
2. Study 2
Study 1 uncovered some surprising relations among pro-sustainability, pro-natural, and pro-technology attitudes, and the relations of these variables to politics. We designed Study 2 to confirm these relations, using a standard multi-item measure of sustainability attitudes and more general measures (not directly related to sustainability) of pro-natural and pro-technology attitudes and beliefs.
2.1. Method
Study 2 was carried out in 2023. The questionnaire was programmed in Qualtrics. Anonymous responses from 182 adult Americans were obtained from a Prolific panel, with respondents paid directly by Prolific. As in Study 1, we designated half of the panel be Democrats and half Republicans, spread rather evenly across the ages from the range 25 to 75 years.
All scale results were coded so that 0 was the neutral point. The measures are briefly described in the order of presentation.
-
1. Our 1-item measure of support for sustainability, as employed in study one (pro-sustainability).
-
2. The revised New Ecological Paradigm Scale (Dunlap, Reference Dunlap2008; Dunlap, and Van Liere, Reference Dunlap and Van Liere1978; Dunlap et al., Reference Dunlap, Liere, Mertig and Jones2000), a 15-item scale widely used to measure support for sustainability, using a 5-point agree/disagree scale. Sample items: ‘human ingenuity will ensure that we do NOT make the earth unlivable’ (reverse-scored); ‘humans are severely abusing the environment’.
-
3. The new benevolence of nature 10-item measure (Rozin, et al., Reference Rozin, Chen, Scott and Cusimano2024), which measures natural preference in general and for food and the environment, exploring both safety and effectiveness of natural versus corresponding artificial entities. Response categories are based on a 7-point agree/disagree scale. Sample items: ‘in general, natural things are more effective than their artificial versions’ and ‘most of the deadliest poisons in the world are created by humans’.
-
4. The Mayer and Frantz (Reference Mayer and Frantz2004) standard scale for measuring a positive attitude to nature (14 items). It Uses a 5-point agree/disagree scale. Sample item: ‘I often feel a kinship with animals and plants’.
-
5. The Michel and Siegrist (Reference Michel and Siegrist2019) 9-item scale primarily measuring avoidance of food products containing unnatural entities. It uses a 6-point agree/disagree scale, with 3.5 neutral. Sample item: ‘I avoid food that contains additives’.
-
6. A simple single item originally used for measuring closeness of interpersonal relations (Aron et al., Reference Aron, Aron and Smollan1992). Participants view 7 pairs of circles, showing more and more overlap, with the first pair totally separate and the last pair almost completely overlapping. One circle is designated as natural, and the other as sustainable. Participants select what they think is the actual overlap.
-
7. We could not find a general scale measuring attitudes to technology that was appropriate for our study. We employed 2 subscales of a broad scale on technology attitudes by Gokhale (Reference Gokhale, Brauchle and Machina2009), all responded to on a 5-point agree/disagree scale. One subscale (Factor 2 from Gokhale, Reference Gokhale, Brauchle and Machina2009), which we label Tech Benefits, consisted of 5 items. It measured agreement with the general idea that ‘science and technology are beneficial to humankind’. Sample item: ‘science and technology are making our lives healthier, easier, and more comfortable’. The second 4-item subscale (Factor 7 from Gokhale, Reference Gokhale, Brauchle and Machina2009), which we label Tech Risk, measured agreement with the general ‘concern that science and technology are dangerous to humankind’. Sample item: ‘people would do better by living a simpler life without so much technology’. The risk items are reverse-scored, so that for both tech scales, higher scores display more positive attitudes to technology.
-
8. An overlapping circle single item, as in item 6 above, but with 1 circle designated to represent technology and the other to represent sustainable.
-
9. These measures (2 for technology under item 7) were followed by a set of questions like those in study 1, assessing support for policies designed to reduce meat intake and to reduce family size, and opinions about the effects of such policies on sustainability. The results from these items are not presented in this article.
-
10. A set of standard demographic items and measures of political affiliation, exactly the same as in Study 1.
-
11. Six exploratory questions on beliefs about how consistent the various beliefs and attitudes of people are. These items are not presented in the present paper.
A total of 182 respondents completed the survey (91 female, 90 male, 1 other), and were well distributed by age, with a mean of 47.4 years. Social class had a mean of 2.60 on a 5-point scale, religiosity had a mean of 2.35 on a 5-point scale, and education had a mean of 5.31 on an 8-point scale. There were 80 Democrats and 82 Republicans out of 182 respondents. Mean-rated Conservative Ideology (measured as in Study 1) was near the 0 midpoint at −0.21. The mean for the 4 items measuring Republican Values was −0.74, mildly Democratic/Liberal.
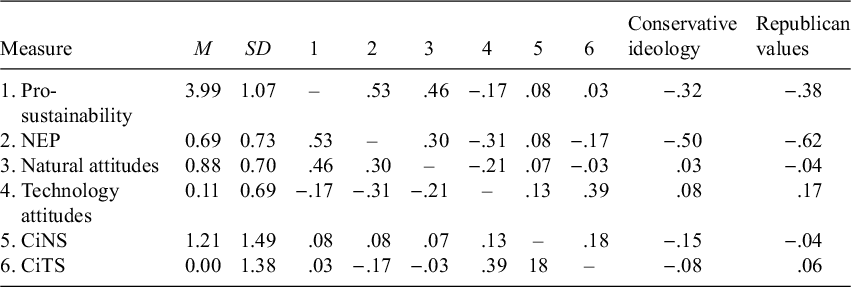
Basic scores of sustainability, natural, and technology. In Study 1, we used a single item rating the importance of sustainability as a value. In Study 2, we repeated that measure (pro-sustainability) along with the New Ecological Paradigm (NEP), a standard scale of sustainability attitudes. The 2 correlated at .53. The scores and correlations are presented in Table 5. The mean pro-sustainability score of 3.99 corresponds almost exactly to 4.00: ‘an important value’, indicating support for sustainability. This is reinforced by the mean score of 0.69 (0.00 neutral point) for the NEP.
Study 2: Basic measures and statistics (N = 182; columns 4–11 from left are Pearson correlations)

Note: CiNS = overlap between natural and sustainable; CiTS = overlap between technology and sustainable; NEP = New Ecological Paradigm. For n = 182, a correlation of .19 or higher is p < .01 2-tailed; a correlation of .24 or higher is p < .001 2-tailed.
The pro-natural and pro-technology scores in Study 1 derive from questions about particular actions in the context of sustainability. The measures of pro-natural and pro-technology in Study 2 are more general.
The 3 scales to measure attitudes to natural are quite different, but all use disagree/agree scales. For all 3, the mean score is well above the neutral point, indicating a substantial natural preference. The scales correlate with one another between .43 and .52. For this reason, we combine the 3 natural scales (each with 0 as neutral) by summing the mean scores for the 3 scales and dividing by 3 (natural attitudes). The 2 tech scales, Tech Benefits and Tech Risk (reverse-scored), correlate r = .44, and a combined score of the means of the 2 scales (technology attitudes) is used to represent pro-technology.
Politics, sustainability, natural, and technology. As in Study 1, we have 3 measures of political position. The correlations between pro-sustainability, NEP, natural attitudes, and technology attitudes, and the political variables are presented in Table 5. The differences between Republicans and Democrats are presented in the text.
All 3 political measures show a significantly stronger pro-sustainable position on both measures among Democrats or more liberal respondents (Table 5). The mean score for Republicans on pro-sustainability was 3.67 compared to 4.37 for Democrats, (t[163]= 6.12, d = 0.70, p < .001). The mean score on NEP was 3.36 for Republicans and 4.04 for Democrats (t[163]= 10.25, d = 1.04, p < .001). There are no significant relations between any political variables and either natural attitudes or technology attitudes (Table 5).
Relations among pro-sustainability, pro-natural, and pro-technology. There are substantial (p < .001) positive correlations between natural attitudes and both sustainability measures (.46 with pro-sustainability and .30 with NEP). There are negative correlations between technology attitudes and pro-sustainability: −.17 and NEP: −.31 (p < .001; Table 5).
The first overlapping circle score measures the overlap between sustainability and natural (CiNS) and shows a mean of 1.21, suggesting a moderate degree of closeness. The mean overlap between sustain and technology (CiTS) in the second circle task is .04, near the midpoint of the scale, which is significantly below the natural–sustain overlap (paired t(181) = 8.90, p < .001). The 2 circle items do not correlate significantly with any other variables, except that the more similar one rates technology and sustainability (CiTS), the more one supports sustainability (technology attitudes); r = .39.
The correlation between natural attitudes and technology attitudes is −.21 (p < .01). Looking at all possible correlations between the 3 component natural scores and 2 tech scores yields the following 6 correlations: .06, −.06, −.17. −.17, −.29, and −.32. The 3 lowest values, averaging −.05, correspond to Tech Benefits, while the next 3 values, averaging −.28, are based on Tech Risks.
Demographic effects. There is only 1 significant correlation when crossing 5 demographics (age, gender, SES, education, and religiosity) with 4 basic variables (pro-sustainability, NEP, natural attitudes, and technology attitudes)—a −.27 correlation (p < .001) between religiosity and NEP. The correlation of religiosity with pro-sustainability is −.10.
The main finding of Study 2 is a confirmation/extension of the substantial positive correlation between general measures of preference for natural and support for sustainability, which we believe should be zero or negative.
3. Discussion
Results from both Study 1 and Study 2 indicate, in a politically balanced American adult sample, that a substantial majority of Americans favor sustainability and think positively about natural. Support for technology is positive, but much weaker. Both studies indicate a substantial positive correlation between measures of support for natural and sustainability.
In Study 1, there was a surprisingly weak negative correlation between support for specific technology and natural policies. In Study 2, general measures of pro-natural and pro-technology attitudes showed a low but significant correlation (r = −.21, p < .01). The pro-natural factor in Study 1 correlated positively and significantly with a single pro-sustainability measure (r = .35, p < .001). In Study 2, the combined natural attitudes measure correlated .46 with the single pro-sustainability item and .30 with a standard sustainability scale (New Ecological Paradigm; Dunlap et al., Reference Dunlap, Liere, Mertig and Jones2000). There was a contradiction in relationships between pro-technology and pro-sustainability between Studies 1 and 2. In Study 1, pro-Technology policy attitudes correlated positively with the one-item pro-sustainability measure, but in Study 2, the more general pro-technology attitudes measure correlated negatively with the single item sustainability measure and −.31 with the sustainability scale (NEP).
Pro-technology in Study 1 was a combined measure of support for 4 specific policies (e.g., encouraging GMOs and using computers to optimize agriculture). Technology attitudes in Study 2 was composed of general statements about the benefits and risks of technology. It would seem that general attitudes to technology are sensed to be counter to sustainability, but reminders of specific manifestations of technology that are relevant to sustainability (the technology measure in Study 1) are viewed more favorably with respect to sustainability.
In Study 1, with the technology measure based on specific activities, pro-technology was more characteristic of liberals. In Study 2, with more general measures of pro-technology, there was no significant difference based on political ideology. The difference is probably attributable to the different types of measures of technology in the 2 studies. Overall, the results do not support a major political difference in attitudes to technology. It may be that a liberal predisposition to trust science more is balanced by a conservative pro-technology attitude based on its association with corporations.
On all 3 measures of political ideology, and in both studies, liberals were substantially more pro-sustainable on both measures of sustainability. However, although liberals scored higher on pro-natural, the differences were small and not significant across a number of measures.
We examined open-ended reasons provided by respondents for their beliefs of sustainability-promoting or sustainability-reducing effects of organic farming and GMOs. Seventy-four percent of the sample believe that organic farming is good for sustainability, but only 31% believe that GMOs are bad for sustainability. We expected that a substantial percentage of the explanations for the position counter to our view of the empirical evidence would be faulty. For organic pro-sustainability, of the 221 explanations, using a rather generous criterion for rating responses as appropriate, 38% were rated as inappropriate or neutral, with ‘healthier’ and ‘natural’ notable examples. We rated all explanations given by the 21 respondents who considered organic unsustainable as appropriate.
For GMOs, of the 94 explanations for why they opposed sustainability, we judged 84% as not appropriate, with ‘unnatural’ and ‘less healthy’ heading the list (73 cases). We rated all 113 pro-sustainability responses as appropriate.
Both studies found a substantial relation between pro-natural and pro-sustainability attitudes and beliefs. We note the substantial majority of participants in Study 1 who think that the 4 natural policies are ‘good’ for sustainability. Most strikingly, counter to any reasonable account, 71% of respondents believed that raising chickens free-range was good for sustainability (as opposed to good for chickens!). Similarly, a substantial minority of participants in Study 1 think that GMOs are bad for sustainability. In both the organic and GMO examples, many of those who avow that natural things (organic) are good for sustainability and that GMOs (technological and not natural) are bad for sustainability offer inappropriate or incorrect reasons. The most obvious example of this is the frequent citation of positive human health effects of organic farming and negative human health effects of GMOs as relevant to their effects on environmental sustainability.
The natural–sustainable mental link seems to be more than just an association. Our phrasing of the second set of questions in Study 1 asked for judgments of whether various policies, framed as increases in a natural policy, were ‘good for sustainability’. Percent agreement was very high for all 4 natural enhancements (Table 2): increased percentage of chickens that are raised free-range (71%), increased consumption of natural foods (81%), increased organic farming (82%), and increased consumption of locally grown foods (93%). Increases in X are ‘good for sustainability’ can reasonably be read as increases in X lead to increases in sustainability, implying causation, though the word ‘cause’ does not appear in the framing.
To clarify this matter, we had the opportunity to append a critical question to a subsequent survey in the United Kingdom. The survey, composed in Qualtrics and administered via Prolific, was distributed to 769 British adults (Kosegil et al., Reference Kosegil, Kaptan and Rozinin preparation). The survey was about attitudes to 4 types of meat alternatives: legumes, plant-based meat, cultured meat, and insects. At the end of the survey, we added a question about the causal relation between natural and sustainability (not reported in that study): ‘Generally, more natural things cause more sustainable outcomes’, answered on a standard 7-point agree scale, with ‘0’ as ‘neither agree nor disagree’. A clear majority of subjects (65.5%) agreed with this statement (scores of plus 1 to 3), with a mean of 0.99; the modal score was +2 (219 subjects).
Both the results from Study 1 and those from the British study indicate that most respondents believe in a causal link between natural and sustainable. Our provisional interpretation of this finding is that because both natural and sustainable have the same positive valence, and thus are affectively congruent, and because there is a plausible causal link, people will tend to believe that there is a causal link.
Separate psychology studies on causation and affect provide a good basis for this assumption. There is an old literature on the psychology of causation, dating back to David Hume (1749/Reference Hume1938) and John Stuart Mill (Reference Mill1872), that identifies similarity between cause and effect as a principle involved in lay inferences about causation. This was involved in the doctrine of signatures, a medical theory that became prominent in 16th--century Europe, which asserted similarity between cures and disease symptoms (cited in Nisbett and Ross, Reference Nisbett and Ross1980, p. 116). Studies by psychologists of perceived causation in adults, many based on social attributions, identified causal schemata as an important basis for perceived causation (Kelley Reference Kelley1973). One major scheme is the idea that like produces (causes) like: for example, big events tend to have big causes. Some of this has origins in Gestalt psychology (e.g., Heider Reference Heider1944, Reference Heider1958) and appeared subsequently in suggestions by major social psychologists (Kelley, Reference Kelley1973; Nisbett and Ross, Reference Nisbett and Ross1980). Einhorn and Hogarth (Reference Einhorn and Hogarth1986), in a review and theory about adult human causal inference, explicitly cited similarity between cause and effect as a principle.
In recent decades, more attention has been paid to affect as both an important aspect of human thinking and, in particular, a way of organizing and relating pieces of information and hence influencing decisions. This has been called ‘affect heuristic’ (Finucane et al., Reference Finucane, Alhakami, Slovic and Johnson2000; Slovic et al., Reference Slovic, Finucane, Peters and MacGregor2007). The coupling of interest in affect and the principle of similarity leads to the suggestion that affect, or valence, might be a relevant dimension of similarity.
Concrete experimental evidence for this appeared much later. In what they call consequence–cause matching, LeBoeuf and Norton (Reference LeBoeuf and Norton2012) showed that American respondents were more likely to attribute a positive event to a positive cause and a negative event to a negative cause, in a situation in which both candidate causes were available, with an equally plausible case for being a cause.
Cause–consequence matching in the narrower context we are discussing may be called valence matching. It may be seen as a manifestation of the well-documented human tendency to organize information and attitudes in simplifying and consistent ways, with a minimal number of principles (e.g., Festinger and Carlsmith, Reference Festinger and Carlsmith1959; Montgomery, Reference Montgomery, Lichtenstein and Slovic2006). Our potential example, in this paper, of affective cause–consequence matching brings this idea into a situation of contemporary importance, outside the domain of judgments of personal experiences and person judgments.
This is an early attempt to explore the conceptual and empirical relations of some attitudes and beliefs relevant to sustainability. There are not fully developed scales to measure attitudes and beliefs about technology, which limits the generality of some of our conclusions. We have only made measurements on American adults (with 1 British item), and our choice of 8 policy items is a somewhat arbitrary selection from a potentially large set. Our judgments of the quality of explanations, used in our conclusion that the opinions of a positive role in sustainability for organic foods, and a negative role for GMOs, are not well founded and were made by the authors. Some of them might be arguable. Another potential problem with this research is that since the term ‘sustainability’ has evolved from explicit reference to the environment to a much more general view of an adaptive society, there can be some concern that some subjects were using this larger frame in answering some questions. We tried to minimize this possibility by introducing the idea of environmental sustainability at the beginning of the questionnaire and often referring to environmental sustainability.
4. Conclusion
We have provided evidence for a number of relationships among natural, technology, and sustainability. We uncovered evidence for a tendency of people to believe that increased naturalness causes greater sustainability. As a potential example of valence matching in causal attributions, this may be an important principle. We believe that the natural–causal linkage is not the case in the real world. This common belief, and perhaps some others related to technology, may lead to the endorsement of non-optimal strategies to promote sustainability. Along with Borlaug (Reference Borlaug2007) and Ritchie (Reference Ritchie2024), we are inclined to think that the main solution to problems in environmental sustainability, at least in the food, energy, and climate change domains, will come from technology. Views of people from around the world, including influential people, on the relations among sustainability, technology, and natural (see Supplementary material) will therefore be valuable to collect and understand.
Supplementary material
The supplementary material for this article can be found at http://doi.org/10.1017/jdm.2026.10028.
Competing interest
The authors declare none.


 Open access