The optimal dietary macronutrient composition that promotes longevity and quality of life in cats is not completely known(Reference Villaverde and Fascetti1). In particular, the effects of starch or protein intake on energy expenditure (EE), physical activity, body composition (BC), carbohydrate metabolism(Reference Hoenig and Ferguson2,Reference Vasconcellos, Borges and Goncalves3) and water turnover (WT)(Reference Garcia, Loureiro and Peres4) remain unclear and have been controversial(Reference Hill, Rutherfurd-Markwick and Ravindran5). Considering the elevated protein requirement of cats to supply gluconeogenic amino acids for energy metabolism(Reference Russell, Murgatroyd and Batt6) and their preference for selecting proteins and fats as energy substrates over starch(Reference Hewson-Hughes, Hewson-Hughes and Miller7), studies on the implications of starch intake, especially in neutered and spayed cats living in homes and fed dry diets ad libitum, are necessary to understand its influence on animal physiology.
Some studies have suggested that high-protein (HP) diets may increase the lean body mass (LM) of cats(Reference Nguyen, Leray and Dumon8,Reference Wei, Fascetti and Liu9) and induce a higher heat increment, thus increasing their daily EE in comparison with high-starch (HS) food(Reference Green, Ramsey and Villaverde10). If this is true, HP diets may favour body weight maintenance and better BC in cats with unrestricted access to kibble-rich diets. In this situation, a lower starch intake would also favour carbohydrate metabolism and reduced adiposity(Reference Keller, Liesegang and Frey11). However, some studies have reported an increase in body mass in cats fed HP diets(Reference Hewson-Hughes, Hewson-Hughes and Miller7,Reference Coradini, Rand and Morton12) , indicating that HP diets may promote better satiety, and energy intake control may not be valid(Reference Du, Markus, Fecych and Rhodes13).
However, it has been demonstrated that HS diets do not induce obesity, while high-fat diets do(Reference Backus, Cave and Keisler14). Starch in extruded diets is highly digestible and is an adequate energy source(Reference De-Oliveira, Carciofi and Oliveira15,Reference Alvarenga and Aldrich16) . Starch intake does not induce evident alterations in postprandial glucose and insulin responses in cats fed dry foods(Reference De-Oliveira, Carciofi and Oliveira15,Reference Hoenig, Jordan and Glushka17) . Even in obese cats, different carbohydrate-to-protein ratios in diets did not induce significant changes in hormonal responses or glucose metabolism(Reference Hoenig, Jordan and Glushka17,Reference Hoenig, Thomaseth and Waldron18) , suggesting that in properly balanced food, starch intake is safe for cats. One interesting theory applied to cats is the ‘carbohydrate ceiling’, which suggests that cats may limit the starch intake by some amount and will present a lower intake of HS foods. The authors who proposed this theory observed that cats voluntarily consume protein as an energy substrate and may consume higher amounts of diets with a HP content, consequently increasing their body mass(Reference Hewson-Hughes, Hewson-Hughes and Miller7). Therefore, it is possible that a HS diet properly balanced with amino acids and other nutrients would limit voluntary food intake, helping to maintain a stable body weight in cats feeding ad libitum (Reference Wei, Fascetti and Liu9,Reference Coradini, Rand and Morton12) .
For cats living in homes, studies on maintenance energy requirements are needed, as most publications use laboratory cats that may have different living conditions and physiological statuses(Reference Bermingham, Thomas and Morris19). The available equations for estimating energy requirements also do not account for the possible influence of sex, reproductive condition, BC, age and physical activity(Reference Bermingham, Thomas and Morris19–Reference Backus and Wara21). Higher LM and EE in males compared with females have been reported(Reference Fettman, Stanton and Banks22–Reference Goloni, Peres and Senhorello24). The increase in body fat content in overweight and obese cats is also associated with reduced EE for maintenance, limiting the amount of food intake by these cats and increasing their chance of gaining weight in ad libitum feeding systems(Reference Hoenig, Thomaseth and Waldron18,Reference Vasconcellos, Gonçalves and Borges23,Reference Kanchuk, Backus and Calvert25) . The influence of physical activity on EE has been understudied in cats(Reference Villaverde and Fascetti1), but its importance can be observed by the effect of stimulated movement by owners and the living environment (indoor or outdoor living conditions) on the level and intensity of physical activity, all reflecting on the energy balance of cats(Reference Bermingham, Weidgraaf and Hekman26,Reference Pallotto, De Godoy and Holscher27) . Housing conditions and physical activity may be the most important differences between cats living in homes and laboratories, reinforcing the need for studies on energy metabolism, physical activity and voluntary food intake in cats living in homes.
The elevated incidence of obesity in domiciled cats(Reference Wall, Cave and Vallee28) justifies the importance of studies on the effects of dietary macronutrient composition on energy metabolism, physical activity, WT and BC. Obesity compromises lifespan and quality of life(Reference Brooks, Churchill and Fein29,Reference Cline, Burns and Coe30) , may increase inflammation and reduce energy metabolism(Reference Mizorogi, Kobayashi and Ohara31). Obesity is associated with age, neutering, housing conditions, owner conscientiousness, feeding method and food energy density(Reference Kienzle, Edtstadtler-Pietsch and Rudnick20,Reference Fettman, Stanton and Banks22,Reference Wall, Cave and Vallee28) . Diet composition and water intake may affect physical activity, as observed in cats fed high-moisture foods to dilute energy density(Reference Alexander, Colyer and Morris32,Reference Thomas, Post and Bosch33) , and this may also affect EE. Considering that HP, low-starch foods can also increase WT in cats(Reference Garcia, Loureiro and Peres4), it is possible that HP diets might also affect physical activity and EE.
Taking this into consideration, in the present study, it was hypothesised that cats living in homes with ad libitum feeding systems fed a HP diet would present an increase in LM, EE, WT and physical activity, and that a HS diet would favour satiety, reducing the voluntary intake of food by the cats. Thus, the objective of the present study was to compare the body weight and composition, EE, WT and voluntary physical activity of neutered or spayed male and female obese and non-obese cats living in homes when fed unrestricted amounts of two extruded diets: one high in protein and another high in starch.
Materials and methods
Animals and experimental design
The experiment was conducted with client-owned cats in their homes, using their ordinary routines, and with laboratory cats (palatability, digestibility and satiety evaluations). The collection of cat samples was performed mainly at the Clinical Nutrition Service of Cats and Dogs of UNESP, Jaboticabal, São Paulo, Brazil. All animal procedures followed the ethical principles adopted by the Brazilian College of Animal Experimentation and were approved by the Ethics Committee on the Use of Animals at São Paulo State University (Protocol no. 9536/18). Before participating in the study, owners were informed about all procedures and all signed a free consent form for participation.
Client-owned cats were recruited between April 2019 until June 2020. The criteria to participate in the study were as follows: cats must be indoors, with access to backyard allowed but not to streets; age between 1 and 7 years old (necessary in order to include non-obese, generally younger and obese animals); confirmed healthy throughout the study; neutered or spayed at least 6 months before the study; commercial dry kibble food comprising > 90 % of daily energy intake; be fed ad libitum as per the owner’s decision; the owner commits to feeding only the experimental diet along the study, not giving any other food or snack in amounts higher than 10 % of daily energy intake. After the first contact with the owners to present the study and obtaining signed authorisation for participation, the cats were assessed by a veterinarian who evaluated their health through physical examination, complete blood count, serum biochemistry (alanine aminotransferase, aspartate aminotransferase, alkaline phosphatase, albumin, urea and creatinine) and urine analysis.
The selected cats were divided into four groups according to their body condition scores (BCS)(Reference Laflamme34)and sex: female non-obese cats (F-NO; BCS 5–6), male non-obese cats (M-NO; BCS 5–6), female obese cats (F-OB; BCS 7–9) and male obese cats (M-OB; BCS 7–9). Obese cats must have been naturally overweight or obese for more than 1 year, based on their owner’s records of their body weight. BCS was evaluated by the same two trained veterinarians (C.G. and L.L) along the study, to avoid inter-evaluation errors and biased data.
The treatments were organised in a factorial arrangement with two diets × two body conditions × two sexes for a total of eight experimental treatments. The study followed a crossover design, and all cats were fed the two diets in randomised order. Each crossover period lasted for 4 months, and the study lasted 8 months. In each crossover period, on the first day, cat body weight was recorded (INMETRO: certified weights from 1 to 10 kg; OIML E1/2004), and BCS was documented. Animal BC at the beginning of the study was evaluated using the 2H oxide method. The cats then received only their designated experimental food and water for 4 months. The experimental food was introduced gradually over a period of 7 days. During the experimental period, the experimental food was the sole source of nutrients. Food management, including the offered amount and feeding times, was not altered, and the owner continued to perform their usual routine with the cats (ad libitum feeding, with leftovers present daily in the bowls). When a house had more than one cat, all animals were fed the experimental diet.
When each cat completed 4 months of experimental food intake, the animal was weighed, classified according to BCS, had physical activity evaluated with a triaxial accelerometer for at least 3 consecutive days, and BC, EE and WT were assessed using the doubly labelled water (DLW) method. To complete these evaluations, a period of 15–20 d was necessary. After the first period of the crossover, cats started the second period with the other diet sorted.
Experimental diets
Two extruded diets were used, balanced for adult cat maintenance(35): a HS diet with 38 % crude protein (CP) and 32 % starch on DM basis, named HS (38 % CP), and a HP diet with 55 % CP and 19 % starch on DM basis, named HP (55 % CP). An increase in protein content was achieved through a reduction in starch content, which altered the protein-to-starch ratio of the diets. The fat, metabolisable energy and Na contents were similar between the diets and possibly did not interfere with food intake or water balance. The dietary fibre was a little higher for the HS (38 % CP) diet, but both diets might be considered low fibre. The extrusion processing was controlled so starch gelatinisation degree was similar between diets, in order to not interfere on results. Diets were produced at two different times, ensuring fresh food during the experiment, and manufactured at the Extrusion Laboratory of the Faculdade de Ciências Agrárias e Veterinárias da UNESP, Jaboticabal, Brazil. Before starting the experiment, the palatability of the two diets was compared by a trained panel of thirty-eight cats using a two-bowl test(Reference Griffin, Kvamme and Phillips36). The observed intake ratios were 55 % for the HP (55 % CP) v 45 % for the HS (38 % CP) diets. Diets DM, CP, acid hydrolysed fat, crude fibre and total dietary fibre were analysed according to procedures recommended by AOAC(37). Starch was determined according to Hendrix(Reference Hendrix38), and the amino acid content according to White et al. and Hagen et al. (Reference White, Hart and Fry39,Reference Hagen, Frost and Augustin40) . The calculated energy contribution of each substrate was 44·9 % derived from protein, 37·6 % from starch and 17·4 % from fat for the HS (38 % CP) diet, and 61·7 % from protein, 20·9 % from starch and 17·3 % derived from fat for the HP (55 % CP) diet. The chemical compositions of the diets are presented in Table 1.
Analysed chemical composition of the experimental diets. Values on DM basis (Mean values and standard deviations)
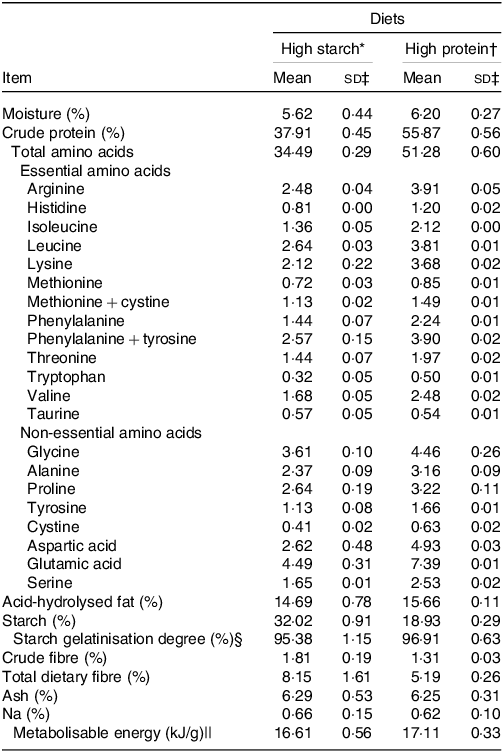
* Ingredient composition of the high-starch food: poultry by-product meal 35 %; maize grain 26·7 %; broken rice 17·42 %; isolated swine protein 7 %; poultry fat 6·7 %; beet pulp 2·5 %, palatant enhancer 1·5 % (SPF Brasil); potassium chlorate 0·65 %, common salt 0·6 %; choline chloride 0·45 %; vitamin–mineral premix 0·7 % (Rovimix, DSM Produtos Nutricionais Brasil S.A.). Provided per kg of diet: vitamin A, 22 000 μg; vitamin D, 2200 μg; vitamin E, 90 μg; vitamin B1, 4 mg/kg; vitamin B2, 7 mg/kg; pantothenic acid, 22 mg/kg; niacin, 40 mg/kg; vitamin B6, 4 mg/kg; folic acid 0·3 mg/kg; vitamin B12, 33 µg/kg; Zn, 140 mg/kg; Fe, 80 mg/kg; Cu 9·5 mg/kg; I 1·5 mg/kg; Se, 0·25 mg/kg); urine acidifier 0·45 % (Diana Pet food, Descalvado, Brazil. Sodium chloride, DL-methionine, ammonium chloride, sodium bisulphate, ammonium sulphate, citric acid); taurine 0·20 %; calcium propionate 0·04 %; potassium sorbate 0·02 %; antioxidant 0·07 % (Alltech do Brazil Agroindustrial Ltda).
† Ingredient composition of the high-protein food: poultry by-product meal 35 %; maize grain 20·1 %; isolated pea protein 21·02 %; isolated swine protein 10 %; poultry fat 6·7 %; beet pulp 2·5 %, palatant enhancer 1·5 % (SPF Brasil); potassium chlorate 0·65 %, common salt 0·6 %; choline chloride 0·45 %; vitamin–mineral premix 0·7 % (Rovimix, DSM Produtos Nutricionais Brasil S.A.). Provided per kg of diet: vitamin A, 22 000 μg; vitamin D, 2200 μg; vitamin E, 90 μg; vitamin B1, 4 mg/kg; vitamin B2, 7 mg/kg; pantothenic acid, 22 mg/kg; niacin, 40 mg/kg; vitamin B6, 4 mg/kg; folic acid 0·3 mg/kg; vitamin B12, 33 µg/kg; Zn, 140 mg/kg; Fe, 80 mg/kg; Cu 9·5 mg/kg; I 1·5 mg/kg; Se, 0·25 mg/kg); urine acidifier 0·45 % (Diana Pet food, Descalvado, Brazil. Sodium chloride, DL-methionine, ammonium chloride, sodium bisulphate, ammonium sulphate, citric acid), taurine 0·20 %; calcium propionate 0·04 %; potassium sorbate 0·02 %; antioxidant 0·07 % (Alltech do Brazil Agroindustrial Ltda).
‡ sd of the two lots of production.
§ Used to access the quality of the extrusion processing(Reference Sá, Vasconcellos and Brunetto81).
|| Evaluated with seven cats per food by the total collection of faeces and urine method. Evaluated only in the first production lot.
Voluntary physical activity with triaxial accelerometer
Voluntary physical activity was evaluated using a triaxial accelerometer device (AC; Axy-4, TechnoSmart) attached to a chest collar placed on each cat. The cats were allowed to adapt to use a chest collar for 3–7 d, and then, when considered adapted, the accelerometer was fixed in the region of the neck, closer to the scapulae, for 3–4 consecutive days. The position of the accelerometer in the chest collar followed the manufacturer’s instructions (Fig. 1), close to the centre of mass of each animal(Reference Halsey, Shepard and Wilson41). The use of devices to estimate physical activity in cats was previously validated(Reference Lascelles, Hansen and Thomson42), allowing the objective measurement of voluntary physical activity without human interference. Strict recommendations to cat owners for this period were as follows: they must not hold the cat, maintain their usual in-home routine and not do unhabitual stimulus to movement, other than routinely done. The weekdays of test were not standardised, as it depended on owners’ availability. The available space for the cats varied according to each home, including animals housed in apartments and houses with available backyards, with or without environmental enrichment. However, all were then restricted to houses without access to the streets. Because all cats ate both foods and received accelerometers, the house environment effect was diluted by the crossover design.
The position of the 3-axyal accelerometer (TechnoSmart), (a) X = surge (walking front and back); Z = heave (movement to up and down); Y = sway (movement to right and left) and (b) illustration of accelerometer positioning in the cat.

Movement registration with the accelerometer was performed for at least 3 consecutive days for each cat. The equipment was configured at a frequency of 10 Hz, 16 g and 10-bit resolution. The X-, Y- and Z-axis data were smoothed for each second and subtracted from the corresponding unsmoothed data to generate the dynamic acceleration. The smoothed values on the three axes were converted into absolute values and added to generate the overall dynamic body acceleration (ODBA)(Reference Wilson, White and Quintana43).
Isotope application, evaluation and calculation procedures
Initial BC during each crossover period was evaluated using 2H oxide. A 7 % (70:930; v/v) solution of 2H at 99·9 atm% (Sercon Limited, Crewe, UK) and NaCl 0·9 % was prepared, and 1 ml per kilogram of body weight was injected into each cat(Reference Ferrioli, Pfrimer, Cruz, Dutra and Marchini44,Reference Zanghi, Cupp and Pan45) . The solution was subcutaneously applied between the scapulae after 12 h of fasting and after 2 h without water. Saliva samples were collected before solution injection and after 2 h to assess isotope enrichment in body water(Reference Goloni, Peres and Senhorello24). To increase injection accuracy, the syringe was weighed empty, with the isotope solution, and again after solution injection(Reference Ferrioli, Pfrimer, Cruz, Dutra and Marchini44). Saliva samples were collected according to Goloni et al. (Reference Goloni, Peres and Senhorello24), using hydrophilic cotton externally and adjacent to the mouth, next to the animal’s lips. To enable this procedure, salivation was stimulated by placing one drop of sodium dipyrone (500 mg/ml, EMS) onto the cat’s mouth, equivalent to 25 mg of dipyrone per cat. All animals were adapted to the saliva-sampling procedure, and their training was conducted without dipyrone administration. After dipyrone administration, the first piece of cotton was discarded and a second piece was used for a maximum of 5 min to collect saliva samples. The cotton was then placed in a 20-ml syringe, squeezed and a minimum of 1·5 ml of saliva per cat was stored in a cryotube with a screw cap sealed with paraffin at −20°C until analysis. Caution was taken to prevent the cotton from absorbing moisture from the air before use by keeping it in sealed bags. All procedures, including isotope injection and saliva sampling, were validated in cats(Reference Goloni, Peres and Senhorello24). All saliva collections were performed by a trained veterinarian (C.G.).
BC, EE and WT were determined using the DLW method in all cats at the end of the 4-month experimental food intake period. Isotopes (Sercon Limited) were administered at approximate doses of 0·12 g 2H at 99·9 atm% and 2 g 18O at 10 atm% per kilogram of body water(Reference Ferrioli, Pfrimer, Cruz, Dutra and Marchini44). A 6:100 (v/v) solution of 2H at 99·9 atm% and 18O at 10 atm% was prepared and subcutaneously applied between the scapulae after 12 h of fasting and after 2 h without water. Then, 0·3 ml of 20 % NaCl was mixed and infused together to increase the isotope solution osmolality close to the interstice, avoiding discomfort to the cats(Reference Goloni, Peres and Senhorello24). To increase the accuracy of the injection, the syringe was weighed empty, with the 20 % NaCl solution, with the isotope solution and again after injection(Reference Ferrioli, Pfrimer, Cruz, Dutra and Marchini44). Saliva samples were collected before solution injection, after 2 h to assess isotope enrichment, and three times from days 4–12 to evaluate the isotope elimination rate from body water. Saliva samples were collected and stored as previously described(Reference Goloni, Peres and Senhorello24).
The isotope concentration in saliva was evaluated at the Mass Spectrometry Laboratory of Ribeirão Preto Medical School, São Paulo, Brazil. Isotopes were analysed using isotope ratio mass spectrometry (ANCA 20–20; PDZ Europa). Samples for 2H were processed in duplicate (200 μl per replicate) with platinum in vacutainers, after 6 h of resting. Samples for 18O were processed in duplicate (200 μl per replicate) by filling the tubes with CO2 after 24 h of resting(Reference Ferrioli, Pfrimer, Cruz, Dutra and Marchini44).
The pool size for 2H or 18O for total body water was calculated as follows (considering a linear elimination response)(Reference Schoeller46):
 $$N\;\left( {mol} \right) = \left( {{{WA} \over {18,02a}}\;} \right) \times {{\left( {\delta a - \delta t} \right)} \over {\left( {\delta s - \delta p} \right)}}$$
where N is the pool size of body water; W is the amount of water used to dilute the labelled water dose; A is the weight of labelled water administration (g); a is the diluted dose for analysis; δ is the enrichment of dose (a), dilution water (t), post-dose sample (s) and pre-dose baseline (p) samples.
To calculate total body water with 2H, a correction factor was used because of isotope incorporation in non-aqueous organic molecules during biosynthesis(Reference Racette, Schoeller and Luke47) using the following formula(Reference Ellis and Wong48):
 $${\rm TBW=Nd} \div {f}$$
where TBW is the total body water, Nd is the pool size of body water with 2H and f is the correction factor according to the Nd:No (No = pool size of body water estimated with 18O) ratio for each evaluated body fluid.
The LM of the cats was calculated considering a hydration constant of 73·2 % for mammals using the following equation: LM (kg) = body water (kg)/0·732. Fatty body mass (FM) was estimated as follows: total body mass (kg) – LM (kg) of the animal(Reference Pace and Rathbun49). The cats were considered overweight when their FM was ≥ 25 %(Reference Cline, Burns and Coe30).
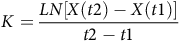
A two-point formula was used to calculate 2H and 18O elimination rate(Reference Schoeller50):
 $$K = {{LN\left[ {X\left( {t2} \right) - X\left( {t1} \right)} \right]} \over {t2 - t1}}$$
where K is the rate constant for 2H (Kd) and 18O (Ko), Ln is the natural logarithm, X(t2) is the sampling point for isotope elimination, X(t1) is the sampling point for isotope enrichment, t1 is the day of isotope enrichment sampling and t2 is the day of isotope elimination sampling.
The amount of CO2 produced was calculated using the following formula(Reference Lifson and McClintock51):
 $$rCO2\;\left( {{{mol} \over {day}}} \right) = \;\left( {{N \over {2\cdot08}}} \right) \times \;\left( {Ko\; - \;Kd} \right) - \;0\cdot015 \times Kd \times N$$
where rCO 2 is the CO 2 production, N is the dilution space for 18O, Ko is the rate constant of 18O in body water and Kd is the rate constant of 2H in body water.
Finally, the EE of cats was calculated as follows(Reference Elia and Livesey52):
 $$EE\;\left( {{{kj} \over {day}}} \right) = rCO2 \times 22\cdot4\left( {{{3\cdot7} \over {FQ}} + 1\cdot326} \right) \times 4\cdot18$$
where EE is the energy expenditure, rCO 2 is the CO 2 production and FQ is the food quotient.
The FQ was calculated considering the digestible nutrient content of the two foods, as determined in vivo with seven cats per diet using the total collection of faeces(35). The following equation was used(Reference Black, Prentice and Coward53):
 $$FQ = {{\left( {P \times 0\cdot781} \right) + \left( {F \times 1\cdot427} \right) + \left( {S \times 0\cdot746} \right)} \over {\left( {P \times 0\cdot996} \right) + \left( {F \times 2\cdot019} \right) + \left( {S \times 0\cdot746} \right)}}$$
where FQ is the food quotient, P is the digestible protein, G is the digestible fat and A is the digestible starch content of each diet.
The body WT rate was calculated as Hendriks et al. (Reference Hendriks, Wamberg and Tarttelin54), assuming that little to no water is lost via evaporative routes subject to isotope fractionation:
 $$\;WT\;\left( {{{ml} \over {day}}} \right) = Nd \times Kd \times 18\cdot02$$
where WT is the water turnover rate, Nd is the 2H body water and Kd is the 2H rate constant.
Evaluation of the satiety response to the meal in laboratory cats
As a complementary observation to support the interpretation of the ad libitum food intake observed in the study with owned cats, the possible influence of the HS (38 % CP) and HP (55 % CP) diets on the voluntary consumption of a challenge food was measured in a controlled environment with laboratory cats, thus indirectly assessing satiety. The purpose was to explore if the kinetics of intake, the intake of a high palatable diet or the intake of the experimental diet after cats were exposed to a challenge meal might differ between treatments, in order to compare this voluntary intake in laboratory conditions with the ad libitum intake in a home situation. Sixteen neutered and spayed cats were used, including nine non-overweight (4·13 (s d 0·99) years; 3·96 (sd 0·76) kg; BCS 5·00 (sd 0·00); four females and five males) and seven overweight (overweight condition was naturally developed; 5·88 (sd 1·25) years; 4·79 (sd 0·68) kg; BCS 7·13 (sd 0·96); six females and one male). In a crossover design, cats were fed controlled amounts of the two experimental diets in a randomised order for 30 d, and satiety evaluation was conducted on the last 3 d of each period. On these days, in addition to the experimental diet, the cats were exposed to a commercial food of good palatability to verify it for consumption (metabolisable energy: 17·3 kJ/g; 41 % CP, 19 % crude fat, 2 % crude fibre on DM basis; Guabi Natural Gatos, Affinity Pet Care). During the satiety study, cats were housed for 16 h (from 16.00 to 08.00) in metabolic cages (all cats were adapted to the procedure; 0·65 × 0·85 × 0·65 cm). The food used was familiar to the animals and was selected to avoid neophobia or neophilia. On these 3 d, the cats received half their daily experimental diet at 16.00, which was available for 4 h, until 20.00 At 20.00, they received an ad libitum amount of the challenge diet for 1 h (until 21.00). At 21.00, the leftovers of the challenge food were collected and weighed, and the second half of the experimental diet was offered, which remained available for 11 h until 08.00 the next day. The quantities of the experimental and challenge diets were weighed, as were the leftovers, and the consumption was calculated. The intention was to verify whether the composition of the food interfered with the consumption of a second meal, limiting or even stimulating its intake by cats. The greater or lesser consumption of the challenge and experimental diets was used to indirectly interpret the satiety sensation of cats(Reference Loureiro, Sakomura and Vasconcellos55). For the analysis of the results, the mean intake of the 3 d of the test was used.
Statistical analysis
Each cat was considered an experimental unit. The test power was set at 0·8 with α = 0·05. The variance between treatments (mean square) and within treatments (mean square of residue) was used following ANOVA (power.ANOVA.test test in R software) to obtain the minimum sample size for EE, resulting in five cats per treatment, which ensured adequate comparison of the main outcomes. The study followed a crossover design and was organised in a factorial arrangement of treatments with two diets × two sexes × two body conditions, totalling eight experimental treatments. The analysis was organised considering the effects of diet, sex and body condition and the interactions of diet × sex, diet × body condition, sex × body condition and diet × sex × body condition. The age of the cats (years) differed between groups (P ≤ 0·05); as such, age was used as a covariate in the statistical model. When differences were verified by the F test, means were compared using the Tukey test for the variables BC, EE, WT and physical activity. For the physical activity results, the AUC was calculated using the integration trapezoidal method (GraphPad Prism; GraphPad Software), and the ODBA total area was used to compare treatments. Additionally, the total area of the ODBA peaks was calculated using data above 1 g to compare the treatments. Inside each food group, the body weight, FM and LM of cats at the beginning and after the period of food intake were compared using a paired Student’s t test. Student’s t tests were used to compare these variables between the diets at the beginning and final periods. The BCS was evaluated using the non-parametric Wilcoxon test. When of interest, the relationships among BC variables, EE, WT, movement parameters and nutrient intake were assessed using Pearson correlation analysis and linear regression after adjusting the factorial model on the residuals of the variables. The study of satiety response to the meal in laboratory cats followed a crossover design and was organised in a factorial arrangement of treatments with two diets × two body conditions, totalling four experimental treatments. The analysis was organised considering the effects of diet and body condition and the interaction of the diet × body condition. Statistical significance set at P ≤ 0·05 was considered significant and P ≤ 0·10 as a tendency. All data complied with the presuppositions of the variance analysis. Analyses were performed using Proc MIXED in SAS statistical software (SAS Institute) or R software version 3.6.3 (R Foundation).
Results
The experiment began in November 2019 and was completed in January 2021. A total of 108 client-owned cats were included in this study. Of these animals, ninety-five were subjected to physical examination and blood work and their owners were interviewed about their possibility of completely following the study requirements. Of these cats, forty-three started the project; however, thirteen animals were removed as their owners decided not to complete the study. During the study, the living environment of three cats changed in one of the crossover periods because the owner moved to another house with a large backyard, and that period was not considered in the study. A male obese cat started to have access to the street, and because of this the animal lost body weight, and this period was also not considered. One female lean cat gained body weight when fed the HP (55 % CP) diet; therefore, in the second period, she was moved to the F-OB group to start the HS (38 % CP) diet. One male lean cat did not accept the HS (38 % CP) diet; therefore, it was excluded from the study.
Thirty cats belonging to twenty-three owners completed the project. Cats that completed the study were divided into the following groups: F-NO with 2·9 (sd 2·1) years (n 9), F-OB with 4·2 (sd 1·6) years (n 7), M-NO with 2·0 (sd 1·1) years (n 9) and M-OB with 4·5 (sd 2·6) years (n 5). The mean age of the groups differed significantly (P < 0·05), and age was used in the statistical analysis as a covariate.
The cats ate the foods adequately, and according to their owners, both foods were well accepted, adaptation to the new diets was easy and the faeces produced were adequate. Food management was performed only by the owner in 30·4 % (n 7) of the houses and by the owner and another relative that lived at home in 69·6 % (n 16) of houses. Food was provided ad libitum and placed once a day in 65·2 % (n 15) of the houses and twice a day in 34·8 % (n 8) of the houses. In all cases, leftovers were present in the bowl before the next meal, assuring an ad libitum intake. Six owners admitted supplying a small number of snacks (less than 10 % of the daily calories of the cat), in a frequency of once a week (n 2 owners), once every two weeks (n 1 owner) and once a month (n 3 owners). Ten owners reported that blood collection for health assessment was a stressful situation for their cats, six owners indicated that saliva collection using the DLW method was stressful for their cats, two owners indicated that both blood and saliva collection were stressful situations and five owners answered that none of the sample collection procedures was stressful for their cats. The chest collar was difficult to use in six cats, and they did not participate in the physical activity evaluation. Nine owners did not change the cat’s activity during the period of physical activity evaluation; seven owners admitted that they changed the cat’s routine, especially holding their cats in their arms as they usually did; and seven owners did not remember if they interfered with the cat’s activity. For all owners (n 23), the greatest difficulty of the study protocol was to keep cats fasted for 12 h prior to starting the DLW method.
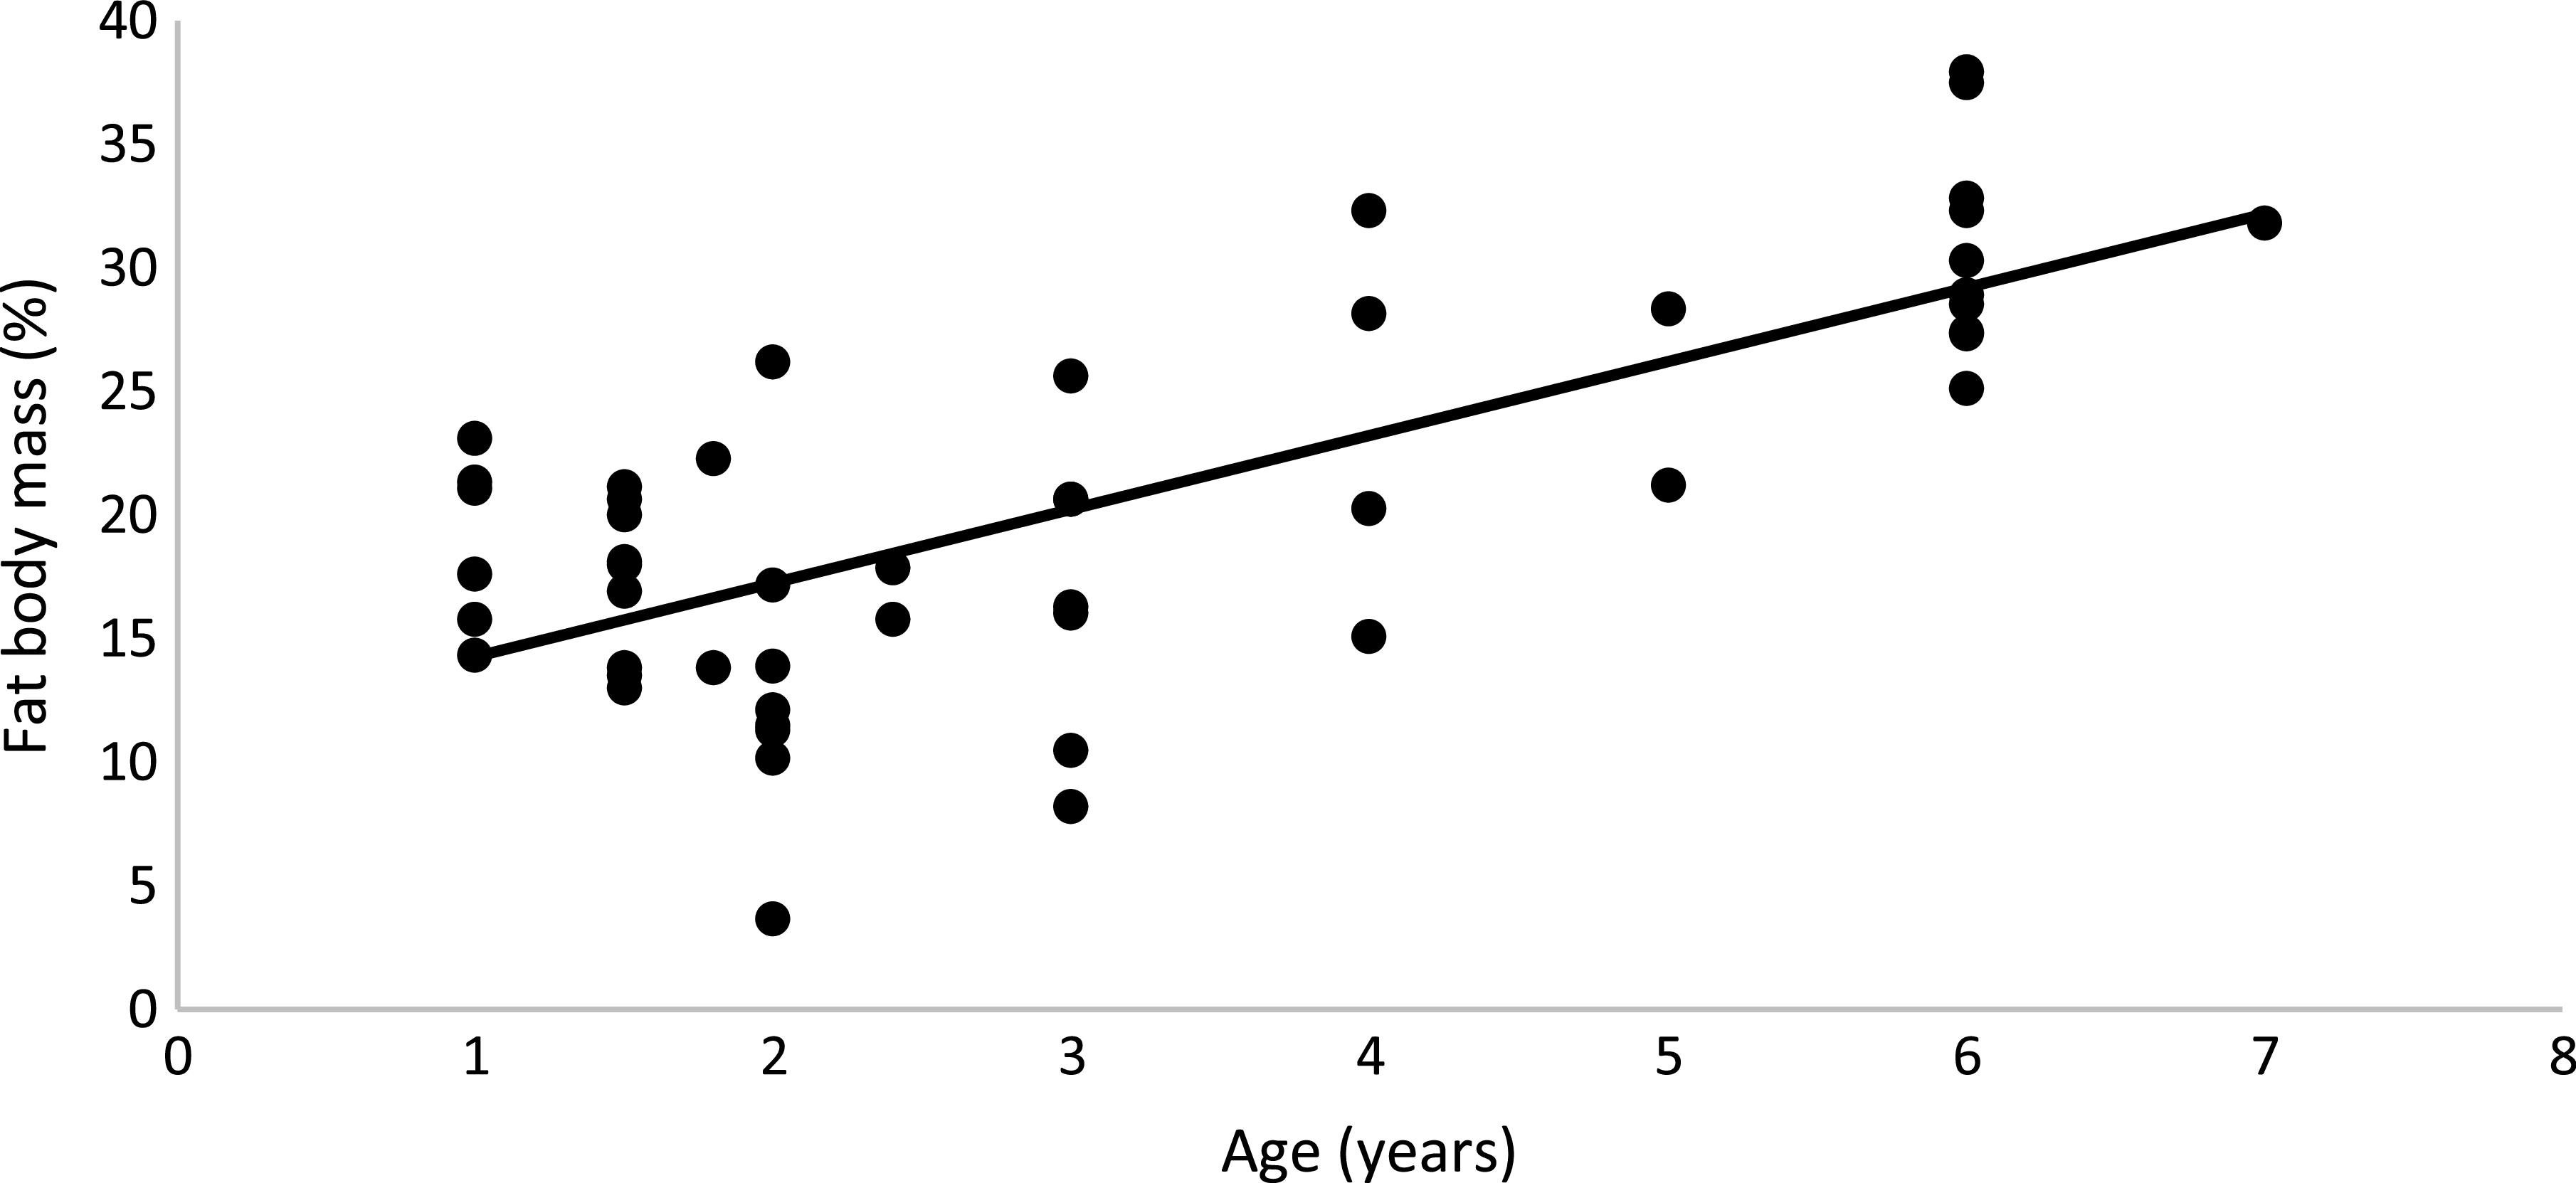
The results of BC showed that regardless of sex and diet, obese cats had higher FM (OB: 30·7 (s e 1·10) % and 1·81 (se 0·12) kg; NO: 15·8 (se 0·70) % and 0·66 (se 0·04) kg; P < 0·01), lower LM in percentage (OB: 69·3 (se 0·96) %, NO: 84·7 (se 0·74)%; P < 0·01) and higher LM in kilograms (OB: 3·92 (se 0·16) kg; NO: 3·4 (se 0·11) kg; P < 0·01) than non-obese cats, as expected. Male cats, regardless of BC and diet, had higher LM in kilograms than female cats (M: 4·11 (se 0·04) kg; F: 3·22 (se 0·05) kg; P < 0·01), but the values were similar in percentage (M: 77·4 (se 0·9) %; F: 75·5 (se 0·8) %; P = 0·13). Males and females had the same FM in percentage and in kilograms (M: 22·69 (se 0·91) %, 1·32 (se 0·12) kg; F: 23·69 (se 0·83) %, 1·16 (se 0·13) kg; P > 0·10). Age also affected BC; as age increased, FM (%) increased (FM (%) = 11·286 + 2·985 × Age (years); R2 0·51; P < 0·001; n 50; Fig. 2).
Linear regression between age (years) and % of fatty mass: y = 2·985x + 11·286; R² 0·51; P < 0·001; n 50.
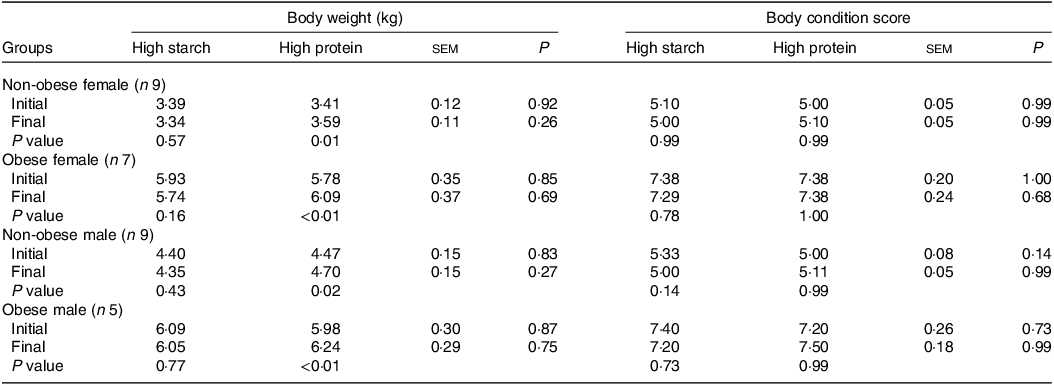
When fed the HS (38 % CP) diet, the body weights of cats (Table 2) did not change for any sex or body condition (P > 0·05). However, the HP (55 % CP) diet induced weight gain in all groups (P < 0·05). The BCS did not change in any group or diet, and no differences between the diets were observed in the body weight or BCS of the cats (P > 0·05).
Initial and final body weight and body condition score of client-owned neutered cats fed ad libitum for 4 months diets with different starch to protein ratios (Standard error of the means)
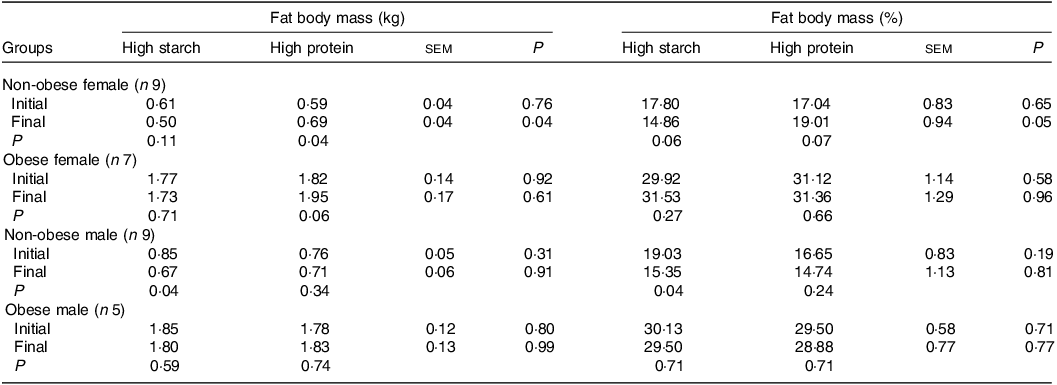
When fed the HS (38 % CP) diet, M-NO cats presented a reduction in FM (Table 3), both in kilograms and percentage (P = 0·04), and F-NO cats tended to present a reduction in FM percentage (P = 0·06). However, when fed the HP (55 % CP) food, the FM in kilograms increased in F-NO (P = 0·04) and tended to increase in F-OB cats (P = 0·06), and the FM percentage tended to increase in F-NO cats (P = 0·07). Due to this, although F-NO cats presented the same BC for both diets at the start, F-NO cats fed the HP (55 % CP) food showed more FM by the end of the period, both in kilograms (190 g higher) and percentage (4·15 % higher), than when fed the HS (38 % CP) food (P < 0·05).
Initial and final fat body mass of client-owned neutered cats fed ad libitum for 4 months diets with different starch to protein ratios (Standard error of the means)
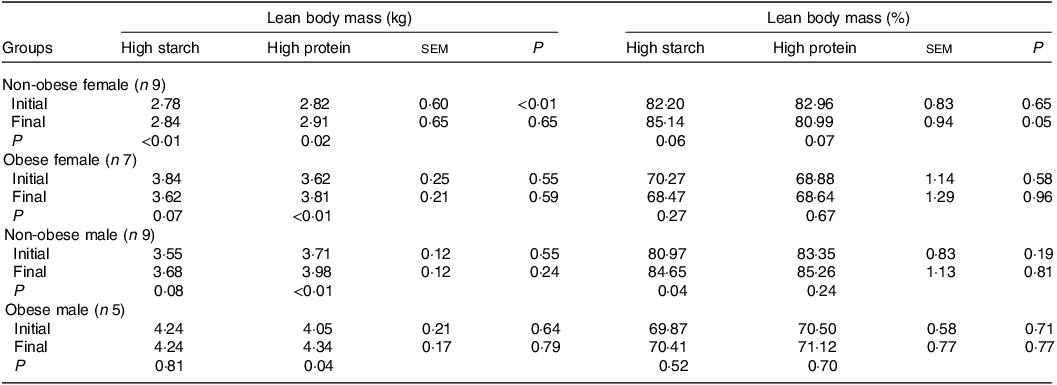
When fed the HS (38 % CP) diet, LM increased in F-NO cats (P < 0·01) and tended to increase in M-NO cats (P = 0·08), as observed in Table 4. LM percentage also increased in M-NO cats (P = 0·04) and tended to increase in F-NO cats fed the HS (38 % CP) diet (P = 0·06). During the period receiving the HP (55 % CP) formulation, all cat groups gained LM in kilograms (P < 0·05), although the LM percentage tended to decrease in the F-NO cats (P = 0·07) and did not change in the other three groups (P > 0·10). The only group that tended to reduce the LM (kg) in this study was the F-OB cats (P = 0·07) fed the HS (38 % CP) diet, for which LM was 220 g (4·3 %) lower than the initial and final values.
Initial and final lean body mass of client-owned neutered cats fed ad libitum for 4 months diets with different starch to protein ratios (Standard error of the means)
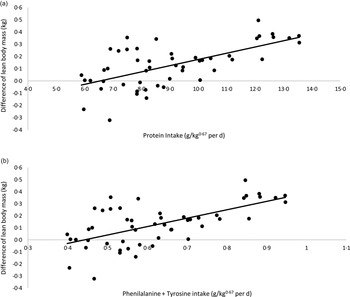
To understand the LM variation of the cats, the CP and amino acids intake was calculated considering the EE estimated by the DLW method, and the protein, amino acids and metabolisable energy content (determined in vivo) of each diet. When the CP and amino acid intakes of each cat group were verified, the values were generally greater than those suggested by FEDIAF(56). However, the F-OB cats fed the HS (38 % CP) diet had a lower EE than the other groups, resulting in an estimated mean intake of 6·45 (se 0·39) g of CP/kg0·67 per d. Although this value of CP consumption was 3 % higher than the minimum recommended by FEDIAF(56), considering the amino acid composition of this diet, the estimated mean intake of phenylalanine + tyrosine (0·44 (se 0·03) g/kg0·67 per d) for this cat group was very close to the minimum recommended(56). In addition, two cats in the F-OB group that were more than 5 years old and fed the HS (38 % CP) diet had low EE values of 270 kJ and 221 kJ/kg0·67 per d. Due to this lower EE, their calculated intake of CP was 5·88 g and 4·81 g of CP/kg0·67 per d, respectively, and that of phenylalanine + tyrosine was 0·40 g and 0·33 g /kg0·67 per d, respectively. These values were 10 % and 25 % below the recommended minimum value, justifying the loss of LM in this group of cats.
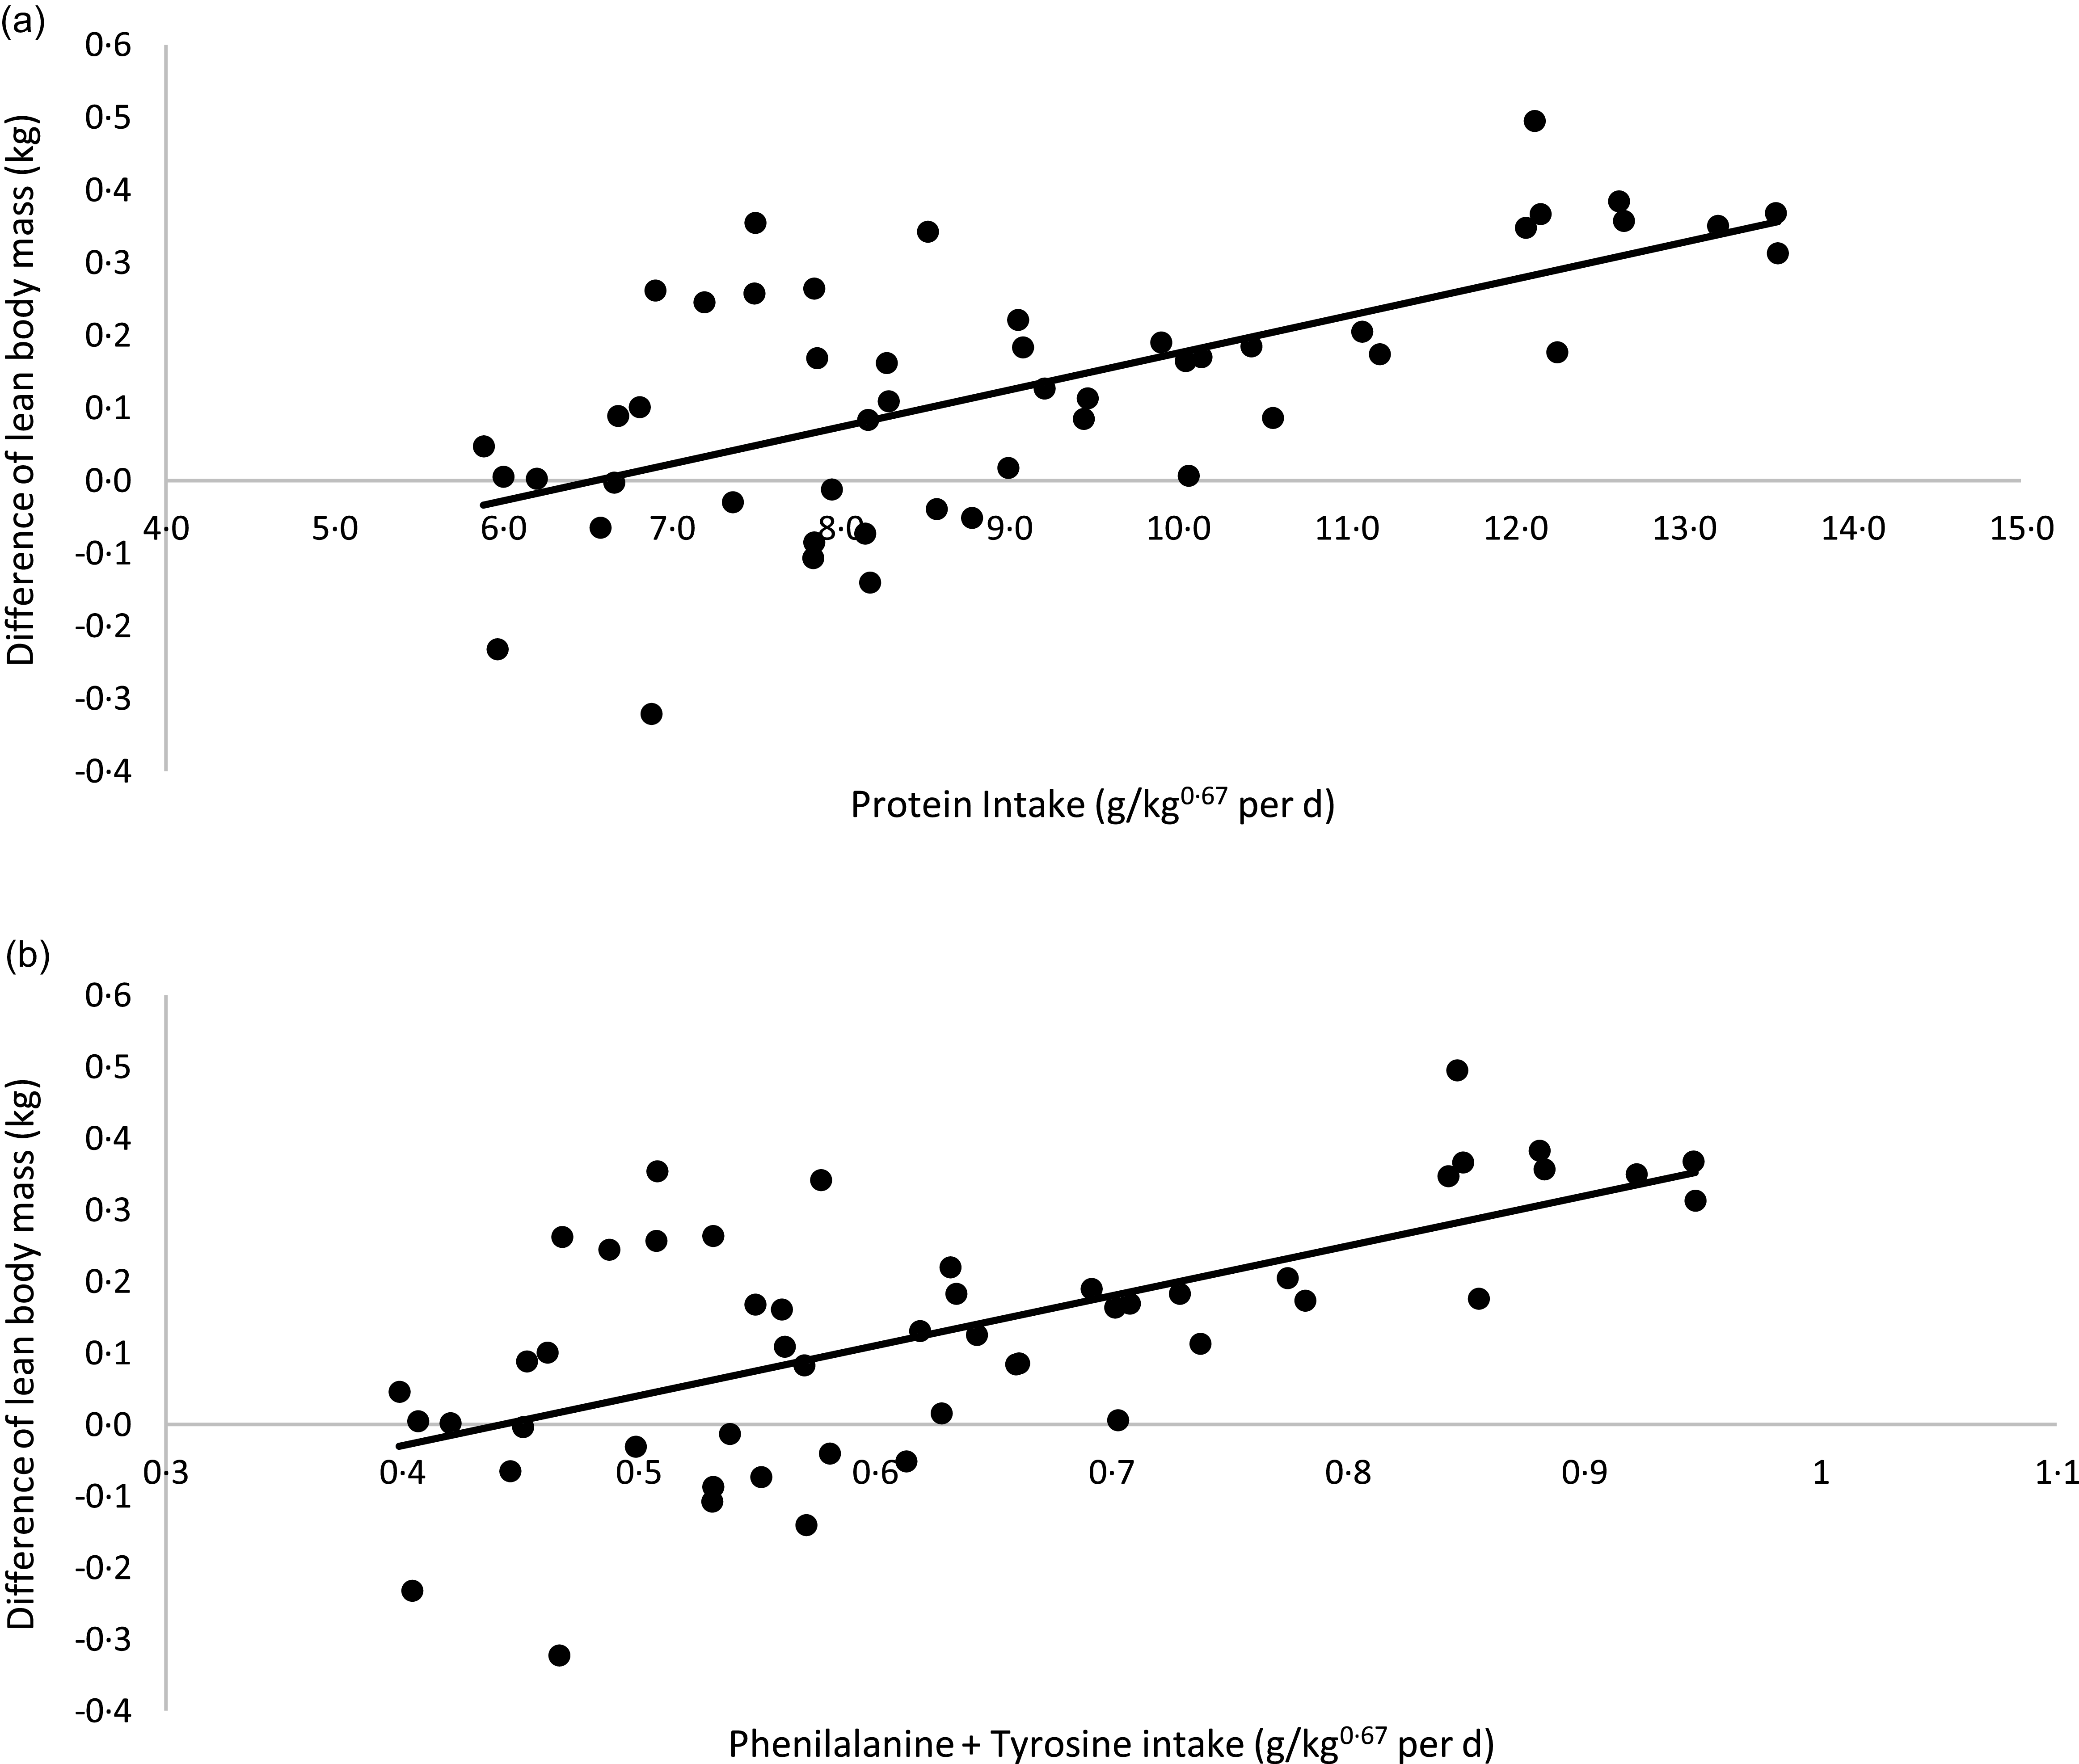
A linear regression between CP and phenylalanine + tyrosine intake (x-axis) and the differences in LM verified at the beginning and end of each period of the crossover (final LM kg – initial LM kg; y-axis) is presented in Fig. 3. The correlation between CP intake and LM variation was as follows: LM variation (kg) = 0·0508 × CP intake (g/kg0·67 per day) – 0·3328; R 2 0·40; P < 0·01; n 50. According to this model, in the conditions of the present study, cats would need approximately 6·55 g of CP/kg0·67 per d to present a stable LM. Considering phenylalanine + tyrosine intake, the equation was: LM variation (kg) = 0·6978× phenylalanine + tyrosine intake (g/kg0·67 per d) – 0·3087; R 2 0·40; P < 0·01; n 50). For a stable LM, in the conditions of the current study, cats would need to eat 0·44 g of phenylalanine + tyrosine/kg0·67 per d, the same value proposed by FEDIAF(56).
Linear regression between: (a) protein intake v. difference in lean body mass: y = 0·0508x −0·3328; R² 0·40; P < 0·01; n 50). (b) Phenylalanine + tyrosine intake v. difference in lean body mass (y = 0·6978x −0·3087; R² 0·40; P < 0·01; n 50).
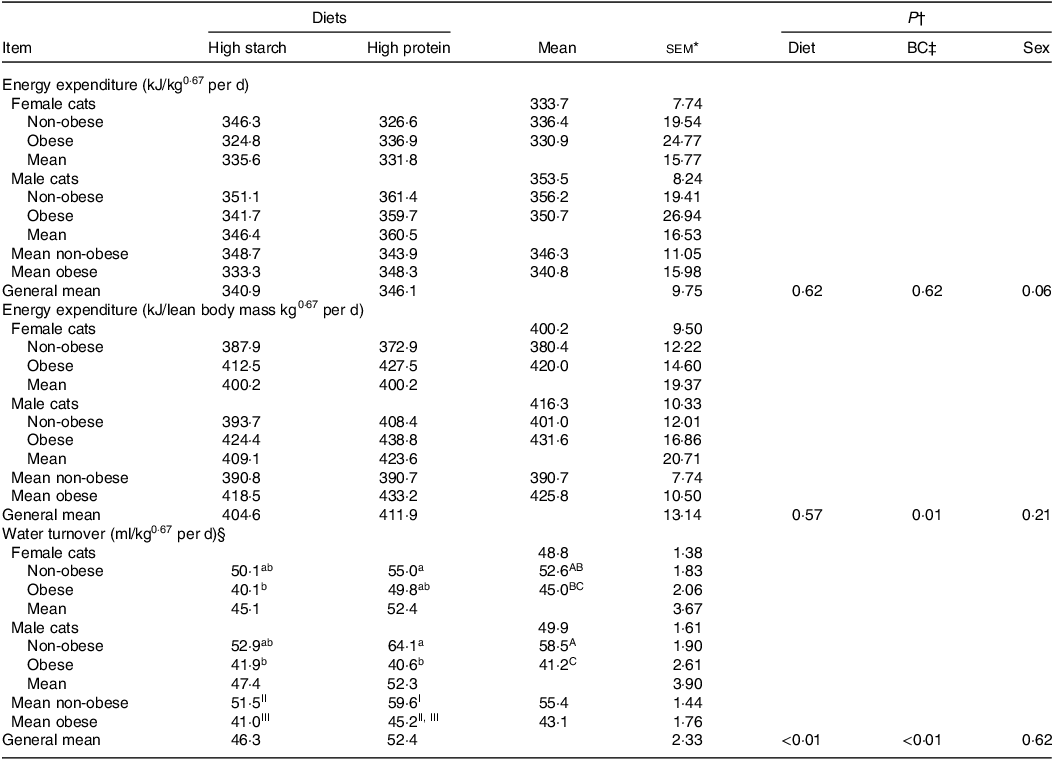
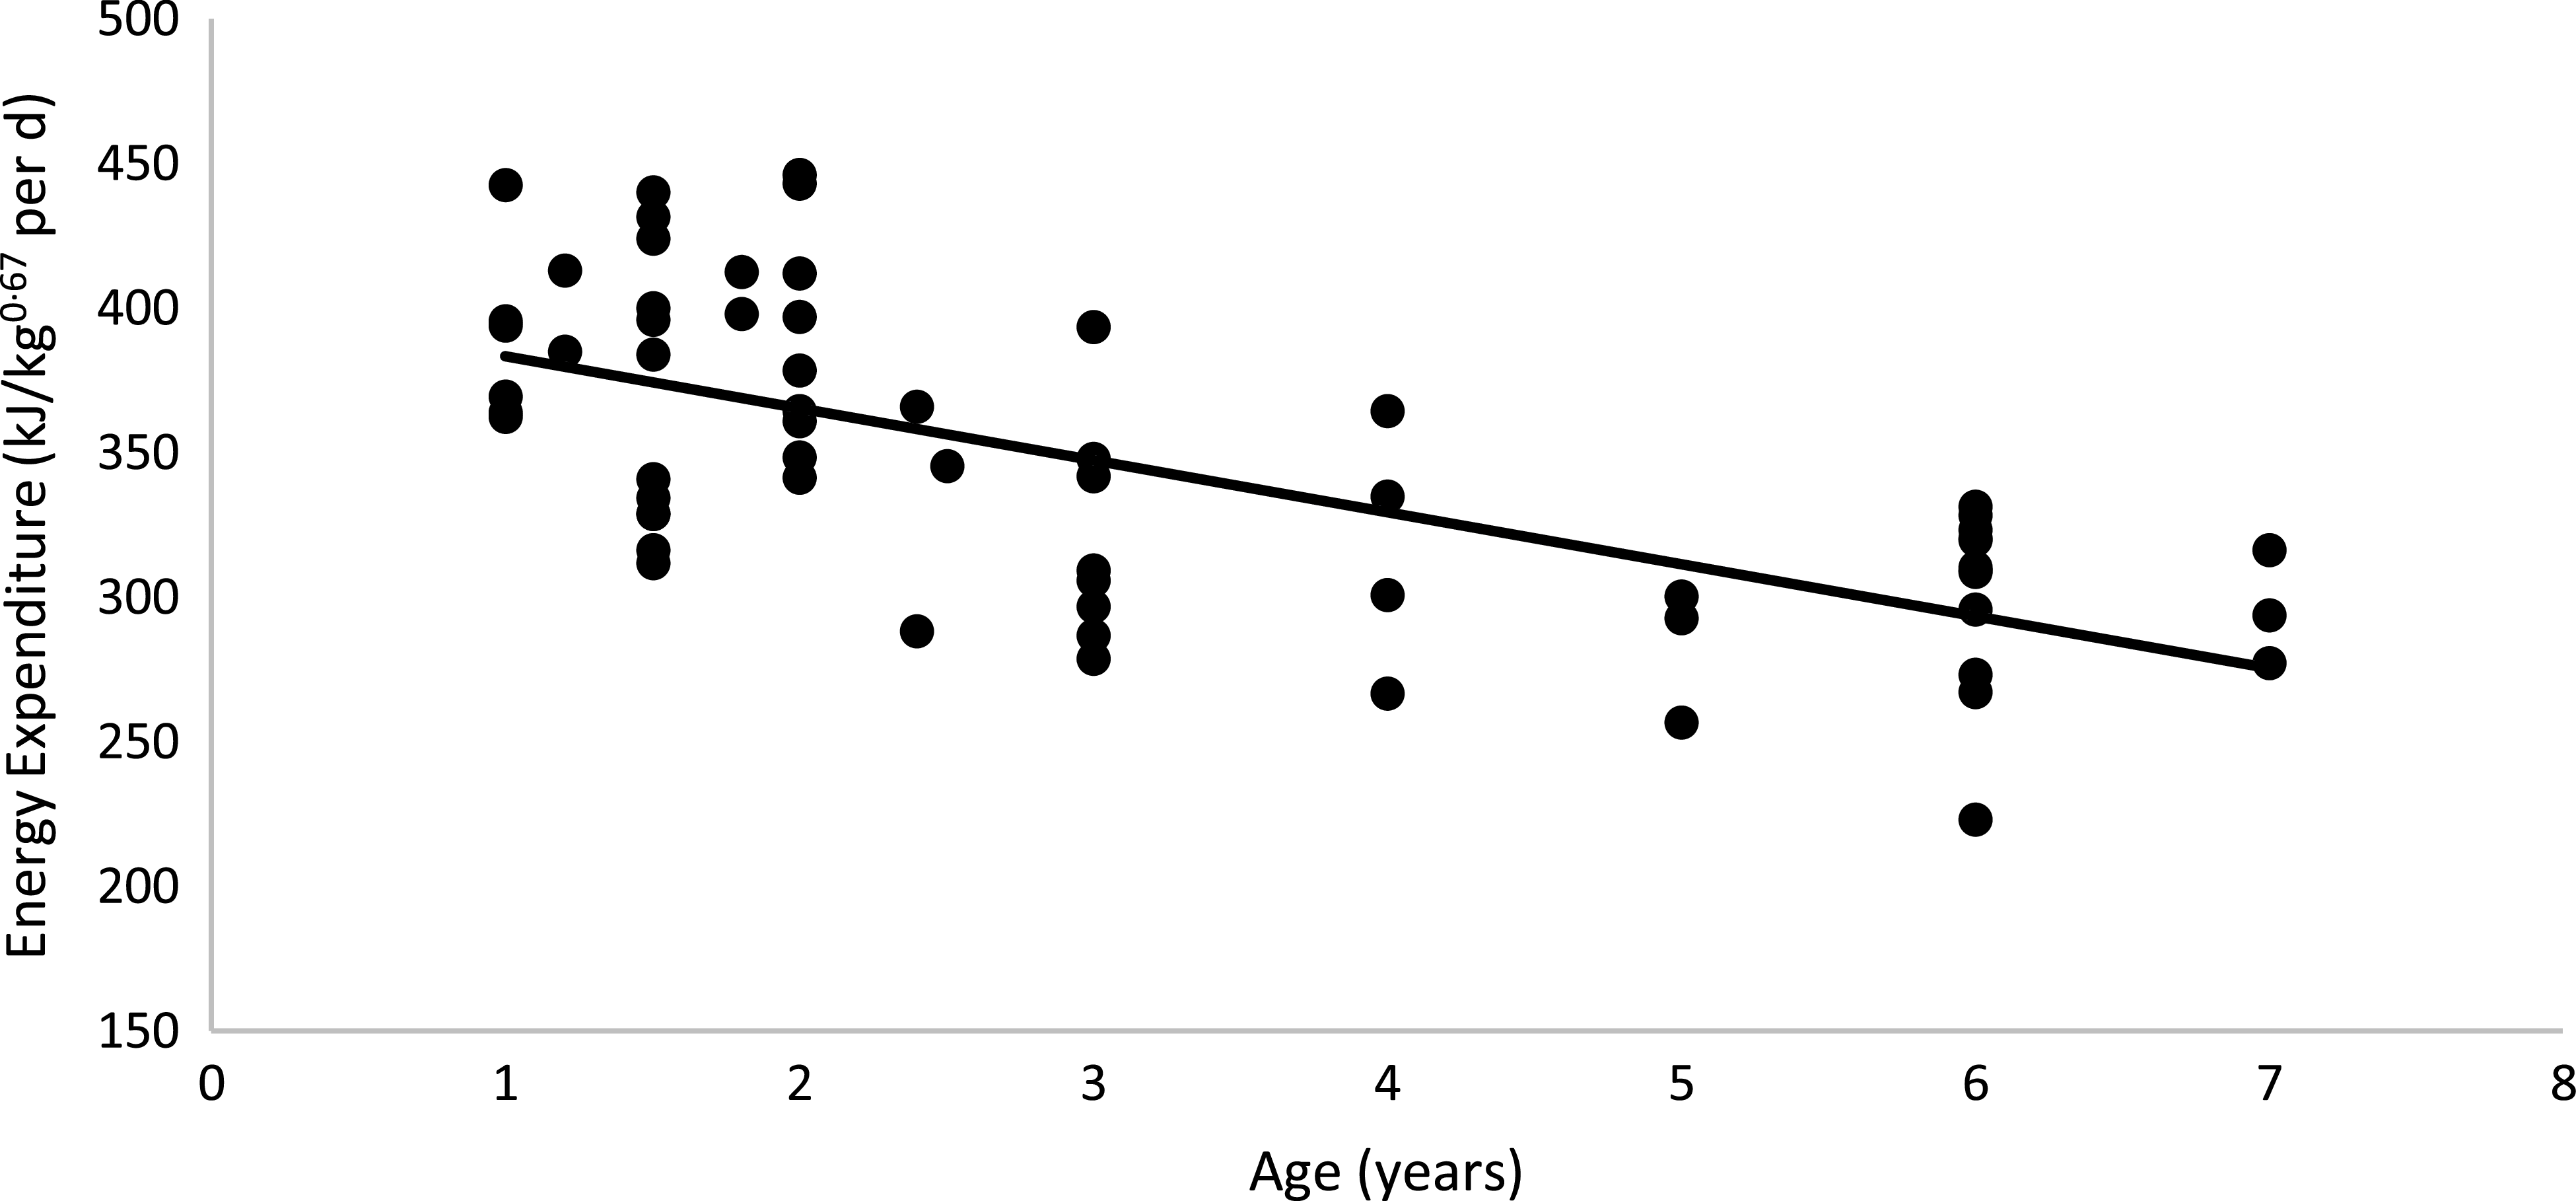
No diet or body condition effects were observed for EE (P = 0·62). No interactions between diet, body condition or sex were observed for EE. The mean daily EE (kJ/kg0·67 per d), regardless of diet and body condition, tended to be higher in males than in females (M: 353·46 (se 7·74); F: 333·67 (se 8·24) kJ/kg0·67 per d; P = 0·06), as shown in Table 5. When computed on an LM basis, obese cats presented a higher EE than non-obese animals (OB: 425·80 (se 10·50) kJ/kg; NOB: 390·70 (se 7·74) kJ/kg of LM0·67 per d; P < 0·01). Age was used as a covariate in the statistical model because of its effect on EE in cats. The linear regression between EE and age was described as: EE (kJ/kg0·67 per d) = −17·976 × (Age in years) + 401·32 (R 2 0·45; P < 0·01; n 64; Fig. 4). According to this model, every year of life resulted in a reduction of 17·97 (se 4·36) kJ/kg0·67 per d in EE.
Energy expenditure and water turnover of client-owned neutered cats fed ad libitum for 4 months diets with different starch to protein ratios (Standard error of the means)
* female non-obese, n 9; female obese, n 7; male non-obese, n 9; male obese, n 5.
† P value: For EE interaction not found for diet × body composition (P > 0·05).
‡ BC, body condition.
§ For water turnover: diet × body condition × sex interaction was verified (P = 0·03). a, b, c – means inside each sex without a common lowercase letter differs; body condition × sex interaction was verified (P = 0·05). A, B, C – means in the column without a common uppercase letter differs; body condition × diet (P = 0·05). I, II, III – general means for non-obese or obese without a common Roman number differs.
Linear regression between energy expenditure v. age of the cat: y = −17·976x + 401·32; R 2 0·45; P < 0·01; n 64.
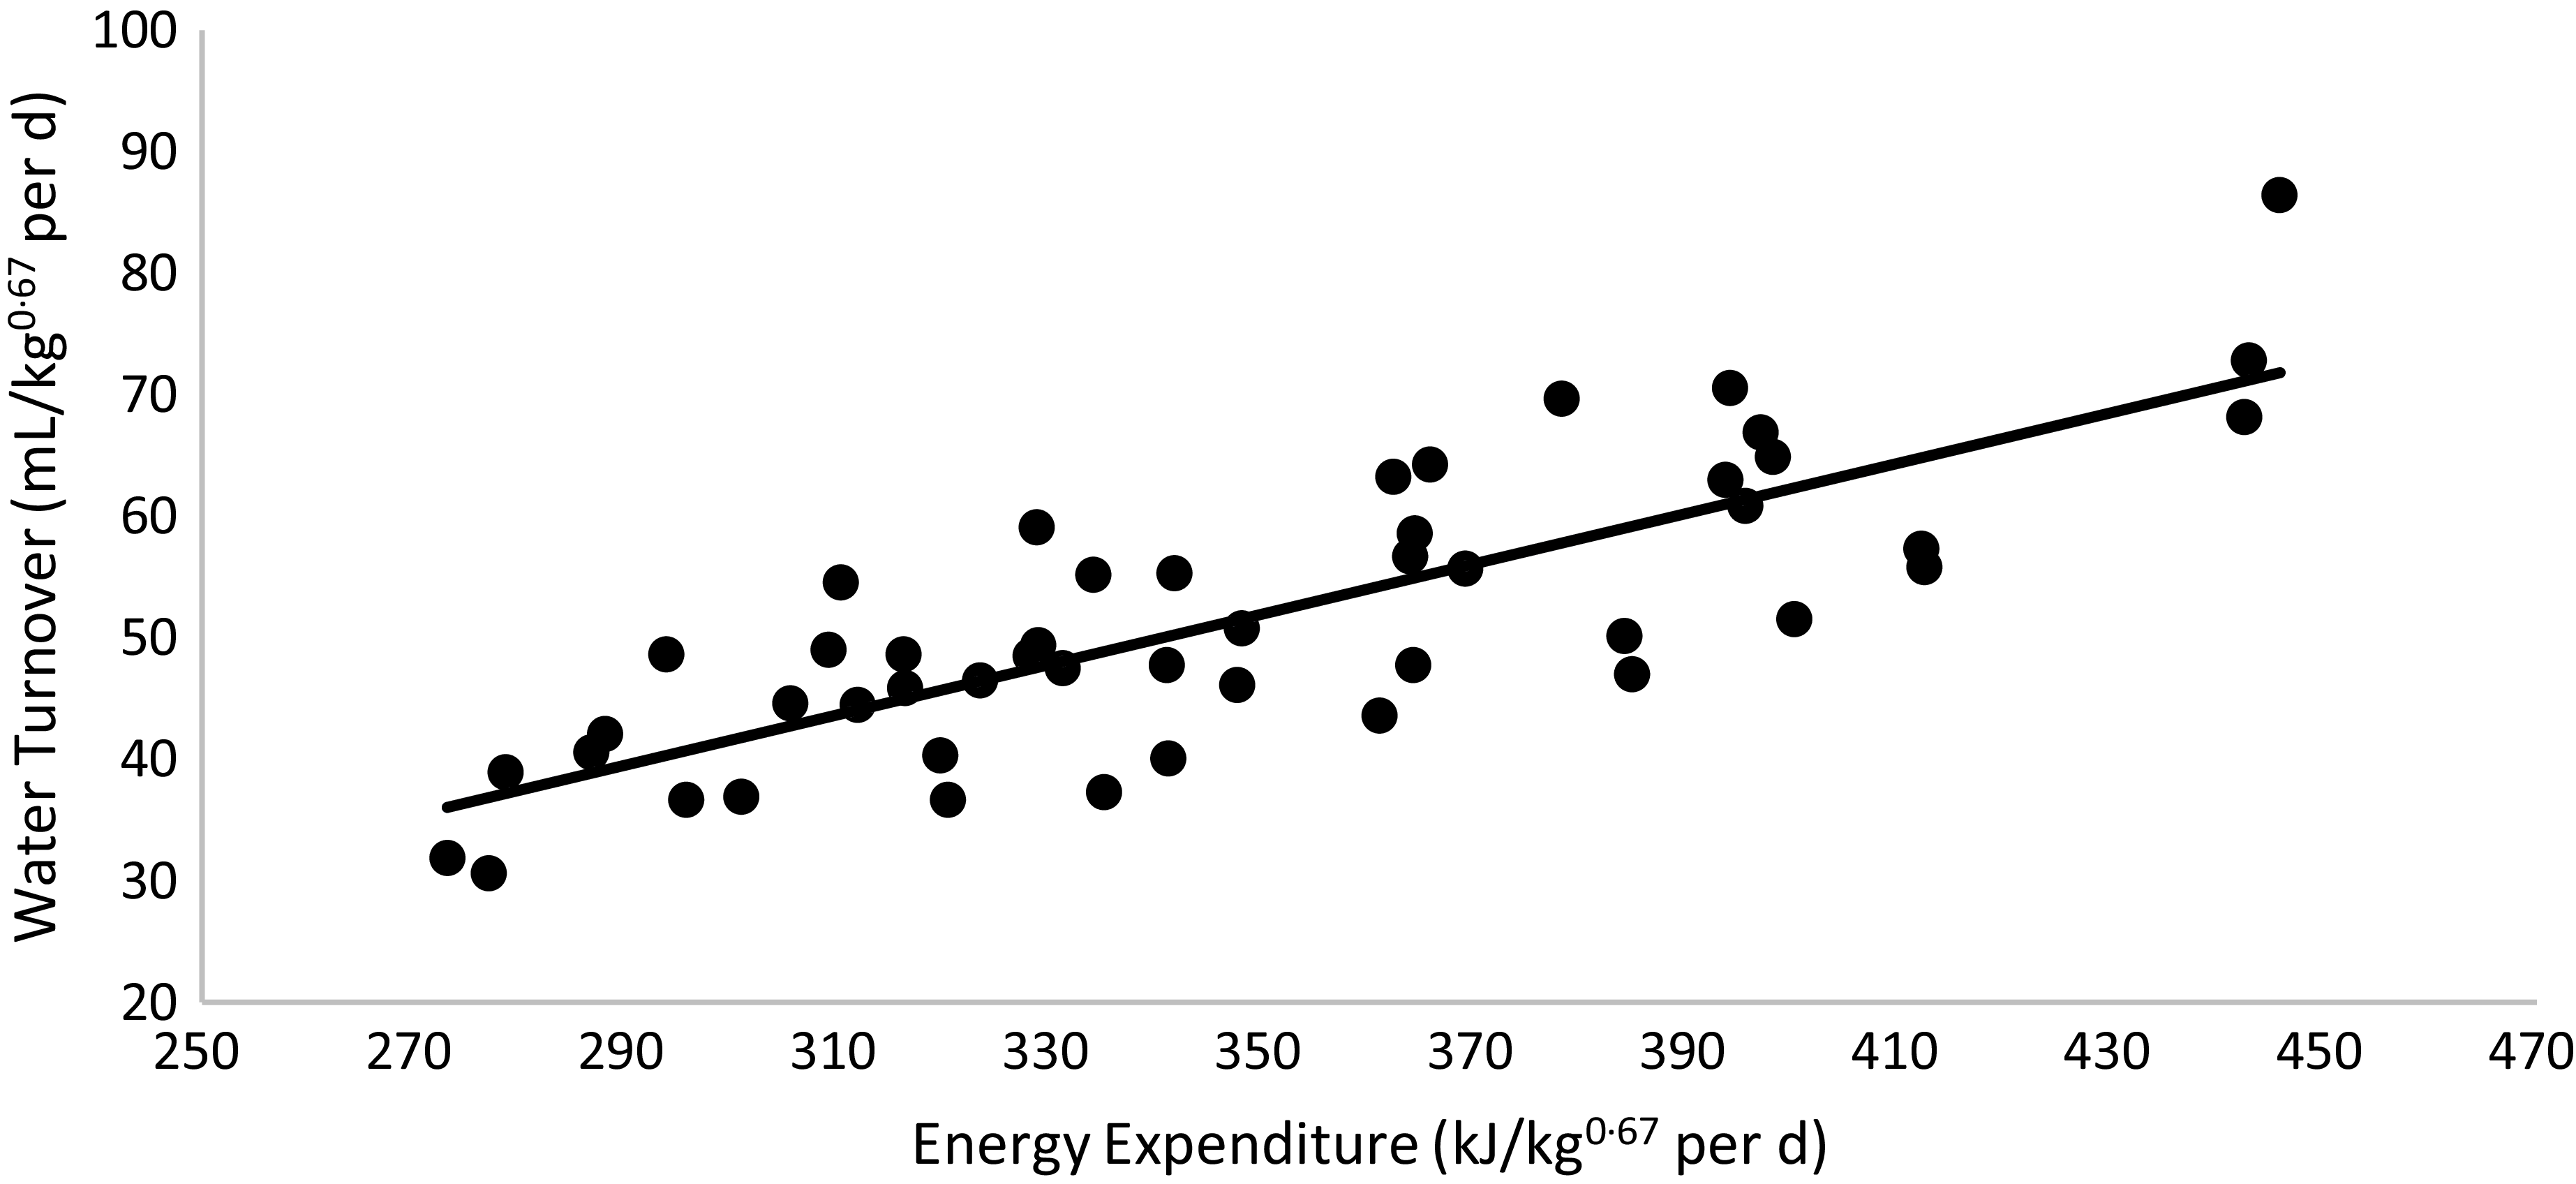
WT was higher in cats fed the HP (55 % CP) diet than in those fed the HS (38 % CP) diet (P < 0·01) and higher in non-obese cats than in obese cats (P < 0·01). A triple interaction of diet × body condition × sex (P = 0·03) was observed. Regardless of diet, WT was higher in non-obese males and females, intermediate in F-NO and lower in M-OB animals. Within each sex, WT was higher in non-obese cats fed the HP (55 % CP) diet and lower in obese cats fed the HS (38 % CP) diet (P < 0·05). WT presented a positive correlation with EE: water turnover (ml/kg0·67 per d) = 0·2072 × energy expenditure (kJ/kg0·67 per d) – 20·539 (R 2 0·65; P < 0·01; n 49; Fig. 5). According to this equation, the WT corresponds to 0·151 (se 0·004 ml) for each kJ of EE per day.
Linear regression between energy expenditure v. water turnover: y = 0·2072x – 20·539; R 2 0·65; P < 0·01; n 49.
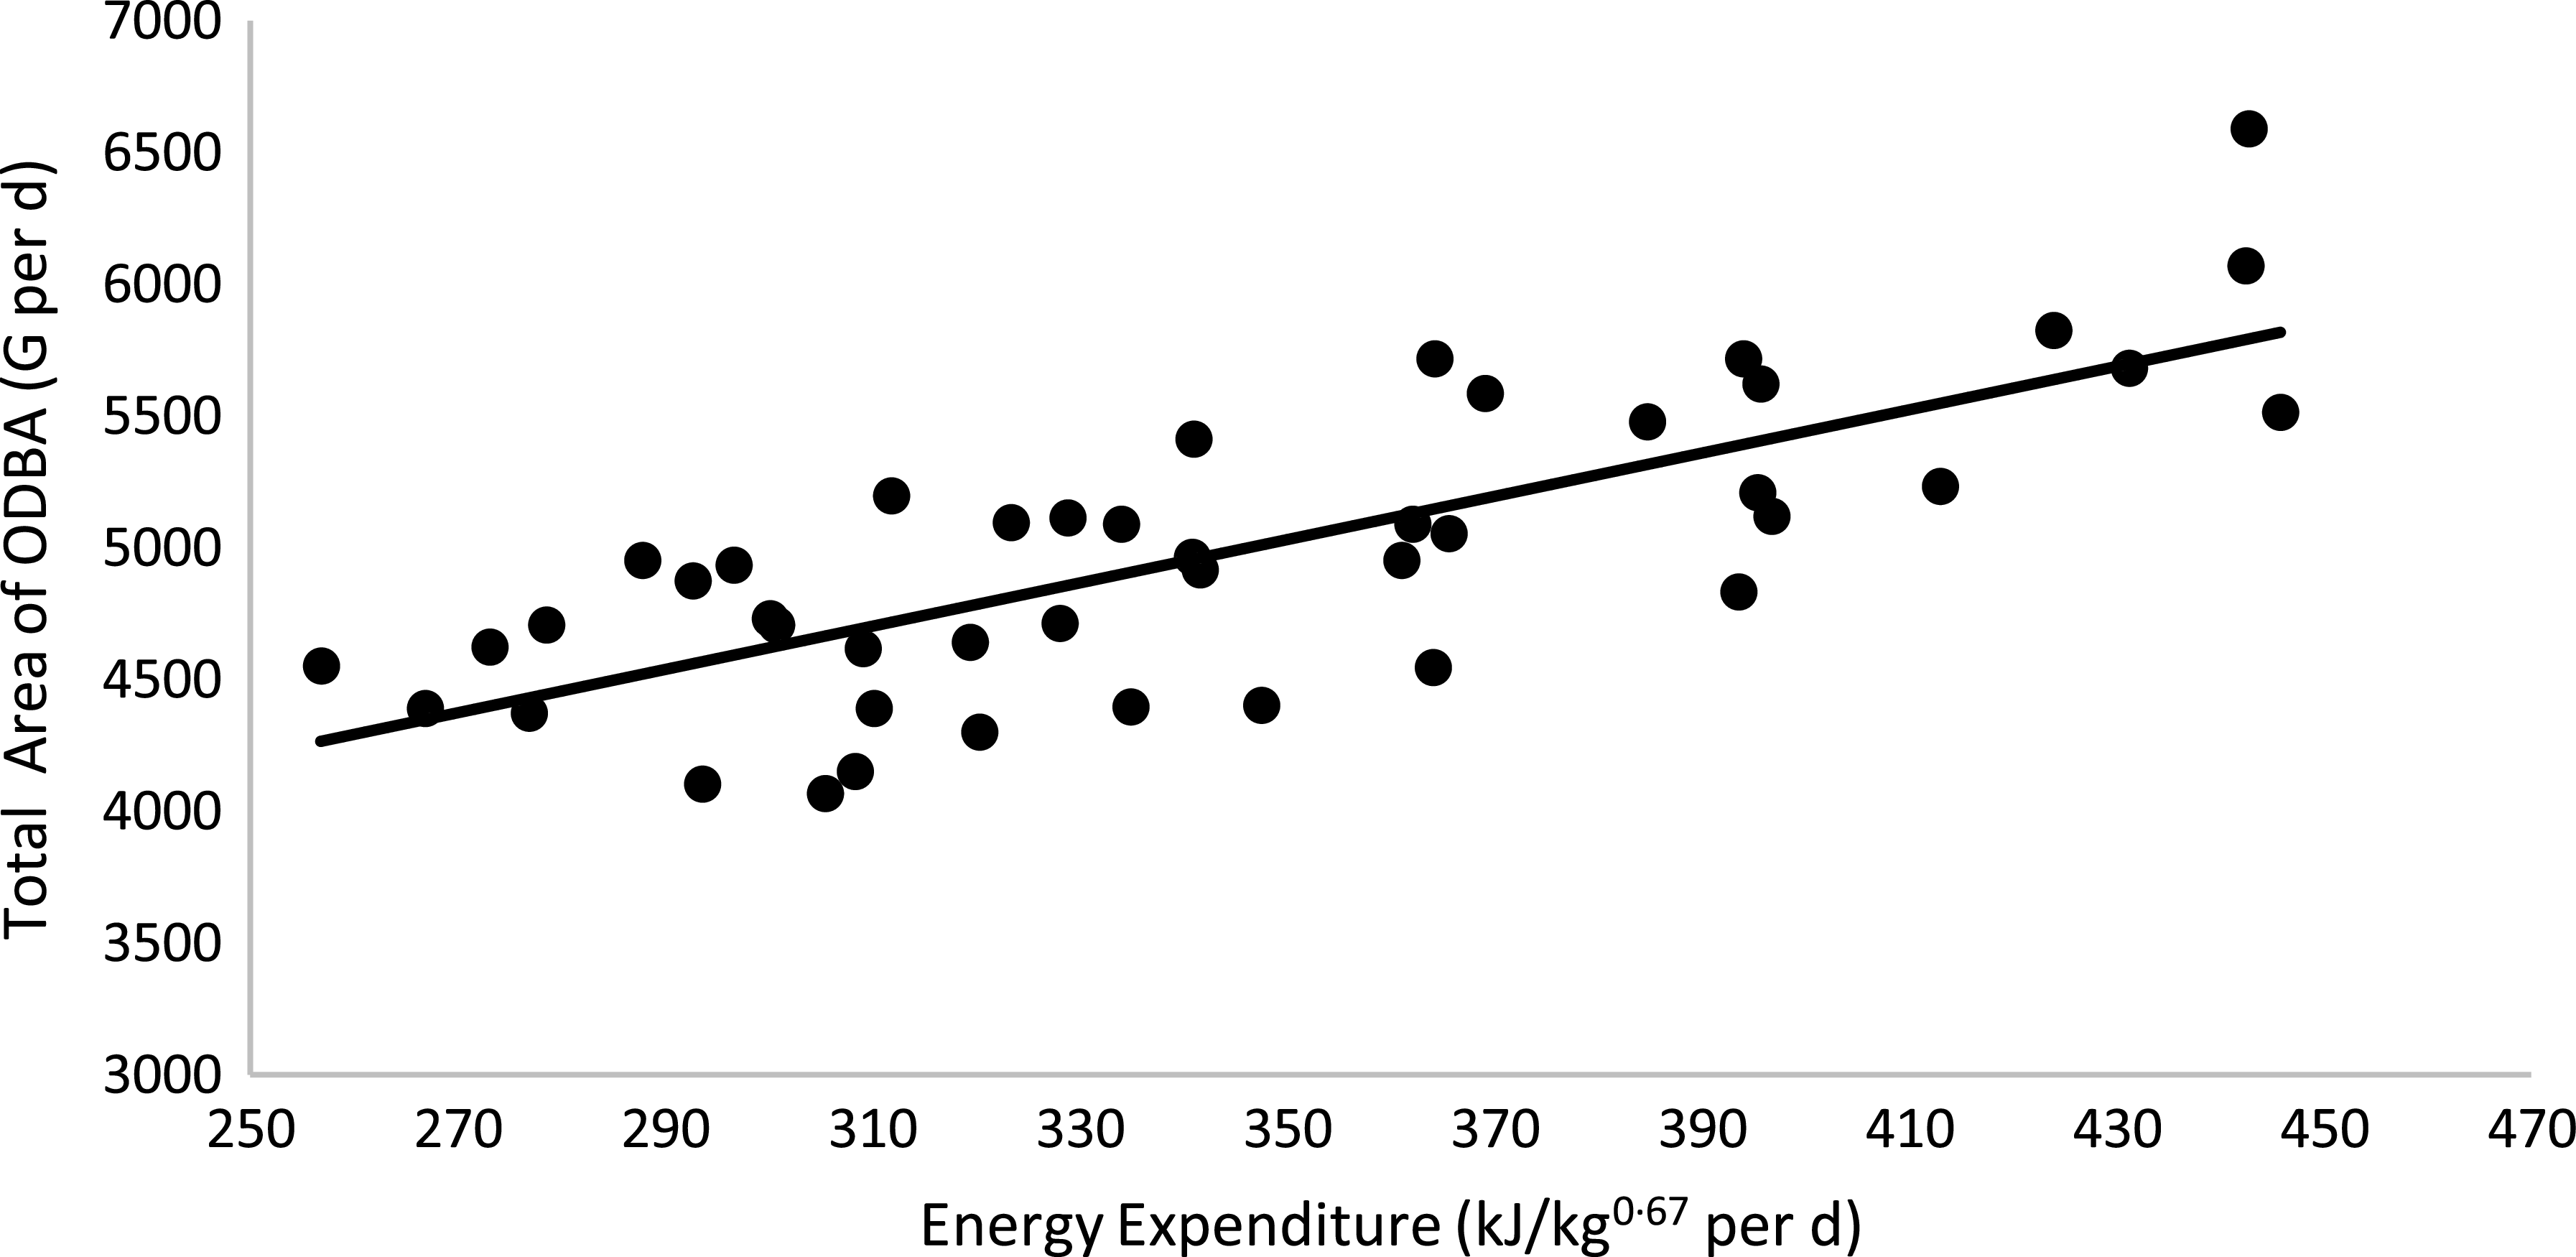
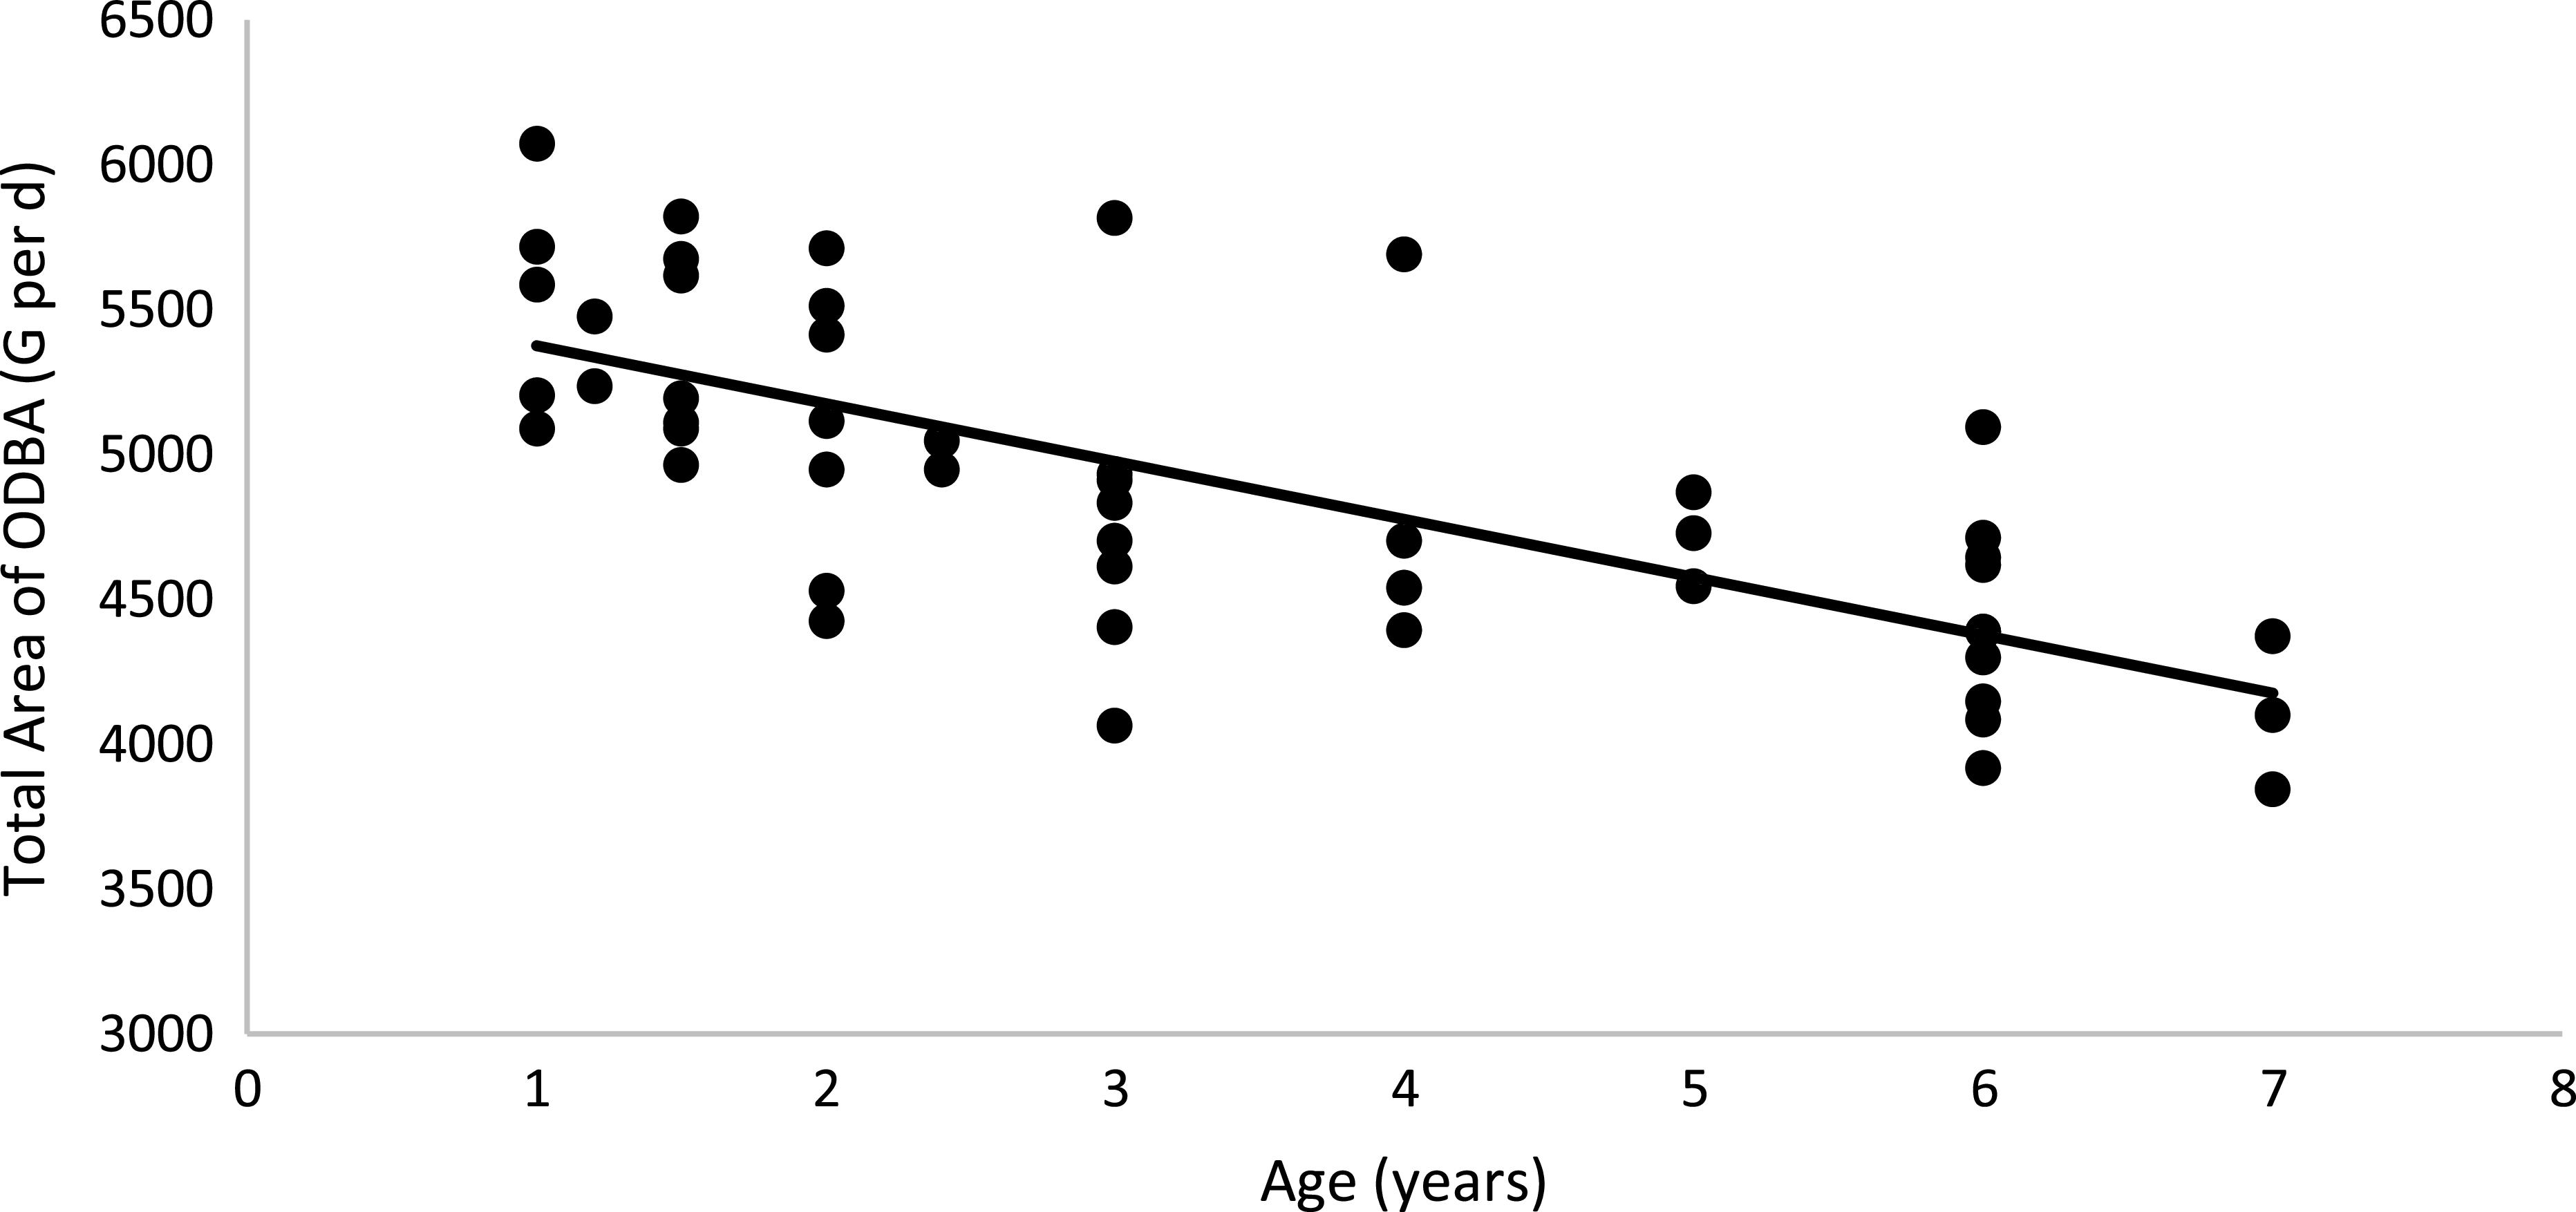
Physical activity parameters were not affected by body condition or sex (P > 0·05; Table 6). However, cats fed the HP (55 % CP) diet had a higher ODBA total peak area than cats fed the HS (38 % CP) diet (P < 0·05). A positive correlation between the total ODBA area (G per d) and EE was observed: total ODBA area (g) = 34·361 × (EE, kJ/kg0·67 per d) + 2156·2 (R 2 0·58; P < 0·01; n 44; Fig. 6). According to this equation, as the cat’s movement detected by the accelerometer increases, the EE of the animal increases. When computing age and total ODBA area, a negative correlation was observed: age (years) = –199·86 × (total ODBA area, g) + 5575·5 (R 2 0·51; P < 0·01; n 51; Fig. 7). According to this equation, as the cat’s age advances, the cat’s movement detected by the accelerometer decreases.
Physical activity parameters of client-owned neutered cats fed ad libitum for 4 months diets with different starch to protein ratios (Standard error of the means)

* female non-obese, n 9; female obese, n 7; male non-obese, n 9; male obese, n 5.
† P value: interactions diet, BC or sex not found (P > 0·05).
‡ BC, body condition.
§ ODBA, overall dynamic body acceleration.
Linear regression between energy expenditure v. total ODBA area: y = 8·2125x + 2156·2; R 2 0·58; P < 0·01; n 44. ODBA, overall dynamic body acceleration.
Linear regression between age v. total ODBA area: y = −199·86x + 5575·5; R 2 0·51; P < 0·01; n 51. ODBA, overall dynamic body acceleration.
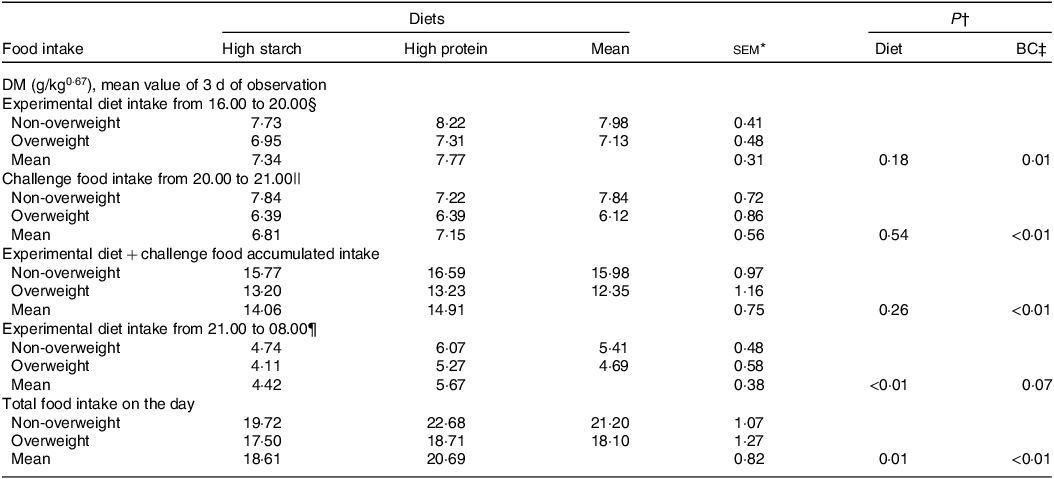
In the satiety evaluation in laboratory cats (Table 7), the combined results of the three evaluation days indicated similar intake without food effects during the initial 4 h of offering (16.00–20.00), similar intake of the challenge food and similar accumulated intake of the first offering of the experimental food plus the challenge diet (P > 0·05). However, in the second exposure to the experimental diets, cats fed the HP (55 % CP) diet showed a food intake 28 % higher than cats fed with the HS (38 % CP) diet (P < 0·01), resulting in higher total food intake (P = 0·03). A BC effect was also observed, with a lower food intake in overweight cats than in non-obese cats (P < 0·01).
Mean results of the three consecutive days of the satiety test in overweight and non-overweight laboratory cats after 30 d fed diets with different starch to protein ratios
* n 8 for overweight; n 8 for non-overweight.
† P value: interaction not found for diet × body composition (P > 0·05).
‡ BC, body composition.
§ First offering of the experimental diets, amount equivalent to 50 % of the average daily consumption verified throughout the study.
|| Challenge diet (Guabi Natural Gatos, Affinity Pet Care) offered in an ad libitum amount.
¶ Second offering of the experimental diets, amount equivalent to 50 % of the average daily consumption verified throughout the study.
Discussion
The results of the present study reinforced the ‘carbohydrate ceiling’ theory(Reference Hewson-Hughes, Hewson-Hughes and Miller7), as neutered and spayed cats living in homes were able to maintain a constant body weight when exposed to an unrestricted amount of the HS (38 % CP) formulation but gained body weight when fed the HP (55 % CP) food. The same had been previously documented by Coradini et al. (Reference Coradini, Rand and Morton12), when cats were fed ad libitum with 50·5 % of the energy derived from carbohydrates and kept stable body weight for 8 weeks. To interpret these results, it is important to consider that the HS (38 % CP) formulation had adequate protein (approximately 38 % of DM) for adult cat maintenance(56,57) despite presenting high starch, and that the ad libitum intake of the HS (38 % CP) formulation also improved the BC of the F-NO and M-NO groups, as these groups presented an increase in their LM percentage and reduction in their FM percentage. Interestingly, no changes in BC were observed between obese males and females after HS (38 % CP) intake. These results suggest that the amount of energy and nutrients voluntarily consumed when cats were fed the HS (38 % CP) diet was adequate, and the higher starch intake did not limit essential nutrient intake and supported better food management than the ad libitum offering of HP (55 % CP) food.
Overconsumption of food and energy when cats were fed ad libitum with the HP (55 % CP) formulation was supposed by the weight gain observed in all cat groups. If the cats ate a food amount equivalent to their EE, no changes in body weight were expected, but as they gained weight when fed the HP (55 % CP) diet, an excessive intake of food and energy is assumed. Regardless of the group, animals gained 245 g along the 4 months of the feeding trial, equivalent to almost 5 % of the initial body weight, and female obese cats had the highest gain of 310 g of body weight when ad libitum fed with the HP (55 % CP) diet, which is a considerable amount. In fact, food intake was not measured in the present study as cats were ad libitum fed by their owners, and food leftovers were always observed in the food bowls. Nutrient intake was only estimated, dividing the EE determined for each cat by the amount of metabolisable energy of each food, and this limitation need to be considered during data interpretation. In the studies by Wei et al. (Reference Wei, Fascetti and Liu9) and Coradini et al. (Reference Coradini, Rand and Morton12), the same pattern of response was described for cats fed ad libitum a diet with 47 % and 47·3 % of the available energy derived from CP, respectively. In the current study, this gain in body weight was characterised by an increase in LM in all groups but also by an increase in FM in obese and non-obese females. Interestingly, the FM in kilograms of males did not change, highlighting differences in energy metabolism and substrate utilisation between the sexes that should be further explored(Reference Fettman, Stanton and Banks22–Reference Goloni, Peres and Senhorello24). However, despite the increase in LM, there was no improvement in cat BC, as the LM percentage did not change for F-OB, M-NO and M-OB groups fed the HP (55 % CP) diet; however, the LM percentage decreased in the F-NO group when fed this treatment due to the increase in FM. These results do not support the hypothesis of BC improvement and better satiety in cats fed HP diets(Reference Nguyen, Leray and Dumon8,Reference Wei, Fascetti and Liu9,Reference Coradini, Rand and Morton12) and suggest the opposite. The hypothesis of an increase in EE with HP intake(Reference Green, Ramsey and Villaverde10,Reference Vasconcellos, Gonçalves and Borges23) was also not supported because diet did not affect this parameter.
This interventional study was successfully performed in cats living in homes. The strength of this approach is that it evaluates two diet formulations in a real-world situation, with a representative population of males or females and obese or non-obese cats fed ad libitum by their owners. Acceptance of the diets was adequate according to the owner’s perspective, and previous palatability comparisons using the two-bowl test did not reveal consistent differences among formulations. Considering the potential implications of diet palatability as a confounding factor, we chose a vegetable protein source (pea isolate protein) to replace starch in HP (55 % CP) food. Additionally, the fat content, energy density and mineral and vitamin supplementation of the foods were similar and did not interfere with the results. The dietary fibre content was higher for the HS (38 % CP) food, but the two diets can be considered low in fibre to expect a significant fibre effect on physiological responses and satiety(Reference Loureiro, Sakomura and Vasconcellos55). More importantly, the satiety effect induced by the two diets has been previously evaluated in a controlled setting in laboratory cats. It is interesting to note that the first intake of the experimental diets as well as of the challenge food consumption did not differ, but only the late intake (5 h after the meal) was higher when the cats were fed the HP (55 % CP) diet. If poor acceptance was the cause of lower HS (38 % CP) diet intake, cats should have compensated for this by eating more of the challenge food when fed the HS (38 % CP) diet; however, this was not observed.
The effects of starch or protein on food intake and satiety are incompletely known in cats. Even in humans, many controversies and gaps remain regarding the effects of diet macrocomposition on satiation and satiety(Reference Becetti, Bwenyi and De-Araujo58). In humans, the main factors that influence the duration of the postprandial period and the interruption of hunger are oxidative nutritional substrates, insulin, glucagon, amino acids and leptin(Reference Tremblay and Bellisle59). One theory also suggests that an organism’s carbohydrate stores, such as liver and muscle glycogen, are important for regulating the onset of food intake(Reference Flatt60), suggesting that the body’s regulatory functions attempt to maintain nutrient balance rather than energy balance. According to these theories, sustained blood glucose and insulin levels or higher glycogen body stores in cats fed the HS (38 % CP) diet might explain the lower late intake of food. In the present study, this effect can be considered consistent, as the HS (38 % CP) diet reduced food intake to a level that resulted in lower lipogenesis and higher protein synthesis (for non-obese privately owned animals) and also limited the late phase of food intake (5 h after the meal) in laboratory cats. Physiological or mechanistic explanations of the effects of starch intake, however, are not currently possible for cats, and future studies should include measurements of the hormones and metabolites potentially involved.
The use of a crossover design was also necessary to control parameters that could have an important influence on the results, mainly the house environment (house size, backyard, ambient diversity), owners and family attitudes towards feeding practices, interactions and playing with the cats, the presence of one or multiple pets(Reference Bermingham, Thomas and Morris19,Reference Grant, Shoveller and Blois61) and many other factors that can be adequately controlled in a laboratory, but not when using multiple houses. In accordance with the crossover design, all cats received both diets, and all sources of variation were adequately controlled by the experimental design, evidencing the diet effect. Another source of variation is the possible effect of environmental temperature and light cycle on the EE and physical activity patterns of cats(Reference Bermingham, Weidgraaf and Hekman26,Reference De-Godoy and Shoveller62,Reference Cline, Witzel and Moyers63) , which might have differed between the two crossover periods. Nevertheless, Brazil is a tropical country and the temperature during the experimental trial did not vary consistently (24·0 (sd 1·7)°C). Additionally, half of the cats were tested during each period, thereby diluting possible environmental effects.
Another difficulty and potential limitation of the study design was the reliance on cat owners to follow the protocol. This was mainly controlled by selecting owners who were already feeding their cats kibble diets with no or minimum amounts of snacks. One important advantage of the present study is the use of DLW to obtain EE, which is a well-established and reliable method for evaluating CO2 production and EE of animals under normal living conditions(Reference Bermingham, Weidgraaf and Hekman26,Reference Zanghi, Cupp and Pan45) . The precision of this approach was based on a previous publication that validated the enrichment and elimination sampling points and the saliva fluid to measure isotope enrichment in the body water of cats(Reference Goloni, Peres and Senhorello24). Therefore, not all data regarding EE depended on the owner’s information or attitude. However, excessive snack offerings could modify the nutrient composition of the diet consumed by cats, thereby affecting the results. This did not happen in the present study, as only some owners offered minor amounts of extra food, limited to less than 10 % of daily calories once a week, once every 2 weeks. Additionally, caution is necessary to interpret the food intake estimations based on EE and food metabolisable energy content. This approach is valid only when body weight is stable, what was the case when cats were fed the HS (38 % CP) diet. So for this diet, the estimations of food and nutrient intake might be considered reliable. However, when fed the HP (55 % CP) diet cats gained body weight, indicating a higher food and energy intake than the maintenance requirement, and as such estimations of food and nutrient intake are likely inaccurate.
It is important to note that the observed EE was lower than the value proposed for cats by NRC(57), which, depending on the cat category, overestimated energy requirements by approximately 22 % for F-OB and 15 % for M-NO, a significant amount. However, the observed values were close to those proposed by FEDIAF(56) for low-energy requirement domiciled cats (314 kJ kg0·67 per d). These results support the use of the nutrient recommendations of FEDIAF(56) to balance the prepared diets for neutered and spayed cats living in houses. A diet formulated in accordance with the daily allowance of the NRC(57) would result in lower food and nutrient intake than expected, limiting cat access to essential nutrients. This issue may be overlooked in the formulation of many products currently available on the market. Accurate knowledge of EE is necessary to predict food intake, which is a key point in establishing dietary nutrient concentrations(Reference Carciofi64). An example can be taken from the current study: although the CP content of the HS (38 % CP) diet was 38 % (on DM basis), some F-OB cats fed this diet ate less than 270 kJ/kg0·67 per d, and due to this their CP and phenylalanine + tyrosine intakes were low, resulting in the loss of 220 g of LM for the F-OB group during the study. This amount is equivalent to a loss of 5·7 % of their initial LM content. Furthermore, as the study was limited to 4 months, it is difficult to predict the health implications of this LM loss in the long term, reinforcing the importance of accurately knowing the energy and food intakes to define nutrient concentrations in the diets.
Among several factors that may interfere with EE, age, physical activity and sex were evaluated in this study. As cats age, EE decreases, as previously observed in other publications(Reference Kienzle, Edtstadtler-Pietsch and Rudnick20,Reference Laflamme and Gunn-Moore65) . However, most studies have been restricted to middle-aged adult animals, with little information available on elderly cats(Reference Wei, Fascetti and Liu9,Reference Bermingham, Thomas and Morris19,Reference Des-Courtis, Wei and Kass66) . According to the linear equation obtained in this study, each cat’s age induced a 17·97 (se 4·36) kJ/kg0·67 per d reduction in EE. Old cats were not included in the study population, which is an important limitation to be considered; however, if this is true and EE continues to decrease as cats age, this limited EE would result in low food intake in old animals. This might be an issue to consider in diet formulation, especially considering the reduction in protein and other nutrient digestibility with aging(Reference Teshima, Brunetto and Vasconcellos67), with possible implications for sarcopenia development, which is a relevant topic for older cats(Reference Laflamme and Gunn-Moore65,Reference Saker68) .
The BC of cats has been associated with EE in some publications, with lower EE in obese animals than in non-obese animals(Reference Hoenig, Thomaseth and Waldron18,Reference Vasconcellos, Gonçalves and Borges23,Reference Kanchuk, Backus and Calvert25) . Obesity development is also associated with age, as the obesity incidence in cats increases until 11 years of age and then starts to decrease(Reference Wall, Cave and Vallee28). In the present study, age was associated with both an increase in FM and a reduction in EE. However, when the effect of age on EE was removed and utilised as a covariate in the statistical analysis, no effect of BC on EE was observed in cats. Therefore, to understand the separate effects of age on FM and EE, it is necessary to study balanced populations of cats with different BC but of the same age and different ages but with the same BC.
The tendency for higher EE in males, whose mean value was approximately 20 kJ/kg0·67 per d (almost 6 %) higher than that of females, is probably associated with their higher LM in kilograms. Due to the high mitochondrial concentration, skeletal muscle is the LM component that contributes the most to EE(Reference Thes, Koeber and Fritz69). This is reinforced by the fact that EE was similar between sexes when computed per kilogram of LM and by the lack of difference in physical activity between males and females in the current study. Literature on the sex implications of EE is controversial in cats(Reference Bermingham, Thomas and Morris19). However, males showed an EE 14 % higher using the feeding trial method(Reference Vasconcellos, Gonçalves and Borges23) and an EE 12 % higher using the DLW method(Reference Goloni, Peres and Senhorello24) than that of females in previous publications, supporting the results of the current study.
Another parameter that affected EE was physical activity. The main issue with the method utilised is potential owner interference, holding, manipulating or stimulating movements of the cat during days with the accelerometers. This was controlled in the present study by clarifying that the owners did not interfere in the activity or manipulate their animals and by using a crossover design. The cat’s physical activity decreased as the animals became older, without any influence of body condition or sex. As discussed previously, as FM increased with age and age was used as a covariate in the statistical analysis, the lack of an effect of BC (FM) on physical activity needs to be evaluated with caution. A proper evaluation may require a more structured cat population. To the authors’ knowledge, few studies that have evaluated voluntary physical activity in cats(Reference De-Godoy and Shoveller62,Reference Deng, Iwazaki and Suchy70) explored the implications of age or diet, or correlated it with the EE of animals. Using the equation described in Fig. 6, if the physical activity of the cats was extrapolated to zero (mean total ODBA = zero), the estimated EE would be 262·5 (se 10·0) kJ/kg0·67 per d. Considering the general mean EE observed for all cats of 344·2 (se 39·16) kJ/kg0·67 per d, it is possible that voluntary physical activity, in the conditions of the present study and as it was measured with the 3-axyal accelerometers, corresponded to 81·7 (se 9·89) kJ/kg0·67 per d, equivalent to approximately 24 % of the daily EE of the cats. The authors were unable to find publications that quantified the EE during physical activity in cats to compare the present findings. However, this value is much lower than the EE with movements estimated for free-living mammals with less than 4 kg body weight (n 72) in their natural environment(Reference Speakman and Selman71), suggesting that the confinement and imposed reduction in physical activity in the domesticated environment might have a profound impact on EE and food and nutrient intake, warranting future investigations.
Interestingly, HP consumption increased the ODBA peak area. These data open an entire avenue of research to explore the implications of sex, reproductive condition, BC, age, diet, environment, housing condition and many other parameters on cats’ physical activity and its consequences on EE, body LM content and food and nutrient intake. Additionally, the combined use of accelerometers and DLW opens up opportunities to explore the implications of strategies to increase physical exercise on EE and food intake, such as playing, and the use of devices to improve voluntary physical activity. Such studies are relevant to substantiating strategies of management and feeding that might help control the development of obesity, insulin resistance, sarcopenia and many other conditions related to health and longevity(Reference Saker68,Reference Slingerland, Fazilova and Plantinga72–Reference Cederholm and Morley74) .
The DLW method also allows for the determination of WT, an important parameter that has not been thoroughly studied in cats, especially considering housing, sex and diet influences(Reference Hendriks, Wamberg and Tarttelin54,Reference Ballevre, Anantharaman-barr and Gicquello75) . The observed results were similar to those reported for laboratory cats using the DLW method(Reference Goloni, Peres and Senhorello24,Reference Ballevre, Anantharaman-barr and Gicquello75) , and 2H oxide(Reference Garcia, Loureiro and Peres4). In the current study, only sex did not influence WT, which was greater for non-obese than obese cats and greater for cats fed the HP (55 % CP) diet than those fed the HS (38 % CP) diet. The observed effect of obesity was significant, with a WT approximately 12·3 (se 1·75) ml/kg0·67 per d lower in obese animals than in non-obese animals, which was a reduction of 22 %. Several implications may arise from this lower WT, especially in terms of urinary tract health. This was reinforced by a study that described a 4·36-fold higher incidence of upper urinary tract conditions in cats with a BCS of 8 or 9 than in cats with a BCS of 5(Reference Teng, McGreevy and Toribio76). The authors mostly imputed this predisposition due to chronic low-grade systemic inflammation in obese cats, induced by pro-inflammatory adipokines such as IL-6 and TNFα, predisposing obese animals to develop nephritis. However, water intake and urine volume or other characteristics were not evaluated. Health conditions associated with the lower urinary tract are also more prevalent in obese cats than in non-obese cats(Reference Teng, McGreevy and Toribio76,Reference Palm and Westropp77) . The lower WT observed in the current study in obese cats might have resulted in a higher kidney demand to excrete catabolic end-products and may have induced the production of a lower volume of more concentrated urine. Although urine parameters were not evaluated in the present study, low WT may be a contributing factor to the higher incidence of urolithiasis and other forms of urinary tract disorders reported in obese cats. Studies to confirm this observation and characterise the produced urine, including the assessment of relative supersaturation, would be interesting to better understand the implications of obesity on the water metabolism and urinary tract health of cats.
As observed in the present study, other studies have shown that protein intake induces renal water excretion and diuresis in cats(Reference Garcia, Loureiro and Peres4,Reference Hashimoto, Funaba and Abe78) , due to elevated urea production, which increases the tonicity of the glomerular filtrate(Reference Pablack, Burmeier and Brenten79,Reference Mendonça, Pedreira and Loureiro80) . The protein effect on WT differed, however, according to cat body condition; for non-obese cats, the HP (55 % CP) diet intake resulted in a WT 8·1 (se 2·1) ml/kg0·67 per d (13·6 %) higher, but obese cats had a WT only 4·2 (se 2·6) ml/kg0·67 per d (9·3 %) higher than for the cats fed the HS (38 % CP) diet. This increase in WT induced by HP intake warrants future investigation regarding its potential role in urolithiasis prevention, especially considering that in addition to increasing urine volume, HP consumption reduces the urine concentration of oxalate(Reference Mendonça, Pedreira and Loureiro80) but may increase Ca renal excretion(Reference Pablack, Burmeier and Brenten79).
Conclusion
In an ad libitum feeding system, the intake of a kibble diet with 38 % CP and 32 % starch favoured better control of the cat’s body weight, which remained constant along the four study months, whereas cats fed a diet with 55 % CP and 19 % starch gained body weight. Differences in body conditions were observed, as the non-obese cats (males and females) had reduced FM percentage and increased LM in kilograms, but not obese cats fed a HS diet. The ad libitum intake of the HP diet increased body weight, LM in kilograms, physical activity and WT in all groups, and FM in kilograms in females, but did not increase EE or the LM percentage in any group. Daily EE tended to be higher in males, who also presented a higher LM. A reduction in EE was observed as the age increased. EE was positively correlated with WT and physical activity. Caution is necessary to balance protein content in the diets of obese females over 5 years of age, as this population may have low EE, limiting food and amino acid intake and resulting in LM loss.
Acknowledgements
The authors would like to thank Mass Spectrometry Laboratory of the Ribeirão Preto Medical School, São Paulo, Brazil and Manzoni Industrial Ltda for their support.
This work was financially supported by Coordenação de Aperfeiçoamento de Pessoal de Nível Superior (Capes) and Affinity PetCare Spain, I. C. J. and C. T.
None of the authors has any conflicts of interest.